Article

Assessing Peri-Urbanisation and Urban Transitions between 2010 and 2020 in Ho Chi Minh City using an Urban Structure Type Approach

1
College of Environment and Natural Resources, Can Tho University, Can Tho 92000, Vietnam
2
Independent Researcher, 10781 Berlin, Germany
3
Deutsche Gesellschaft für Internationale Zusammenarbeit (GIZ) GmbH, Can Tho 92000, Vietnam
4
Sub-National Institute of Agricultural Planning and Projection (Sub-NIAPP), Ho Chi Minh City 70000, Vietnam
*
Author to whom correspondence should be addressed.
Urban Sci. 2024, 8(1), 11; https://doi.org/10.3390/urbansci8010011
Submission received: 4 December 2023 / Revised: 11 January 2024 / Accepted: 16 January 2024 / Published: 1 February 2024

Abstract

:
This paper contributes to the understanding of the recent urban development of Ho Chi Minh City, Vietnam. Previous studies have aimed at quantifying the city’s spatial growth yet have disregarded its inherent morphological and socio-economic heterogeneity. To overcome this knowledge gap, we employ an urban structure type approach for the spatially explicit quantification of urbanisation patterns for the period 2010–⁠2020, categorising 77,000 blocks across the entire administrative area of 2095 km2. The approach allows us to understand the basic underlying processes of urbanisation, both quantitatively and qualitatively, and the main growth corridors along the rural–urban gradient. By contextualizing and combining our findings within current literature and official planning reports, we discern between traditional urban growth and the contemporary new town development patterns, highlighting their driving forces and policy implications. Incremental plot-by-plot development along the northwest development corridor is observed as the principal mode of urban development, whilst bypass urbanisation is seen along both the eastern and southern development corridors. Our block-based results highlight the city’s key growth challenges and provide insights on a scale that is meaningful for official spatial and infrastructure planning, and periodic analysis and monitoring. As far as the authors are aware, this is the first time that an urban structure type approach was applied to understand the rapid urban growth dynamics of an emerging megacity in Southeast Asia.

1. Introduction

Vietnam has experienced dramatic and profound urban development as part of its wider socioeconomic transformation since the end of the 1980s [1,2,3,4,5,6,7,8,9]. Official statistics suggest that the proportion of its residents living in urban areas increased from 20% in 1990 to nearly 40% in the year 2020 [10]. However, this figure remains still far below the regional average, and is lower than the one outlined in the recent policy documents, including the National Socioeconomic Development Strategy 2011–2020 and Resolution No. 06-NQ/TW on the planning, construction, management and sustainable development of urban areas in Vietnam until 2030, with a vision towards 2045, suggesting that continued urbanisation is inevitable [11,12,13,14].
An increasing swell of academic discourse and international agendas including the United Nations’ Sustainable Development Goals (SDGs), the Sendai agreement on Disaster Risk Reduction, the New Urban Agenda of Habitat III, and the Paris Climate Change Agreement all recognize cities and their built environments as critical elements in the transition towards sustainability and resilience building [15,16]. While it is well understood that the process of urbanisation results in profound changes to the size, density, and heterogeneity of settlements and functional land uses, much less is known about the finer-scale variations in the urban form and their environmental and socioeconomic implications [17,18,19,20,21,22,23,24,25,26,27].
Planners and policymakers alike, increasingly need to understand the spatiotemporal evolution of cities within the wider policy discourse on sustainable urban development to design appropriate planning frameworks [28,29,30,31,32]. However, the pace and magnitude of change in both urban and peri-urban spaces mean that Vietnam faces formidable challenges to monitor its changing settlement patterns and produce reliable datasets for policy development and appropriate planning actions. The result is that urbanisation has often outpaced the urban planning processes, creating unsustainable settlement patterns that replace or pressure ecosystem services, fail to provide adequate infrastructure, and expose populations and assets to additional risks [33,34,35,36,37,38,39,40].
Ho Chi Minh City (10°49′ N, 106°37′ E) (until 1975 Saigon)—henceforth HCMC—is Vietnam’s most populous city, and an important port city for the Southeast Asia and Asia-Pacific regions [41]. The city is home to an official population of just over 9 million residents, representing 9.1% of the national population [42]. Estimates suggest that the number is most likely under-reported and closer to 13 million when unregistered floating migrant workers and daily commuters from adjacent provinces are included. Projections show that the city’s population will grow to over 12 million residents by 2030 [42].
With an overall administrative area of around 2095 km2 (0.6% of Vietnam’s total land area), HCMC is Vietnam’s economic powerhouse, and a hotspot for direct foreign investment creating 24.8% of the national GDP in 2020, with GDP per capital increasing from USD 2800 in 2010 to USD 6328 in 2020 [42]. High economic growth over the recent three decades has resulted in rapid urbanisation, industrialisation, and socio-economic transformations [43,44,45]. Alongside economic growth, the city has gained political and administrative importance, with its population more than doubling since 1990, and growing by 24.7% in the decade 2010–2020 [42]. Figure 1 highlights the city’s location in the Dong Nai-Sai Gon River system. Due to its geography, topography, and urban growth trajectory, several previous studies have identified the city as one of the most exposed to multiple climate-related hazards [38,46,47,48,49,50,51,52,53,54,55].
Table 1 shows that HCMC is subdivided into 22 districts, of which 5 are rural, 16 urban or suburban districts, and 1 city, Thu Duc City, which is a consolidation of the former districts of 2, 9, and Thu Duc. This new city is designated as a municipal city, commonly termed a city within a city under HCMC (Thành phố thuộc thành phố trực thuộc trung ương). A new type of second-level administrative unit in Vietnam, equivalent to a district, town, and provincial city. Previously centrally run cities such as HCMC only included the administrative units of urban districts (quận) subdivided into wards (phường), with rural districts subdivided into communes () and townships (thị trấn). In response, to accommodate the growing population, the city has reshaped its form and rapidly expanded, suburbanising industries and populations as well as constructing infrastructure, resulting in reduced green space, encroachment of fertile cropland and low-lying marshland, and an increased extent of sealed surfaces [56,57,58,59]. Xu et al. (2019) reported that the urban built-up area of Greater HCMC increased over 10-fold from a mere 5500 ha in 1990 to 63,500 ha by the year 2013 [30]. Hence, rapid urbanisation and population growth have become formidable urban planning challenges for the city [60]. While at a regional scale, it has reverberated in increased demand for sand for construction and infill projects [61].
During the French colonisation in the mid-19th century, grid-like urban block planning and the structuring of broad city avenues was established via three consecutive master plans, all of which had a profound and lasting legacy on the city layout. In 1862, the French engineer—Colonel Lucien Florent Paul Coffyn—devised an entirely new city that implemented the use of European-style blocks, in his plan entitled “Projet de Ville de 500,000 ames à Saigon” (city project of 500,000 people in Saigon) [34]. With the purpose to sell land, the plan delineated urban blocks with a grid-like perimeter in districts 1 and 3, and part of district 5, and then Cho Lon. After the city became the governing capital of the entire Indochina Peninsula in 1887, investments increased, and Ernest Hébrard and Cerutti proposed two further master plans in 1923 and 1942, respectively [34,62]. These two plans sought to transition away from the former grid road network planning and towards the placement of alleys within blocks at regular intervals for a greater accessibility to block interiors. This resulted in the development of very intricate alleyway designs for block interiors and an increase in the number of both alleyways (hẻm) and urban blocks (see Figure 2).
HCMC has updated and adjusted its Construction Master Plans and Land Use Plans every five years since the early 1990s. Yet, over time, noticeable shifts in the planned development directions can be observed. The 1993 Master Plan directed growth to the northeast, with secondary growth corridors to the south and the northwest [63]. The 2010 Master Plan foresaw development in two primary growth corridors, towards the sea: to the east towards Thu Thien New Urban Area and to the south towards Phu My Hung Urban Area in District 7. The plan also contained two secondary growth corridors, to the northwest and southwest.
The incurrent Construction Master Plan through to the year 2025, with a long-term vision for 2050, envisioned a centralised and multipolar model for urban development [64]. The aim was to balance the spatial development and steer HCMC in a polycentric manner with the expansion, creating satellite urban regions which would include high-density mixed-use developments, while reducing the existing density of the urban core area and increasing the connectively to surrounding provinces at some stage. The plan designated specific directions for the future along new transport routes that should be implemented.
The most recent Construction Master Plan for HCMC through to the year 2040, with a vision to 2060, approved in 2021, aimed to limit the city’s population to between 13 and 14 million by the year 2040, and to 16 million by the year 2060, and to move all manufacturing industries to either industrial zones or neighbouring provinces [65]. The plan also earmarks the extent of built-up land to between 100,000 and 110,000 ha by the year 2040 [65].
Vietnam has been long recognized as a country of self-built single-family residential structures [66,67,68,69,70]. Until the enactment of the 1993 Land Law, commercial real estate development projects were formerly prohibited, and self-built development dominated the residential sector [63]. This led initially to rapid (tự phát) spontaneous urban expansion, and inner-city urban densification [44,66], whilst cropland and rural areas have also been converted into high-density residential areas through non-formal practices (phân lô, tách thửa) [71,72]. The government actively promoted the self-build sector to address affordable housing shortages. This was shown as recently as 2012 with Decree No. 64/2012/ND-CP, which provided exemptions for small-scale building construction permits [73].
From 1993 onwards, new residential developments, such as site and services and land subdivision projects, were gradually realised in the city. These offered merely subdivided land parcels with basic infrastructure connections, upon which buyers would privately build shophouse archetypes. This trend continued well into the 2000s with terraced shophouses still dominating. Downes et al. (2016) showed that shophouse archetypes, also often referred to as row- or tube-houses in the literature, and commonly termed nhà ống in Vietnamese, are the predominant residential structures in HCMC, making up over 95% of the building stock in 2010 [44]. Inspired by the local vermicular architectural customs and policies that incentivized households to pay property tax based on the width of the first floor, rather than the total area, shophouse archetypes are usually located in a rectangular plot which is much longer than it is wide, typically ranging from 3 to 5 m in breadth and 12–20 m in length [74,75,76,77]. With the narrow side, fronting a street or alleyway, the term “shophouse” originated as whole or part of the building’s ground floor is typically reserved for retail or office space. Consequently, the “shop” offers space for economic activity while the “house”, the living quarters, is situated at the rear or upstairs. The single-family architectural style is well suited to occupants’ needs and allows them to live and run small businesses in the same area. The narrow frontages allow for high population densities and concentrated commercial activities. The archetype itself is remarkably adaptive, allowing for incremental change over time to reflect the shifting needs and economic abilities of the occupant. Typically, three to five storeys tall, they can reach up to nine; whilst, contingent on their locations, commercial activities may encompass hotels in the inner city to residential housing and workshops in the urban periphery (Figure 3).
From the end of the Vietnam War (termed the American War in Vietnam), HCMC has undergone 7 periods of dividing and merging administrative units. In 1997, five new urban districts were established from the existing peri-urban and rural districts. The city created Districts 2, 7, 9, 12, and Duc on the basis of the partial division of Thu Duc, Nha Be, and Hoc Mon. In 2003, Tan Phu district, separated from Tan Binh district, and Binh Tan separated from Binh Chanh district, were established as urban districts. One noteworthy phenomenon was the emergence of New Urban Areas (khu đô thị mới), and the beginning of private sector participation in real estate development [78]. Thereafter, private real estate developers, with increasing FDI inflows, have increasingly focused on luxury housing developments, high-end apartments, villas, and modern shophouses (Figure 4).
Against this context, a desire to address a critical knowledge gap in understanding the recent urbanisation of HCMC at fine spatial resolutions motivated our work. Specifically, we explored the application of an urban structure type classification to quantify the spatially explicit and temporal heterogeneous patterns of urbanisation and to discern the major urban development processes during the 10-year period, 2010–2020, in HCMC. Where possible, we explain the driving forces of observed changes and their policy implications.

2. Methods Section

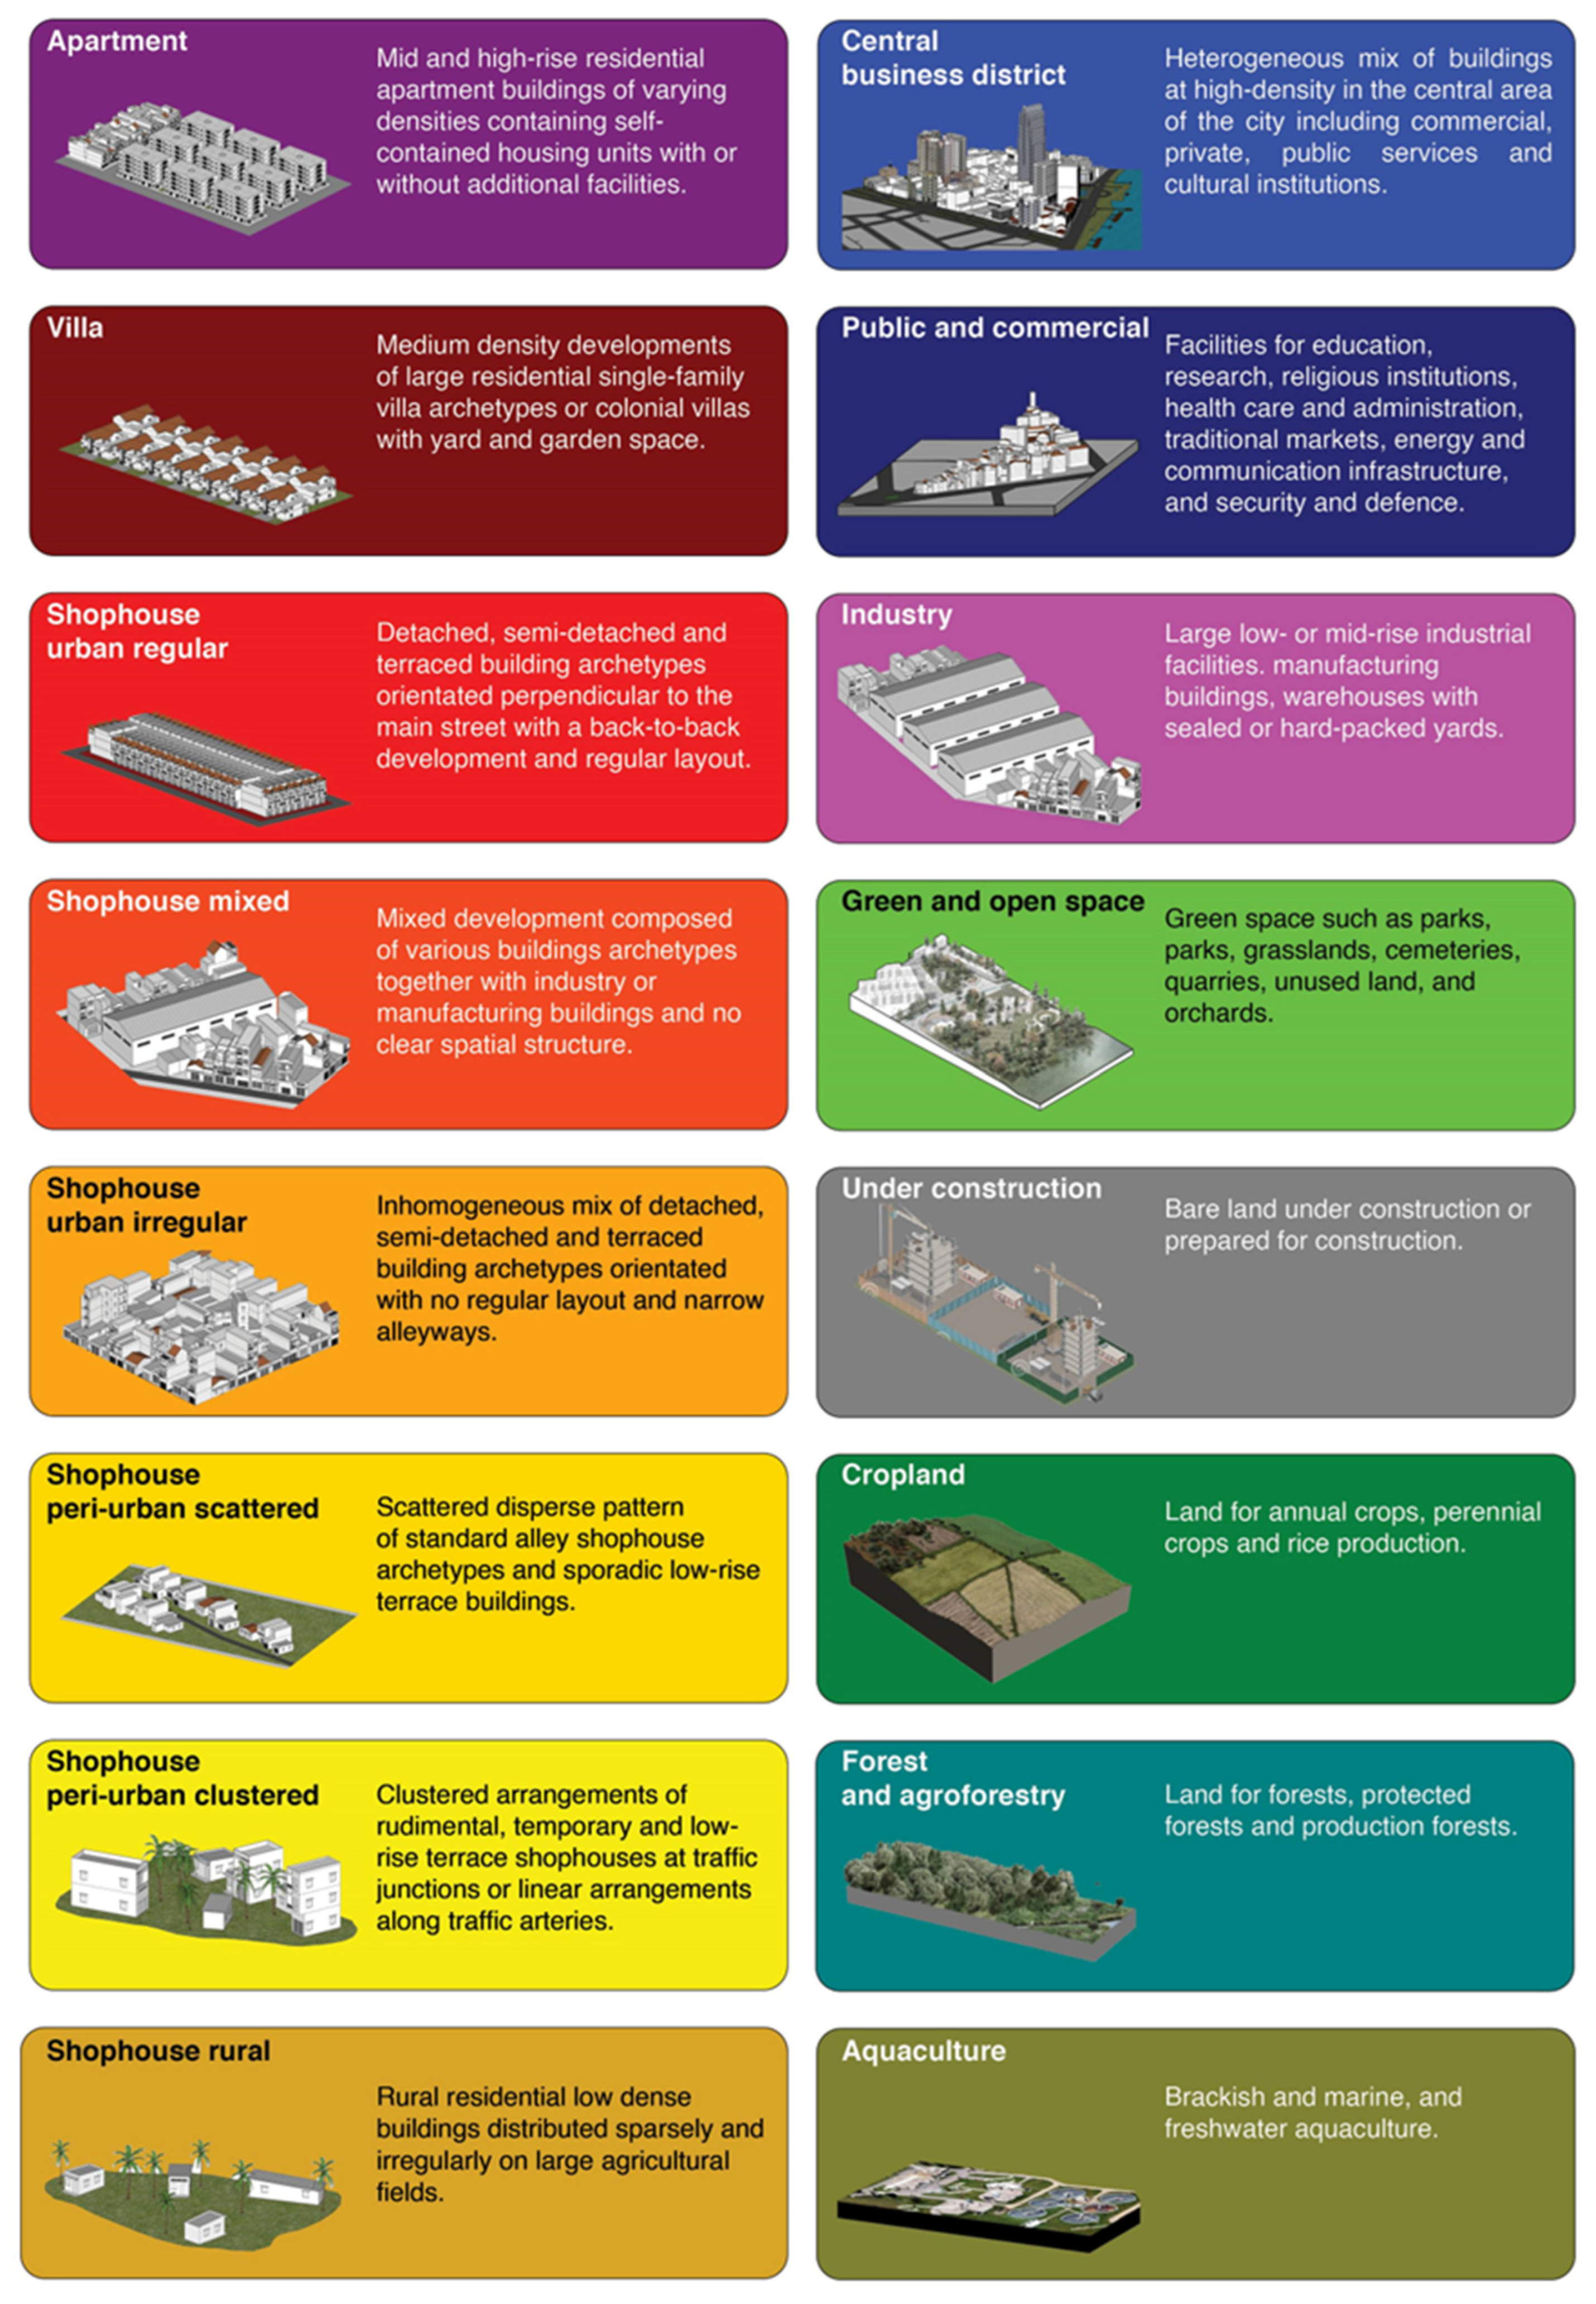
2.1. Mapping Urban Structures

We undertake a two-date change detection study to map and discern the main changes in HCMC’s urban structure types (USTs) for the 10-year period of 2010–2020 at the cadastral block level. These blocks represent the smallest and most functional administrative units employed for top-down normative land use and construction master planning. Blocks either consist of individual land parcels or a collection of several parcels, which differ in size and function. Typically, the outer road network acts as the perimeter around each block and provides the contextual frame.
In a previous study regarding the year 2010, Downes et al. (2016) classified 80 individual USTs to the 16,292 polygons of the city’s official land use map of 2010 [44]. Building upon these results, we classified USTs for the year 2020 and assigned them to the 77,476 polygons of the most recent official adjusted land use plan for HCMC for the year 2020, which was approved in 2018 (80/NQ-CP 2018) [79]. Each polygon within this plan was already designated a planned land use type.
Using the same classification scheme and visual interpretation procedure described by Downes et al. (2016), we classified the blocks according to both physical character and functional use [80]. The classification was developed based on previous housing categorisations undertaken by [67,81,82] as well as the official Census of Vietnam categories. However, to investigate the diverse urban transitions at the block level, the classification was extended to reflect dominant building archetypes, construction materials, geometry, perceived built density, and spatial configurations, i.e., level of planning.
Moreover, instead of commercially available satellite data, we employed free publicly available high-resolution images from the Google Earth tool to undertake visual analysis and the manual mapping of each block. This allowed for the spectral information of individual blocks to be viewed with additional contextual information. For change detection, we additionally overlapped the 2010 results to the new geometry to avoid the modifiable areal unit problem as the geometry of certain planning blocks had changed. To ensure classification consistency and accuracy, we organised an efficient team to work on the data. While manually interpreting the remote sensing images for the year 2020, the research team referred to the official land use plans as a supplement, and additionally undertook expert interviews and local site investigations for ground observation and validation. Figure 5 shows the compiled map of USTs for the year 2020. The mapped area covered 153,957 ha, which equates to 73.4% of the surface area of HCMC. This excluded the surface area of water bodies (rivers, canals), existing road networks, and land reserved for proposed transport planning projects and road widening.

2.2. Applying the Urban Structure Type Approach for Clustering Districts according to Their Different Development Patterns in the Period 2010–2020

We understand the classified USTs at the urban block level as the individual spatial entities that define the functional spatial configuration of the HCMC urban region. Against the background, we attempt to identify parallels and differences between the urban configurations and development patterns in both 2010 and 2020, respectively, using the initial step two indicators: The spatial proportion of USTs in each year and the spatial share of UST change between 2010 and 2020. To present and communicate both indicators, we employ alluvial flow charts.
In the second step, we focus solely on the residential USTs, using waffle charts to present their spatial proportions in both 2010 and 2020. By utilising official population data for the two years, we additionally calculate four key indicators: the residential land consumption growth rate (RLCR); the net residential density, by projecting the population data purely to the residential area of each district; the residential population growth rate (RPGR); and finally the ratio of RLCR to RPGR as an indicator to describe more sprawling or more compact density development pathways [83].
In the third step, we apply the above-mentioned calculated indicators to identify various intra-urban clusters with similar shares of USTs in 2010, and similar spatial development patterns over the assessment period 2010–2020. To begin the process of defining intra-urban clusters, initially we have to define the urban core cluster of districts. According to the calculated indicators we defined the urban core cluster of comprising 14 districts (districts, 1, 2, 3, 4, 5, 6, 8, 10, 11, Tan Binh, Tan Phu, Phu Nhuan, Binh Thanh, and Go Vap), primarily on the basis of their relatively stagnant development patterns in terms of population growth rate (both density and absolute) of only 7%, and the growth rate of residential land of only 7%, in contrast to that of the remaining districts. This urban core cluster contained around 4 million people, roughly half of the city’s population in 2020 on a block size area of only 100 km2, at an extremely high and steady net residential population density of around 65,000 people per km2.
In the fourth step, we aim to group the remaining districts upon the premise of recognised general principles of hierarchical order to the urban development patterns, starting from the defined urban core outwards to the urban periphery. Typically, urban development directions are related to basic topographic and natural conditions that result in barriers for particular types of developments and influence their spatial development direction. For the urban region in a low-lying coastal area, northeast of the Mekong Delta, the topographic elevation is crucially important. Additionally, the Saigon River and Dong Nai River both create important natural barriers separating HCMC into western and eastern parts, respectively, whilst the protected Can Gio mangrove biosphere reserve listed by UNESCO also influences the development southwards.
For grouping the remaining districts, we firstly try to apply a very basic monocentric city model understanding that enables us to investigate the basic assumption of decreasing densities with increased distance from the urban core cluster, based on common UST changes. Based on the basic assumption of the monocentric urban model, we were able to detect an archetypical development direction in a northwest direction from the formerly classified urban core to the rural peripheral administrative border. Starting at the border of the urban core, we could generate the following clusters: an inner arc containing two districts (Binh Tan and District 12), an outer arc containing two districts (Hoc Mon and Binh Chanh districts), and a rural arc represented by Cu Chi district. Along this development corridor, the increasing densification gradient from the rural to the urban core is predominantly reflected in the hierarchical densification of our classified shophouse-based USTs from rural to peri-urban and from peri-urban to urban shophouse-based UST classes. We can describe this incremental development pattern best as archetypical plot-by-plot or as plotting urbanisation, and as an outcome of the traditional strategy in Vietnam to provide housing during periods of rapid urban growth and immigration.
In our final fifth step, we try to cluster the remaining districts in the southern development and eastern development directions from the urban core. The observed development characteristics of these districts are not in accordance with the basic assumptions of the monocentric urban development model. The residential UST patterns are significantly different compared to the previous clustered districts with a higher share of ‘modern’ UST types like apartments, villas, and modern (site and services schemes-based) urban shophouse structures. Additionally, they exhibit a higher share of public, commercial, and industrial USTs related to their overall built-up structure. It is obvious that these developments are based on a comprehensive detailed masterplan at a district level. Drawing from their varying development status and spatial orientation, we have categorised District 7 and Na Be district within the southern development direction zone, while Thu Duc district and Districts 2 and 9 fall under the eastern development direction. We classified both these development patterns as bypass urbanisation, which aims to add two new urban centres to the existing dominant monocentric urban core.

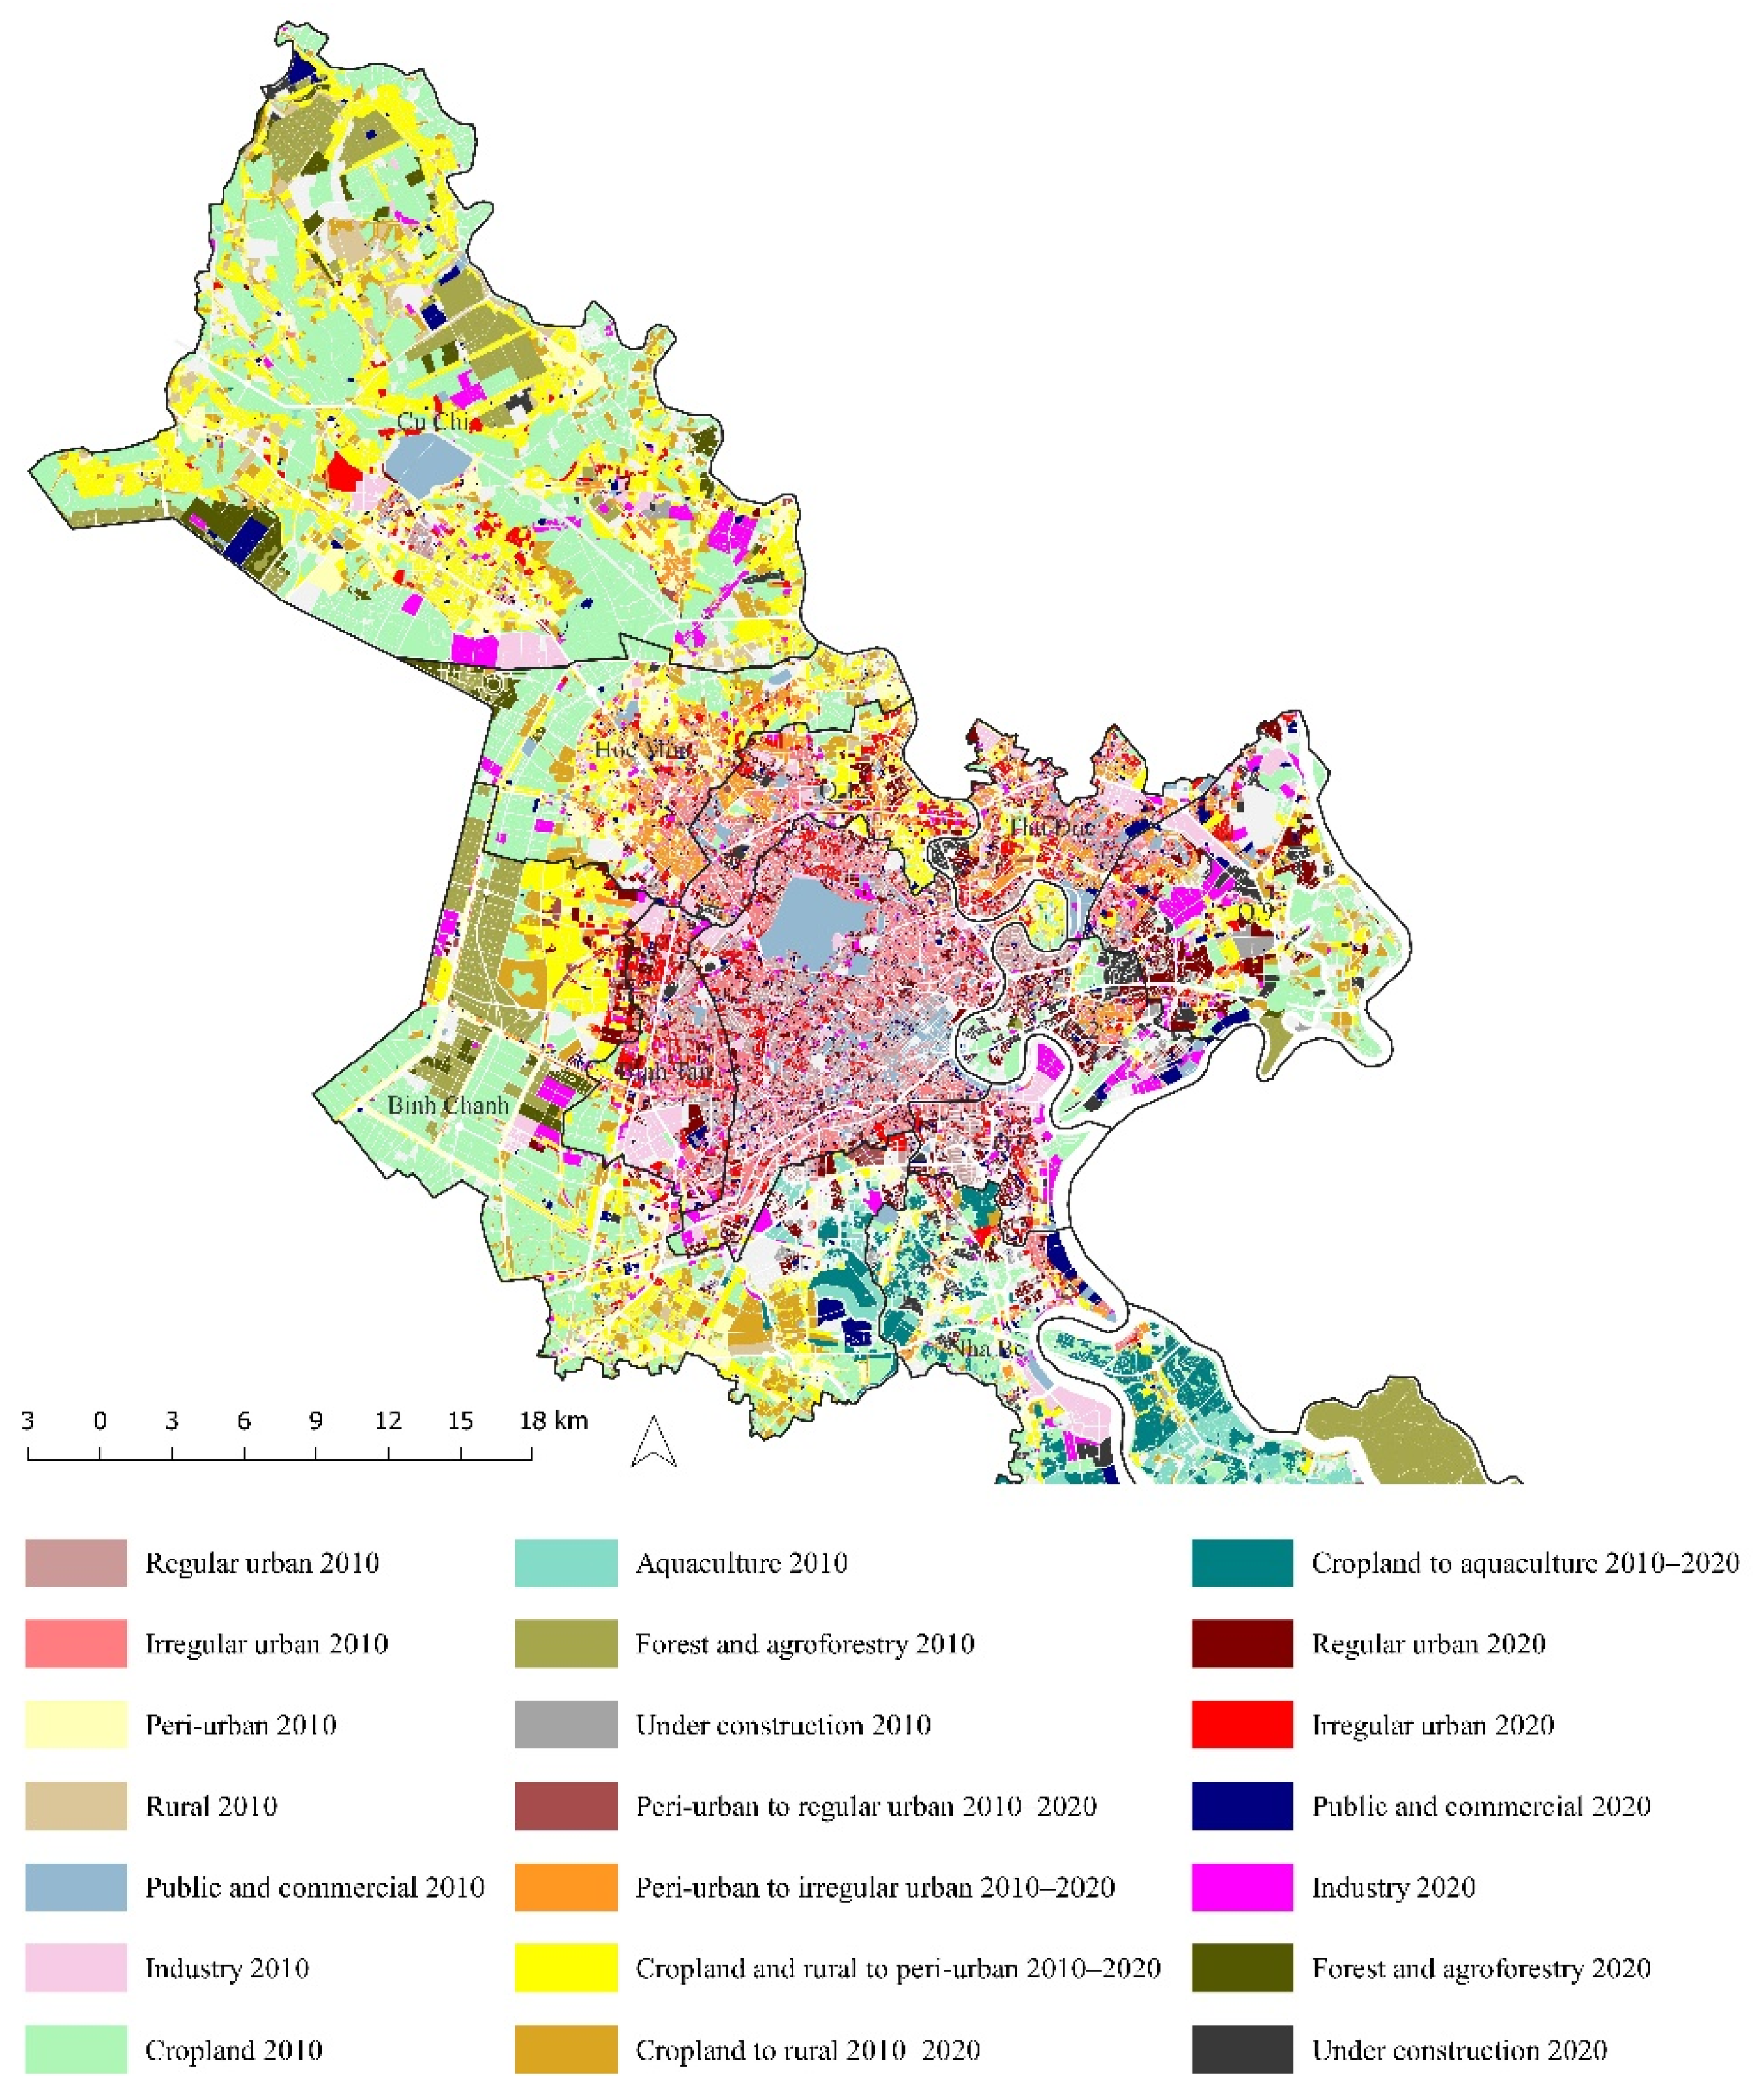
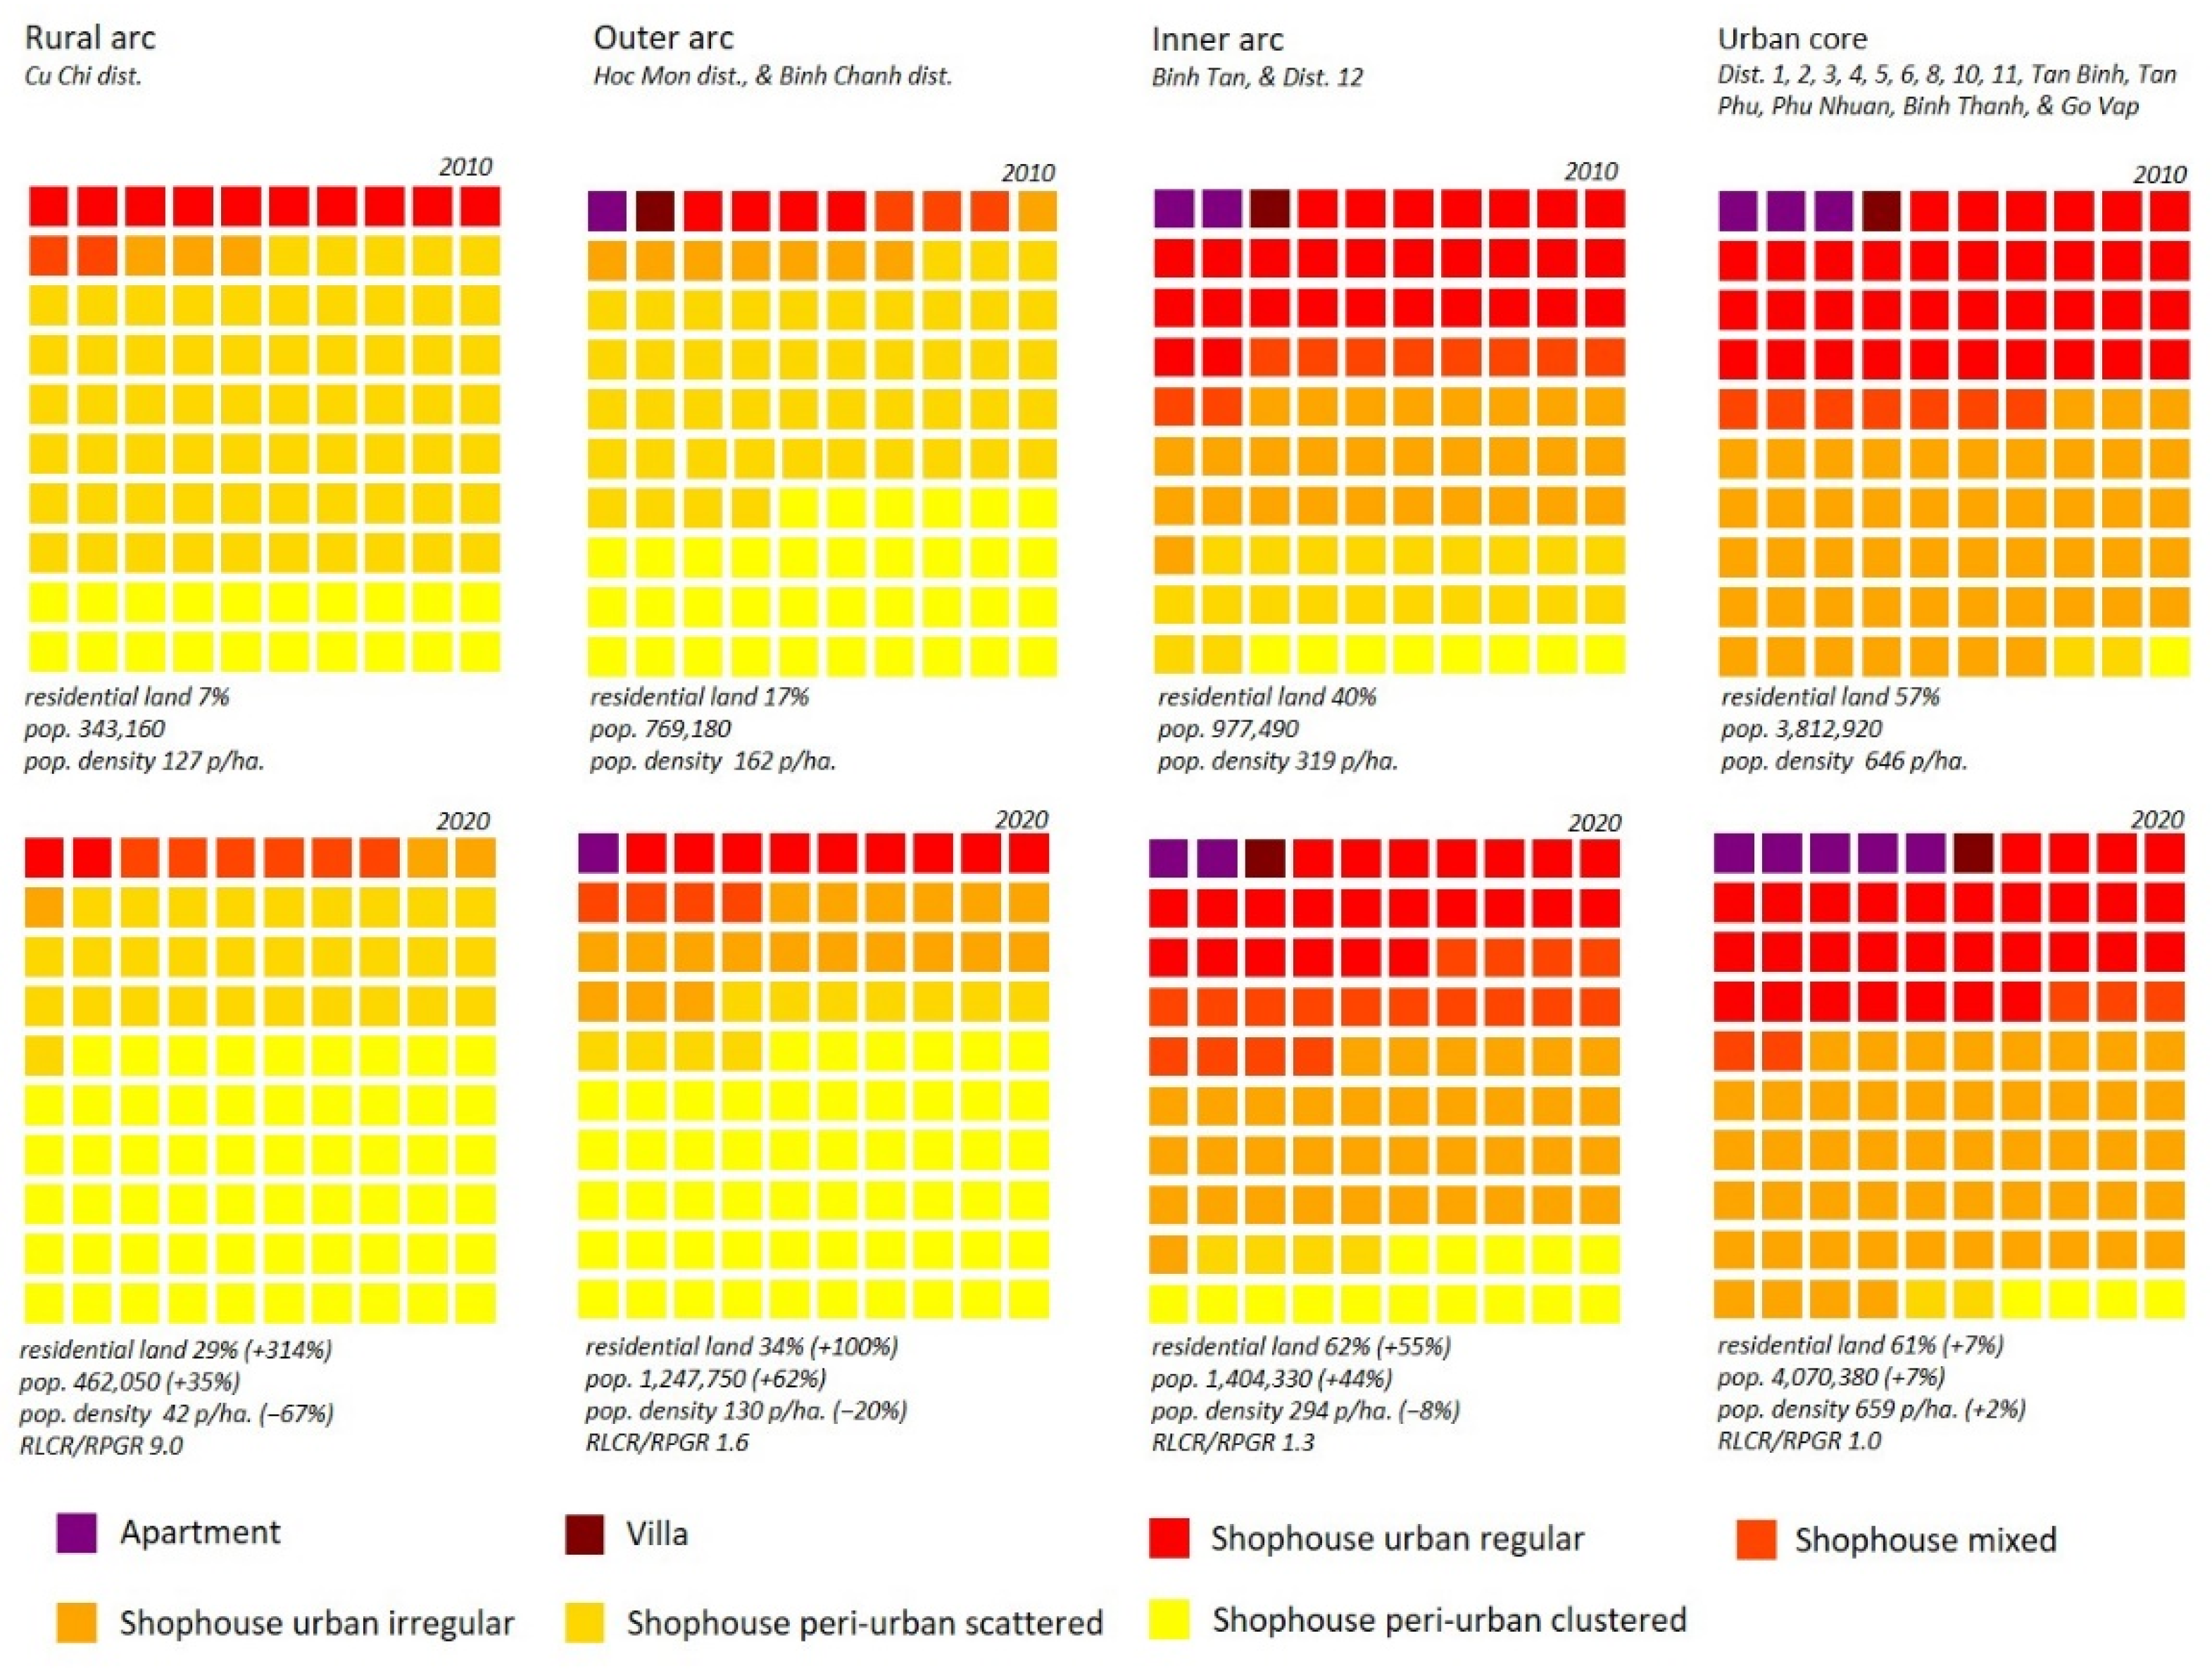
3. Spatiotemporal Patterns of Urbanisation 2010–2020

Table 2 outlines that the classified total built-up area comprising residential, commercial, public, and industry blocks, but excluding the road network, accounted for 46,519 ha or 22.2% of the total administrative area in 2010. By the year 2020, the residential area had increased to 49,961 ha, or 23.8% of the city’s surface area. Concurrently, public, commercial, and industrial areas increased by 3.1% and 3.4%, respectively. Overall, the built-up area reached 30.4% or 63,677 ha by 2020, which is an increase of 36.9%. Most of this increase was facilitated at the expanse of green and open space, the vast majority of which was cropland. Appendix A offers a summary of the classified USTs for the year 2020, whilst Appendix B shows the absolute changes in surface area for all 80 classified USTs between 2010 and 2020.
Loss of cropland is significant, as it not only highlights reduced land for food production [84,85,86,87] but also the changing labour market and employment prospects [4,88,89] and, importantly, the loss of ecosystem services—particularly those associated with regulating floods [90], fresh air production [91,92,93], and carbon sequestration [94,95]. The number of agricultural-forestry-fishery households decreased by 6.38% annually during our assessment period, while the contribution of agriculture, forestry, and fisheries to the overall HCMC economic performance decreased from 1% in 2020 to 0.6% by 2020 [42]. In a previous study focusing on impervious surface detection using freely available Landsat Satellite data, Schaefer and Thinh (2019) found that for the period 2010–2017, the built-up area of HCMC, including detected streets had increased by 50.2% from 37,840 ha in 2010 to 56,850 ha by 2017, with cropland decreasing by more than 70% [96]. Nevertheless, their study excluded the northern district of Cu Chi and the southern district of Can Gio and covered only 95,660 ha or 45.6% of the city’s total administrative area.
In a more extensive study extending to 785,398 ha, Kontgis et al. (2014) demarcated an artificial 50 km radius around the city centre as Greater HCMC [97]. Also utilising Landsat data to study urban growth for the period 1992–2012, they noted that the built-up area grew by 4.8 times, with a loss of over 66,000 ha of cropland [97]. However, this study partly incorporated areas from the six neighbouring provinces which exhibit different and often conflicting sub-regional planning visions and directions.
Both aforementioned studies could only detect binary urban growth. Because of the resolution limitations of the utilised Landsat series imagery, they were not able to distinguish further subclasses of built-up development or individual archetypes of morphological, functional, and socioeconomic features, which are critical for understanding urban transition processes and of practical planning and management relevance. Figure 6 graphically depicts the definitions of the dominant UST groupings observed in HCMC.
Highlighting the recent urban development directions, Figure 7 shows the spatial distribution of the dominant 16 UST groups in both 2010 and 2020.
Our results demonstrate that the city has developed during the period 2010–2020 in two primary development corridors, namely to the northwest (Binh Chanh, Hoc Mon, and Cu Chi districts) and to the east (Thu Duc City, including Thu Thien New Urban Area). This is in agreement with the incurrent Construction Master Plan, which envisaged growth towards one major satellite and regional centre in the northwest, together with two more regional centres in the west and the east. The plan also only anticipated modest developments to the south, considering the low-lying topography and heightened flooding concerns due to predicted sea-level rise.
The most salient feature of Figure 7 is the growth northwest and west of the urban core that was dominated by peri-urban shophouse additions. These are self-built housing by homeowners or informal micro-developers for the low- or middle-income classes, developed on a plot-by-plot basis [66,69]. In total, the peri-urban developments increased by over 10,000 ha, and urban irregular developments increased by over 5142 ha. Development to the east of the urban core in comparison was more dispersed, distanced, and isolated. In this direction, some of the features of recent urban growth show a ‘neater’ pattern, i.e., state-led, planned additions of high-end real-estate, suggestive of increased spatial social exclusion or segregation [81,98,99]. In terms of the classified residential sector, regular shophouse developments increased by more than 1670 ha, with villas and apartments increasing by 148 ha and 531 ha, respectively.
The share land under construction in 2010 decreased by 42.4% between 2010 and 2020. Many of these developments accommodated the growth in middle- and upper-income residents. Our results show that in the vast majority of this land developed in regular shophouses (1008 ha), villa developments (288 ha), and apartments (199 ha), respectively. This corresponds to high-end real estate projects along the Saigon River, and to the east of the urban core to meet the needs of affluent and middle-class lifestyles and rising expectations. A prime illustration is seen in Binh Thanh district in the redevelopment of the historic Ba Son shipyard to construct high-rise residential apartments.
An understanding of population dynamics is critical for sustainability and resilience for several reasons. A great number of authors have suggested that the fine scale mapping of population and population patterns and dynamics over time provides an accurate indication of urbanisation-associated human–environmental processes [100,101,102].
Figure 8 shows the mapped population density of HCMC for the years 2010 and 2020 at the block level. Here, commune level population data from both the 2009 and 2019 census are mapped relative to the classified residential areas for the years for 2010 and 2020. Distributing the census commune level population data to solely the residential areas of each commune provides a better representation of actual net population density, as population data are not distributed over non-residential areas. This improves the overall population representation at the block scale by limiting the systematic underestimation of densities along the urban–rural continuum and facilitates the improved recognition of the residential hotspots and development patterns in both rural and peri-urban areas, respectively.
A bevy of past research studies on HCMC have relied on digital elevation models to compute urban flood hazard maps in the absence of planned technical prevention measures [37,49,54,103]. Figure 9 highlights that spatial urban growth during 2010–2020 occurred in consideration of both topography and flood risk, with most of the recent growth occurring in the high lying northwest and northeast without encroaching on flood-prone lands. These are also the locations of the most geotechnically stable soils for construction, as reported by [104]. Figure 9 also highlights that any further development in both Thu Duc City and Nha Be, which are both outside the planned ring dyke, will require costly ground elevating, i.e., raising the ground level with sand [49,105,106]. This is something that is not feasible for small private builders to undertake before construction and only realistically an option for large commercial real estate developers.

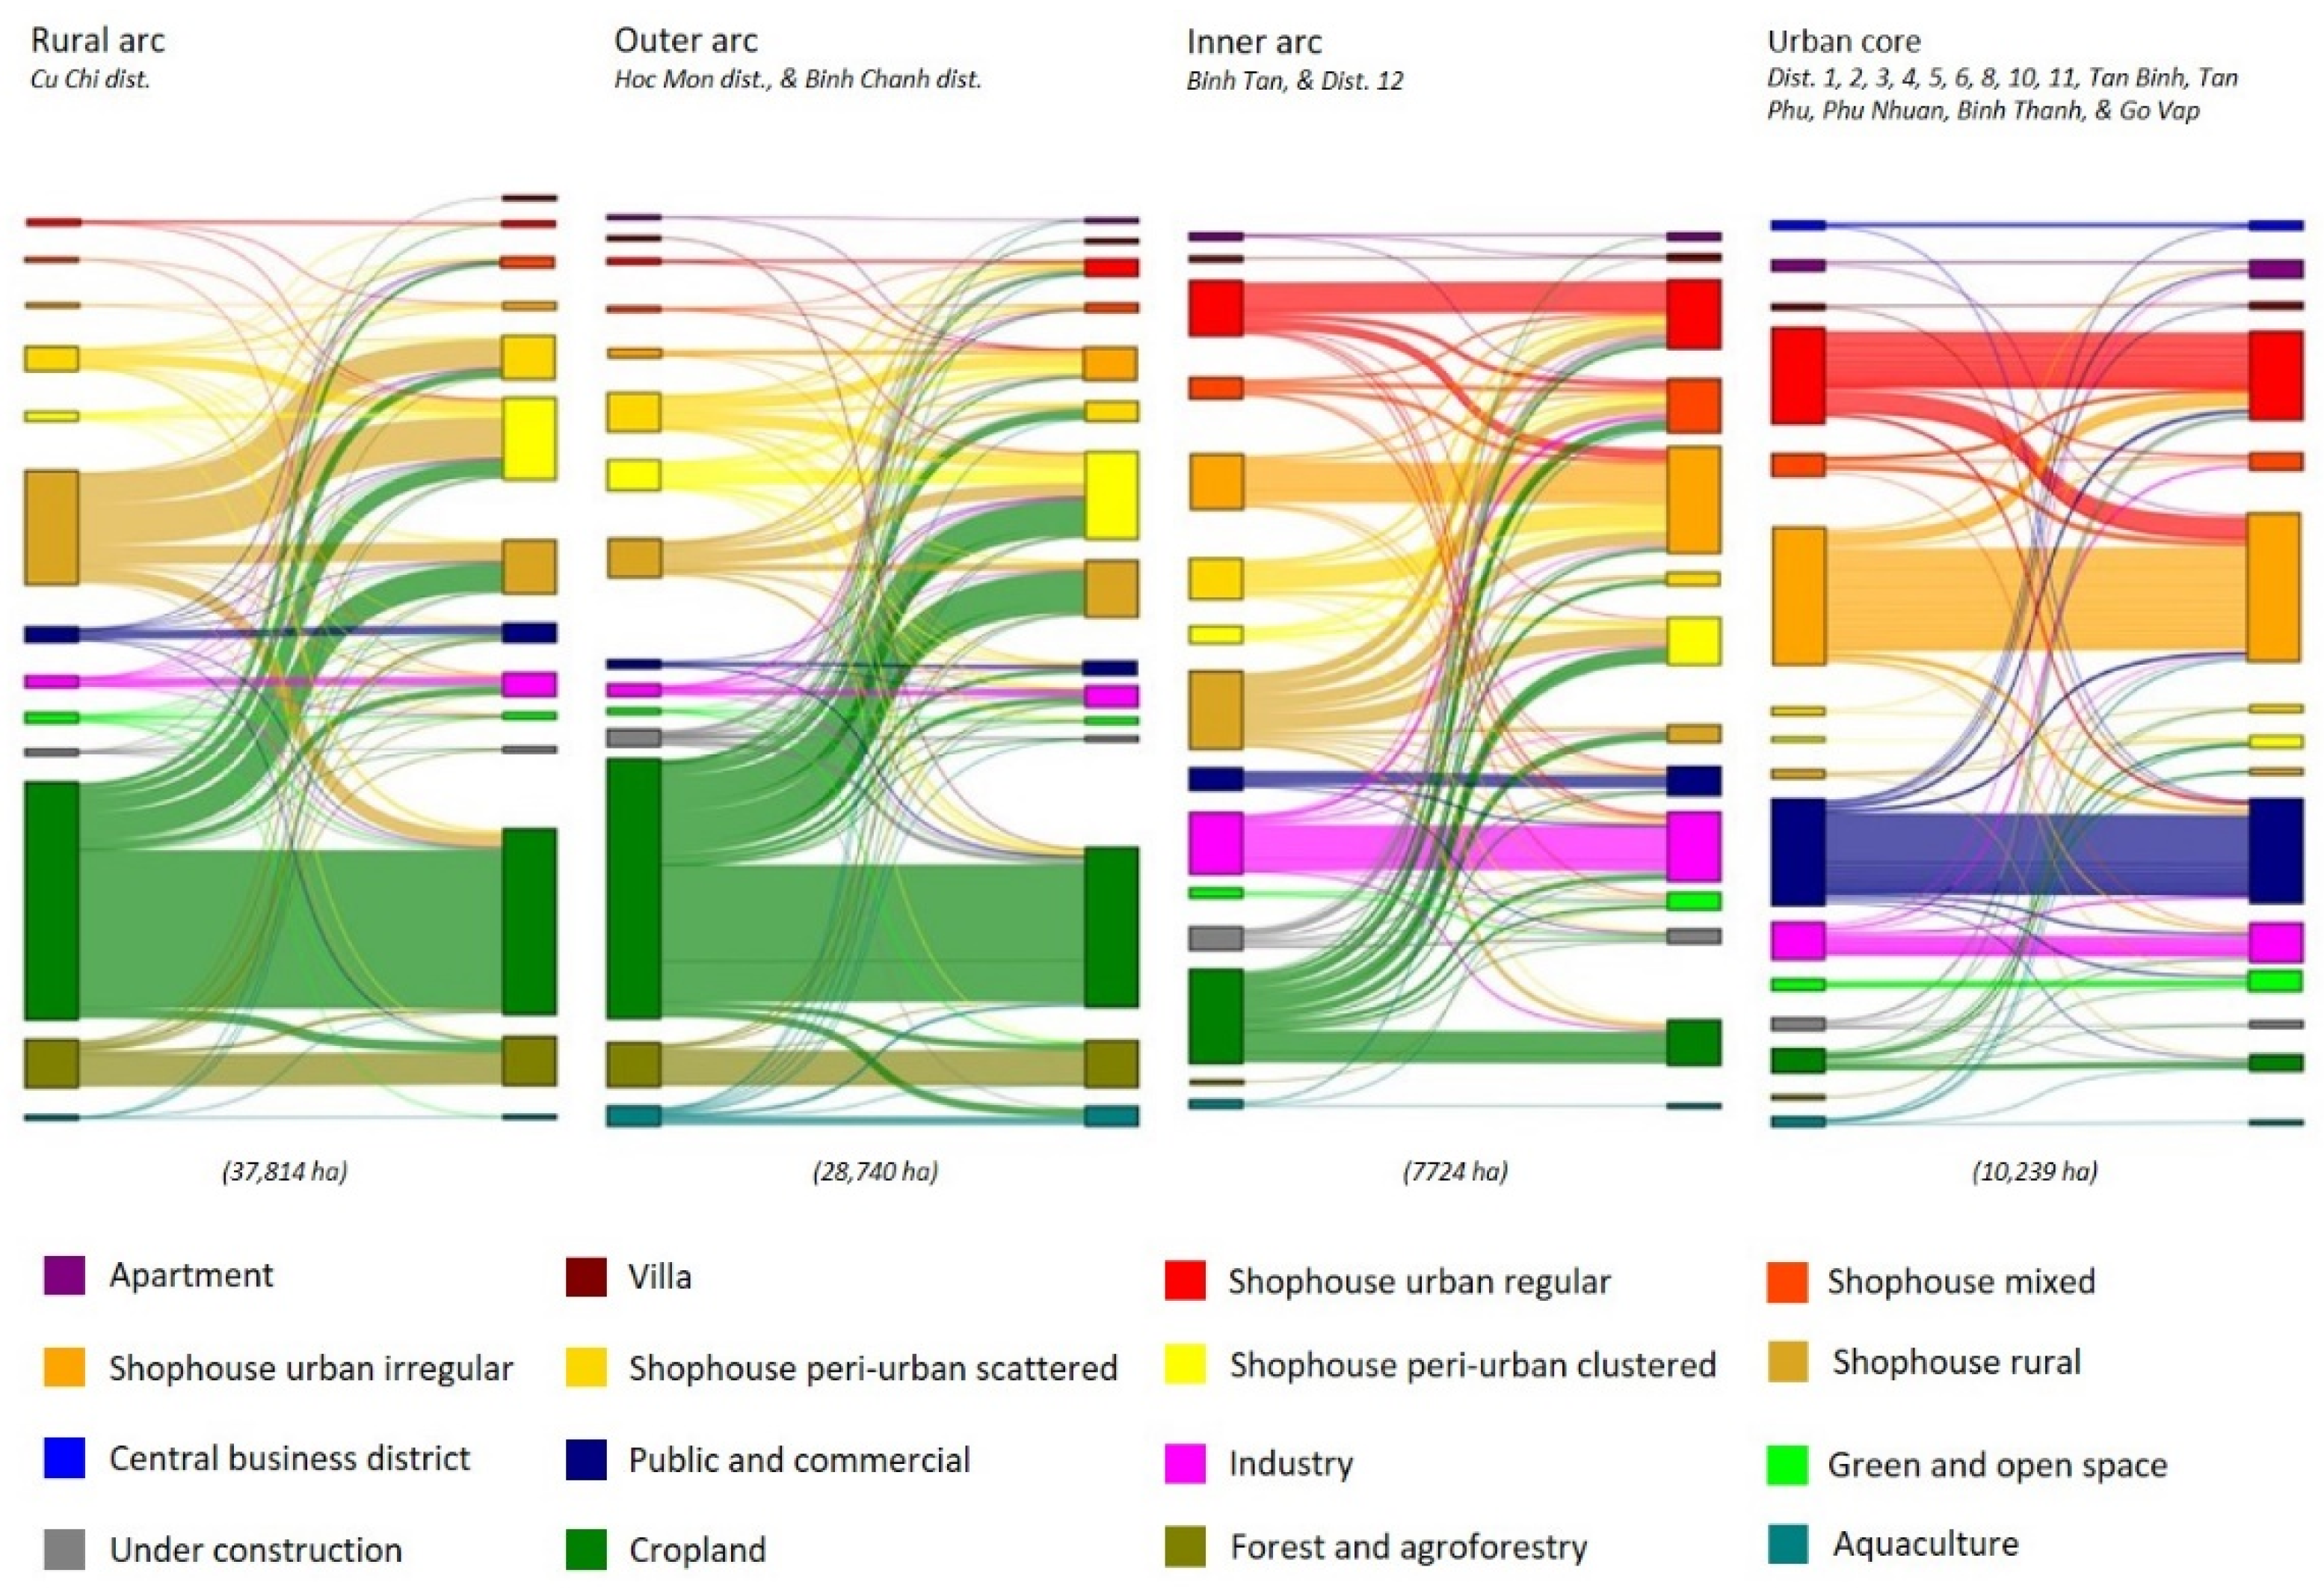
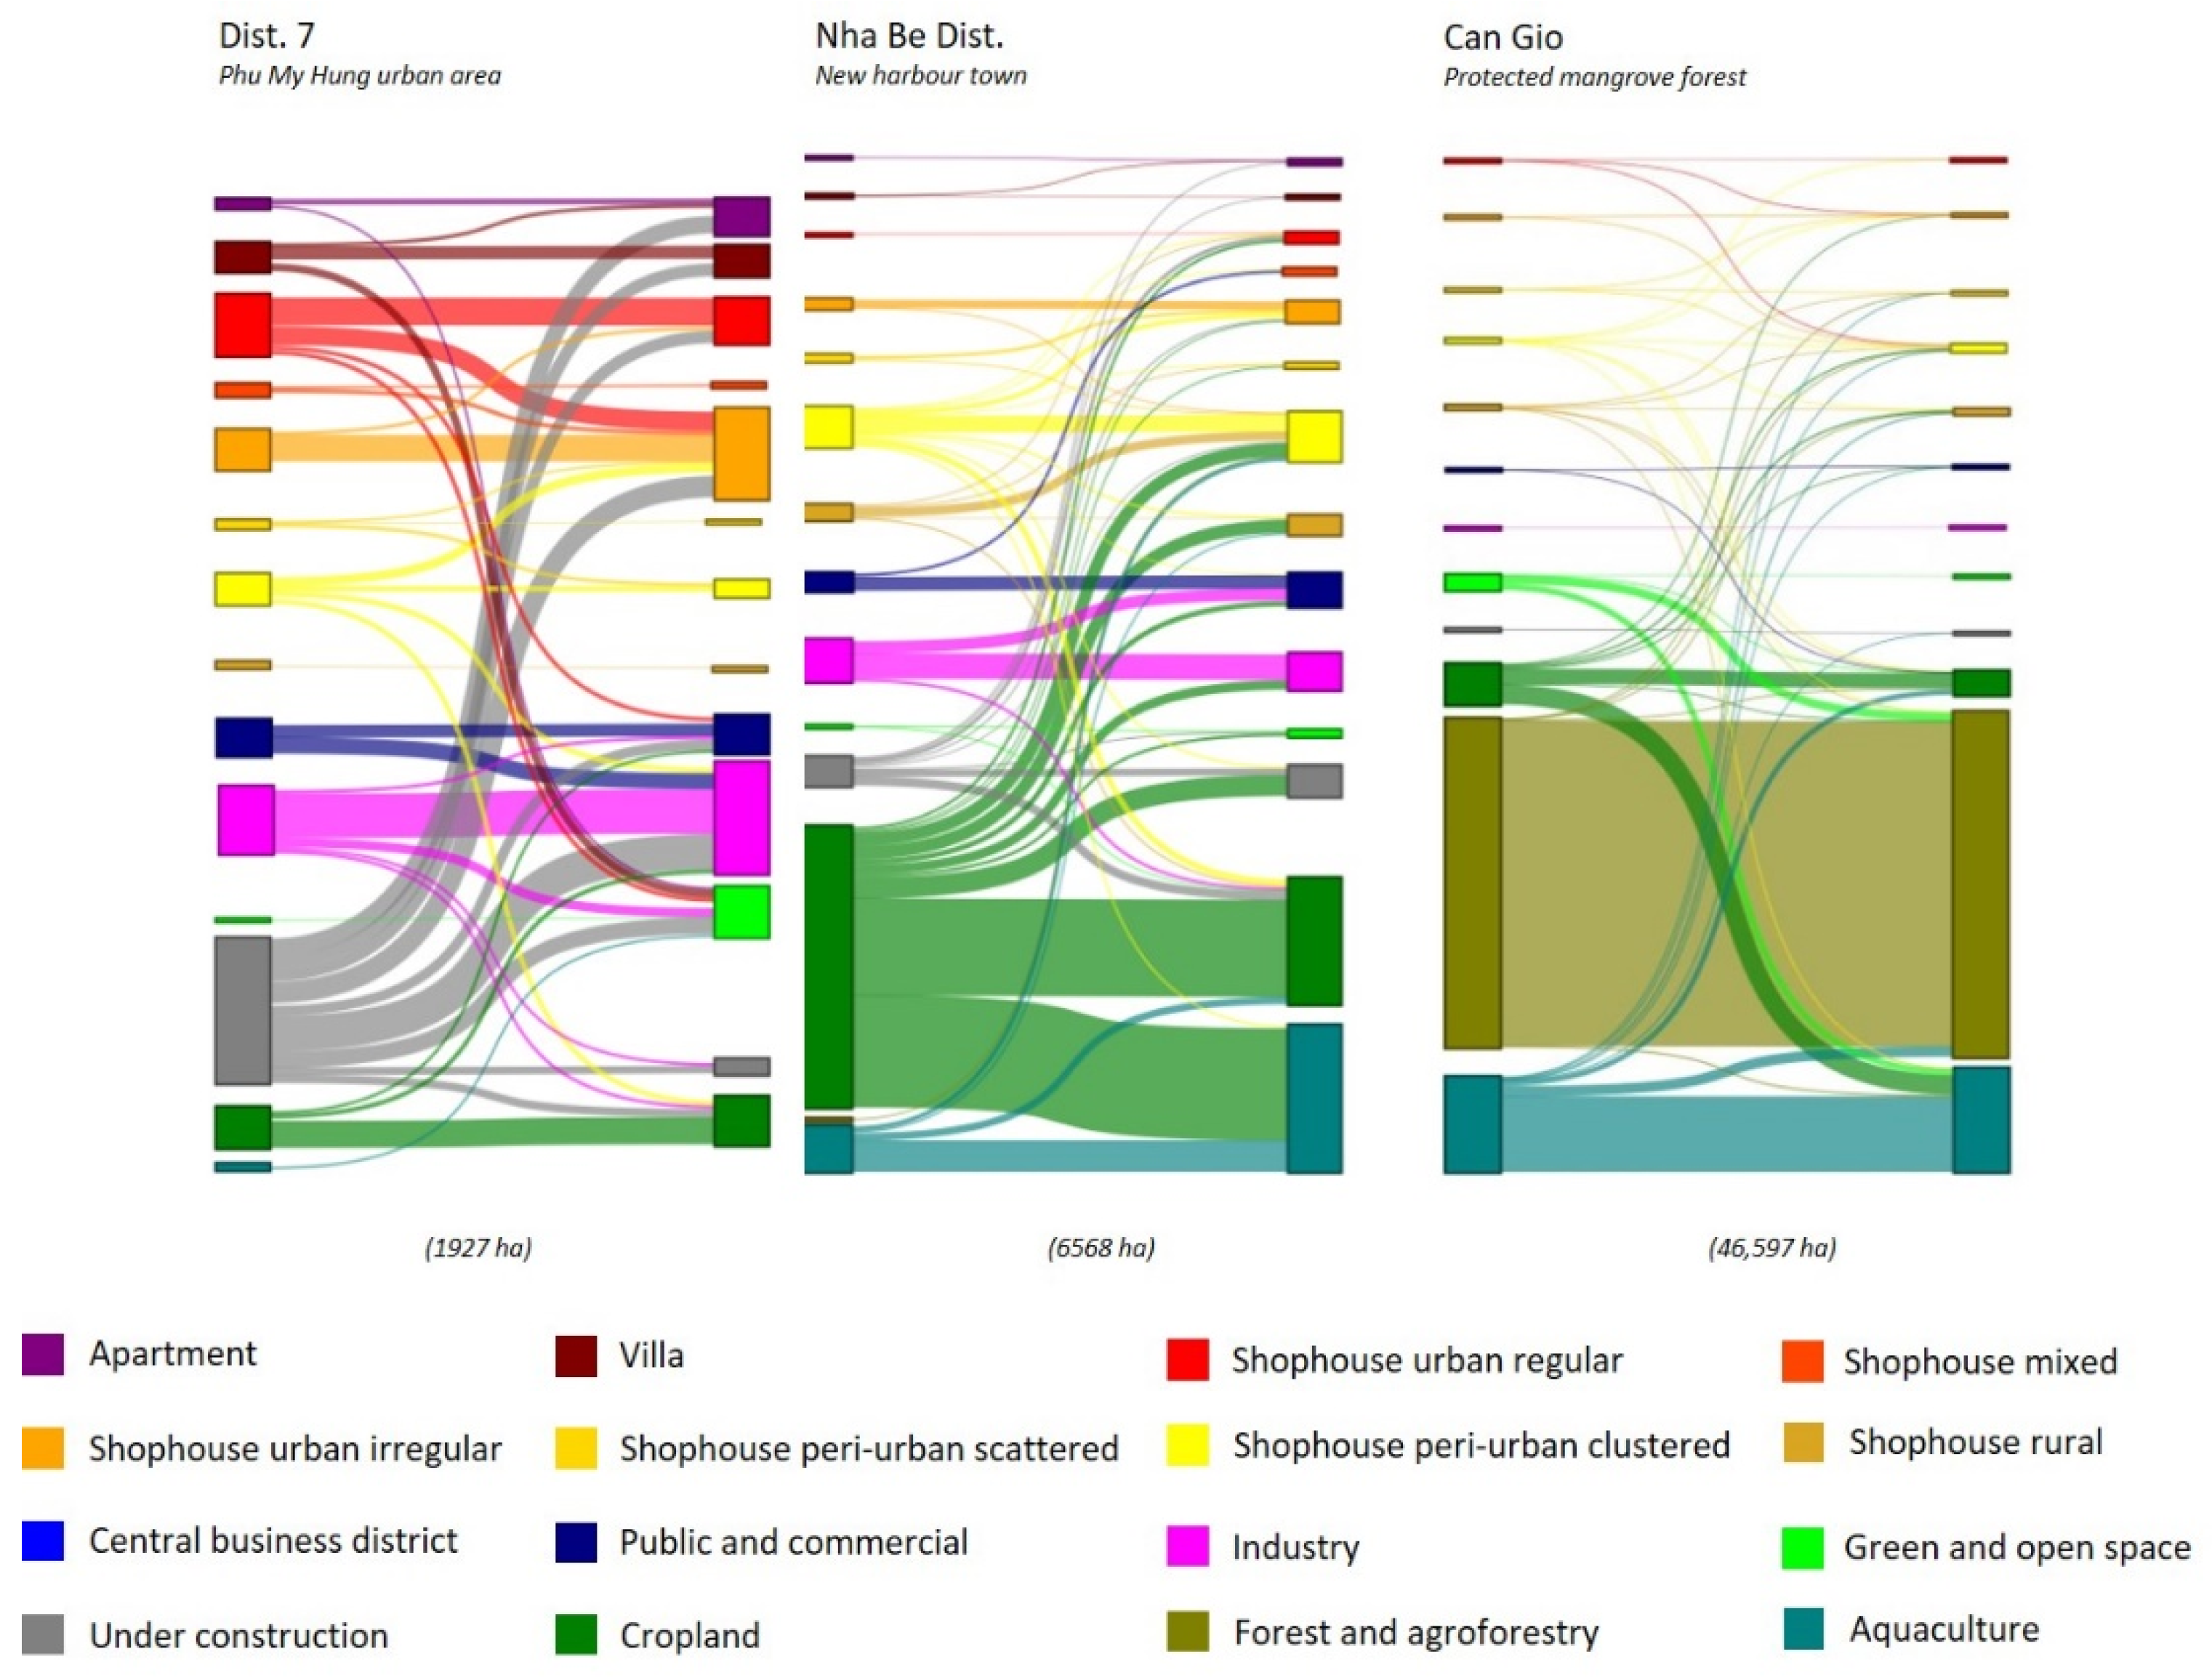
4. Concurrent Urban Development Pathways

Explaining and monitoring rapidly changing cities is a difficult endeavour. To further quantify the urban change, Figure 10 visualises the city-wide block level transitions and gross gain and loss of the main quantified UST from an initial state in the year 2010 to the year 2020. The width of horizontal flows corresponds proportionally to the sum of land transition. For readability, and to reduce visual confusion and exclude unnecessary information, we set the transition threshold value to 180 ha to exclude smaller changes between USTs. The chart highlights 215 flows between the 16 main groups. All in all, our analysis presents an urbanisation structure in which expansion as peri-urbanisation was dominant, while infilling and densification of irregular areas is also seen.
A growing volume of literature discusses urban development pathways focused on the transformation of rural and peri-urban areas to built-up areas [107,108]. To some extent, our results support the sequential co-occurrence model advocated by Novotný et al. (2022) [109]. Using satellite imagery to study the recent development patterns of 43 megacities worldwide, they found that peripheral peri-urban edge expansion was the dominant mode of growth, followed by subsequent infilling of vacant plots and densification [109]. Examining the urban growth patterns of 33 megacities, Chakraborty et al. (2022) found similar results, concluding that edge expansion accounted for most recent worldwide urban growth [110].
Characterising urban expansion for 478 cities with over 1 million inhabitants, Mahtta et al. (2020) concluded that each city displays multiple urban growth pathways simultaneously [111]. Therefore, while its dominant urban development pathway may describe a city, a more true and thorough classification would contain a combination of pathways. According to Mahtta et al. (2020), urban expansion in larger cities is mostly due to the transformation of rural areas into low-rise built structures, as opposed to the densification of pre-existing urban districts [111]. Similarly, Chakraborty et al. (2022), by examining the urban growth pathways in 466 cities, found that cities of the Global South show a comparatively greater outwards expansion than infill densification [112]. Follman et al. (2023) also suggest that peri-urban transformation processes in the Global South possess several prevalent features, notably fragmentation and leapfrogging [113]. These are fashioned by land speculation, as well as state-led development objectives, which are frequently manifested through large-scale projects.
Whilst the next sections outline the dynamic circumstances of urban transitions and the morphological variance within HCMC, it is important to note that to understand urban structures across time and space from a more social science lens, additional material-semiotic methods such as the Actor Network Theory (ANT), urban assemblage research [114,115,116,117,118], as well as ideas of coevolution inspired by evolutionary urban geographies and economics have been recently translated to urban studies [119,120]. We believe our block-level approach can also lend itself to these approaches in understanding of urban norms, projections, and structures spatially explicitly unfold and how associations and translations of how urban elements develop.

4.1. Peri-Urbanisation Plot-by-Plot

Our results highlighted that, by 2020, over 6200 ha of cropland was transformed into plot-by-plot organic shophouse peri-urban areas. In addition, the densification of over 8000 ha of former rural areas resulted in them being reclassified as peri-urban by 2020. These transitions bear a remarkable similarity to the process coined plotting urbanism by Karaman et al. (2020), who used the term to describe such incremental and piecemeal rural–urban changes [121]. While Karaman et al. (2020) often provided illegal examples of such peri-urban expansions, in the context of HCMC, enforcement of plans, and regulations for these developments, were widely undertaken in a relaxed laisser-faire or arbitrary manner in order to promote or at the very least not disturb the provision of self-built affordable housing to the growing population and inflowing lower income migrants [122,123]. Providing the examples of one-story buildings in Lagos, Nigeria, apartment buildings in Istanbul, Turkey, and high-rise tower blocks in Shenzhen, China, Karaman et al. (2020) highlights, in detail, that the dominant residential archetypes for plot-by-plot development vary globally and are highly dependent on the historical and cultural context of the location [121]. In the case of HCMC plot-by-plot development is seen within our shophouse archetypes.
Figure 11 illustrates that the peri-urbanisation on former cropland and the densification of rural areas occurred predominately in the districts of Chu Chi (5808 ha), Binh Chanh (589 ha), Hoc Mon (510 ha), and District 12 (334 ha). Peri-urbanisation drivers may be associated with ribbon developments along major transport arteries or the earmarked route of the delayed Ring Road No. 3 project. Chi et al. (2016) also discusses the recent development of small-scale manufacturing activities, the shift to commercial oriented agriculture, and the spontaneous illegal housing development in these districts [72]. Speculation may also have led to the increase of peri-urbanisation along the Saigon River in Cu Chi, District 12, and Hoc Mon districts [124,125]. This riparian land reserve along the river is increasingly discussed as a new axis of development.
Peri-urban zones are transitional zones between urban and rural districts with infrastructure systems such as water, sanitation, power, and transport in many of these areas remaining poor, and typically following rather than preceding development. This typically results in both overloaded engineered and institutional infrastructure and a loss of natural and social infrastructure [19,102,126,127,128,129,130]. Previous studies have warned that such heterogeneous and fragmented landscapes can lead to inadequate development processes, unequal allocation of services and investment, ignorance of environmental protection, and cultural preservation [131,132,133,134].
Figure 11 also reveals that substantial peri-urbanisation occurred close to existing or recently developed industrial zones. By the end of 2020, there were 19 industrial zones, export processing zones, and high-tech zones in the city. Such developments proliferate because of the large migrant populations who work here and demand affordable housing and amenities [69,135,136,137,138,139]. Plot-by-plot development is observed in the vicinity of industrial parks, for example, around Tan Tao Industrial Park in Bin Tan district and around Phong Phu Industrial Park in Binh Chanh district. This phenomenon is also seen to the north of the city around Phu Trung Industrial Park, Dong Nam Industrial Park, and North-West Industrial Zone in Cu Chi district, west of Vinh Loc Industrial Park, Tan Binh Industrial Park, and in Binh Tan district.
The most recent Construction Master Plan for the development of HCMC envisages transport-orientated development and transforming the remaining peri-urban districts of Hoc Mon, Binh Chanh, and Nha Be, Cu Chi and Can Gio into either urban districts or municipal cities. Under Article 6 of Decree 62/2011, the criteria for becoming an urban district includes achieving an average population density of 10,000 residents/km2, a 90% non-agricultural labour force, and a 90% non-agricultural economy structure. As an urban district, all communes would become wards and administer the policy of HCMC [140].
In contrast, according to Resolution No. 1211/2016/UBTVQH13 for a district to become a municipal city, a locality is required to have a population of at least 150,000 people and an administrative area of more than 150 km2. A locality must also contain affiliated administrative units, at a ratio of wards to commune units at 65% or above [141]. The locality also needs to meet the standard for a class I or class II or class III urban area, a 80% non-agricultural labour force, and a 80% non-agricultural economy structure in the inner urban area in accordance with Decree 42/2009/ND-CP on urban classification [142]. As a municipal city a locality would be provided with more autonomy to exploit investment opportunities and agricultural land funding, while still able to maintain a greater rural economy share. For example, they would be able to directly issue land use right certificates (Sổ đỏ) without going through the Department of Natural Resources and Environment. In either case, in the foreseeable future these localities will be granted subsidies to transform cropland into infrastructure and residential land in order to fulfil the requirements for labour, productivity, housing, transportation infrastructure, and bring higher investment efficiency. In other words, for the purpose of becoming an urban administrative unit, these communities must restructure their economic and land use functions and infrastructure away from agriculture and accelerate urban development.
Both urban expansion and the densification of existing urban structures are two complementary ways of accommodating growing populations in cities. Figure 12 graphically highlights the array of UST transitions between 2010 and 2020 for the northwest development corridor into four geographical segments, namely the rural arc, outer arc, inner arc, and outer core. Figure 13 additionally highlights the changing residential composition for each segment along the same corridor.
Figure 13 also effectively illustrates the change in residential land consumption rate (RLCR) and the net residential population growth rate (RPGR), as well as the ratio of residential land consumption rate to population growth rate (RLCR/RPGR) for each segment for the period 2010–⁠2020. This provides an indication as to whether each segment has become more or less compact over our assessment period. As the same basis as SDG Indicator 11.3.1, values below one imply residential land use with a higher degree of compactness, while a value above one implies residential land use with a lower degree of compactness. A value close to one is indicative of a residential density tending towards stability [143,144].
Bordering both Tay Ninh and Long An province, at the far northwest, Cu Chi district still exhibits a high share of cropland and rural UST (Figure 12). However, the high share of peri-urbanisation plot-by-plot development in Cu Chi district is evident. Our results also show that between 2010 and ⁠2020, the overall residential area in Cu Chi district increased from 7% to 29% while the overall population density decreased. (Figure 13). In the future, Cu Chi district aims to develop the Northwest Urban Area into a modern eco-urban area, whilst still maintaining existing agricultural communes and developing new rural models to attract tourists [145]. The district also wishes to develop the Tan Phu Trung, Tay Bac, and Dong Nam industrial parks, high-tech agricultural production areas, riverside eco-tourism, as well as urban oriented farming models. Agricultural economic restructuring, i.e., switching to high-value crops, which reduces unproductive crops such as rice and sugarcane, is part of the wider city goal to create jobs in rural area in conjunction with the National Target Program on New Rural Development for the period 2010–2020, the One Commune One Product Program (mỗi xã một sản phẩm), and in line with the agricultural restructuring plan [146,147]. The aim is to transform the farming sector from small-scale to commercially oriented agriculture, develop infrastructure, improve production capacities, increase environmental protection, and promote cultural values [146].
Hoc Mon and Binh Chanh districts, which make up the outer arc, show a residential land coverage growth rate of 100% and a high population growth rate of 62% during the assessment window, respectively. The ratio value RLCR/RPGR suggest that the increased population was accommodated by a mild residential expansion. This is in stark contrast to the existing urban districts of inner arc, Binh Tan, and District 12 which show a clear accommodation of increased population through densification of the existing residential footprints. The high share of shophouse urban regular in the urban core segment reflects how this area was planned from the late 1800s onwards. Overall, the development along this corridor from the urban core to the rural Chu Chi district is typical of a monocentric development pattern. Our results also suggest that the urban core cluster of districts show an almost saturated maximum density for population density. Reducing density, by redevelopment, will almost certainly result in gentrification in the urban core cluster with lower income fractions forced to move out while irregular block structures are redeveloped and inner block alleyways are widened.
Despite a large population growth rate, the districts that comprise the outer arc still suffer from underdeveloped infrastructure, uneven population distributions, and issues of land and construction violations, particularly residential areas that are not in accordance with the planning of industrial parks [72,132,148,149]. To narrow the gap of development between urban areas and rural areas, Binh Chanh aims to develop into a city. By 2020, Hoc Mon already exhibited a similar level of population and, in parts, infrastructure development as neighbouring urban districts, 12, Go Vap, and Binh Tan. For both districts, emphasis is to be placed on both mechanisms and policies to support industrial and urban high-tech agriculture associated with agricultural restructuring and the construction of new rural models around high-yield species such as yellow apricots, ornamental plants, green vegetables, and orchid gardens. The high population density (Figure 8) and rate of growth (Figure 13) suggest that the current administrative government model of rural districts and communes is increasingly less suitable for the speed of urbanisation and socioeconomic development of both Binh Chanh and Hoc Mon.

4.2. Plot-by-Plot Densification

Highlighting the adaptability of the dominant shophouse building archetype and private building processes, the second observed dominant transition is the densification (extending upwards, replace or infill) of former peri-urban areas. Our analysis reveals that the more matured development status is dominated by urban irregular and peri-urban clustered USTs. The continuous radio-centric growth from peri-urban areas to irregular urban areas caused the urban core to enlarge (Figure 11). Overall, 3114 ha of formerly peri-urban areas were transformed into irregular urban areas by 2020. Districts comprising Hoc Mon (992 ha), District 12 (471 ha), Thu Duc (277 ha), District 2 (140 ha), District 9 (311 ha), Binh Chanh district (279 ha), Nha Be (130 ha), and Cu Chi (294 ha) showed the greatest transition to irregular urbanisation. Like the aforementioned peri-urbanisation process, we also see densification adjacent to industrial park development, and apparent along centripetal traffic routes (Figure 11).
Previous studies have tended to overlook irregular settlement patterns as they are challenging to detect in the absence of additional contextual information (Figure 14). However, these irregular urban developments with inherited organic spatial structures are substantial and highlight the transient nature of initial peri-urban growth. They also highlight the bottom-up processes and speculative logic of residents and landowners dividing plots and the construction of affordable housing for financial gain or to accommodate workers close enough to places of employment, as well as tardiness of enforcement, which all continue to influence the current urban spatial pattern. Karaman et al. (2020) describes how when individuals aim to maximize the exploitation of specific land plots, this often leads to a deficiency in public spaces and services, as dense neighbourhoods with overburdened infrastructure, limited green space, and inconvenient layouts are a common feature of plot-by-plot development [121]. For HCMC, the exploitation and division of land results in the formation of small internal alleyways of only 1–1.5 m width, typical of organic shophouse urban irregular USTs. Such structure means poor accessibility and emergency response times to any plots other than those orientated to the main road (i.e., the block boundary). This hinders, in turn, the delivery of modern solid waste collection and the roll out of wastewater and stormwater drainage. As previous peri-urban areas become more economically and demographically mature, problems may deepen. Such developments increase built density without adequate planning control, and in the absence of supporting infrastructure, green space and urban service provisions. Poor infrastructure and planning intensify the consequences when extreme events occur.
A challenge for the city is that such developments additionally create bottlenecks halting the implementation of planned developments and infrastructure. Acolin and Kim (2017), studying informal areas in HCMC states that in such irregular developed areas, the provision of much infrastructure lags increasingly behind with consequent problems of overburdened traffic systems, sanitation, and increased pluvial flooding [35,150]. A further critical issue is the loss of the remaining ecologically important areas [18,151]. Our results underscore the necessity for planning to be proactive in the management of urban development and in safeguarding the remaining spaces that provide ecosystem services. Hawken et al. (2021) highlights that rapid urban development typically exacerbates inequality within urban areas, and this stretches to ecosystem services [152]. This is important as the incurrent master plan was not integrated with predicted sea level rise scenarios, and the city continues to have no workable plan for climate change adaptation and mitigation. The continued loss of green space and cropland severely restricts capacity to (re)adapt to climate change in the future [153,154].

4.3. Bypass Urbansiation

Lastly, our results suggest that state-led development is a driver of bypass developments. Sawyer et al. (2021) coined the term “Bypass urbanism”, which entails the implementation of a series of large-scale projects that together initiate the development of an entirely new urban configuration at the edge of an urban region [155].
In the case of HCMC, state-led development drove the construction of large-scale projects targeting the emerging middle classes, as well as industrial and public developments. National and international developers direct investments into high-end residential complexes as they are financially more rewarding, in contrast to developing affordable housing [135]. This can be seen along both the southern and eastern development corridors. Most of which are dispersed, or illustrative of vanguard development. We can understand the planned expansion and development of large blocks as a reflection of policy and strong infrastructure development. A number of studies provide a critique of the middle- and upper-class wealth driving this particular growth channel [156,157]. On the other hand, Kim (2017) suggests that this piecemeal realisation of projects is a direct result of both the highly bureaucratic and at the same time flexible process of foreign capital producing the urban development [124].
Between 2010 and 2020, the largest share of FDI capital investment poured into HCMC was allocated to the eastern growth corridor of former Districts 2, 9, and Thu Duc, east of the Saigon River [42]. Comprising the newly established Thu Duc City, they represent 35% of HCMC regional domestic product, 7% of the national GDP, while covering only 10% of the city’s total area and 12% of the total population [42]. In total, six key functional areas (Thu Thiem New Urban Area, Rach Chiec, Truong Tho, Tam Da, National University cluster, and High-Tech Park) are planned for this area, with a series of infrastructure and transport projects, including Metro Line 1, new expressways, and bridges to interconnect the areas with each other and with neighbouring provinces. Figure 15 documents UST flows between 2010 and 2020 for the districts which make up this eastern development corridor.
Other large scale, developer-driven leapfrog developments appear discontinuous in districts 2, 9, and Thu Duc. The areas classified as under construction can be considered as a precursor to urbanisation, and ironically, 725 ha of land classified in 2010 remained under construction in 2020. In particular, in 2020, a large area of the planned Thu Thiem New Urban Area remained undeveloped. This highlights the issues of land taken out of agricultural production, parcelled for development, and the challenges of contending with resettlement issues and stalled developments—as a consequence of the speculative behaviour of developers and individuals, insufficient development capital or management, as well as fragmented landownership rights. Development is occurring further from the urban core, as investors can no longer acquire large available land parcels close to the centre unhindered by existing politics, property rights, and local economics [99,158,159]. Much of the built development far from the centre has failed to attract residents, with buyers considering land and units merely as an investment. This creates the risk of abandoned projects which are often resold. As Labbé and Musil (2014) noted, the leapfrog nature also means projects are far away from supporting basic infrastructure connections to the urban core, services, and amenities such as hospitals, wet markets, entertainment facilities, and restaurants [160]. To address the lack of services in such localities, developers have tended to establish apartment complexes which include comprehensive high-end service provisions for residents [99] (see Figure 16).
Figure 17 highlights the UST transitions along the southern development corridor in the direction towards the sea, which includes District 7, Nha Be, and Can Gio. Development along this corridor aims to improve traffic infrastructure to take advantage of the socioeconomic potential of the marine economy for tourism and trade. To develop the Saigon South Master Plan, Phu My Hung New Urban Area, the Tan Thuan Export Processing Zone, and the Hiep Phuoc Industrial Park have all been developed. In 1997, Phu My Commune, then Nha Be district, was separated to form District 7. This previously low-lying marshland area with interlacing rivers and canals was reclaimed and turned into New Urban Area, Phu My Hung (also known as Saigon South). Nationally well-known, this urban planning and construction project, comprising gated apartment and villa development continues to be referenced as a national model for urban development for the emerging urban upper middle class [133,161,162,163,164,165,166] (see Figure 18).
With the Saigon, Dong Nai, Nha Be, Long Tau, and Soai Rap rivers all passing through its territory, development in Nha Be remains constrained by its geography, elevation, frequent flood pulse, and high subsidence rates [167,168,169,170,171,172,173]. The two most northern communes of Nha Be district, Phuoc Kien, and Nhon Duc are planned to be New Urban Areas, with the aim of exploiting land funds along the district’s rivers and canals and promoting the continued development of the Hiep Phuoc deep-water port.
Recent developments of Can Gio are not a reflection of bypass urbanism but rather the enforced protection of its UNESCO Mangrove Forest and Biosphere Reserve established in 2000. This currently limits development to the most northern and southern coastal communes, where plans are to reclaim land in the Can Gio Sea Encroachment Urban Area Project. Further development is expected to focus on high quality resorts and eco-tourism. The district still has a low residential density. The main economic activities of local people are forest management, agriculture, fishing, aquaculture, and salt production [174,175].
Other notable examples of bypass urbanism are also the many newly built resettlement areas, many of which remain vacant neighbourhoods, particularly in the Vinh Loc B resettlement area in Binh Chanh district, Phu My resettlement area in District 7, and the Binh Khanh resettlement area in the Thu Thiem New Urban Area. The well-documented reasons for empty resettlement areas relate to the amended policies on compensation and resettlement in the revised Land Law 2013, and the frequent lack of social and technical infrastructure and amenities [176].

5. Conclusions

Continued urbanisation seems to be unavoidable in the context of continued socioeconomic development. HCMC has experienced profound urbanisation and continues to play an important role in the nation’s overall economic and social fabric. Our results contribute to an improved understanding of HCMC’s heterogeneous urban form and the city’s on-going transformation processes. Our urban block-based UST results allow for the spatially explicit quantification of the heterogeneous patterns of urbanisation as well as the characterisation of the major urban development processes. Such a detailed residential classification of shophouse architypes typical of many southeast Asian cities would merely not been possible with more generic UST approaches. For local planners and architects, our architypes are understandable and can be easily conveyed to decision makers, whilst the block-based maps are produced at a scale relevant for spatial planning and delineating the rural–urban transitions. Figure 9 highlights the main urbanisation processes of HCMC between 2010 and 2020 and shows that recent transformation does not follow a single pathway. The different types of greenfield developments in the city demonstrate the significant difference in location of new residential areas by UST type. Moreover, by utilising official population data, we were able to calculate four key indicators: (1) the residential land consumption growth rate (RLCR), (2) the net residential density, (3) the residential population growth rate (RPGR), and (4) the ratio of residential land consumption rate to population growth rate, as an indicator to describe more sprawling or more compact density development pathways.
Applying these indicators on the district intra-urban level of disaggregation, we were able to cluster the city’s districts on the basis on similar shares of USTs and similar residential spatial development patterns over the 10-year assessment period into three main development corridors. Based on the basic assumption of the monocentric urban model, we were able to detect an archetypical development direction in a northwest direction from the urban core to the rural Cu Chi district. Here, the increasing densification gradient from rural to the urban core is predominantly reflected in the densification of shophouse-based USTs from rural to peri-urban, and from peri-urban to urban shophouse-based UST classes. We can explain this incremental development pattern most effectively as archetypical plot-by-plot or as plotting urbanisation, where privately built structures remain the prevalent mode of urbanisation.
The observed development characteristics of the remaining districts were observed not to be in accordance with the basic assumption of the monocentric urban development model. The residential UST patterns of these areas were significantly different compared to the previous clustered districts with a higher share of ‘modern’ UST types like apartments, villas, and modern site and service-based urban shophouse structures and higher shares of public, commercial, and industrial USTs related to their overall built-up structure. Drawing from their varying development status and spatial orientation, we have categorised District 7 and Na Be district within the southern development direction corridor, while Thu Duc district and Districts 2 and 9 fall under the eastern development direction. We classified both development patterns as bypass urbanisation in which plan led regular developments aim to add two new urban centres to the existing dominant mono-centric urban core.
Whilst specific to a particular geography, our results add to the current knowledge about urban dynamics in an expanding megacity, yielding a spatiotemporal contextual characterization of the city. Up-to-date and accurate urbanisation and population trends are critical factors for urban and regional planning. Our results create spatial awareness much beyond the lone inspection of urbanisation from a binary built-up/non-built-up perspective, visualising the diverse heterogeneous spatiotemporal reality and development pathways. As pathways are associated with different demographic and socioeconomic realities, which show certain connections and interdependencies, this allows for the process of urbanisation to be reviewed systemically in the designing of new proactive policies to avoid undesirable urban futures. This can help generate awareness, identify inter-linkages, and pose new questions across a wide range of disciplines. In particular, the block-level assessment is a meaningful spatial unit for the study of, and is a contribution to, the local ongoing discourses on affordable housing, infrastructure provision including public green space or the emerging topics of social segregation, and spatial and social disparities.
Furthermore, our results stress the importance of understanding the current urban form, and urbanisation pathways and processes, when undertaking various urban-level assessments related to future actions, risks, and investments. Studies which typically rely on delimiting the current urban extent, growth boundaries, as well as judgements on future assessment boundaries, should take care to understand the current and future urban realities and socio-economic trends rather than focusing on, or being solely constrained to, the current administrative classifications or historical urban core. The identified key urbanisation processes and development corridors can help to guide future assessment boundaries. To conclude, the documented results highlight the growing challenges for local planners, policy makers, and researchers in managing, balancing, and assessing future urban growth and addressing the wider issues related to sustainable urban development.

Author Contributions

Conceptualization, N.K.D. (Nigel K. Downes) and H.S.; methodology, N.K.D. (Nigel K. Downes) and H.S.; formal analysis, N.K.D. (Nigel K. Downes), H.S., P.Q.V., N.K.D. (Nguyen Kieu Diem) and L.C.D.; resources, L.C.D.; writing—original draft preparation, N.K.D. (Nigel K. Downes) and H.S.; writing—review and editing, N.K.D. (Nigel K. Downes), H.S., P.Q.V., N.K.D. (Nguyen Kieu Diem) and L.C.D.; visualization, N.K.D. (Nigel K. Downes), H.S., P.Q.V., N.K.D. (Nguyen Kieu Diem) and L.C.D. All authors have read and agreed to the published version of the manuscript.

Funding

The 2010 UST classification for HCMC was previously undertaken within the research project “Integrative Urban and Environmental Planning for Adaptation of Ho Chi Minh City to Climate Change” 2008–2013 (01LG0509A1) as part of the research programme ‘‘Sustainable Development of the Megacities of Tomorrow’’ and the research project “Rapid Planning-sustainable Infrastructure, Environmental and Resource Management for Highly Dynamic Metropolises” Subproject 2: Spatial and Environmental Planning—Analysis of Urban Development 2014–2019 (01LG1301B), which were both funded by the German Federal Ministry of Education and Research (BMBF). N.K.D.’s position was supported by German development cooperation, placed and co-funded by the Centre for International Migration and Development (CIM), a joint operation of GIZ and the German Federal Employment Agency with funding from the German Federal Ministry for Economic Cooperation and Development.

Data Availability Statement

The data that support the findings of this article are available upon request from the corresponding author.

Acknowledgments

We thank the anonymous reviewers for their constructive feedback.

Conflicts of Interest

Author Pham Quoc Viet was employed by Deutsche Gesellschaft für Internationale Zusammenarbeit (GIZ) GmbH. The remaining authors declare that the research was conducted in the absence of any commercial or financial relationships that could be construed as a potential conflict of interest.

Appendix A. Classified UST for the Year 2020

Utilisation
Category/Class
No. Urban Structure TypesNo. of BlocksSurface Area (ha)Percentage Utilisation Category (%)Percentage of total HCMC Surface Area (%)
Total urban structure types 8077,476153,957.7-73.4
Residential
(4 classes)
2345,94349,951.110023.8
Shophouse-based1242,62948,102.496.323.0
Villa-based41019845.51.70.4
Apartment-based51149881.91.80.4
Central Business Dist.-based2 121.30.20.1
Public, commercial, and special use
(9 classes)
2074356538.21003.1
Industrial
(2 classes)
440617187.91003.4
Green and open space (9 classes)3320,03790,280.410043.1
Remaining street and surface water--55,542.3-26.6

Appendix B. Summary of Individual UST Changes between 2010 and 2020

Urban Structure Types20102020Change 2010⁠–2020
(ha)(%)(ha)(%)(ha)(%)
Residential 36,263.017.349,951.123.813,688.237.7
Shophouse-based35,181.416.848,102.423.012,921.036.7
Shophouse urban regular4035.51.95705.32.71669.841.4
Shophouse regular307.20.1528.50.3221.372.0
Shophouse regular new comm.327.30.21304.30.6977.1298.6
Shophouse regular narrow streets1784.50.91892.20.9107.66.0
Shophouse regular w/yards1616.50.81980.30.9363.822.5
Shophouse urban irregular5258.22.510,400.65.05142.597.8
Shophouse irregular high dense1605.40.82498.31.2892.855.6
Shophouse irregular w/yards3547.31.77734.13.74186.8118.0
Shophouse irregular temporary105.40.1168.30.162.959.6
Shophouse peri-urban10,010.24.720,202.39.610,187.1101.8
Shophouse irregular scattered5930.72.85325.72.5−605.0−10.2
Shophouse irregular clustered4084.51.914,876.67.110,792.1264.2
Shophouse rural 14,575.47.09418.74.5−5156.7−35.4
Mixed shophouse1297.20.62375.61.11078.483.1
Villa-based617.10.3845.50.4228.537.0
Villa232.50.1380.70.2148.263.7
Luxury villa250.40.1240.40.1−10.1−4.0
Villas in established UST106.20.1209.10.1102.996.8
Colonial villa27.90.015.40.0−12.5−44.9
Apartment-based351.20.2881.90.4530.7151.1
Mid-rise apartment83.20.0114.10.130.937.1
High-rise apartment162.00.1668.90.3506.9312.9
Chinese apartment54.20.028.10.0−26.1−48.2
American apartment28.30.013.00.0−15.2−53.9
Social apartment23.50.057.80.034.3146.3
Central business district-based113.30.1121.30.18.07.0
Public and commercial5319.42.56538.23.11218.822.9
Education 622.00.31384.40.7762.4122.6
Trade and commerce 53.30.0130.90.177.6145.6
Sites of Worship186.30.1349.00.2162.887.4
Hospital and health centre155.50.1159.30.13.82.5
Public offices 260.60.1278.60.117.96.9
Transportation nodes 1376.00.71515.10.7139.210.1
Cultural sites426.00.2381.90.2−44.1−10.3
Energy/communications 71.80.079.60.07.810.9
Security and military1901.60.91670.40.8−231.2−12.2
Disposal and treatment 266.40.1588.90.3322.5121.1
Industry4936.12.47187.93.42251.845.6
Green and open space 107,439.251.390,280.443.1−17,158.8−16.0
Park571.80.3838.50.4266.746.6
Cropland52,213.624.935,220.016.8−16,993.7−32.5
Aquaculture 11,256.55.412,957.36.21700.715.1
Forestry and agroforestry36,520.917.437,404.617.9883.72.4
Unused land497.90.2523.40.225.55.1
Under construction 4411.82.12543.01.2−1868.8−42.4
Sports site198.70.1270.50.171.836.1
Cemetery 325.20.2489.80.2164.650.6
Total built-up area46,518.522.263,677.330.417,158.836.9

References

  1. Schneider, A.; Mertes, C.M.; Tatem, A.J.; Tan, B.; Sulla-Menashe, D.; Graves, S.J.; Patel, N.N.; Horton, J.A.; Gaughan, A.E.; Rollo, J.T. A New Urban Landscape in East–Southeast Asia, 2000–2010. Environ. Res. Lett. 2015, 10, 034002. [Google Scholar] [CrossRef]
  2. Hong, N.; Kim, S. Beyond Desakota: The Urbanization Process and Spatial Restructuring in Contemporary Vietnam. Urban Res. Pract. 2023, 16, 582–604. [Google Scholar] [CrossRef]
  3. Labbé, D. Critical Reflections on Land Appropriation and Alternative Urbanization Trajectories in Periurban Vietnam. Cities 2016, 53, 150–155. [Google Scholar] [CrossRef]
  4. Arouri, M.; Ben Youssef, A.; Nguyen, C. Does Urbanization Reduce Rural Poverty? Evidence from Vietnam. Econ. Model. 2017, 60, 253–270. [Google Scholar] [CrossRef]
  5. Fan, P.; Ouyang, Z.; Nguyen, D.D.; Nguyen, T.T.H.; Park, H.; Chen, J. Urbanization, Economic Development, Environmental and Social Changes in Transitional Economies: Vietnam after Doimoi. Landsc. Urban Plan. 2019, 187, 145–155. [Google Scholar] [CrossRef]
  6. Gubry, P.; Castiglioni, F.; Cusset, J.-M.; Thieng, N.T.; Huong, P.T. The Vietnamese City in Transition; Institute of Southeast Asian: Singapore, 2010. [Google Scholar]
  7. Quang, N.; Kammeier, H.D. Changes in the Political Economy of Vietnam and Their Impacts on the Built Environment of Hanoi. Cities 2002, 19, 373–388. [Google Scholar] [CrossRef]
  8. Forbes, D. The Urban Network and Economic Reform in Vietnam. Environ. Plan. A 1995, 27, 793–808. [Google Scholar] [CrossRef]
  9. Diez, J.R. Systemtransformation in Vietnam: Industrieller Strukturwandel und Regionalwirtschaftliche Auswirkungen; Lit: Berlin, Germany, 1995; ISBN 3-8258-2636-8. [Google Scholar]
  10. General Statistics Office. Vietnam Population Projection for the Period 2019–2069; MPI: Hanoi, Vietnam, 2020.
  11. Government of Vietnam. Vietnam’s Sustainable Development Strategy for the Period 2011–2020 (Decision No 432/QĐ-TTg, 12/04/2012); Government of Vietnam: Hanoi, Vietnam, 2012. (In Vietnamese)
  12. Chen, G.; Li, X.; Liu, X.; Chen, Y.; Liang, X.; Leng, J.; Xu, X.; Liao, W.; Qiu, Y.; Wu, Q. Global Projections of Future Urban Land Expansion under Shared Socioeconomic Pathways. Nat. Commun. 2020, 11, 537. [Google Scholar] [CrossRef]
  13. Saksena, S.; Fox, J.; Spencer, J.; Castrence, M.; DiGregorio, M.; Epprecht, M.; Sultana, N.; Finucane, M.; Nguyen, L.; Vien, T.D. Classifying and Mapping the Urban Transition in Vietnam. Appl. Geogr. 2014, 50, 80–89. [Google Scholar] [CrossRef]
  14. LawNet. Resolution No. 06-NQ/TW Dated January 24, 2022 on Planning, Construction, Management, and Sustainable Development of Urban Areas in Vietnam Til 2030, with a Vision toward 2045 06-NQ/TW, Nghị Quyết 06-NQ 2022. Available online: https://lawnet.vn/en/vb/Resolution-06-NQ-TW-2022-planning-and-construction-of-urban-areas-in-Vietnam-til-2030-7D46F.html (accessed on 6 November 2023).
  15. Sanchez Rodriguez, R.; Ürge-Vorsatz, D.; Barau, A.S. Sustainable Development Goals and Climate Change Adaptation in Cities. Nat. Clim. Change 2018, 8, 181–183. [Google Scholar] [CrossRef]
  16. Angelo, H.; Wachsmuth, D. Why Does Everyone Think Cities Can Save the Planet? Urban Stud. 2020, 57, 2201–2221. [Google Scholar] [CrossRef]
  17. Seto, K.C.; Fragkias, M.; Güneralp, B.; Reilly, M.K. A Meta-Analysis of Global Urban Land Expansion. PLoS ONE 2011, 6, e23777. [Google Scholar] [CrossRef] [PubMed]
  18. Güneralp, B.; Reba, M.; Hales, B.U.; Wentz, E.A.; Seto, K.C. Trends in Urban Land Expansion, Density, and Land Transitions from 1970 to 2010: A Global Synthesis. Environ. Res. Lett. 2020, 15, 044015. [Google Scholar] [CrossRef]
  19. Hutchings, P.; Willcock, S.; Lynch, K.; Bundhoo, D.; Brewer, T.; Cooper, S.; Keech, D.; Mekala, S.; Mishra, P.P.; Parker, A. Understanding Rural–Urban Transitions in the Global South through Peri-Urban Turbulence. Nat. Sustain. 2022, 5, 924–930. [Google Scholar] [CrossRef]
  20. Pang, M.; Binder, C.R.; Golay, F. Urban Sustainability Assessment in Geneva: Relevance of the Local Neighbourhood Unit. Environ. Plan. B Urban Anal. City Sci. 2022, 49, 1757–1774. [Google Scholar] [CrossRef]
  21. Riach, N.; Glaser, R.; Fila, D.; Lorenz, S.; Fünfgeld, H. Climate Risk Archetypes. Identifying Similarities and Differences of Municipal Risks for the Adaptation Process Based on Municipalities in Baden-Wuerttemberg, Germany. Clim. Risk Manag. 2023, 41, 100526. [Google Scholar] [CrossRef]
  22. Braun, A.; Warth, G.; Bachofer, F.; Schultz, M.; Hochschild, V. Mapping Urban Structure Types Based on Remote Sensing Data—A Universal and Adaptable Framework for Spatial Analyses of Cities. Land 2023, 12, 1885. [Google Scholar] [CrossRef]
  23. Sharifi, A. Resilient Urban Forms: A Macro-Scale Analysis. Cities 2019, 85, 1–14. [Google Scholar] [CrossRef]
  24. Marwal, A.; Silva, E.A. Exploring Residential Built-up Form Typologies in Delhi: A Grid-Based Clustering Approach towards Sustainable Urbanisation. Npj Urban Sustain. 2023, 3, 40. [Google Scholar] [CrossRef]
  25. Vetter-Gindele, J.; Braun, A.; Warth, G.; Bui, T.T.Q.; Bachofer, F.; Eltrop, L. Assessment of Household Solid Waste Generation and Composition by Building Type in Da Nang, Vietnam. Resources 2019, 8, 171. [Google Scholar] [CrossRef]
  26. Li, M.; van Vliet, J.; Ke, X.; Verburg, P.H. Mapping Settlement Systems in China and Their Change Trajectories between 1990 and 2010. Habitat Int. 2019, 94, 102069. [Google Scholar] [CrossRef]
  27. Taubenböck, H.; Debray, H.; Qiu, C.; Schmitt, M.; Wang, Y.; Zhu, X.X. Seven City Types Representing Morphologic Configurations of Cities across the Globe. Cities 2020, 105, 102814. [Google Scholar] [CrossRef]
  28. Goldblatt, R.; Deininger, K.; Hanson, G. Utilizing Publicly Available Satellite Data for Urban Research: Mapping Built-up Land Cover and Land Use in Ho Chi Minh City, Vietnam. Dev. Eng. 2018, 3, 83–99. [Google Scholar] [CrossRef]
  29. Wu, Y.; Zhang, X.; Shen, L. The Impact of Urbanization Policy on Land Use Change: A Scenario Analysis. Cities 2011, 28, 147–159. [Google Scholar] [CrossRef]
  30. Xu, G.; Jiao, L.; Liu, J.; Shi, Z.; Zeng, C.; Liu, Y. Understanding Urban Expansion Combining Macro Patterns and Micro Dynamics in Three Southeast Asian Megacities. Sci. Total Environ. 2019, 660, 375–383. [Google Scholar] [CrossRef] [PubMed]
  31. Thinh, N.X.; Arlt, G.; Heber, B.; Hennersdorf, J.; Lehmann, I. Evaluation of Urban Land-Use Structures with a View to Sustainable Development. Environ. Impact Assess. Rev. 2002, 22, 475–492. [Google Scholar] [CrossRef]
  32. Moon, K.D.; Downes, N.K.; Rujner, H.; Storch, H. Adaptation of the Urban Structure Type Approach for Vulnerability Assessment of Climate Change Risks in Ho Chi Minh City. In Proceedings of the 45th ISOCARP Congress, Porto, Portugal, 18–22 October 2009. [Google Scholar]
  33. Downes, N.K.; Storch, H. Current Constraints and Future Directions for Risk Adapted Land-Use Planning Practices in the High-Density Asian Setting of Ho Chi Minh City. Plan. Pract. Res. 2014, 29, 220–237. [Google Scholar] [CrossRef]
  34. Nguyen, T.B.; Samsura, D.A.A.; van der Krabben, E.; Le, A.-D. Saigon-Ho Chi Minh City. Cities 2016, 50, 16–27. [Google Scholar] [CrossRef]
  35. Acolin, A.; Kim, A.M. Seeing Informal Settlements: The Policy Implications of Different Techniques to Identify Urban Growth Patterns from Satellite Imagery Using the Case of Informal Construction in Ho Chi Minh City; SSRN: Rochester, NY, USA, 2017. [Google Scholar]
  36. Katzschner, A.; Schwartze, F.; Thanh, B.; Schmidt, M. Introduction to Ho Chi Minh City. In Sustainable Ho Chi Minh City: Climate Policies for Emerging Mega Cities; Katzschner, A., Waibel, M., Schwede, D., Katzschner, L., Schmidt, M., Storch, H., Eds.; Springer International Publishing: Cham, Switzerland, 2016; pp. 5–17. ISBN 978-3-319-04614-3. [Google Scholar]
  37. Duy, P.N.; Chapman, L.; Tight, M.; Linh, P.N.; Thuong, L.V. Increasing Vulnerability to Floods in New Development Areas: Evidence from Ho Chi Minh City. Int. J. Clim. Change Strateg. Manag. 2018, 10, 197–212. [Google Scholar] [CrossRef]
  38. Leitold, R.; Diez, J.R. Exposure of Manufacturing Firms to Future Sea Level Rise in Ho Chi Minh City, Vietnam. J. Maps 2019, 15, 13–20. [Google Scholar] [CrossRef]
  39. Thompson, C.N.; Zelner, J.L.; Nhu, T.D.H.; Phan, M.V.; Le, P.H.; Thanh, H.N.; Thuy, D.V.; Nguyen, N.M.; Manh, T.H.; Minh, T.V.H. The Impact of Environmental and Climatic Variation on the Spatiotemporal Trends of Hospitalized Pediatric Diarrhea in Ho Chi Minh City, Vietnam. Health Place 2015, 35, 147–154. [Google Scholar] [CrossRef] [PubMed]
  40. Do, A.; Tran, H.; Do, T. Impacts of Urbanization on Heat in Ho Chi Minh, Southern Vietnam Using U-Net Model and Remote Sensing. Int. J. Environ. Sci. Technol. 2023, 1–16. [Google Scholar] [CrossRef]
  41. Gibert-Flutre, M.; Musil, C. Ho Chi Minh City, a Metropolitan Playing Field. Introduction. EchoGéo 2020. [Google Scholar] [CrossRef]
  42. Ho Chi Minh City Statistical Office. Statistical Yearbook of Ho Hi Minh City 2020; Nhà Xuất Bản Tổng Hợp Tp.: Ho Chi Minh City, Vietnam, 2020.
  43. Bolay, J.-C.; Cartoux, S.; Cunha, A.; Du, T.T.N.; Bassand, M. Sustainable Development and Urban Growth: Precarious Habitat and Water Management in Ho Chi Minh City, Vietnam. Habitat Int. 1997, 21, 185–197. [Google Scholar] [CrossRef]
  44. Downes, N.K.; Storch, H.; Schmidt, M.; Nguyen, T.C.V.; Dinh, L.C.; Tran, T.N.; Hoa, L.T. Understanding Ho Chi Minh City’s Urban Structures for Urban Land-Use Monitoring and Risk-Adapted Land-Use Planning. In Sustainable Ho Chi Minh City: Climate Policies for Emerging Mega Cities; Katzschner, A., Waibel, M., Schwede, D., Katzschner, L., Schmidt, M., Storch, H., Eds.; Springer International Publishing: Cham, Switzerland, 2016; pp. 89–116. ISBN 978-3-319-04614-3. [Google Scholar]
  45. Dang, N.A. The Mega-Urban Transformations of Ho Chi Minh City in the Era of Doi Moi Renovation. In MegaUrban Regions in Pacific-Asia: Urban Dynamics in a Global Era; NUS Press: Singapore, 2008; pp. 185–213. [Google Scholar]
  46. Nicholls, R.J.; Wong, P.P.; Burkett, V.; Woodroffe, C.D.; Hay, J. Climate Change and Coastal Vulnerability Assessment: Scenarios for Integrated Assessment. Sustain. Sci. 2008, 3, 89–102. [Google Scholar] [CrossRef]
  47. Storch, H.; Downes, N.K. A Scenario-Based Approach to Assess Ho Chi Minh City’s Urban Development Strategies against the Impact of Climate Change. Cities 2011, 28, 517–526. [Google Scholar] [CrossRef]
  48. Storch, H.; Downes, N.K.; Nguyen, X.T.; Thamm, H.-P.; Ho, L.P.; Thuc, T.; Nguyen, T.H.T.; Emberger, G.; Goedecke, M.; Welsch, J.; et al. Adaptation Planning Framework to Climate Change for the Urban Area of Ho Chi Minh City, Vietnam. In Proceedings of the Fifth Urban Research Symposium Cities and Climate Change: Responding to an Urgent Agenda, Marseille, France, 28–30 June 2009. [Google Scholar]
  49. Scussolini, P.; Tran, T.V.T.; Koks, E.; Diaz-Loaiza, A.; Ho, P.L.; Lasage, R. Adaptation to Sea Level Rise: A Multidisciplinary Analysis for Ho Chi Minh City, Vietnam. Water Resour. Res. 2017, 53, 10841–10857. [Google Scholar] [CrossRef]
  50. Vishwanath, H.T.; Sairam, N.; Yang, L.E.; Garschagen, M.; Kreibich, H. Identifying the Drivers of Private Flood Precautionary Measures in Ho Chi Minh City, Vietnam. Nat. Hazards Earth Syst. Sci. 2023, 23, 1125–1138. [Google Scholar] [CrossRef]
  51. Birkmann, J.; Garschagen, M.; Kraas, F.; Quang, N. Adaptive Urban Governance: New Challenges for the Second Generation of Urban Adaptation Strategies to Climate Change. Sustain. Sci. 2010, 5, 185–206. [Google Scholar] [CrossRef]
  52. Doan, V.Q.; Kusaka, H. Projections of Urban Climate in the 2050s in a Fast-growing City in Southeast Asia: The Greater Ho Chi Minh City Metropolitan Area, Vietnam. Int. J. Climatol. 2018, 38, 4155–4171. [Google Scholar] [CrossRef]
  53. Ho, L.P. Impacts of Climate Changes and Urbanisation on Urban Inundation in Ho Chi Minh City. In Proceedings of the 11th International Conference on Urban Drainage, Edinburgh, Scotland, 31 August–5 September 2008. [Google Scholar]
  54. Asian Development Bank. Ho Chi Minh City Adaptation to Climate Change; Summary Report; Asian Development Bank: Manila, Philippines, 2010. [Google Scholar]
  55. Thuc, T.; Van Thang, N.; Huong, H.T.L.; Van Khiem, M.; Hien, N.X.; Phong, D.H. Climate Change and Sea Level Rise Scenarios for Vietnam; Ministry of Natural resources and Environment: Hanoi, Vietnam, 2016.
  56. Storch, H.; Downes, N.; Katzschner, L.; Thinh, N.X. Building Resilience to Climate Change Through Adaptive Land Use Planning in Ho Chi Minh City, Vietnam. In Resilient Cities; Otto-Zimmermann, K., Ed.; Springer: Dordrecht The Netherlands, 2011; pp. 349–363. ISBN 978-94-007-0784-9. [Google Scholar]
  57. Scheiber, L.; David, C.G.; Hoballah, J.M.; Visscher, J.; Nguyen, H.Q.; Leitold, R.; Revilla Diez, J.; Schlurmann, T. Low-Regret Climate Change Adaptation in Coastal Megacities–Evaluating Large-Scale Flood Protection and Small-Scale Rainwater Detention Measures for Ho Chi Minh City, Vietnam. Nat. Hazards Earth Syst. Sci. 2022, 2022, 2333–2347. [Google Scholar] [CrossRef]
  58. Scheiber, L.; Hoballah, J.M.; Jordan, C.; Visscher, J.; Nguyen, H.Q.; Schlurmann, T. The Potential of Open-Access Data for Flood Estimations: Uncovering Inundation Hotspots in Ho Chi Minh City, Vietnam, through a Normalized Flood Severity Index. Nat. Hazards Earth Syst. Sci. 2023, 23, 2313–2332. [Google Scholar] [CrossRef]
  59. Rujner, H.; Goedecke, M. Urban Water Management: Spatial Assessment of the Urban Water Balance. In Sustainable Ho Chi Minh City: Climate Policies for Emerging Mega Cities; Springer: Cham, Switzerland, 2016; pp. 133–150. [Google Scholar]
  60. Balk, D.L.; Nghiem, S.V.; Jones, B.R.; Liu, Z.; Dunn, G. Up and out: A Multifaceted Approach to Characterizing Urbanization in Greater Saigon, 2000–2009. Landsc. Urban Plan. 2019, 187, 199–209. [Google Scholar] [CrossRef]
  61. Jordan, C.; Tiede, J.; Lojek, O.; Visscher, J.; Apel, H.; Nguyen, H.Q.; Quang, C.N.X.; Schlurmann, T. Sand Mining in the Mekong Delta Revisited—Current Scales of Local Sediment Deficits. Sci. Rep. 2019, 9, 17823. [Google Scholar] [CrossRef] [PubMed]
  62. Yue, W.; Chen, Y.; Thy, P.T.M.; Fan, P.; Liu, Y.; Zhang, W. Identifying Urban Vitality in Metropolitan Areas of Developing Countries from a Comparative Perspective: Ho Chi Minh City versus Shanghai. Sustain. Cities Soc. 2021, 65, 102609. [Google Scholar] [CrossRef]
  63. Ha, H.; Wong, T.-C. Economic Reforms and the New Master Plan of Ho Chi Minh City, Vietnam: Implementation Issues and Policy Recommendations. GeoJournal 1999, 49, 301–309. [Google Scholar] [CrossRef]
  64. Government of Vietnam. Decision No. 24/QD-TTg of the Prime Minister of Government Dated January 06, 2010 on Approving the Adjustment of the General Planning of Ho Chi Minh City Construction to 2025; Government of Vietnam: Hanoi, Vietnam, 2010. (In Vietnamese)
  65. Government of Vietnam. (1528/QĐ-TTg 2021) Decision No. 1528/QĐ-TTg of the Prime Minister of Government Dated September 14, 2021 Approving the Adjustment Mission of the Ho Chi Minh City Master Plan to 2040, with a Vision toward 2060); Government of Vietnam: Hanoi, Vietnam, 2021. (In Vietnamese)
  66. Zhu, J. Development of Sustainable Urban Forms for High-Density Low-Income Asian Countries: The Case of Vietnam: The Institutional Hindrance of the Commons and Anticommons. Cities 2012, 29, 77–87. [Google Scholar] [CrossRef]
  67. World Bank Group. Vietnam Affordable Housing: A Way Forward; World Bank: Washington, DC, USA, 2015. [Google Scholar]
  68. Nguyen, H.T.B.; Miller, N.G.; Pham, N.K.; Truong, H.T. Flood Risk and Buyer Search Behavior in Ho Chi Minh City. Int. J. Hous. Mark. Anal. 2021, 15, 895–909. [Google Scholar] [CrossRef]
  69. Seo, D.; Kwon, Y. In-Migration and Housing Choice in Ho Chi Minh City: Toward Sustainable Housing Development in Vietnam. Sustainability 2017, 9, 1738. [Google Scholar] [CrossRef]
  70. Vinh, N.Q.; Leaf, M. City Life in the Village of Ghosts: A Case Study of Popular Housing in Ho Chi Minh City, Vietnam. Habitat Int. 1996, 20, 175–190. [Google Scholar] [CrossRef]
  71. Thinh, N.K.; Kamalipour, H.; Gao, Y. Mapping the Emerging Forms of Informality: A Comparative Morphogenesis of Villages-in-the-City in Vietnam. Habitat Int. 2023, 138, 102864. [Google Scholar] [CrossRef]
  72. Chi, H.C.; Phuoc, T.; Minh, P.; Hung, N.T. Management Challenges of Spontaneous Settlements in Ho Chi Minh City, Vietnam: A Case Study at Thoi Tam Thon County. Vietnam. J. Soc. Sci. Humanit. 2016, 2, 575. [Google Scholar]
  73. Decree 64/2012/ND-CP Granting Construction Permits. Available online: https://thuvienphapluat.vn/van-ban/Xay-dung-Do-thi/Nghi-dinh-64-2012-ND-CP-cap-giay-phep-xay-dung-147255.aspx (accessed on 26 October 2023).
  74. Gibert, M. Rethinking Metropolitan Production from Its Underside: A View from the Alleyways of Hồ Chí Minh City. Environ. Plan. A 2018, 50, 589–607. [Google Scholar] [CrossRef]
  75. Dang, H.T.; Pitts, A. Urban Morphology and Outdoor Microclimate around the “Shophouse” Dwellings in Ho Chi Minh City, Vietnam. Buildings 2020, 10, 40. [Google Scholar] [CrossRef]
  76. Martin, V. Die Häuser von Saigon. Bauwelt 2001, 92, 30–39. [Google Scholar]
  77. Weinberger, N. The Shophouse as a Tool for Equitable Urban Development: The Case of Phnom Penh, Cambodia. Master’s Thesis, University of Pennsylvania, Philadelphia, PA, USA, 2010. [Google Scholar]
  78. Hoang, A.T.; Apparicio, P.; Pham, T.T.H. The Provision and Accessibility to Parks in Ho Chi Minh City: Disparities along the Urban Core—Periphery Axis. Urban Sci. 2019, 3, 37. [Google Scholar] [CrossRef]
  79. Resolution 80/NQ-CP 2018 Adjusting Land Use Planning of Ho Chi Minh City. Available online: https://thuvienphapluat.vn/van-ban/Bat-dong-san/Nghi-quyet-80-NQ-CP-2018-dieu-chinh-quy-hoach-su-dung-dat-cua-thanh-pho-Ho-Chi-Minh-385083.aspx (accessed on 26 October 2023).
  80. Downes, N.K. Climate Adaptation Planning: An Urban Structure Type Approach for Understanding the Spatiotemporal Dynamics of Risks in Ho Chi Minh City, Vietnam. Ph.D. Thesis, BTU Cottbus-Senftenberg, Brandenburg, Germany, 2019. [Google Scholar]
  81. Vietnam Urbanization Review: Technical Assistance Report (English); World Bank Group: Washington, DC, USA, 2011.
  82. The United Nations Human Settlements Programme. Vietnam Housing Sector Profile; UN Human Settlements Program: Nairobi, Kenya, 2014. [Google Scholar]
  83. The United Nations Human Settlements Programme. Metadata on SDGs Indicator 11.1. 1 Indicator Category: Tier II; UN Human Settlements Program: Nairobi, Kenya, 2018. [Google Scholar]
  84. Lerner, A.M.; Eakin, H. An Obsolete Dichotomy? Rethinking the Rural–Urban Interface in Terms of Food Security and Production in the Global South. Geogr. J. 2011, 177, 311–320. [Google Scholar] [CrossRef]
  85. Bren d’Amour, C.; Reitsma, F.; Baiocchi, G.; Barthel, S.; Güneralp, B.; Erb, K.-H.; Haberl, H.; Creutzig, F.; Seto, K.C. Future Urban Land Expansion and Implications for Global Croplands. Proc. Natl. Acad. Sci. USA 2017, 114, 8939–8944. [Google Scholar] [CrossRef]
  86. Vu, M.H.; Kawashima, H. Effects of Urban Expansion on Suburban Farmers’ Livelihood in Vietnam: A Comparative Analysis of Ho Chi Minh City and Hanoi. Habitat Int. 2017, 65, 49–58. [Google Scholar] [CrossRef]
  87. van Vliet, J. Direct and Indirect Loss of Natural Area from Urban Expansion. Nat. Sustain. 2019, 2, 755–763. [Google Scholar] [CrossRef]
  88. Nguyen, Q.; Kim, D.-C. Farmers’ Landholding Strategy in Urban Fringe Areas: A Case Study of a Transitional Commune near Ho Chi Minh City, Vietnam. Land Use Policy 2019, 83, 95–104. [Google Scholar] [CrossRef]
  89. Gomes, E.; Banos, A.; Abrantes, P.; Rocha, J.; Kristensen, S.B.P.; Busck, A. Agricultural Land Fragmentation Analysis in a Peri-Urban Context: From the Past into the Future. Ecol. Indic. 2019, 97, 380–388. [Google Scholar] [CrossRef]
  90. Rujner, H.; Goedecke, M.; Storch, H.; Moon, K.; Downes, N. GIS-Basierte Kopplung Des Abflussbildungsmodells ABIMO Mit Dem Stadtstrukturellen Planungsinformationssystem von Ho Chi Minh City (Vietnam). Angew. Geoinformatik 2010, 545–551. [Google Scholar]
  91. Katzschner, L. The Urban Climate as a Parameter for Urban Development. Energy Build. 1988, 11, 137–147. [Google Scholar] [CrossRef]
  92. Katzschner, A.; Diem, N.K.; Dang, T.H.; Downes, N.K. The Challenge of Cooling Rapidly Growing Cities: The Case of Densification and Peri-Urbanisation in Ho Chi Minh City and Adaptation Responses. In Climate Change and Cooling Cities; Springer: Singapore, 2023; pp. 115–127. [Google Scholar]
  93. Schmidt, M.; Katzschner, A.; Downes, N.; Gravert, A.; Burghardt, R.; Storch, H. Urban Development, Climate Change, and Associated Risks in Ho Chi Minh City: Vulnerabilities and Adaptation Challenges for a Rapidly Growing Megacity. In Institutional and Social Innovation for Sustainable Urban Development; Routledge: Oxfordshire, UK, 2013; pp. 180–192. [Google Scholar]
  94. Zasada, I. Multifunctional Peri-Urban Agriculture—A Review of Societal Demands and the Provision of Goods and Services by Farming. Land Use Policy 2011, 28, 639–648. [Google Scholar] [CrossRef]
  95. Sutton, P.C.; Anderson, S.J.; Costanza, R.; Kubiszewski, I. The Ecological Economics of Land Degradation: Impacts on Ecosystem Service Values. Ecol. Econ. 2016, 129, 182–192. [Google Scholar] [CrossRef]
  96. Schaefer, M.; Thinh, N.X. Evaluation of Land Cover Change and Agricultural Protection Sites: A GIS and Remote Sensing Approach for Ho Chi Minh City, Vietnam. Heliyon 2019, 5, e01773. [Google Scholar] [CrossRef] [PubMed]
  97. Kontgis, C.; Schneider, A.; Fox, J.; Saksena, S.; Spencer, J.H.; Castrence, M. Monitoring Peri-Urbanization in the Greater Ho Chi Minh City Metropolitan Area. Appl. Geogr. 2014, 53, 377–388. [Google Scholar] [CrossRef]
  98. Truong, H.T.; Truong, T.T.; Son, T.T. Housing and Transportation in Vietnam’s Ho Chi Minh City: Case Studies in Social Urban Development; Friedrich-Ebert-Stiftung Vietnam Office: Hanoi, Vietnam, 2017. [Google Scholar]
  99. Jung, S.; Huynh, D.; Rowe, P.G. The Pattern of Foreign Property Investment in Vietnam: The Apartment Market in Ho Chi Minh City. Habitat Int. 2013, 39, 105–113. [Google Scholar] [CrossRef]
  100. Bagan, H.; Yamagata, Y. Landsat Analysis of Urban Growth: How Tokyo Became the World’s Largest Megacity during the Last 40 Years. Remote Sens. Environ. 2012, 127, 210–222. [Google Scholar] [CrossRef]
  101. Airgood-Obrycki, W.; Hanlon, B.; Rieger, S. Delineate the U.S. Suburb: An Examination of How Different Definitions of the Suburbs Matter. J. Urban Aff. 2021, 43, 1263–1284. [Google Scholar] [CrossRef]
  102. Nong, D.H.; Fox, J.M.; Saksena, S.; Lepczyk, C.A. The Use of Spatial Metrics and Population Data in Mapping the Rural-Urban Transition and Exploring Models of Urban Growth in Hanoi, Vietnam. Environ. Urban. ASIA 2021, 12, 156–168. [Google Scholar] [CrossRef]
  103. Lasage, R.; Veldkamp, T.I.; De Moel, H.; Van, T.C.; Phi, H.L.; Vellinga, P.; Aerts, J. Assessment of the Effectiveness of Flood Adaptation Strategies for HCMC. Nat. Hazards Earth Syst. Sci. 2014, 14, 1441–1457. [Google Scholar] [CrossRef]
  104. Urban Planning Institute (UPI) HCMC; Nikken Sekkei. The Study on the Adjustment of HCMC Master Plan up to 2025; Report to the Ho Chi Minh City People’s Committee; Asian Development Bank: Mandaluyong, Philippines, 2007. [Google Scholar]
  105. Yarina, L. Your Sea Wall Won’t Save You. Negotiating Rhetorics and Imaginaries of Climate Resilience. Places J. 2018. [Google Scholar] [CrossRef] [PubMed]
  106. Thinh, N.T.P.; Kim, T.T.; Phung, N.K. Assessment of the Influence of Urban Flood in Thu Duc City in the Period of Planning. J. Hydro-Meteorol. 2023, 17, 62–76. [Google Scholar]
  107. Simon, D. Peri-Urbanization. In The Palgrave Encyclopedia of Urban and Regional Futures; Springer: Cham, Switzerland, 2023; pp. 1250–1254. [Google Scholar]
  108. Friedmann, J. Becoming Urban: Periurban Dynamics in Vietnam and China—Introduction. Pac. Aff. 2011, 84, 425–434. [Google Scholar] [CrossRef]
  109. Novotný, J.; Chakraborty, S.; Maity, I. Urban Expansion of the 43 Worlds’ Largest Megacities: A Search for Unified Macro-Patterns. Habitat Int. 2022, 129, 102676. [Google Scholar] [CrossRef]
  110. Chakraborty, S.; Dadashpoor, H.; Novotnỳ, J.; Maity, I.; Follmann, A.; Patel, P.P.; Roy, U.; Pramanik, S. In Pursuit of Sustainability–Spatio-Temporal Pathways of Urban Growth Patterns in the World’s Largest Megacities. Cities 2022, 131, 103919. [Google Scholar] [CrossRef]
  111. Mahtta, R.; Fragkias, M.; Güneralp, B.; Mahendra, A.; Reba, M.; Wentz, E.A.; Seto, K.C. Urban Land Expansion: The Role of Population and Economic Growth for 300+ Cities. Npj Urban Sustain. 2022, 2, 5. [Google Scholar] [CrossRef]
  112. Chakraborty, S.; Maity, I.; Dadashpoor, H.; Novotnẏ, J.; Banerji, S. Building in or out? Examining Urban Expansion Patterns and Land Use Efficiency across the Global Sample of 466 Cities with Million+ Inhabitants. Habitat Int. 2022, 120, 102503. [Google Scholar] [CrossRef]
  113. Follmann, A.; Kennedy, L.; Pfeffer, K.; Wu, F. Peri-Urban Transformation in the Global South: A Comparative Socio-Spatial Analytics Approach. Reg. Stud. 2023, 57, 447–461. [Google Scholar] [CrossRef]
  114. Latour, B. On Actor-Network Theory: A Few Clarifications. Soz. Welt 1996, 4, 369–381. [Google Scholar]
  115. Farías, I. The Politics of Urban Assemblages. City 2011, 15, 365–374. [Google Scholar] [CrossRef]
  116. Farías, I.; Bender, T. Urban Assemblages: How Actor-Network Theory Changes Urban Studies; Routledge: Oxfordshire, UK, 2012; ISBN 1-135-20273-7. [Google Scholar]
  117. Simandan, D. Competition, Contingency, and Destabilization in Urban Assemblages and Actor-Networks. Urban Geogr. 2018, 39, 655–666. [Google Scholar] [CrossRef]
  118. Simandan, D. Competition, Delays, and Coevolution in Markets and Politics. Geoforum 2019, 98, 15–24. [Google Scholar] [CrossRef]
  119. Robinson, J. Comparative Urbanism: Tactics for Global Urban Studies; John Wiley & Sons: Hoboken, NJ, USA, 2022; ISBN 1-119-69755-7. [Google Scholar]
  120. Cvetinovic, M.; Nedovic-Budic, Z.; Bolay, J.-C. Decoding Urban Development Dynamics through Actor-Network Methodological Approach. Geoforum 2017, 82, 141–157. [Google Scholar] [CrossRef]
  121. Karaman, O.; Sawyer, L.; Schmid, C.; Wong, K.P. Plot by Plot: Plotting Urbanism as an Ordinary Process of Urbanisation. Antipode 2020, 52, 1122–1151. [Google Scholar] [CrossRef]
  122. Gibert, M.; Pham, T.S. Understanding the Vietnamese Urban Fabric from the inside: A View from Hanoi and Ho Chi Minh City Alleyway Neighbourhoods. IIAS Newsl. 2016, 73, 32–33. [Google Scholar]
  123. Matsumura, S.; Hoa, N.T.; Kien, T.T. New Approach and Issues for the Urban Planning System in Vietnam-The Practice of the Newly Formulated Urban Planning Regulations in Ho Chi Minh City. Urban Reg. Plan. Rev. 2017, 4, 58–70. [Google Scholar]
  124. Kim, H.K. Speculating on World-Class Transportation Infrastructure in Ho Chi Minh City; ISEAS Publishing: Singapore, 2017. [Google Scholar]
  125. Kim, H.M. Foreign Direct Investment and Urban Growth in Vietnam: Spatial, Economic, and Demographic Perspectives. Asian Geogr. 2023, 1–18. [Google Scholar] [CrossRef]
  126. Webster, D. On the Edge: Shaping the Future of Peri-Urban East Asia; Asia/Pacific Research Center: Stanford, CA, USA, 2002. [Google Scholar]
  127. Ahani, S.; Dadashpoor, H. A Review of Domains, Approaches, Methods and Indicators in Peri-Urbanization Literature. Habitat Int. 2021, 114, 102387. [Google Scholar] [CrossRef]
  128. Follmann, A.; Willkomm, M.; Dannenberg, P. As the City Grows, What Do Farmers Do? A Systematic Review of Urban and Peri-Urban Agriculture under Rapid Urban Growth across the Global South. Landsc. Urban Plan. 2021, 215, 104186. [Google Scholar] [CrossRef]
  129. Wolff, S.; Mdemu, M.V.; Lakes, T. Defining the Peri-Urban: A Multidimensional Characterization of Spatio-Temporal Land Use along an Urban–Rural Gradient in Dar Es Salaam, Tanzania. Land 2021, 10, 177. [Google Scholar] [CrossRef]
  130. Sahana, M.; Ravetz, J.; Patel, P.P.; Dadashpoor, H.; Follmann, A. Where Is the Peri-Urban? A Systematic Review of Peri-Urban Research and Approaches for Its Identification and Demarcation Worldwide. Remote Sens. 2023, 15, 1316. [Google Scholar] [CrossRef]
  131. Pham, V.-M.; Van Nghiem, S.; Van Pham, C.; Luu, M.P.T.; Bui, Q.-T. Urbanization Impact on Landscape Patterns in Cultural Heritage Preservation Sites: A Case Study of the Complex of Huế Monuments, Vietnam. Landsc. Ecol. 2021, 36, 1235–1260. [Google Scholar] [CrossRef]
  132. Van Anh, T.T.; Doi, N.M.; Diem, D.V.B.; Binh, Q.M.Q.; Thanh, N.N.D.; Linh, N.T.C.; Thuy, D.T.T. Inequalities between Peri-Urban and Urban Areas in Urbanization Process of Ho Chi Minh City: An Urban Political-Ecology Perspective. Ho Chi Minh City Open Univ. J. Sci. Soc. Sci. JS 2018, 8, 48–67. [Google Scholar] [CrossRef]
  133. Huynh, D. Phu My Hung New Urban Development in Ho Chi Minh City: Only a Partial Success of a Broader Landscape. Int. J. Sustain. Built Environ. 2015, 4, 125–135. [Google Scholar] [CrossRef]
  134. Zhao, P. Too Complex to Be Managed? New Trends in Peri-Urbanisation and Its Planning in Beijing. Cities 2013, 30, 68–76. [Google Scholar] [CrossRef]
  135. Waibel, M.; Eckert, R.; Bose, M.; Volker, M. Housing for Low Income Groups in Ho Chi Minh City, between Re-Integration and Fragmentation. Asien 2007, 103, 59. [Google Scholar]
  136. Dapice, D.; Gomez-Ibanez, J.A.; Nguyen, X.T. Ho Chi Minh City: The Challenges of Growth; United Nations Development Programme in Vietnam: Hanoi, Vietnam, 2009. [Google Scholar]
  137. Coit, K. Housing Policy and Slum Upgrading in Ho-Chi-Minh City. Habitat Int. 1998, 22, 273–280. [Google Scholar] [CrossRef]
  138. Ngo, L.M. Social Housing for Workers–A New Housing Model for Ho Chi Minh City, Vietnam; IOP Publishing: Bristol, UK, 2018; Volume 143, p. 012060. [Google Scholar]
  139. Ahmed, I.; Sager, J.; Cuong, L.V. Sustainable Low-Income Urban Housing in Vietnam: Context and Strategies. Open House Int. 2010, 35, 56–65. [Google Scholar] [CrossRef]
  140. Decree, No. 62/2011/ND-CP on the Establishment of Provincial Cities, Towns, Urban in Vietnam. Available online: https://thuvienphapluat.vn/van-ban/EN/Bo-may-hanh-chinh/Decree-No-62-2011-ND-CP-on-the-establishment-of-provincial-cities-towns-urban/129980/tieng-anh.aspx (accessed on 27 October 2023).
  141. Resolution 1210/2016/UBTVQH13 Classifies Urban Areas. Available online: https://thuvienphapluat.vn/van-ban/Xay-dung-Do-thi/Nghi-quyet-1210-2016-UBTVQH13-phan-loai-do-thi-316418.aspx (accessed on 27 October 2023).
  142. Decree, No. 42/2009/ND-CP of the Government: On urban classification. Available online: http://vanban.chinhphu.vn/?pageid=27160&docid=86490 (accessed on 27 October 2023).
  143. Calka, B.; Orych, A.; Bielecka, E.; Mozuriunaite, S. The Ratio of the Land Consumption Rate to the Population Growth Rate: A Framework for the Achievement of the Spatiotemporal Pattern in Poland and Lithuania. Remote Sens. 2022, 14, 1074. [Google Scholar] [CrossRef]
  144. Li, C.; Cai, G.; Sun, Z. Urban Land-Use Efficiency Analysis by Integrating LCRPGR and Additional Indicators. Sustainability 2021, 13, 13518. [Google Scholar] [CrossRef]
  145. Plans to Revive Northwest Urban Area in HCMC | SGGP English Edition. Available online: https://en.sggp.org.vn/plans-to-revive-northwest-urban-area-in-hcmc-post94412.html (accessed on 27 October 2023).
  146. Decision 263/QD-TTg 2022 National Target Program for Building New Rural Areas. Available online: https://thuvienphapluat.vn/van-ban/Xay-dung-Do-thi/Quyet-dinh-263-QD-TTg-2022-Chuong-trinh-muc-tieu-quoc-gia-xay-dung-nong-thon-moi-505023.aspx (accessed on 27 October 2023).
  147. Faltmann, N.K. Urban Gardening in Ho Chi Minh City: Class, Food Safety Concerns, and the Crisis of Confidence in Farming. Food Cult. Soc. 2023, 26, 927–944. [Google Scholar] [CrossRef]
  148. Thu, T.T.; Perera, R. Consequences of the Two-Price System for Land in the Land and Housing Market in Ho Chi Minh City, Vietnam. Habitat Int. 2011, 35, 30–39. [Google Scholar]
  149. Leaf, M. New Urban Frontiers: Periurbanization and (Re) Territorialization in Southeast Asia. In The Design of Frontier Spaces; Routledge: Oxfordshire, UK, 2016; pp. 193–212. [Google Scholar]
  150. Acolin, A.; Kim, A.M. Algorithmic Justice and Groundtruthing the Remote Mapping of Informal Settlements: The Example of Ho Chi Minh City’s Periphery. Environ. Plan. B Urban Anal. City Sci. 2022, 49, 151–168. [Google Scholar] [CrossRef]
  151. Storch, H.; Downes, N.; Goedecke, M.; Katzschner, L.; Welsch, J.; Rujner, H. Land-Use Planning Recommendations. In Adaptation Strategies for a changing climate in Ho Chi Minh City. Summary for Decision-Makers. Upon request of the Planning Division, Department of Natural Resources and Environment Ho Chi Minh City; Brandenburgische Technische Universität, IKMZ-Universitätsbibliothek: Cottbus, Germany, 2012. [Google Scholar]
  152. Hawken, S.; Avazpour, B.; Harris, M.S.; Marzban, A.; Munro, P.G. Urban Megaprojects and Water Justice in Southeast Asia: Between Global Economies and Community Transitions. Cities 2021, 113, 103068. [Google Scholar] [CrossRef]
  153. Carter, J.G. Urban Climate Change Adaptation: Exploring the Implications of Future Land Cover Scenarios. Cities 2018, 77, 73–80. [Google Scholar] [CrossRef]
  154. Winter, A.K.; Karvonen, A. Climate Governance at the Fringes: Peri-Urban Flooding Drivers and Responses. Land Use Policy 2022, 117, 106124. [Google Scholar] [CrossRef]
  155. Sawyer, L.; Schmid, C.; Streule, M.; Kallenberger, P. Bypass Urbanism: Re-Ordering Center-Periphery Relations in Kolkata, Lagos and Mexico City. Environ. Plan. A Econ. Space 2021, 53, 675–703. [Google Scholar] [CrossRef]
  156. Harms, E. Saigon’s Edge: On the Margins of Ho Chi Minh City; University of Minnesota Press: Minneapolis, MN, USA, 2011; ISBN 0-8166-5605-3. [Google Scholar]
  157. Harms, E. Luxury and Rubble: Civility and Dispossession in the New Saigon; University of California Press: Oakland, CA, USA, 2016; ISBN 0-520-96601-5. [Google Scholar]
  158. Musil, C.; Simon, C. La Construction d’un Réseau de Transport En Commun Ambitieux à Ho Chi Minh-Ville (Viêt-Nam); PADDI Working Papers. Available online: https://virtual-saigon.net/References/Bibliography?ID=3161 (accessed on 20 October 2023).
  159. Gibert, M. Les Ruelles de Hồ Chí Minh Ville, Việt Nam. Trame Viaire et Recomposition Des Espaces Publics. The Alleyways of Hồ Chí Minh City (Việt Nam). Street Patterns and Evolution of Ordinary Public Spaces. Unpublished Ph.D. Thesis, University of Paris, Paris, France, 2014. [Google Scholar]
  160. Labbé, D.; Musil, C. Periurban Land Redevelopment in Vietnam under Market Socialism. Urban Stud. 2014, 51, 1146–1161. [Google Scholar] [CrossRef]
  161. Douglass, M.; Huang, L. Globalizing the City in Southeast Asia: Utopia on the Urban Edge–the Case of Phu My Hung, Saigon. Ijaps 2007, 3, 1–42. [Google Scholar]
  162. Le, T.T.H.; Le, T.T.H. Privatization of Neighborhood Governance in Transition Economy: A Case Study of Gated Community in Phu My Hung New Town, Ho Chi Minh City, Vietnam. GeoJournal 2018, 83, 783–801. [Google Scholar] [CrossRef]
  163. Kim, D.Y. A Study on the Characteristics of the Planned New Town Apartments in Vietnam-Focusing on the Ho Chi Minh City the Phu My Hung Area. Korean Inst. Inter. Des. J. 2016, 25, 101–111. [Google Scholar]
  164. Waibel, M. The Development of Saigon South New Urban Area-A Sign of an Increasing Internalization and Polarization in Vietnamese Society. Pac. News 2004, 22, 10–12. [Google Scholar]
  165. Huynh, D. The Misuse of Urban Planning in Ho Chi Minh City. Habitat Int. 2015, 48, 11–19. [Google Scholar] [CrossRef]
  166. Waibel, M. Ho Chi Minh City–a Mega-Urban Region in the Making. Geogr. Rundsch. Int. Ed. 2009, 5, 30–38. [Google Scholar]
  167. Tran, T.N. Improvement of Flood Risk Assessment under Climate Change in Ho Chi Minh City with GIS Applications. Ph.D. Thesis, BTU Cottbus-Senftenberg, Brandenburg, Germany, 2014. [Google Scholar]
  168. Binh, L.T.H.; Umamahesh, N.V.; Rathnam, E.V. High-Resolution Flood Hazard Mapping Based on Nonstationary Frequency Analysis: Case Study of Ho Chi Minh City, Vietnam. Hydrol. Sci. J. 2019, 64, 318–335. [Google Scholar] [CrossRef]
  169. Ngo, L.M.; Kieu, L.T.; Hoang, H.-Y.; Nguyen, H.B. Experiences of Housing Adapted to Sea Level Rise and Applicability for Houses in the Can Gio District, Ho Chi Minh City, Vietnam. Sustainability 2020, 12, 3743. [Google Scholar] [CrossRef]
  170. Ngo, L.M.; Vo, D.C.; Kieu, L.T.; Diep, P.T.N.; Hoang, H.Y. Urban Flooding in the Context of Climate Change in Ho Chi Minh City: A Case Study of Nha Be District. In Urban Transformational Landscapes in the City-Hinterlands of Asia: Challenges and Approaches; Springer: Singapore, 2023; pp. 325–343. [Google Scholar]
  171. Duffy, C.E.; Braun, A.; Hochschild, V. Surface Subsidence in Urbanized Coastal Areas: PSI Methods Based on Sentinel-1 for Ho Chi Minh City. Remote Sens. 2020, 12, 4130. [Google Scholar] [CrossRef]
  172. Cao, A.; Esteban, M.; Valenzuela, V.P.B.; Onuki, M.; Takagi, H.; Thao, N.D.; Tsuchiya, N. Future of Asian Deltaic Megacities under Sea Level Rise and Land Subsidence: Current Adaptation Pathways for Tokyo, Jakarta, Manila, and Ho Chi Minh City. Curr. Opin. Environ. Sustain. 2021, 50, 87–97. [Google Scholar] [CrossRef]
  173. Minh, D.H.T.; Van Trung, L.; Le Toan, T. Mapping Ground Subsidence Phenomena in Ho Chi Minh City through the Radar Interferometry Technique Using ALOS PALSAR Data. Remote Sens. 2015, 7, 8543–8562. [Google Scholar] [CrossRef]
  174. Kuenzer, C.; Tuan, V.Q. Assessing the Ecosystem Services Value of Can Gio Mangrove Biosphere Reserve: Combining Earth-Observation-and Household-Survey-Based Analyses. Appl. Geogr. 2013, 45, 167–184. [Google Scholar] [CrossRef]
  175. Pham, L.T.; Vo, T.Q.; Dang, T.D.; Nguyen, U.T. Monitoring Mangrove Association Changes in the Can Gio Biosphere Reserve and Implications for Management. Remote Sens. Appl. Soc. Environ. 2019, 13, 298–305. [Google Scholar] [CrossRef]
  176. Quan, N.H.; Linh, H.T.P. Transformative Adaptation and Social Justice in Ho Chi Minh City, Vietnam; United Nations Research Institute for Social Development: Geneva, Switzerland, 2020. [Google Scholar]
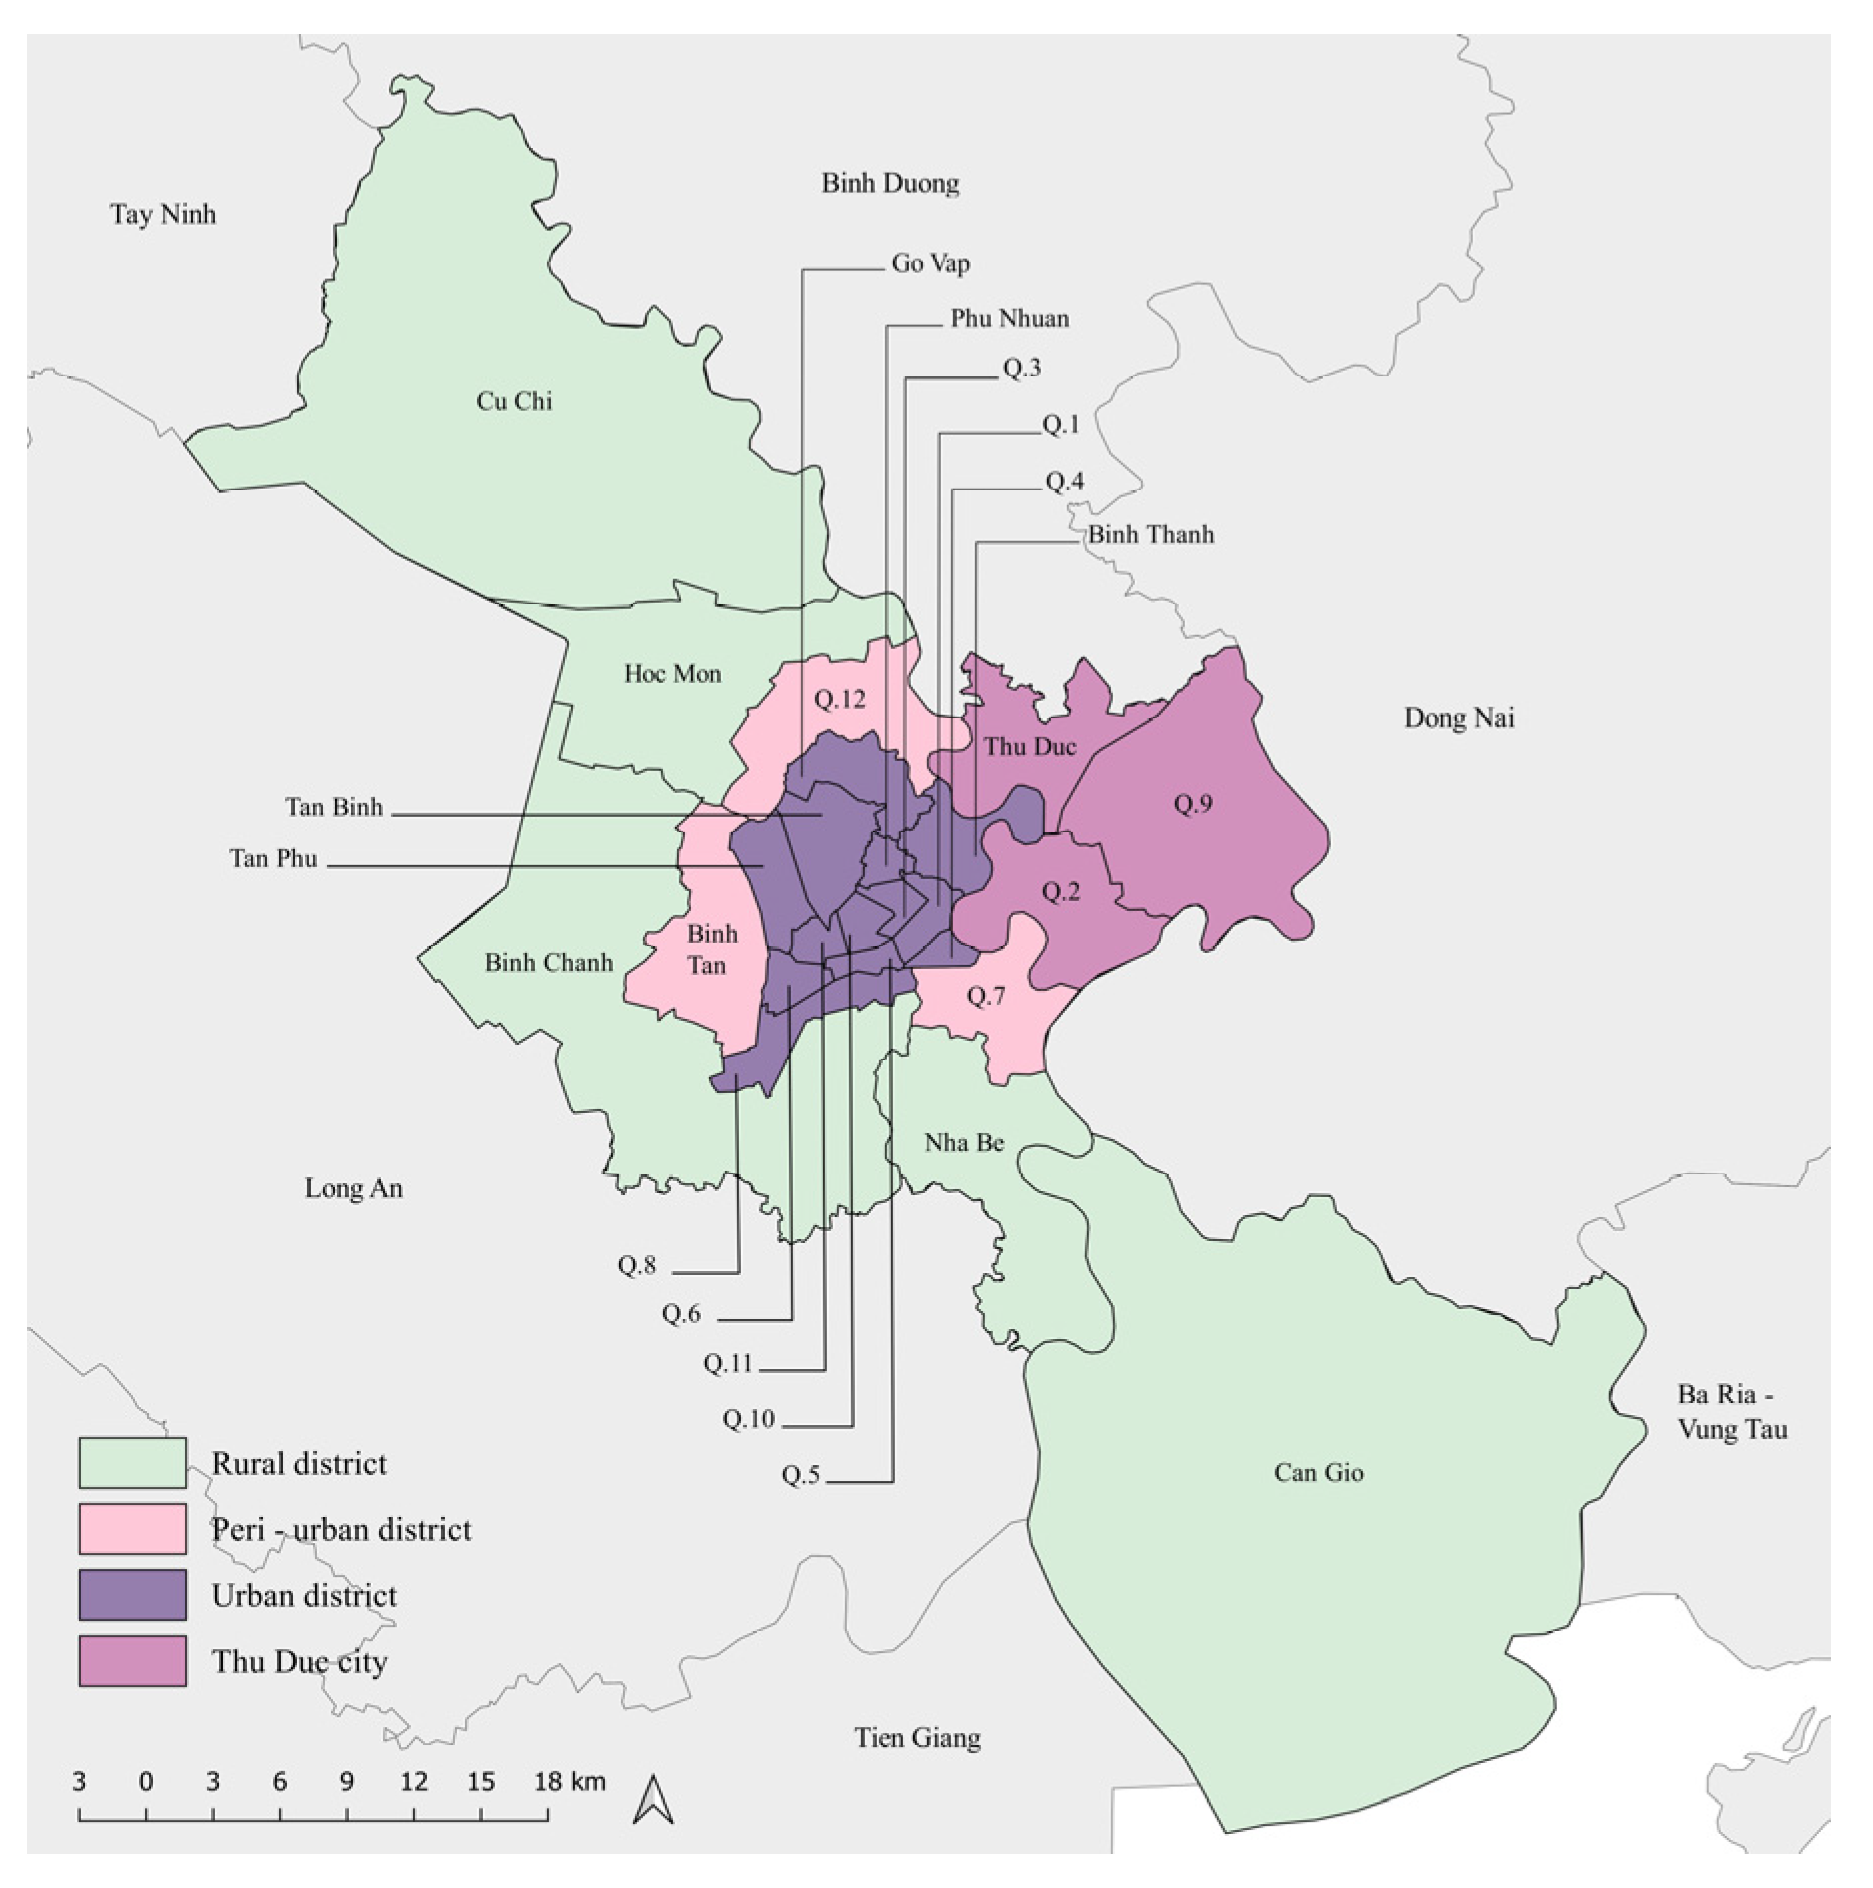
Figure 1. Map of Ho Chi Minh City depicting the city’s districts.
Urbansci 08 00011 g001
Figure 2. A comparison of urban block layouts: Shophouse urban regular in Tan Quy ward. District 7 (left) and Shophouse urban irregular in Ward 1. Phu Nhuan district (right) archetypes in Ho Chi Minh City (Google Earth).
Urbansci 08 00011 g002
Figure 3. Photograph taken from the District 7 bank of the Kenh Te Canal, looking towards District 4, the Saigon River, and District 2, with Binh Thanh in the background.
Urbansci 08 00011 g003
Figure 4. The emerging skyline of Binh Thanh district. The Vinhome Central Park apartment development and the Landmark 81 skyscraper–completed in 2016 and 2018, respectively—can be seen in the background.
Urbansci 08 00011 g004
Figure 5. Mapped urban structure types for Ho Chi Minh City for the year 2020 over the entire administrative area.
Urbansci 08 00011 g005
Figure 6. The dominant 16 observed urban structure type groups for Ho Chi Minh City.
Urbansci 08 00011 g006
Figure 7. Comparisons between the 16 classified urban structure type groups for Ho Chi Minh City in the years 2010 and 2020.
Urbansci 08 00011 g007
Figure 8. Calculated net residential density at the urban block level for Ho Chi Minh City in 2010 and 2020 (unit pers./ha).
Urbansci 08 00011 g008
Figure 9. Areas at risk of flooding in Ho Chi Minh City.
Urbansci 08 00011 g009
Figure 10. Alluvial chart visualising the main urban development transitions in Ho Chi Minh City between 2010 and 2020. We represented only the changed fraction of green and open urban structure types for visualisation purposes.
Urbansci 08 00011 g010
Figure 11. Mapped urban development pathways in Ho Chi Minh City for the period 2010–2020.
Urbansci 08 00011 g011
Figure 12. Alluvial charts illustrating the main UST transitions between 2010 and 2020 for the northwest development corridor of Ho Chi Minh City. From left to right: the share of natural and social infrastructures decreases with loss of green and open spaces, whilst engineered and institutional infrastructures grow with increased built-up and population densities.
Urbansci 08 00011 g012
Figure 13. Waffle charts illustrating the changes in the residential mix between 2010 and 2020 along the northwest development corridor of Ho Chi Minh City. Each cell within the individual 10 by 10 grid represents 1%, whilst the number in brackets indicates the percentage share of residential area to total area. RLCR/RPGR is the ratio of Residential Land Consumption Rate to net Residential Population Growth Rate between 2010 and 2020. This corridor reveals a monocentric structure. Population increased along this development corridor in absolute terms by 1,024,300 persons, excluding the urban core growth of 257,470 persons.
Urbansci 08 00011 g013
Figure 14. Rural to urban plot-by-plot transition pathways in 10-year incremental stages based upon extrapolation on the analysed UST changes from 2010 to 2020.
Urbansci 08 00011 g014
Figure 15. Alluvial charts illustrating observed development between 2010 and 2020 along the eastern development corridor of Ho Chi Minh City. Recent residential development in Thu Duc district. is more related to plot-by-plot development and densification, yet public and industry developments are reflective of bypass urbanisation.
Urbansci 08 00011 g015
Figure 16. Waffle charts illustrating the changes in the residential mix for the former districts that make up Thu Duc City between 2010 and 2020 along the eastern development corridor of Ho Chi Minh City. Each cell within the individual 10 by 10 grid represents 1%, whilst the number in brackets indicates the percentage share of residential area to total area. RLCR/RPGR is the ratio of Residential Land Consumption Rate to net Residential Population Growth Rate between 2010 and 2020. Recent residential development in Thu Duc district is reflective of plot-by-plot development and densification. Population increased along this development corridor in absolute terms by 324,060 persons.
Urbansci 08 00011 g016
Figure 17. Alluvial charts illustrating observed development between 2010 and 2020 along the southern development corridor of Ho Chi Minh City.
Urbansci 08 00011 g017
Figure 18. Waffle charts illustrating the changes in the residential mix between 2010 and 2020 along the southern development corridor of Ho Chi Minh City. Each cell within the individual 10 by 10 grid represents 1%, whilst the number in brackets indicates the percentage share of residential area to total area. RLCR/RPGR is the ratio of Residential Land Consumption Rate to net Residential Population Growth Rate between 2010 and 2020. Population increased along this development corridor in absolute terms by 224,300 persons.
Urbansci 08 00011 g018
Table 1. Historical administrative classifications of Ho Chi Minh City’s districts.
Characteristics DistrictsRemarks
Urban area (existing inner urban districts)
14,200 ha
Districts 1, 3, 5, 6The historical urban core area HCMC (formally Saigon and Cho lon)
Districts 4, 8, 10, 11, Binh Thanh, and Phu NhuanAdjacent districts surrounding the historical core
Go Vap, Tan Binh, and Tan Phu
districts
Outermost area of the urban core
Peri-urban (Peripheral area, expanded urban areas, rapidly urbanising peri-urban district)
35,200 ha
Thu Duc cityMerger of districts 2, 9, and Thu Duc
12, 7, and Binh Tan Expansion from inner core
Rural area (outer rural districts, peri-urban districts)
160,200 ha
Hoc Mon, Binh Chanh, Nha Be, Cu Chi, and Can GioThe outer districts
Cu Chi and Can Gio districts Outermost area to the north and south of the core
Table 2. Change in classified urban structure type categories 2010–2020.
20102020Change 2010⁠–2020
(ha)(%)(ha)(%)(ha)(%)
Residential 36,263.017.349,951.123.813,688.237.7
Shophouse urban regular4035.51.95705.32.71669.841.4
Shophouse urban irregular 5258.22.510,400.65.05142.597.8
Shophouse peri-urban 10,010.24.720,202.39.610,187.1101.8
Villa232.50.1380.70.2148.263.7
Apartment 351.20.2881.90.4530.7151.1
Rural 14,575.47.09418.74.5−5156.7−35.4
Central business district113.30.1121.30.18.07.0
Public and commercial5319.42.56538.23.11218.822.9
Industry4936.12.47187.93.42251.845.6
Green and open space 107,439.251.390,280.443.1−17,158.8−16.0
Total built-up area46,518.522.263,677.330.417,158.836.9
Disclaimer/Publisher’s Note: The statements, opinions and data contained in all publications are solely those of the individual author(s) and contributor(s) and not of MDPI and/or the editor(s). MDPI and/or the editor(s) disclaim responsibility for any injury to people or property resulting from any ideas, methods, instructions or products referred to in the content.

