

A Global Estimate of the Size and Location of Informal Settlements


1
Institute of Management in Latin America, University of St. Gallen, 9000 St. Gallen, Switzerland
2
Faculty of Geo-Information Science and Earth Observation (ITC), University of Twente, 7522 NB Enschede, The Netherlands
3
Program in Environmental Design, University of Colorado Boulder, Boulder, CO 80309, USA
*
Author to whom correspondence should be addressed.
Urban Sci. 2024, 8(1), 18; https://doi.org/10.3390/urbansci8010018
Submission received: 1 November 2023
/
Revised: 21 December 2023
/
Accepted: 26 February 2024
/
Published: 5 March 2024
Abstract
:Slums are a structural feature of urbanization, and shifting urbanization trends underline their significance for the cities of tomorrow. Despite their importance, data and knowledge on slums are very limited. In consideration of the current data landscape, it is not possible to answer one of the most essential questions: Where are slums located? The goal of this study is to provide a more nuanced understanding of the geography of slums and their growth trajectories. The methods rely on the combination of different datasets (city-level slum maps, world cities, global human settlements layer, Atlas of Informality). Slum data from city-level maps form the backbone of this research and are made compatible by differentiating between the municipal area, the urbanized area, and the area beyond. This study quantifies the location of slums in 30 cities, and our findings show that only half of all slums are located within the administrative borders of cities. Spatial growth has also shifted outwards. However, this phenomenon is very different in different regions of the world; the municipality captures less than half of all slums in Africa and the Middle East but almost two-thirds of all slums in cities of South Asia. These insights are used to estimate land requirements within the Sustainable Development Goals time frame. In 2015, almost one billion slum residents occupied a land area as large as twice the size of the country of Portugal. The estimated 380 million residents to be added up to 2030 will need land equivalent to the size of the country of Egypt. This land will be added to cities mainly outside their administrative borders. Insights are provided on how this land demand differs within cities and between world regions. Such novel insights are highly relevant to the policy actions needed to achieve Target 11.1 of the Sustainable Development Goals (“by 2030, ensure access for all to adequate, safe and affordable housing and basic services, and upgrade slums”) as interventions targeted at slums or informal settlements are strongly linked to political and administrative boundaries. More research is needed to draw attention to the urban expansion of cities and the role of slums and informal settlements.
1. Introduction
Slums are a recurring feature of urbanization [1] and “represent one of the most enduring faces of poverty, inequality, exclusion, and deprivation” [2]. While their manifestation is almost synonymous with the global south, substandard housing is not entirely confined to this world region. Slums are complex realities and differ significantly around the world. Consequently, ideas about slums are broad and context-specific, and many local understandings of slums exist [3]. While the term slum is by now so established in the international development discourse that it is challenging—if not impossible—to replace, the authors are well aware of the power of language and that the term slum has been instrumentalized to justify the worst actions against its residents (making cities “slum-free”) [4].
UN-Habitat is the international body that aggregates data on slums. Most countries regularly report their national slum numbers, calculated based on a combination of different sources, including censuses and surveys. Based on the available data, it is estimated that there are more than one billion slum-dwellers in the world, resulting from a relatively stable increase in recent decades from 723 million in 1990 to 817 million in 2000 to 928 million in 2014. This increase, partly due to transnational commitment to the Millennium Development Goals (MDG), is lower than the pace of urbanization. As a result, the relative share of slums decreased from 46% in 1990 to 23% in 2014 [5].
Until today, no universal definition has been developed and agreed upon. A widely accepted working definition is provided by UN-Habitat and its framework of household deprivations. The UN-Habitat definition differentiates between five dimensions: insecure residential status, poor structural quality of housing, insufficient living area, inadequate access to safe water, and inadequate access to sanitation infrastructure [6]. The UN-Habitat definition considers a household a slum household if the household lacks one of five dimensions [7].
But what do these numbers represent, and how useful can they be for analyzing the problem? For example, is the current data landscape allowing us to capture housing deprivations worldwide to their fullest extent?
While the above dimensions define slums, housing deprivation is not limited to insufficient space, non-permanent structures, and a lack of water, sanitation, and hygiene [8,9]. Missing health facilities can reduce life expectancy. Inaccessible or unaffordable transport options suppress access to economic opportunities [3,9]. Open public spaces and community facilities are also scarce in slum settlements. Such areas might be subject to air pollution and water and soil contamination and susceptible to multiple hazards.
Due to the limitation of current data collection, several initiatives aim to provide more comprehensive international data on slums. The Integrated Deprived Area “Slum” Mapping System (IDEAMAPS) [9,10] is one of the most promising initiatives, with a long-term vision to reach 200 case cities [4]. It assesses the multiple deprivations of slums by combining different data collection methods (censuses, surveys, field-based mapping, human image interpretation, and machine image classification) to provide a more comprehensive picture of slum realities. Punctual case study research has revealed a wide gap between deprived areas and officially recognized slums [11]. The upscaling of this framework can potentially address most of the identified shortcomings of current data collection [9]. However, data will only be available in a few years and will most likely impact only the transnational agreement that follows the Sustainable Development Goals (SDG).
Our research proposes a different take and focuses on generating additional insights into slum dynamics worldwide based on already-available data. While UN-habitat equates slums with housing deprivations, household surveys and community mapping collect qualitative information to establish a more nuanced understanding of sub-standardness that might be informed by the working definition of UN-Habitat or by a more local understanding of what comprises deprivation for housing units and/or neighborhoods. Slum mapping based on Earth observation focuses on built-up features. Slums are principally identified by their irregular form and high densities (for a more detailed discussion, see Section 2) in comparison to other parts of the city. While the ways in which slums are defined and identified differ, the results remain compatible if we apply a more open concept of slums, understood as larger deprived areas (neighborhoods).
The contribution of this paper to the existing literature gap is a more differentiated understanding of slum locations within and around urban areas. This paper provides a first account of where slums are and how they grow within cities. Finally, this analysis is part of a work in progress that shall activate several levers to improve the depth of available data sources.
The remainder of the paper is structured as follows. In Section 2, the materials and methods are outlined by discussing different data sources and their strengths and limitations, from UN-Habitat and community maps to Earth-observation-based slum maps and the Atlas of Informality. In Section 3, our approach, which combines these various sources and structures them with a spatial framework derived from the world cities layer and global human settlement layer, is outlined. Results are presented in Section 4 and include the relative share of slums within the municipality, the urban area, and the areas beyond. These insights are used to calculate land requirements for slums within the SDG timeframe, presented in Section 5. After addressing the relevance and limitations of the research, Section 6 is dedicated to a conclusion.
2. Materials and Methods
2.1. The Challenge of Slums and the Need for Data
Several trends underscore a global demand for data on slums. Slums concentrate in cities of the global south; presently, around 98% of all slums are found in this region [12]. Ninety percent of all people added in the next 30 years will be residents of African or Asian cities [2]. These two world regions also concentrate most of all slum-dwellers in the world. While two out of three slum-dwellers reside in Asia, Africa is home to the highest concentration of slum-dwellers (as a share of the total urban population). In Sub-Saharan Africa, the slum population represents 56.2% of all urban residents, while the rest of the global south ranges between 20.9 and 31.2%. Slums comprise more than half of the urban population in more than 40 countries. Six countries (all in Sub-Saharan Africa) have more than 80% of their urban population residing in slums [6]. Consequently, addressing major urban development challenges on a global scale will essentially entail answers to the question of slums and informal urbanization.
Available data also indicate a worsening situation-even without considering the impact of the COVID-19 pandemic. The most recent slum population numbers are from 2018 and show an increase in absolute terms (from 928 to 1034 million) and a relative increase (from 23% to 24%) since 2014 [4]. The impact of the global pandemic and its recovery still needs to unfold fully. Still, evidence suggests that the urban poor and slum-dwellers are disproportionately hit by the global pandemic and its economic repercussions [13,14]. It is estimated that in comparison to 2018, an additional half a billion people might fall into poverty [15], which should provide a considerable push for informal urbanization and slum formation.
The question arises where such slums will be formed. Generally, no consistent spatial data on the location of slums is available. SDG 11.1.1 (“proportion of urban population living in slums, informal settlements or inadequate housing”) is a Tier I indicator, which means that the indicator is well defined with an established methodology and data are regularly reported by at least 50% of the countries where the indicator is relevant.
These reported data take the form of national aggregates with a high level of uncertainty. UN-Habitat data [5] do not provide spatial data for countries or individual cities. In addition to the efforts of national governments, local actors (e.g., non-governmental organizations or local governments) conduct household surveys across many cities. These surveys are often based on samples that cover a small percentage of slums and might even exclude slum areas that are not officially recognized.
The current data landscape on slums is limited and only allows for an abstract understanding of slum occurrences in the world, without consideration of where the population is located within a given country or city. Our research started with the question of what insights can be derived by combining currently available data on slums. In the following sub-chapter, we outline the most important data sources.
2.2. Data Sources on Slums
2.2.1. UN-Habitat
The first data source for slum population remains with UN-Habitat. The international organization releases data for reporting countries in the form of total slum population and the share of slum population (of the total urban population). While the data on national scale represent a valuable source to inform urban policies and agenda-setting within the Millennium Development Goals (MDG) and the Sustainable Development Goals, there are some limitations. First, the UN-Habitat data rely on national governments to report information. While the number of reporting states increased considerably, only 125 national figures are currently available. Furthermore, the housing deprivation of tenure insecurity (one of the five housing deprivations) is hardly covered in census and survey practices and is excluded from consideration.
The reported national data also rely on estimates and not on actual enumerations. UN-Habitat calculates slum estimates from household surveys, such as demographic and health surveys, multiple-indicator cluster surveys, or national survey initiatives. Recent studies have revealed that the current sources used to quantify slums are structurally underestimating the slum population, as sample sizes are often based on outdated census data and smaller slum pockets are generally difficult include in current data collection methods [11]. Another concern is in relation to the available data format. UN-Habitat releases slum numbers for the entire population despite data being collected mainly at the household level. Besides the demographic insights, there are almost no possibilities to further analyze the data. No spatial or detailed household data are available.
On the city level, no comprehensive overview of the slum population is obtainable. UN-Habitat initiated the City Prosperity Index (CPI) to address the relative absence of urban data. The current CPI covers 333 cities from 49 countries, mainly in primary cities and excluding many low-income countries, but not every city reports all indicators. Information on the slum population is available for 283 cities in 46 countries. Alternatively, demographic and health surveys have made household surveys more obtainable as the new data portal allows for the computing of city-level slum households for a predefined geography. This workflow is time-intensive and will be considered in fine-tuning our approach in the future.
2.2.2. Household Surveys and Slum Community Maps
Household surveys and community mapping have been born out of the information vacuum and the necessity for communities to make their needs visible. Since state agencies fail to map or abstain from mapping informal settlements’ living conditions, the most effective way to gather reliable data is the self-mapping of communities [16,17]. This self-mapping produces precise information on living conditions. The community itself benefits from an empowerment that emanates from the self-identification process as well as the mapping data. However, community maps often emerge haphazardly in a neighborhood or, in a few cases, on the scale of a city, without consistency across areas and communities. As most maps reflect local needs, the generalization of community mapping is limited.
Another mapping methodology is single-case selection; these are the maps created by scholars, non-governmental organizations, and/or municipalities with a focus on either the city or the neighborhood [18,19]. While these exercises may provide very detailed information, the single-case selection has the traditional problem of generalizing findings inherent to case-study methodologies. Methods of measurement differ substantially from city to city. Even within a single city, informal settlement definitions may vary depending on the year of measurement [20]. The main challenge of community-based mapping remains their upscaling. Informal settlement profiles have been carried out at a broader scale by Slum Dwellers International (the Know Your City campaign covered 18 countries). In order to protect the residents, these data are not accessible on an aggregate level. Furthermore, the profiles are still geographically limited to a few countries in Africa and Asia.
2.2.3. EO-Based Mapping
In the last decade, various research and mapping initiatives have produced spatial data of slums using multiple mapping techniques, ranging from the manual delineation of very-high-resolution satellite images to artificial intelligence (AI)-based models [21,22,23,24]. However, most of these maps are not produced as routine data. Typically, such data are created for one time only and are not updated. Furthermore, mappers do not interact (well) with local slum communities for validating their data [24]. The collected information is not easily accessible as it is often scattered across different research repositories. Making such maps publicly available involves uncertainties and also has high ethical risks. Detailed slum maps represent a wealth of information that authorities can misuse to coordinate hostile actions toward communities.
Earth observation (EO) data (e.g., very-high-resolution satellite images) and advancements in AI methods also allow us to localize and characterize slum areas. Slums can be distinguished from planned urban areas in satellite images by identifying their specific morphological features, e.g., small building sizes, high densities, and irregular built-up patterns (Figure 1 and Figure 2). The major challenges for the production of EO-based slum maps on a larger scale relate to the diversity of such areas across geographies (regions, countries, even cities). The Urban Center database lists more than 13,000 urban centers with a population of more than 50,000 inhabitants [25]. A major challenge of EO-based mapping is obtaining representative training and validation samples that cover this extensive range of slum realities. Another challenge stems from the high temporal dynamics of slum areas that would require frequent updates in order to be captured. Local stakeholders in rapidly growing cities require annually updated maps [26]. As most researchers work with commercial, very-high-resolution data (high data costs up to EUR 20 per km2), high temporal granularity is often not financially possible. While shifting to freely accessible satellite images (e.g., Sentinel images) circumvents this problem, these images have a lower spatial resolution (maximum 10 m) and render the detection of small slum pockets impossible.
A major advantage of EO map is its flexibility in terms of its mapping extent (as long as data are available and accessible). Looking beyond municipal boundaries allows for the production of slum maps for metropolitan and/or continuous built-up are, which may help to shed light on the slum dynamics in sub-urban and peri-urban areas. In recent years, several research initiatives have made their locally trained and validated slum maps publicly accessible [27]. The increasing availability of such information allowed us to obtain a number of such EO maps [28].
2.2.4. Atlas of Informality
The Atlas of Informality (AoI) is a recent initiative that aims at mapping individual slums/informal settlements across the world. AoI uses boundaries of settlements at a neighborhood scale confirmed by researchers or relevant institutions. Each settlement is geolocated, and its boundaries are retraced from high-resolution satellite images. The boundaries are established for two moments in time: the closest available moment and one 15–20 years ago [29]. So far, 455 areas have been mapped, which are distributed over 102 countries covering 188 cities. The entire dataset is publicly available. The AoI represents a good database for comparing regions and countries. The comparison over time is unlocked due to the use of the same methodology for all settlements. A limitation of the AoI is that it does not provide sufficient coverage for all world cities. Insights are further curtailed by its limited capacity to connect to citywide and national slum numbers.
All of the described datasets on slums have their strengths and limitations. Furthermore, each dataset provides only a fragmented view of the occurrence of slums and their spatial and demographic growth. However, it is possible to provide scientific estimates on such issues by combining the above-outlined sources.
3. Method
The main aim of this study is to connect different available datasets to generate new spatial insights on slums. These insights could enrich the current debate based on very uncertain global estimations (e.g., used for the SDG 11.1.1 indicator reporting). When combining information from multiple cities, it is imperative to establish a common reference framework. This framework starts with a standard definition of cities/urban areas. What is considered a city differs significantly between countries, as national definitions may range from 200 to 300 inhabitants in some Scandinavian countries to 50,000 to 100,000 residents in some Asian countries. A second and complementary possibility to establish a common analytical framework lies in the administrative borders of cities. For both, we used global databases to derive spatial information for each case study city.
3.1. Global Databases on Cities
The Global Administrative Areas database [30] includes the administrative layers of all countries, including municipalities. However, the decision on the level that corresponds with the municipal extent differs between countries and would require local knowledge. Therefore, we used the consistent world cities layer (WCL), a delineation of the city extent that corresponds well with the municipal extent. This layer contains the location as well as population estimates of 3598 cities in the world.
We used the WCL to identify the main municipality associated with the urban area of a given slum map. However, there are some limitations. First, such a global database of cities might differ from locally defined city limits. Second, the administrative city extent can represent only a fraction of the actual urban extent (see later in this paper), and the literature stresses the importance of the outskirts/peri-urban areas for slum growth [31]. Therefore, we needed to add another layer to delineate the boundaries of cities in terms of continuous built-up areas. We used the Urban Center database of the global human settlement layer (GHSL), which eliminates the problem of local differences, definitions, and data processing practices.
3.2. Global Human Settlements Layer
The global human settlement layer (GHSL) provides a consistent global delineation of built-up areas. This layer, combined with a global population model (GHS-POP, which uses the CIESIN GPWv4 data, a global census database for large administrative units), provides a global delineation of urban centers [17].
The urban center database includes all the urban centers of at least 50,000 inhabitants with a consistent delineation using the global human settlement layer (GHSL) by the European Commission, Joint Research Center [32]. The GHSL provides a global and multi-temporal built-up dataset (GHS-BUILT) based on the Landsat time series. The GHS-BUILT is publicly available for four moments in time using the Landsat time series: 1975, 1990, 2000, and 2014/15. The highest available spatial resolution is 30 m. The GHS-POP layer [33] combines the GHS-BUILT with population data from CIESIN GPWv4.10.
The result is a gridded population model at 250 m and 1 km resolution. Urban centers are defined as connected built-up areas at a 1 km uniform global grid (which also includes internal open spaces) and are established by considering the population and built-up density, contiguity, and population number thresholds.
The urban center is generally smaller than the metropolitan area as the latter also captures less-dense suburban and semi-rural settlement forms. The GHS Settlement Mode (GHS-SMOD) dataset shows that globally urban centers represent a third of urban built-up areas (Figure 3). This figure differs across world regions, with East Asia and Pacific and Europe and Central Asia having the lowest (around ¼) ratio. The gridded population densities (and other spatially disaggregate data) are only available for urban centers.
3.3. Geo-Referenced Informal Settlement/Slums Maps
The global databases of WCL and GHSL help us establish a common reference framework. City-level slum maps form the core of our analysis. According to practitioners’ insights, such maps have considerably increased in numbers and quality over the last few years. However, accessing them remains a major challenge. Maps are scattered around the world at their respective implementing and/or contracting agencies. Given the level of detail, these maps are also highly sensitive, with a lot of political power.
From January to March 2022, the authors of this study activated their professional network and the so-called Community of Practice on Slum Upgrading to identify as many slum maps as possible (Figure 4). The selection process considered the availability of settlement shapefiles, the scale of data availability (at least on the municipal level), the date of data collection (preference was given to recent maps), and the geographic location (the aim was to cover all world regions).
In total, 30 such maps were obtained at the required level of detail. The sample covers all world regions: there are 13 cities in Latin America and the Caribbean (LAC), 2 in the Middle East and North Africa (MENA), 5 in Sub-Saharan Africa (SSA), 7 in South Asia (SA), and 3 in East Asia and Pacific (EAP). Of the 30 cases, 23 are from different countries, 19 are capital cities, and 26 are large cities (with more than 1,000,000 inhabitants). For more detailed information, see Table 1.
The workflow of the study followed the logic outlined in Figure 5. The obtained slum maps were dissected into different zones by establishing an overlap with WCL (municipal areas) as well as the GHS-BUILT (urban center areas). The area beyond was established by expanding three times the municipal border. The used software allowed for the exporting of the sizes for the urban area as well as the slum areas.
4. Results
The different ways to map slums and informal settlements were outlined in Section 2. Results from surveys, numerations, census-based mapping, and Earth observation [4] cannot be directly compared as the boundaries are different. EO-based approaches focus on entire urban areas, while other means of data collection mostly stop at the municipal border. Maps can also differ depending on who is the executing agency. However, these discrepancies are principally on the level of neighborhood and population data and are less concerned with how settlement boundaries are established.
To make the different maps comparable, we separately calculated the slum areas of EO-based maps for the municipality (Zone 1), in the area between the municipal border and the urban extent (Zone 2), and the area beyond (Zone 3). The decision for these three spatial categories was based on policy concerns (the powers of urban local governments are generally limited to Zone 1).
Ideally, a municipality would be congruent with the urban area of a city, i.e., as administrative, regulatory, and implementation powers vested with legal authority defined the administrative boundaries. Figure 6 clearly shows that this situation is hardly met in reality. The relationship between the area under the municipal authority and the urban center has considerably declined over the years. In 1975, only Asian cities had municipal areas that were smaller than the urban areas; in 2015, this was true for all world regions, with cities in SA and EAP remaining the ones with the worst relationship. Our sample reveals that municipalities only captured 28% of the urban area (with great differences, e.g., from merely 5% in Dhaka to 160% in Buenos Aires). The sample distribution between these two zones also means that slum data in almost half of all cases are only available for a fraction of the entire urban area. This is particularly true for the Asian region, where only 10% of all cases featured a slum map of the entire urban area.
The municipal area’s diminishing role within urban agglomerations may also explain paradoxical research results. If we calculate the growth rates of slums within municipal areas by combining the GHS-BUILT layers of 1975, 2000, and 2015, slum growth seems to have slowed down considerably and almost came to a halt (Table 2). As we shall see further below, growth has not slowed down; it is just taking place beyond the administrative borders of cities.
EO-based maps represent a bit more than half of all cases (16 out of 30). These are unevenly spread—eight in LAC, five in SSA, two in MENA, and one in EAP—without a case in South Asia. Insights from EO-based maps are used to calculate missing data points for the other 14 maps. There are two possibilities to calculate missing data points for slum shares in our sample. Both rely on the insights of the EO-based slum maps that cover the entire urban agglomeration. Given the high degree of uncertainty in the results stemming from our research design, we calculate (i) averages, (ii) minimum, and (iii) maximum values. These values are calculated for each world region and on a global level.
The first and most straightforward approach is to focus on the slum share per geographic location and apply the regional values of Zone 2 to all missing data points. This approach has the disadvantage that it takes less of the specific reality of an urban context into account.
The second approach focuses on how the occurrence of slums changes within a city. We calculate the relative slum share by dividing the area of land occupied by slums by the total area. We calculate this value for Zone 1 and Zone 2 to then compute the rate of change between both. If the values are larger than 1, there are more slums outside than within the administrative border. For values smaller than 1, the opposite is true. The values are above 1 for SSA (4.40) and EAP (1.28) and lower than 1 for LAC (0.71), MENA (0.88), and SA (0.40). Applying these rates to missing values in Zone 2 results in the following slum share averages: LAC, 7.7% (min. 1.4% to max. 19.0%); MENA, 32.6% (2.9%–62.3%); SSA, 22.2% (2.2–59.4%); SA, 20.1%; and EAP, 12.2%. Using insights from the relative slum occurrence (zonal slums/total slums), we can also estimate the slums in Zone 3.
Therefore, we are in a position to answer our research question: Where are slums situated within an urban agglomeration? According to our estimates, the concentration of slums has partly shifted outside the municipal area. This is particularly the case for SAA and MENA cities, where the administrative boundary only captures 30.4% and 46.0% of all slums. Most slum-dwellers within Zone 1 can be found in SA (72.4%), followed by EAP (63.5%) and Latin America (51.9%). Each world region has a particular constellation of slum occurrences in the different zones, as shown in Table 3.
5. Discussion
What do our findings mean for the challenge of slums and the implementation of SDG Target 11.1 (“by 2030, ensure access for all to adequate, safe and affordable housing and basic services, and upgrade slums”)? We can extrapolate our findings per world region by using the GHS urban extent database, which covers 60% of the global urban population. Based on our analysis, we estimate that slums occupied 182,303 sqkm of land (min/max range is 23,654 to 411,094) in 2015, a size twice the size of the country of Portugal. This represents 15.7% of all urban land (8.1% to 32.2%).
There are three ways to project future land requirements. The first option applies current slum shares to projections of the urban population. Based on the available UN-Habitat numbers of the reporting countries, and applying regional averages to missing values [33], the total slum population amounted to 944 million in 2015 [34]. The UN Population Division releases projections for the urban population in 2030 [35]. UN-Habitat generally applies current slum shares to any year in the future. This means that if a specific geography (country or city) has 25% of slum-dwellers in 2015, it will also have 25% in 2030. As the urban population grows in most parts of the world, this also means that the slum population grows based on this projection method. Within the SDG framework, the urban population would grow by around 1.2 billion residents and the slum population by 384.8 million inhabitants, or by 40.8% (Table 4). Assuming the same density as in 2015, These new residents would require another 86,706 sqkm of land (36,998–211,228 sqkm).
A second option uses growth trajectories of the GHS urban extent (see again Table 2). The third option uses the neighborhood database of the Atlas of Informality. The location of the 455 neighborhoods was attributed to Zone 1 to 3, and respective growth rates were calculated. Considering the focus of this database, the sample is biased towards expanding and even strongly growing slums. The numbers are therefore reflective of higher-tier growth rates.
Overall, the annual growth rates show discrepancies. Nevertheless, there are several important insights to extract from the table. In all world regions, the periphery (Zone 2 and 3) grows stronger than the slums in Zone 1. Furthermore, the demographic growth is faster than the spatial one, indicating that densities will increase over time (a trend that differs from the overall urban density that declines over time [36,37]). By all accounts, Africa, and in particular SSA, is the hot spot of spatial growth. This growth principally takes place outside the municipal borders and is outwards directed. By contrast, EAP and SA are the world regions with minimal spatial growth (Table 5).
The land requirements until the end of the SDG framework can be calculated by applying the above growth rates to the average values of slum land in 2015. The growth rates derived from the AoI would project a land requirement almost five times greater than the one based on population projection (1 million vs. 218,000 sqkm). Only 55,200 sqkm of slum land would be needed based on the projections of GHS-BUILT (Table 6).
5.1. Relevance of the Research Findings
This study provides a first estimate of the location of slum residents within urban areas. It highlights a spatial configuration in which municipal areas only capture a portion of the total slums within an urban area. The land occupied by slums is on average 718,700 sqkm, of which 45.2% is to be found within the administrative borders of the local government, 30.4% within the current urban area, and 24.4% in the area beyond. There are considerable differences between world regions: slums in Asia tend to be more centrally located; in MENA and LAC, half of all slums are to be found outside the municipal area; while in Sub-Saharan Africa, this share reaches 70%.
This has considerable implications for the advancement of SDG Target 11.1. Within the SDG timeframe, the slum population would grow by 40.8%. How much land these new residents will require is less conclusive and depends highly on the data used for projections (ranging from 55,200 to 1,050,000 sqkm). Evidence suggests that current growth is concentrated in peripheral areas, leading to a situation where municipalities will only capture 28% of all slums worldwide in 2030—in Africa, more than 80% of all slum residents will live beyond the direct reach of urban local governments. Recent studies have quantified the extent to which urban growth (formal and informal) has been displaced to the urban periphery [37].
Local governments play a fundamental role in urban development; their actions—and inactions—considerably influence the pull and push factors of slum formations [1,8]. Curative interventions to remedy current living conditions in slums—and even more preventive measures—require committed governments, adequate resources, and operational political and administrative systems to execute such programs and projects at the scale of the urban area beyond city boundaries. Committed governments and supportive international communities can make a difference and turn development paths around. Our insights will hopefully be helpful in connecting discussions of slums at different scales and levels of abstraction.
5.2. Limitations and Future Steps
This study combines currently available data on slums to calculate slum land requirements. This research shares the limitations of its source material. The derived numbers are therefore an educated guess. Nevertheless, this study aims to generate insights into slum-related land consumption to advance our understanding that this number is likely to be × rather than 100 × or 1/100 ×.
City-level informal settlement maps form the backbone of our study. However, data are limited and available access is often challenging [29]. To overcome this deficit, we developed a workflow for collecting city-level maps of informal settlements from various sources: local government datasets, community-based mapping, and EO-based delineations. Our sample is biased towards large cities with a greater probability of featuring a larger share of informal residents due to their higher level of attraction (migration). The sample is also geographically unbalanced.
The first extension of this research will be to enlarge the global sample size and cover a greater range of cities. We have also identified national databases on informal settlements (Argentina, Chile, Afghanistan) that could enable a more detailed analysis of the similarities and differences within countries. Future research should aim to integrate spatial population estimates to improve our understanding of demographic dynamics. The demographic and health survey data portal enables the calculation of slum households within a selected geography. While data points are offset to protect the surveyed households, their aggregate value provides a more detailed account of the slum population of a city. Another option is to unlock the potential of the Facebook data that are available for many countries.
6. Conclusions
This paper presents a novel take on estimating the challenge of slums. While recent developments point to a considerable improvement in the current data landscape, a vital question about slums still cannot be answered: Where are slums located? Combining different datasets and using city-level informal settlement maps as a backbone, this study estimates slum occurrences within municipalities, within the rest of the city, and beyond the city limits around the world.
Our research can assert significant policy-relevant findings. Peri-urban growth is important to understanding slum dynamics. We found a significant presence of slums beyond city limits. We expect that currently, only half of all slum residents reside within municipal boundaries, and in the future, seven out of ten will be living in areas outside the direct reach of the local government. The peripheral nature of slums also implies that such areas are not accounted for in official data collection programs and might not benefit from government interventions.
The future of the planet depends more and more on the adequate use of the planet’s limited resources. Continuing to advance urban policy with inadequate data can be of extreme danger to the planet’s most vulnerable populations. More research and dedicated resources should be directed at advancing our understanding of slum growth so decision-makers can make better-informed choices that concern the living realities of more than one billion people.
Author Contributions
Conceptualization, methodology, formal analysis, investigation, resources, data curation: all authors; software; validation: M.K. and J.S.; writing—original draft preparation, writing—review and editing: A.B.-F.; visualization: J.S. All authors have read and agreed to the published version of the manuscript.
Funding
This research received no external funding.
Data Availability Statement
Slum maps are sensitive information, which is one reason for the cumbersome collection process. All data used for this research can be made available upon request to one of the authors based on positive approval from the original source of the data. All other user data are publicly available and stated in the references.
Conflicts of Interest
The authors declare no conflicts of interest.
References
- Boanada-Fuchs, A.; Rohner, L. An International Review of Slum Upgrading Practices: Lessons Learned and Remaining Challenges of Projects and Programs; Global Review Series on Informality 2021; Cities Alliance: Brussels, Belgium, 2021. [Google Scholar]
- UN-Habitat. World Cities Report 2020: The Value of Sustainable Urbanization; United Nations Human Settlement Programme: Nairobi, Kenya, 2020. [Google Scholar]
- UN-Habitat [UNCHS]. The Challenge of Slums, Global Report on Human Settlements; United Nations Human Settlement Programme: Nairobi, Kenya, 2003. [Google Scholar]
- Thomson, D.R.; Kuffer, M.; Boo, G.; Hati, B.; Grippa, T.; Elsey, H.; Linard, C.; Mahabir, R.; Kyobutungi, C.; Maviti, J. Need for an Integrated Deprived Area ‘Slum’ Mapping System (IDEAMAPS) in Low-and Middle-Income Countries (LMICs). Soc. Sci. 2020, 9, 80. [Google Scholar] [CrossRef]
- UN-Habitat. UN-Habitat Urban Data Site, UN-Habitat Urban Indicators Database. 2022. Available online: https://data.unhabitat.org (accessed on 18 December 2023).
- UN-Habitat. Housing for All: The Challenges of Affordability, Accessibility and Sustainability; United Nations Human Settlement Programme: Nairobi, Kenya, 2008. [Google Scholar]
- UN-Habitat. A Practical Guide to Designing, Planning, and Executing Citywide Slum Upgrading Programmes; United Nations Human Settlement Programme: Nairobi, Kenya, 2014. [Google Scholar]
- Boanada-Fuchs, A. The Challenge of Slums—An Overview of Past Approaches to Tackle It; Global Review Series on Informality 2021; Cities Alliance: Brussels, Belgium, 2021. [Google Scholar]
- Abascal, A.; Rothwell, N.; Shonowo, A.; Thomson, D.R.; Elias, P.; Elsey, H.; Yeboah, G.; Kuffer, M. Domains of Deprivation Framework’ for Mapping Slums. Informal Settlements. and Other Deprived Areas in LMICs to Improve Urban Planning and Policy: A Scoping Review. Comput. Environ. Urban Syst. 2022, 93, 101770. [Google Scholar] [CrossRef]
- Shah, P.; Hamilton, E.; Armendaris, F.; Lee, H. World-Inclusive Cities Approach Paper; The World Bank: Washington, DC, USA, 2015. [Google Scholar]
- Thomson, D.R.; Merodio, P.; Kuffer, M.; Juarez, J.; Jacquin, C. Toolkit: Operationalising the IDEAMAPS Approach in Government; IdeaMaps Network: Mexico City, Mexico, 2021; Available online: https://ideamapsnetwork.org/toolkit-goverment (accessed on 18 December 2023).
- UN-STATS. The Sustainable Development Goals Report. United Nations Statistics Division. 2018. Available online: https://unstats.un.org/sdgs/report/2018/overview (accessed on 18 December 2023).
- Duque Franco, I.; Ortiz, C.; Samper, J.; Millan, G. Mapping Repertoires of Collective Action Facing the COVID-19 Pandemic in Informal Settlements in Latin American Cities. Environ. Urban. 2020, 32, 523–546. [Google Scholar] [CrossRef]
- Smit, W. COVID-19 and Informality—Good Practices for Reducing Risk and Enhancing Resilience; Global Review Series on Informality 2021; Cities Alliance: Brussels, Belgium, 2021. [Google Scholar]
- Sethi, M.; Creutzig, F. COVID-19 Recovery and the Global Urban Poor. Urban Sustain. 2021, 1, 23. [Google Scholar] [CrossRef]
- Patel, A.; Crooks, A.; Koizumi, N. Simulating Spatio-Temporal Dynamics of Slum Formation in Ahmedabad, India. Sixth Urban Res. Knowl. Symp. 2012, 2012, 352–387. [Google Scholar]
- Hasan, A. Orangi Pilot Project: The Expansion of Work beyond Orangi and the Mapping of Informal Settlements and Infrastructure. Environ. Urban. 2006, 18, 451–480. [Google Scholar] [CrossRef]
- Hagen, E. Mapping Change: Community Information Empowerment in Kibera (Innovations Case Narrative: Map Kibera. Innov. Technol. Gov. Glob. 2011, 6, 69–94. [Google Scholar] [CrossRef]
- Kamalipour, H. Urban Morphologies in Informal Settlements. Contour Agency/Agents Urban. 2016, 1, 60–75. [Google Scholar] [CrossRef]
- Samper, J. Urban Upgrading in a Context of Violence: Perceptions of Security and Physical Space in the Case of the Favela-Bairro in Rio de Janeiro. Int. Relat. Dipl. 2016, 4, 760–778. [Google Scholar] [CrossRef]
- Duque, J.C.; Patino, J.E.; Betancourt, A. Exploring the Potential of Machine Learning for Automatic Slum Identification from VHR Imagery. Remote Sens. 2017, 9, 895. [Google Scholar] [CrossRef]
- Wurm, M.; Taubenböck, H. Detecting Social Groups from Space–Assessment of Remote Sensing-Based Mapped Morphological Slums Using Income Data. Remote Sens. Lett. 2018, 9, 41–50. [Google Scholar] [CrossRef]
- Wurm, M.; Taubenböck, H.; Weigand, M.; Schmitt, A. Slum Mapping in Polarimetric SAR Data Using Spatial Features. Remote Sens. Environ. 2017, 194, 190–204. [Google Scholar] [CrossRef]
- Kuffer, M.; Wang, J.; Nagenborg, M.; Pfeffer, K.; Kohli, D.; Sliuzas, R.; Persello, C. The Scope of Earth-Observation to Improve the Consistency of the SDG Slum Indicator. ISPRS Int. J. Geo-Inf. 2018, 7, 428. [Google Scholar] [CrossRef]
- Florczyk, A.; Corbane, C.; Schiavina, M.; Pesaresi, M.; Maffenini, L.; Melchiorri, M.; Politis, P.; Sabo, F.; Freire, S.; Ehrlich, D.; et al. GHS-UCDB R2019A—GHS Urban Centre Database 2015, Multitemporal and Multidimensional Attributes. January 2019. Available online: http://data.europa.eu/89h/53473144-b88c-44bc-b4a3-4583ed1f547e (accessed on 18 December 2023).
- Kuffer, M.; Wang, J.; Thomson, D.R.; Georganos, S.; Abascal, A.; Owusu, M.; Vanhuysse, S. Spatial Information Gaps on Deprived Urban Areas (Slums) in Low-and-Middle-Income-Countries: A User-Centered Approach. Urban Sci. 2021, 5, 72. [Google Scholar] [CrossRef]
- Grippa, T.; Georganos, S.; Zarougui, S.; Bognounou, P.; Diboulo, E.; Forget, Y.; Lennert, M.; Vanhuysse, S.; Mboga, N.; Wolff, E. Mapping Urban Land Use at Street Block Level Using OpenStreetMap. Remote Sensing Data. and Spatial Metrics. ISPRS Int. J. Geo-Inf. 2018, 7, 246. [Google Scholar] [CrossRef]
- Georganos, S. Data Availability—REACT. REACT Remote Sensing for Epidemiology in African Cities. 2022. Available online: https://react.ulb.be/data-availability (accessed on 1 March 2024).
- Samper, J.; Shelby, J.A.; Behary, D. The Paradox of Informal Settlements Revealed in an ATLAS of Informality: Findings from Mapping Growth in the Most Common yet Unmapped Forms of Urbanization. Sustainability 2020, 12, 9510. [Google Scholar] [CrossRef]
- GAA. GADM Database of Global Administrative Areas. Version 4.1. Global Administrative Areas. 2022. Available online: www.gadm.org (accessed on 18 December 2023).
- Thomson, D.R.; Gaughan, A.E.; Stevens, F.R.; Yetman, G.; Elias, P.; Chen, R. Evaluating the Accuracy of Gridded Population Estimates in Slums: A Case Study in Nigeria and Kenya. Urban Sci. 2021, 5, 48. [Google Scholar] [CrossRef]
- Pesaresi, M.; Huadong, G.; Blaes, X.; Ehrlich, D.; Ferri, S.; Gueguen, L.; Halkia, M.; Kauffmann, M.; Kemper, T.; Lu, L. A Global Human Settlement Layer from Optical HR/VHR RS Data: Concept and First Results. IEEE J. Sel. Top. Appl. Earth Obs. Remote Sens. 2013, 6, 2102–2131. [Google Scholar] [CrossRef]
- Freire, S.; MacManus, K.; Pesaresi, M.; Doxsey-Whitfield, E.; Mills, J. Development of new open and free multi-temporal global population grids at 250 m resolution. In Geospatial Data in a Changing World; Association of Geographic Information Laboratories in Europe (AGILE): Helsinki, Finland, 2016. [Google Scholar]
- Boanada-Fuchs, A.; Heierli, U.; Scrivener, K. Green Cement—Harmonizing Environmental Goals and Housing Needs; École Polytechnique Fédérale de Lausanne: Lausanne, Switzerland, 2014. [Google Scholar]
- UN-DESA. Revision of World Urbanization Prospects 2018; United Nations, Department of Economic and Social Affairs, Population Division: New York, NY, USA, 2018. [Google Scholar]
- Angel, S.; Blei, A.M.; Civco, D.L.; Parent, J. Atlas of Urban Expansion; Lincoln Institute of Land Policy: Cambridge, MA, USA, 2012; p. 397. [Google Scholar]
- Angel, S.; Lamson-Hall, P.; Blei, A.; Shingade, S.; Kumar, S. Densify and Expand: A Global Analysis of Recent Urban Growth. Sustainability 2021, 13, 3835. [Google Scholar] [CrossRef]
Figure 1.
Morphological differences between a slum and a formal neighborhood in Nairobi, Kenya. Very-high-resolution satellite image by the authors; background image by DigitalGlobe.
Figure 1.
Morphological differences between a slum and a formal neighborhood in Nairobi, Kenya. Very-high-resolution satellite image by the authors; background image by DigitalGlobe.

Figure 2.
Slum morphologies in different cities (DigitalGlobe).

Figure 3.
Global distribution of the settlement modes of the GHSL database.

Figure 4.
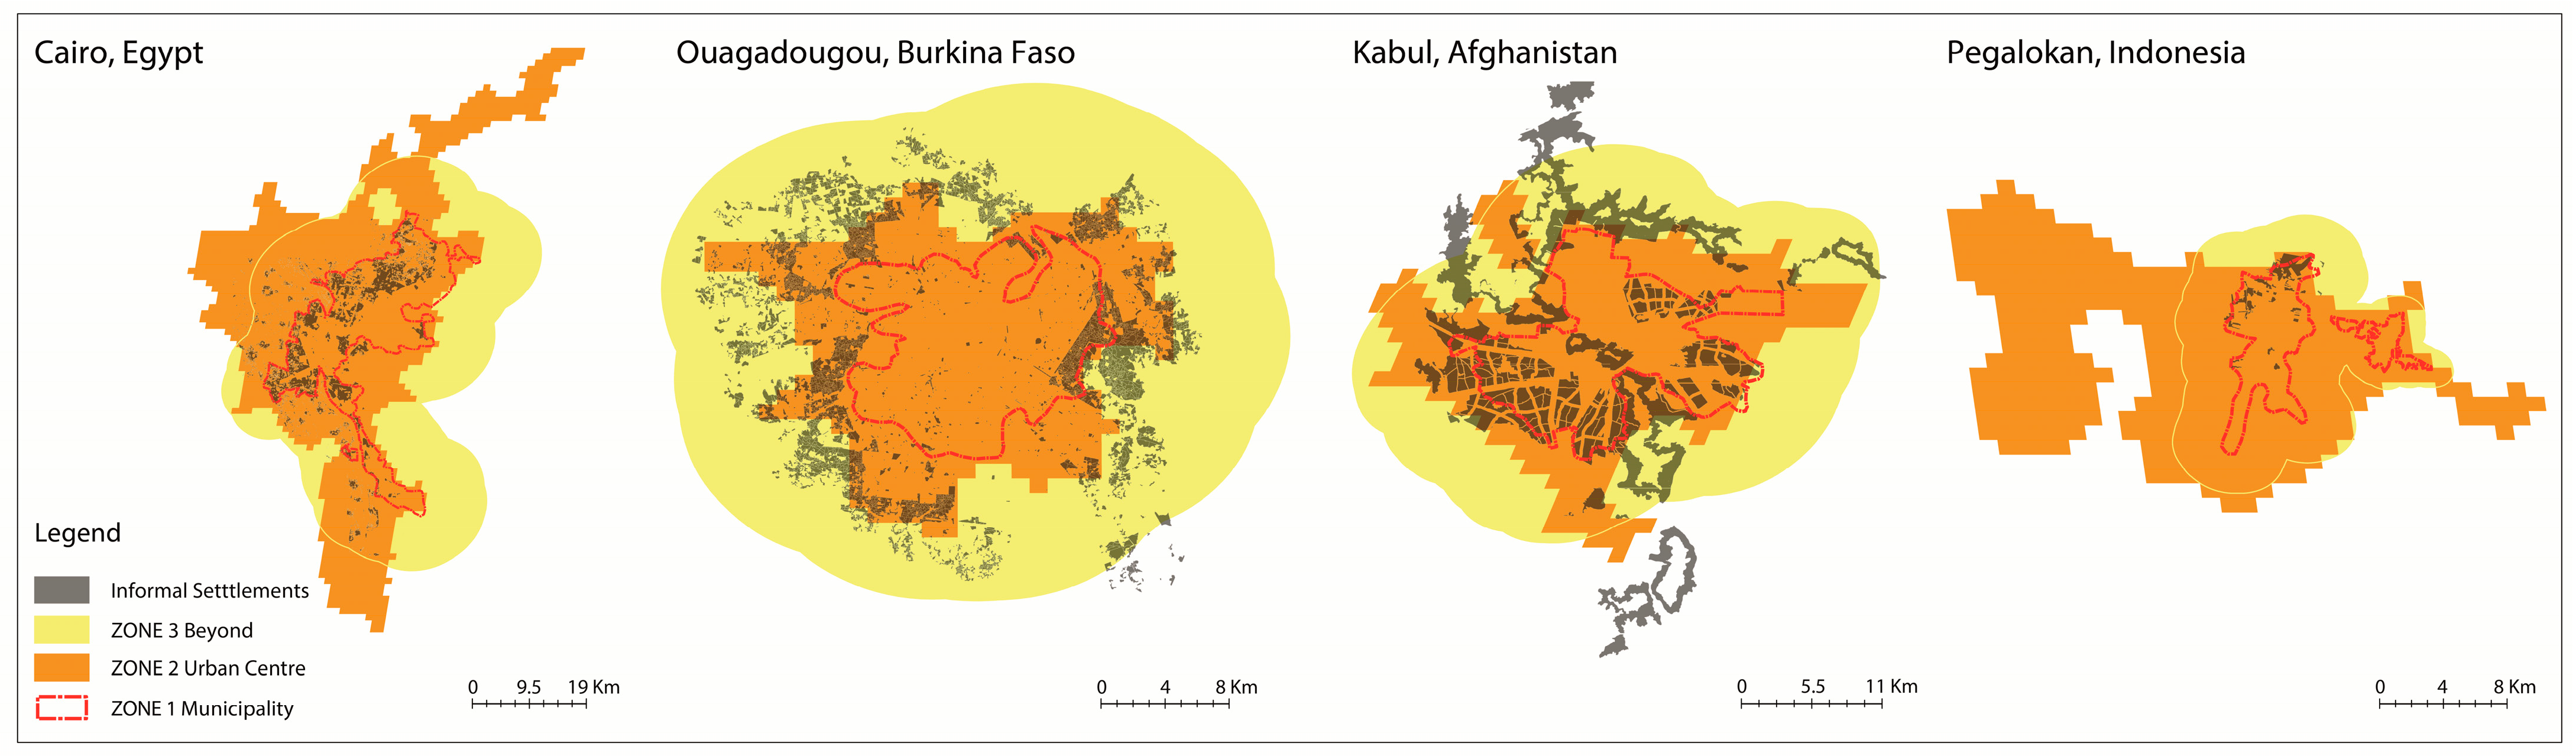
One case city map per world region showing the slum boundaries (dark grey), the urbanized area (orange), and the municipality (red line): Cairo, Egypt; Ouagadougou, Burkina Faso; Kabul, Afghanistan; Pegalokan, Indonesia; Zoom into the city of Bogota, Colombia.
Figure 4.
One case city map per world region showing the slum boundaries (dark grey), the urbanized area (orange), and the municipality (red line): Cairo, Egypt; Ouagadougou, Burkina Faso; Kabul, Afghanistan; Pegalokan, Indonesia; Zoom into the city of Bogota, Colombia.


Figure 5.
Workflow overview.

Figure 6.
Share of the municipality to urban extent per world region (1975, 2000, 2015).


Table 1.
Overview of case studies and type of data 1.
| Country | Map Type | Year of Data | Municipal Area | Urban Center | Slum Area Zone 1 | Total Slum Area | Household Size | Capital City | City Population | |
|---|---|---|---|---|---|---|---|---|---|---|
| Accra | Ghana | 3 | 2021 | 124.0 | 854 | 51.6 | 51.6 | 5.01 | yes | 2.27 |
| Asunción | Paraguay | - | 2018 | 282.0 | 442 | 25.6 | 41.5 | 2.95 | yes | 0.52 |
| Bangalore | India | 2 | unknown | 360.9 | 646 | 1.1 | 1.7 | 5.50 | no | 8.40 |
| Bogota | Colombia | 1 | 2018 | 277.9 | 538 | 100.6 | 124.0 | 4.19 | yes | 8.03 |
| Buenos Aires | Argentina | - | 2016 | 3172.7 | 1991 | 126.7 | 265.7 | 3.31 | yes | 2.89 |
| Cairo | Egypt | 2 | 2000 | 341.3 | 1658 | 151.0 | 151.2 | 4.47 | yes | 9.54 |
| Caracas | Venezuela | - | 2019 | 154.6 | 330 | 18.0 | 46.3 | 4.55 | yes | 2.08 |
| Dhaka | Bangladesh | 2 | 2014 | 163.8 | 3269 | 25.8 | 30.8 | 4.58 | yes | 22.47 |
| Guatemala | Guatemala | - | 2018 | 299.6 | 412 | 15.1 | 18.6 | 5.21 | yes | 3.03 |
| Hyderabad | India | - | 2014 | 507.3 | 887 | 19.6 | 21.7 | 4.83 | no | 6.80 |
| Jakarta | Indonesia | - | 2014 | 1726.7 | 5049 | 140.5 | 140.5 | - | no | 10.52 |
| Jeddah | Saudi Arabia | 2 | 2018 | 470.6 | 536 | 60.4 | 167.7 | - | no | 3.97 |
| Kabul | Afghanistan | 2 | unknown | 143.1 | 321 | 78.5 | 152.9 | 9.25 | yes | 4.43 |
| Kampala | Uganda | 3 | unknown | 89.9 | 528 | 293.4 | 462.1 | 6.75 | yes | 1.50 |
| Khulna | Bangladesh | 2 | unknown | 57.6 | 184 | 1.2 | 1.42 | 4.74 | no | 2.98 |
| Lima | Peru | - | 2019 | 405.6 | 877 | 49.8 | 109.6 | 4.93 | yes | 9.75 |
| Medellin | Colombia | 1 | 2014 | 150.8 | 231 | 18.9 | 19.5 | 4.36 | no | 4.06 |
| Mombasa | Kenya | - | 2018 | 25.2 | 133 | 18.0 | 20.0 | 6.09 | no | 1.20 |
| Montevideo | Uruguay | - | 2019 | 255.5 | 237 | 27.1 | 61.6 | 3.91 | yes | 1.30 |
| Mumbai | India | 2 | unknown | 440.9 | 1078 | 38. | 38.9 | 5.82 | no | 18.39 |
| Nairobi | Kenya | 2 | 2022 | 170.4 | 338 | 48.9 | 49.7 | 4.09 | yes | 4.39 |
| Ouagadougou | Burkina Faso | 3 | unknown | 148.4 | 349 | 64.9 | 130.5 | 8.02 | yes | 2.45 |
| Pekalongan | Indonesia | - | unknown | 36.3 | 339 | 5.0 | 5.2 | - | no | 0.31 |
| Port au Prince | Haiti | - | unknown | 101.1 | 283 | 14.2 | 15.8 | 5.28 | yes | 0.98 |
| Pune | India | - | unknown | 204.7 | 635 | 6.3 | 6.3 | - | no | 10.1 |
| Rio de Janeiro | Brazil | 2 | 2018 | 1839.1 | 1370 | 45.2 | 55.5 | 3.83 | no | 6.74 |
| Santiago | Chile | - | unknown | 669.8 | 721 | 1.1 | 2.8 | 4.48 | yes | 5.61 |
| Sao Paulo | Brazil | 1 | 2016 | 2340.2 | 2005 | 23.4 | 23.9 | 3.95 | no | 12.33 |
| Suva | Fiji | - | 2020 | 24.9 | 64 | 8.1 | 9.2 | - | yes | 0.90 |
| Tegucigalpa | Honduras | - | 2018 | 87.5 | 142 | 6.1 | 17.9 | 5.41 | yes | 1.15 |
1 (1) Administrative areas; (2) manual delineation; (3) EO image classification. Municipal and urban extent area in square kilometers (year 2015). Zone 2 is the urban extent. City population in millions (year 2015).
Table 2.
The relation of the municipality to the urban extent and the impacts of slum growth 2.
| World Region | Ratio Zone 1–2 | Slum Share Zone 1 | Slum Growth (1975–2000) | Slum Growth (2001–2015) |
|---|---|---|---|---|
| LAC | 78.2% | 9.2% | 7.0% | 0.8% |
| MENA | 54.2% | 19.6% | 3.0% | 0.3% |
| SSA | 28.8% | 18.2% | 8.2% | 0.2% |
| SA | 39.2% | 9.6% | 7.2% | 1.0% |
| EAP | 27.9% | 8.2% | 0.9% | 1.3% |
2 Zone 1: municipality; Zone 2: urban extent; slum growth calculated for Zone 1.
Table 3.
Slum share per zone and world region 3.
| World Region | Zone 1 | Zone 2 | Zone 3 |
|---|---|---|---|
| LAC | 51.9% | 23.5% | 30.8% |
| MENA | 46.0% | 24.6% | 29.4% |
| SSA | 30.4% | 49.9% | 19.7% |
| SA | 72.4% | 19.5% | 16.0% |
| EAP | 63.5% | 24.0% | 12.5% |
3 Zone 1: municipality; Zone 2: urban extent; Zone 3: area beyond.
Table 4.
Increase in slum population between 2015 and 2030 4.
| World Region | Slum Population 2015 | Slum Population 2030 | Increase |
|---|---|---|---|
| LAC | 102.4 | 123.0 | 20.6 |
| MENA | 95.8 | 131.6 | 35.8 |
| SSA | 189.6 | 335.3 | 145.7 |
| SA | 316.7 | 414.3 | 97.6 |
| EAP | 175.0 | 254.0 | 79.1 |
| World | 943.9 | 1328.7 | 384.8 |
4 All numbers in millions.
Table 5.
Slum-related annual growth rates per different dataset.
| World Region | Urban Population | Slum Population | Urban Extent | Slum Land Zone 1 | Slum Land Zone 1 | Slum Land Zone 2 | Slum Land Zone 3 |
|---|---|---|---|---|---|---|---|
| LAC | 1.24% | 1.34% | 0.54% | 0.80% | 7.02% | 23.52% | 5.91% |
| MENA | 2.84% | 2.49% | 0.52% | 0.30% | 0.97% | 11.27% | 25.56% |
| SSA | 2.11% | 5.12% | 0.45% | 0.20% | 4.59% | 20.03% | 7.62% |
| SA | 1.73% | 3.01% | 0.82% | 1.00% | 3.69% | 1.73% | 0.76% |
| EAP | 1.39% | 2.05% | 0.70% | 1.30% | −0.04% | 0.61% | 4.61% |
| World | 1.51% | 2.72% | 0.53% | 0.51% | 3.78% | 16.37% | 9.74% |
| Data Sources | GHS_BUILT | UN-Habitat UN-DESA | GHS_BUILT | GHS_BUILT | AoI | AoI | AoI |
Table 6.
Required land for slums within the SDG timeframe (2015–2030) 5.
| World Region | Zone 1–3 | Zone 1–3 | Zone 1–3 | Zone 1 | Zone 2 | Zone 3 | Zone 1–3 |
|---|---|---|---|---|---|---|---|
| LAC | 33,371.5 | 21,559.6 | 278,950.6 | 92,435.5 | 140,323.2 | 46,191.9 | 33,371.5 |
| MENA | 98,881.5 | 10,461.5 | 374,471.0 | 15,550.1 | 96,727.0 | 262,193.9 | 98,881.5 |
| SSA | 60,755.7 | 5762.7 | 371,591.4 | 40,176.7 | 288,192.0 | 43,222.6 | 60,755.7 |
| SA | 11,721.1 | 6764.3 | 19,625.6 | 16,750.2 | 2112.5 | 762.9 | 11,721.1 |
| EAP | 11,385.0 | 10,639.7 | 5723.0 | −207.7 | 1198.2 | 4732.5 | 11,385.0 |
| World | 217,552.4 | 55,187.7 | 1,050,361.5 | 164,704.7 | 528,552.8 | 357,103.9 | 217,552.4 |
| Data Sources | UN-Habitat UN-DESA | GHS_Built | AOI | AOI | AOI | AOI | UN-Habitat UN-DESA |
5 Areas in square kilometers.
Disclaimer/Publisher’s Note: The statements, opinions and data contained in all publications are solely those of the individual author(s) and contributor(s) and not of MDPI and/or the editor(s). MDPI and/or the editor(s) disclaim responsibility for any injury to people or property resulting from any ideas, methods, instructions or products referred to in the content. |
© 2024 by the authors. Licensee MDPI, Basel, Switzerland. This article is an open access article distributed under the terms and conditions of the Creative Commons Attribution (CC BY) license (https://creativecommons.org/licenses/by/4.0/).
Share and Cite
MDPI and ACS Style
Boanada-Fuchs, A.; Kuffer, M.; Samper, J. A Global Estimate of the Size and Location of Informal Settlements. Urban Sci. 2024, 8, 18. https://doi.org/10.3390/urbansci8010018
AMA Style
Boanada-Fuchs A, Kuffer M, Samper J. A Global Estimate of the Size and Location of Informal Settlements. Urban Science. 2024; 8(1):18. https://doi.org/10.3390/urbansci8010018
Chicago/Turabian StyleBoanada-Fuchs, Anthony, Monika Kuffer, and Jota Samper. 2024. "A Global Estimate of the Size and Location of Informal Settlements" Urban Science 8, no. 1: 18. https://doi.org/10.3390/urbansci8010018