

Performance Metrics for Implementation of Americans with Disabilities Act Transition Plans
by
 , ,
, ,
Yochai Eisenberg
1,2,*,
Mackenzie Hayes
1,2,
Amy Hofstra
3,
Delphine Labbé
1,2,
Robert Gould
1,2 and
Robin Jones
1,2 1
Department of Disability and Human Development, University of Illinois at Chicago, Chicago, IL 60608, USA
2
Great Lakes ADA Center, University of Illinois at Chicago, Chicago, IL 60608, USA
3
College of Urban Planning and Public Affairs, University of Illinois-Chicago, Chicago, IL 60607, USA
*
Author to whom correspondence should be addressed.
Urban Sci. 2024, 8(2), 27; https://doi.org/10.3390/urbansci8020027
Submission received: 1 February 2024
/
Revised: 18 March 2024
/
Accepted: 22 March 2024
/
Published: 29 March 2024
(This article belongs to the Topic Accessibility and Inclusion for Pedestrians with Disabilities: Law, Policy, Practice and Politics)
Abstract
:Safely walking or wheeling in a wheelchair in the community is a civil and human right. Some progress has been made in the US towards making walking/wheeling paths more accessible for people with disabilities through the construction of new curb ramps, fixing sidewalk barriers, and installing accessible pedestrian signals. However, pedestrians with disabilities continue to be limited by infrastructure barriers on sidewalks and streets. To encourage progress and government transparency, we developed a set of performance metrics for local governments to monitor and report their progress in implementing barrier removal plans, called Americans with Disabilities Act (ADA) transition plans. We used the five-step Nominal Group Technique to systematically develop and prioritize a set of performance metrics with an expert panel of ADA coordinators, disability organizations, and state and federal Department of Transportation staff. The research resulted in obtaining 53 metrics across five goals and 14 objectives that can be used to measure all phases of implementation and are intended to be customized to fit different community contexts and capacities. The metrics could be used by federal and state transportation agencies, as well as internationally, with some adaptation to ensure that adequate progress in barrier removal is being made. Local governments can use the metrics to document and communicate their progress and effectively reduce ADA compliance litigation concerns.
1. Introduction
People with disabilities continue to experience barriers to walking or wheeling in their communities, including missing curb ramps, broken sidewalks, and inaccessible pedestrian signals [1,2,3]. These barriers deter people with disabilities from accessing public transportation [4,5] and limit their access to employment, healthcare, and social participation [6,7]. Addressing these barriers is of critical importance to fulfilling the transportation equity goals set out by the United States Department of Transportation (USDOT) [8], as one in four people in the US (61 million) report having a disability related to limitations in functioning such as walking, hearing, seeing, and/or remembering [9].
In the US, disability policy and laws over the past 50 years have shaped the landscape of the current pedestrian infrastructure and laid the grounds for anti-discrimination lawsuits that continue to impact accessibility. The Rehabilitation Act of 1973 and the Americans with Disabilities Act (ADA) of 1990 set up the legal framework requiring the removal of these barriers [10,11]. In this way, walking/wheeling safely in the community is a civil right, and violation of this civil right in the form of discrimination is grounds for legal action. In fact, there have been significant lawsuits filed against local governments on the premise of discrimination due to inaccessible pedestrian infrastructure. These lawsuits have clarified and established that sidewalks and curb ramps are “services” under Title II of the ADA and, therefore, a requirement for the local government to maintain [12]. In addition to private lawsuits, Project Civic Access conducts reviews of ADA compliance, which have led to 223 settlement agreements over 17 years [13]. Our review of the agreements identified that 123 agreements focused on pedestrian infrastructure issues. These agreements detail the accessibility changes needed for pedestrian infrastructure and outline how their progress will be monitored throughout the established time period. Indeed, disability rights legislation has significantly impacted walkability and wheelability as local governments are required to make significant improvements to pedestrian infrastructure [13].
Outside of the US, international legislation has also benefited accessible pedestrian infrastructure for people with disabilities. In 1993, the UN General Assembly adopted the Standard Rules on the Equalization of Opportunities for Persons with Disabilities. These rules guide governing bodies in law and accessibility and recommend an evaluation and monitoring system consistent with common standards [14]. In 2006, the United Nations adopted The Convention of the Rights of Persons with Disabilities and its Optional Protocol; this legislation requires an independent monitoring system and mechanisms to sustain progress [14,15,16]. These acts demonstrate a strong interest in disability legislation internationally and the necessity for some type of evaluation mechanism. Standardized performance metrics could support these efforts.
We found two studies focused on more broad metrics about an inclusive city developed to benchmark progress towards implementing the CRPD. The Disability Inclusion Evaluation Tool (DIETool) is used to generate a score from several performance indicators developed through a synthesis of the literature [17]. The performance indicators include 20 focus areas, but only one addresses accessible and barrier-free routes. The tool does not provide time-associated, comprehensive, or specific metrics for pedestrian infrastructure accessibility; rather, it provides more general route accessibility as an essential indicator. Similarly, Henderson-Wilson (2022) and colleagues developed domains to group benchmarks of an accessible and inclusive city, some of which related to pedestrian infrastructure, such as within the ‘spatial, environment, neighborhood, movement networks’ and ‘transportation’, but as with the DIETool, the metrics do not provide benchmarks specific enough to measure the progress of implementing a barrier removal plan for the pedestrian network [18]. Additionally, these two existing tools used grounded theory and synthesis of the literature, but they did not use an expert panel in their development of metrics.
In the US, ADA transition plans are a tool used to identify current barriers to physical access, plan for their removal through a schedule and methods, and designate who is responsible for removing barriers and monitoring progress [19]. A study funded by the Federal Highway Administration defined possible barriers as narrowness, steepness, irregularity, variability, deterioration, and discontinuation of sidewalks, curb ramps, and crosswalks or obstacles in the pedestrian environment [20]. Local governments with 50 or more employees at all levels (state, county, city) were supposed to have prepared an ADA transition plan within six months of 26 January 1992 [10]. However, many communities have struggled to develop and implement their ADA transition plans or have developed low-quality plans and are thus not likely to be effective at increasing accessibility for people with disabilities [19,21]. Obtaining detailed information about ADA transition plan implementation may be difficult because many municipalities are afraid of sharing updates on their progress as they may face litigation if it seems that they are not doing enough [19].
While lawsuits and settlement agreements have greatly impacted accessible pedestrian infrastructure in the US, a more proactive approach is to develop a plan for removing barriers and then fund and implement the plan. Guidance from the Federal Highway Administration (FHWA) suggests that the best way to comply with the ADA is to develop and implement an ADA transition plan [20,22]. Several resources developed by the FHWA exist to support communities in developing a plan [20]. However, preventing litigation and addressing any lack of progress requires local governments to be more transparent about what they are doing to remove barriers and meet objectives in a reasonable timeframe. However, we are unaware of any resources that communities can use to measure their progress and to articulate the steps they are taking to be accountable and achieve the goals and objectives set out in their plan in a reasonable time. Furthermore, without a standardized set of progress measures, comparing communities or aggregating progress at the state level is impossible.
The purpose of this study was to co-create a set of standardized performance metrics with accessible pedestrian infrastructure experts to measure progress toward implementing an ADA transition plan and achieving a more accessible pedestrian infrastructure network. We used a systematic process to identify critical measures of success in implementing barrier removal.
Performance metrics are often used in the business and transportation sectors to measure progress toward the completion of a goal. Transit performance measures have been used in the transportation planning industry in the form of evaluation metrics, such as trip duration, wait time, trip prices, safety violations, etc. [23]. Performance metrics are key to being able to communicate the success of implementation and are used for internal and external reporting [24]. According to the National State Auditors Association, performance metrics should ensure that work meets an adequate standard of quality, is completed in a timely fashion, and is using public resources efficiently and effectively to generate appropriate products or outcomes [25]. The federal Department of Transportation recommends “monitoring of progress” as part of best management practices and ADA transition planning [20,26]. The remainder of this paper is structured as follows: We first explain our use of the nominal group technique (NGT) and engagement with an expert panel. Then, we describe how we completed each of the NGT steps and share the results of the NGT, including our qualitative and quantitative findings. Finally, we discuss the findings and the contribution of this paper in the context of the disability, access, and performance metrics literature as well as the implications for practice and policy.
2. Materials and Methods
In this study, we used the nominal group technique (NGT) as described in Body (2012) and Sink (1986) [27,28]. The NGT is a 5-stage approach that has been used across many disciplines in the medical field [29,30], public health [31], and business [27] and is well regarded for its quick and effective approach to consensus building and prioritization. The NGT, an alternative to conventional brainstorming, combines individual silent ideation with group collaboration, followed by sorting ideas through voting and assessing group popularity. It is commonly used in managerial and market research for creative ideas or product development [27].
The NGT was our preferred research method because we wanted to utilize a productive brainstorming process and leverage experts’ knowledge and experience to create performance metrics rather than create them on our own. This method was selected over other similar methods (the Delphi Method, for example) because of its capacity for interaction and idea generation among the participants. The NGT is composed of both an individual generation (silent generation) of ideas and a group sharing and discussing ideas. These benefits would not be captured if instead a questionnaire (i.e., for the Delphi Method) was sent out for asynchronous voting.
This study was approved by the Institutional Review Board of the University of Illinois at Chicago.
2.1. Participants
We sought experts to participate in the NGT who worked in the accessibility field, including urban design, occupational therapy, and/or have a role in the planning or development of plans, policies, or practices for sidewalk accessibility, such as ADA transition plans. We emailed invitations to 22 experts recommended by a national ADA technical assistance center, and 12 agreed to participate. Participants were sent a demographics survey about their experience with ADA transition planning and disability status. The participants reflected key stakeholders as 42% identified with having a disability, 45% of the participants held the position of ADA coordinator currently or in the past, and 58% have worked on an ADA transition plan with their organization. These participants held positions such as program/project managers, ADA coordinators, consultants, engineers, and assistant directors within transportation agencies, ADA planning consultants, Centers for Independent Living (CILs), and city governments.
2.2. NGT Process
The NGT process was conducted online due to COVID-19 precautions, for lower cost, and ease of participation with experts across the country. The NGT process is shown in Figure 1 below. It includes seven steps; some were conducted as a group, some as individuals, and some by the facilitators alone. The format for the record-keeping of our NGT protocol was inspired by another online NGT study, which used Excel sheets to record the participants’ ideas [32]. We utilized a similar procedure, creating a Google Doc as a standardized format for the participants to organize their ideas throughout the NGT process systematically. Our process included two online 90 min workshops, as well as two asynchronous working periods following each workshop. Additional details about each step of the NGT are provided below.
2.3. NGT Steps Used to Generate Performance Metrics
- (1)
- Silent generation:
In this step, participants are usually given some quiet time to generate ideas for the topic of study individually. There are many benefits to participants initially generating ideas individually versus developing them as a group. Research has shown that individuals working alone will collectively generate more ideas than when working in a group [27,33,34,35]. Another benefit is that introverts are provided with an opportunity to generate ideas without having to speak over extroverts. A barrier to idea generation in groups is ‘group-think’, the fear of group ridicule limiting idea generation; silent generation helps overcome this [27]. Another barrier to idea generation in groups is a disruption of the ‘creative flow’ that can be felt by the continuous sharing of other ideas; silent generation can give participants time to note down their ideas before sharing them with the group [28]. To facilitate silent generation in the first online workshop, we developed an initial set of five goals and 16 objectives (see Table 1) based on the previous literature and ADA transition plan reference documents [20,22,26,36]. An initial set of goals and objectives were developed by the research team. Goals 1–4 and their subordinate objectives came directly from the requirements of ADA transition plans (e.g., involve people with disabilities, identify barriers, develop schedule for removal). Goal 5, ‘Evaluate progress towards goals’, and subordinate objectives came from guidance documents on performance metrics [23]. The expert panel suggested revisions, moving objectives to different goals during step 3, and group clarification until a final consensus was reached. Defining goals and objectives is a prerequisite for performance metrics as they clearly articulate what the metrics intended to achieve. The participants were given approximately 20 min and told to brainstorm (without discussion from other group members) performance metrics for each objective.
- (2)
- Round robin
In the round robin step, the participants collaboratively review the material resulting from the silent generation. This group sharing can stimulate additional group brainstorming and the creation of more performance metrics. Round robin allows for discussion and elaboration. Some participants may have felt challenged to come up with metrics on their own. This step allowed for inspiration between participants. For example, the suggestion of standardized ADA training for architecture and design students was inspired by a suggestion for standardized training for construction workers. In the in-person round robin step, participants read aloud their ideas, and a facilitator took notes on a flip chart or board. For our online version, we read aloud ideas on the shared Google Doc that everyone could see. The performance metrics typed into the Google Doc were read aloud during Workshop #1 by the facilitator, and participants spent time discussing the reasoning for their ideas.
- (3)
- Group clarification
The goal of the clarification step is to ensure the list is collectively exhaustive and nonrepetitive [28]. This step was completed both asynchronously and then as part of a second workshop. Instructions were emailed to the participants outlining how to make suggestions in a Google doc and encouraging participants to reword previously added metrics, add new ideas for metrics, and make suggestions for metrics that could be combined, altered, or excluded. Participants were encouraged to comment on each other’s comments or edits to facilitate asynchronous discussion.
After a two-week period allowing for asynchronous clarification, the research team went through all the comments left by the participants in the Google doc and identified metrics that needed to be further clarified by the group due to redundancy or ambiguity. The participants met for a second workshop and discussed those unclear or ambiguous metrics. The research team made live edits to arrive at a complete, clarified set of metrics for voting.
- (4)
- Individual voting and ranking
This NGT step aims to assign priority or popularity to the metrics and add additional comments that may not have been shared before [27,28]. In our process, the ranking of the metrics was based on prioritization criteria relevant to the ADA transition plan implementation. We developed the criteria for evaluating metrics using several performance measurement guidance documents and other transportation performance metrics development reports [23,37,38,39]. The criteria were grouped into two main assessment types: feasibility and applicability. Applicability was defined as “relevance (of the metric) to current objectives”, and the two components of applicability to consider were meaningfulness (is this metric a measurement of progress that is significant to the purpose?) and effectiveness (does this metric contribute to the expected results of the objective?). Feasibility was defined as “the capacity of this metric to be completed”. The three components of feasibility were timely (is there a reasonable timeframe associated with the metric?), resource availability (does this municipality have the resources necessary to complete this metric (i.e., money, staff, software, data collection)?), and measurable (can the completion of this metric be measured objectively?). A rating scale was created from 0 to 3 (see Table 2). These criteria were explained to the participants during the conclusion of Workshop #2. In the in-person NGT process, participants used index cards to privately rank and comment on issues that had not been addressed before. In our study, this process was entirely online. After the workshop, participants evaluated each metric through an online Qualtrics survey (results available upon request from the authors). Participants also left qualitative comments. The averages of the metrics were taken and ranked. The comments were also used to decide whether to remove metrics or make further edits.
- (5)
- Final discussion of metrics
After the voting was complete and the metrics were ranked, the near-final metrics were sent to the participants for final comments using a Google Doc. The questions given to the participants to stimulate comments were as follows: (1) Are there any metrics that you think need further editing? (2) Do you have any strong disagreements with the prioritization? (3) Do you have any concerns about the viability of communities using these metrics? (4) Do you have any other comments/feedback? This step aimed to gain additional feedback on the metrics and discuss the next steps before sharing them more broadly with the transportation field or presenting them publicly.
3. Results
3.1. Key Takeaways from NGT Discussions
The expert panel had much discussion about who was involved with implementation and focused on both people with disabilities and the staff trained to lead implementation. Participants discussed the inclusion of people with disabilities and disability experts in the various phases of ADA transition plan implementation (see goal 1, objective 1). They elaborated on the nature of inclusion as needing to be meaningful and the need for communities to involve people with a diversity of disabilities. The inclusion of orientation and mobility coaches, public health agencies, veteran’s agencies, and departments that serve aging communities were all suggestions from the experts as ways to involve the disability community in the development and updating of the ADA transition plan. A related emphasis was ensuring that people who work on the pedestrian infrastructure network have the appropriate training on ADA compliance and implementation (see goal 4, objective 3). The experts discussed how designers and architects are often not provided with the appropriate training; ensuring standard ADA training across states would ensure that new barriers are not created in construction/repair projects. These suggestions resulted in six metrics related to the involvement of people with disabilities and three metrics related to training.
Another important factor for the experts was ensuring that timelines were kept flexible and not too proscriptive, which was relevant across all objectives with time-based elements but especially to goal 4 as it focused on barrier removal objectives and timing. The experts discussed the importance of letting communities set timelines aligned with their objectives and recognized that different municipalities have different needs and capacities. For instance, letting communities decide on how often to update the inventory of barriers (see goal 2, objective 1, metric 8) or how often ADA transition plans should be updated (see goal 5, objective 1, metric 43). Allowing local governments to decide their own benchmarks or timelines still allows them to hold themselves accountable. In the performance metrics, this presents itself in the form of ‘X%’ or ‘X years’, but it also includes suggested timelines based on best practices, such as updating a plan every 1–3 years.
3.2. Prioritized Performance Metrics
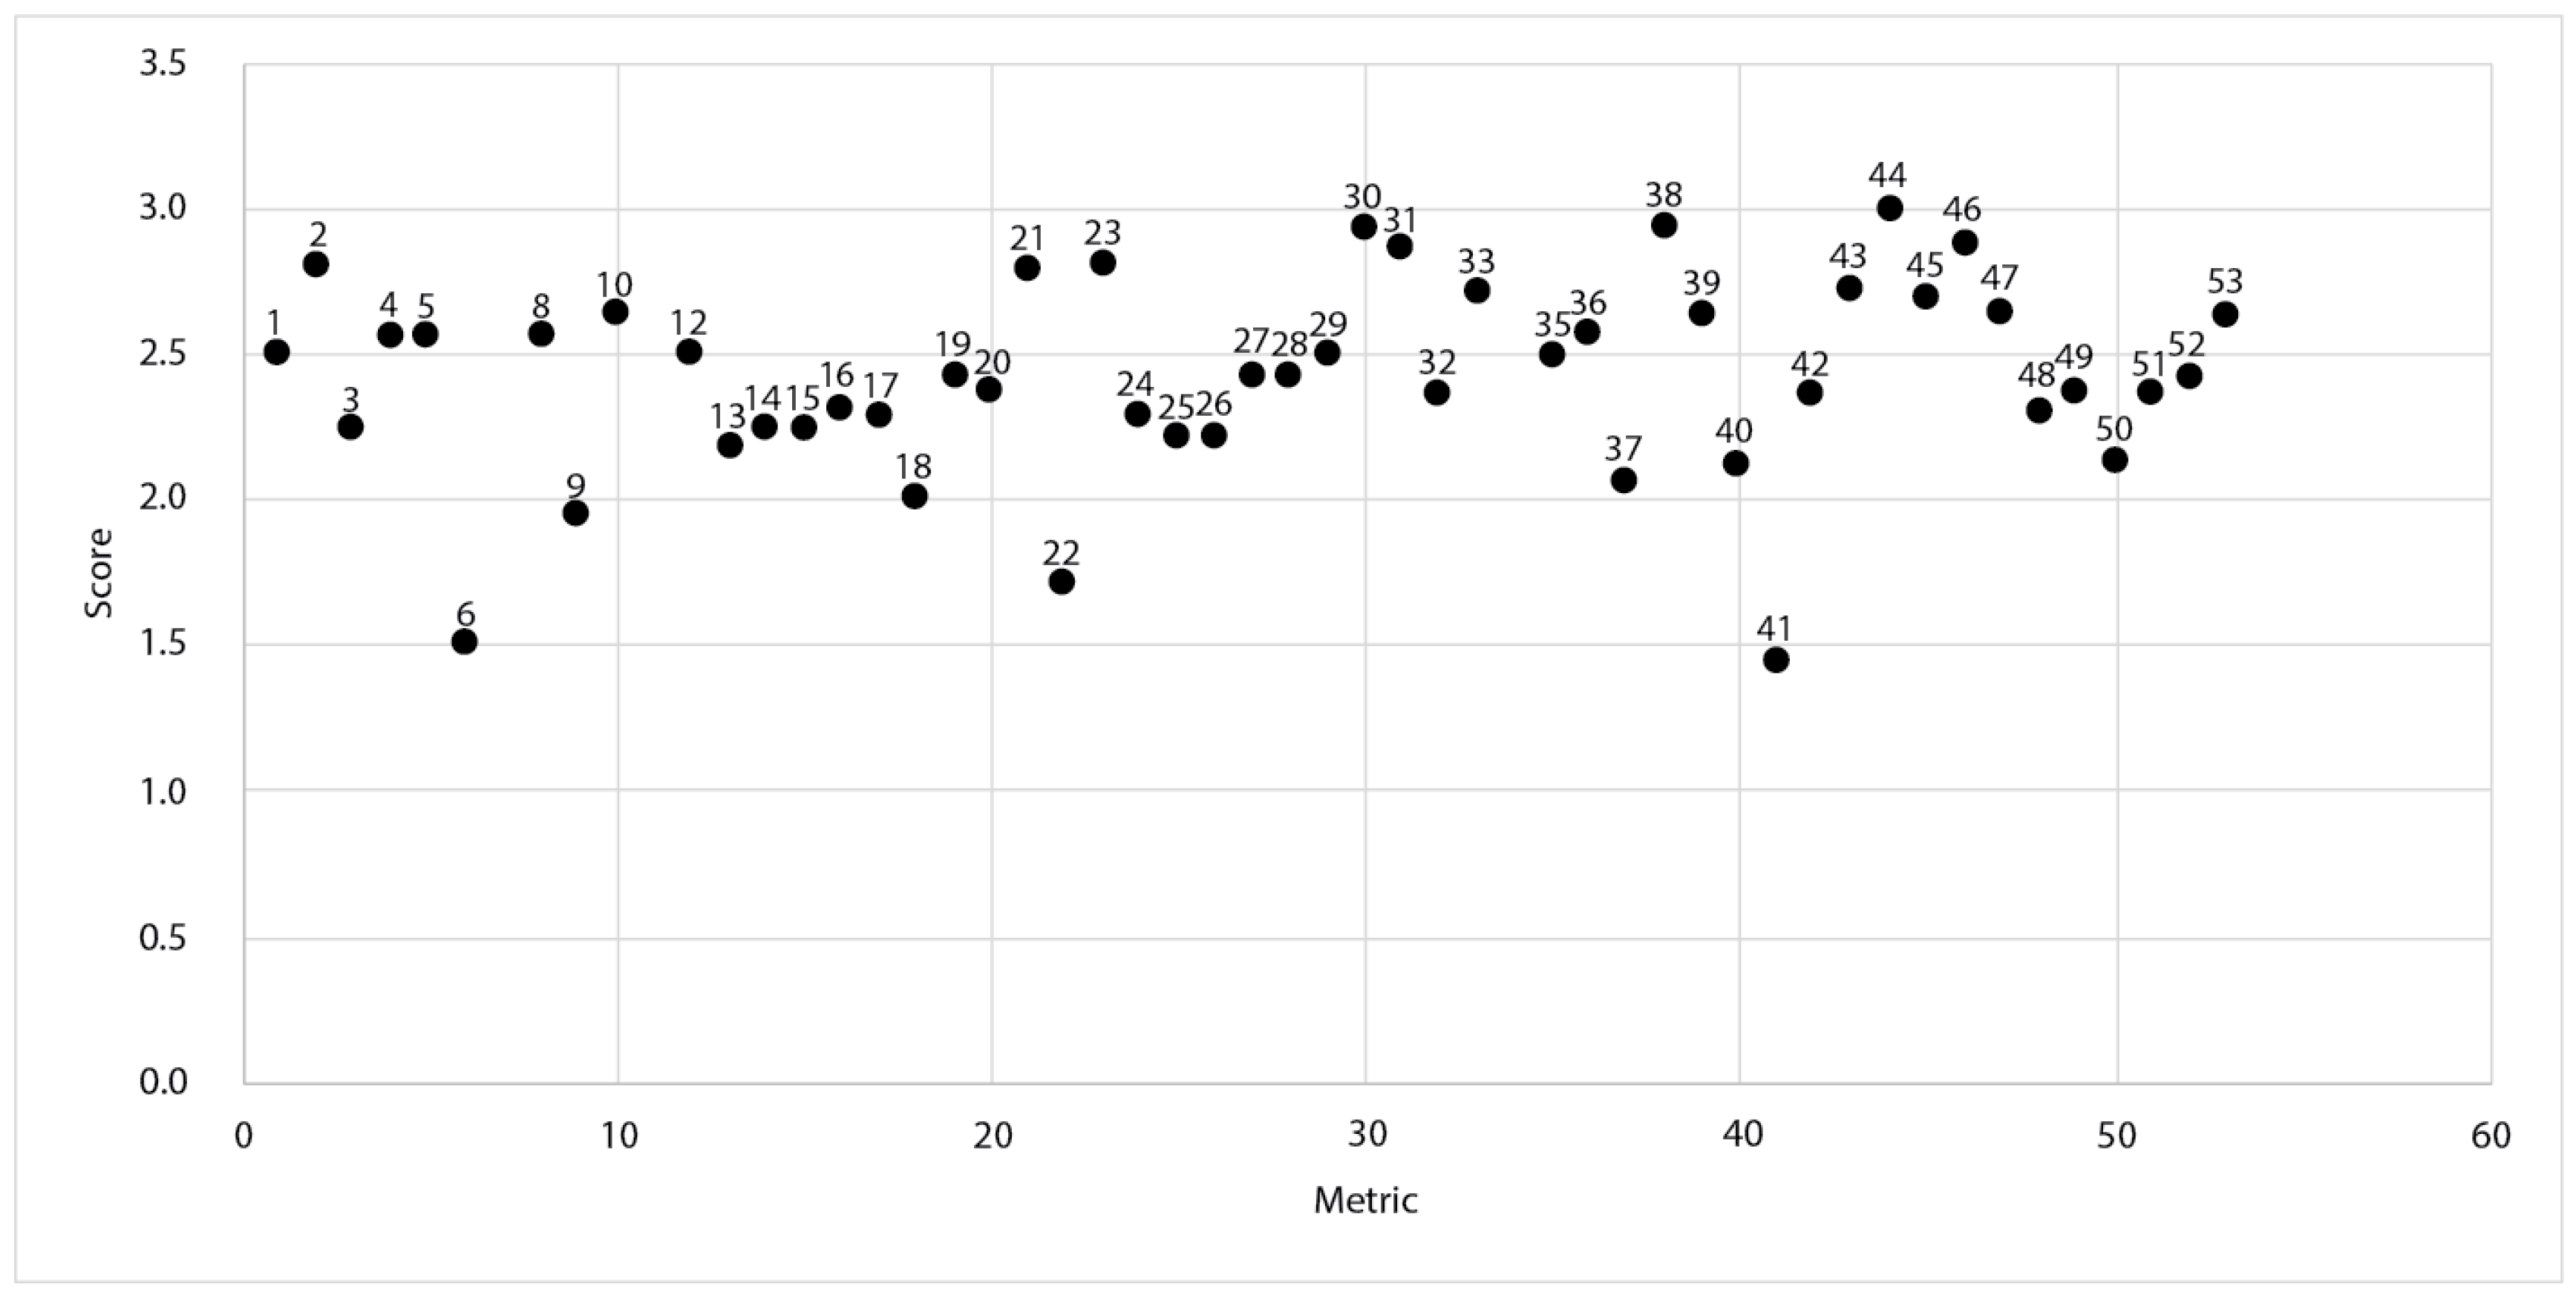
Table 3 lists the goals, objectives, and metrics and their average priority scores. The highest scoring metric and one that all experts agreed was highly applicable and feasible was that the ‘ADA coordinator is listed on the city website as a point of contact for grievances’. The second highest scoring metric (average = 2.94) was ‘Published transition plan online is easily accessible through simple search engine inquiry on at least one city/government website’. The lowest score (average = 1.44) was for the ‘Developed an online (GIS) map with easy navigation for the constituency’ metric, and a similarly low score (Average = 1.5) was for ‘Paid people with disabilities for their participation in developing the plan’.
The count of performance metrics went from 83 during silent generation to 53 at the end of the final commenting step. Some objectives were reclassified under different goals and/or combined by the experts to arrive at 14 objectives. For each metric, the average priority score of applicability and feasibility was combined as a total average of the two scores. The highest average score among all the metrics was 3, an overall high of 2.35, and the distribution had a minimum of 1.43, a maximum of 3, and a standard deviation of 0.38. Figure 2 below shows the distribution of the priority metric scores. Each dot is a metric, and the y-axis shows each metric’s average feasibility and applicability score.
3.3. Summary of Qualitative Comments from Voting
The qualitative comments from the expert panel provided a unique insight into the characteristics of the performance metrics. Many comments concerned the metrics’ level of specificity. Because the metrics were intended to be applicable to any community with an ADA transition plan, this can include communities of different sizes and skill levels. For instance, for metric 41 in goal 5, objective 1: “developed an online (GIS) map with easy navigation for your constituency”, participants were concerned that some municipalities would not have the skill level or the software to utilize GIS. The group commented, “Are you comfortable assuming that every community is utilizing online GIS?”. As a result, we added some alternatives or clarifications for metrics that were discussed as ways of making the metrics applicable across communities. In this specific case, we recommended that municipalities collaborate and complete this task at the county level to utilize a larger pool of skills or complete this task using free, online GIS software.
There were also some areas of disagreement between the experts. An example of this was a possible metric discussed: “paying people with disabilities for participation and input”. When this was originally discussed, the comment was, “Oftentimes we (people with disabilities) serve on advisory committees that are volunteer, but something my fellow advocates and I have been pushing for is people with disabilities being viewed and valued as subject matter experts, which means compensating us for our time and knowledge. Especially since we are helping entities to effectively do their work in complying with the ADA and are filling the cracks of their work”. However, other experts felt that this is out of the bounds of how local government works and that paying people may affect their types of participation. Because of the differing perspectives, several of the disagreed upon metrics were lower scoring during voting and, therefore, in the lower-priority category.
4. Discussion
The intended purpose of a barrier removal plan such as an ADA transition plan is to describe the steps a local government will undertake to make community and pedestrian infrastructure accessible. However, we are unaware of any tools currently available for communities to measure their progress and articulate the steps they are taking to make their infrastructure accessible. This study aimed to develop a set of standardized performance metrics to measure progress toward implementing an ADA transition plan and achieving a more accessible pedestrian infrastructure network for people with disabilities. Using a systematic approach with a diverse panel of experts, we generated 53 performance metrics specifically applicable to ADA transition planning. The NGT process provided participants with an opportunity to incorporate goals for the community of people with disabilities directly into the performance monitoring process and ensured that the metrics were applicable and feasible to end-users, in this case, urban planning and transportation professionals who are implementing their ADA transition plan. The metrics supported an organized, structured documentation of progress that had content validity through the input and consensus of experts.
The performance metrics developed in this study aligned well with the existing inclusive city metrics [17,18], but they specified measurement at a finer level of detail and were customized to the context of pedestrian infrastructure. For example, a metric from the Global Benchmarking of Accessible and Inclusive Cities is to ‘engage stakeholders at all stages of the planning process’, and a similar metric in our set was ‘Created an advisory committee of X stakeholders and met X number of times’. Both metrics speak to public engagement, but the later metric details the steps a local government agency would take to complete the former metric of engaging stakeholders. Detailed metrics not only serve to show progress but also educate cities on the ‘how-to’ of implementing ADA transition plans, something the existing ADA guidance resources are often lacking according to previous research [40]. Moreover, these two existing sets of metrics for inclusive cities focus on outcome indicators, whereas the experts in our study also developed process indicators. For example, an indicator in the DIETool is ‘Accessible and barrier-free routes’, and a related metric from our study is ‘Met or exceeded goals for an increased percentage of accessible pedestrian infrastructure features throughout the whole jurisdiction within the specified time frame (e.g., 1 year)’, which focuses more on the incremental achievements to meeting that broader outcome of barrier-free routes. These differing levels of detail for performance metrics suggest that metric design needs to align with the purpose of the evaluation and shows a need for customization by topic (e.g., pedestrian infrastructure accessibility). Finally, the metrics we developed have a high practical relevance because while these existing metrics used thematic analysis of the literature [17,18], our research added to the literature-based metrics through the expertise of transportation agency staff and disability rights organizations engaged in an NGT process, adding a higher level of validity.
Overall, the expert panel found the metrics to be highly applicable and feasible, as the average score was 2.35/3. The metrics that scored high for applicability and feasibility during the voting step of the NGT were often metrics that were required to be completed or needed to be finished before other ones could be accomplished. These metrics, like ‘ADA coordinator is listed on the city website as the point of contact for grievances’, are found in many guidance documents for complying with the ADA [20] and can be accomplished easily by most municipalities, suggesting that these are good places for communities to start and obtain some early ‘wins’ towards ADA implementation. Some of the lower-scoring metrics were oftentimes ones that required the use of technology or specialized skills, such as creating an open data portal. While these were very applicable, they may not be as feasible for all communities. Due to the variability in feasibility and applicability of the metrics, our expert panel recommended the metrics be displayed as a menu to be selected for best fit by communities. Previous research has taken a similar approach, such as mobility performance metrics for integrated mobility [23], that rated feasibility and applicability by their research team but not from an external export group. In addition to describing the need for a menu, we developed alternatives for these less feasible metrics, such as leveraging county/state GIS capacities, that could fit well for small- to medium-sized communities without the technology or staff to support the use of GIS.
The discussion themes we summarized from the workshops shed light on the translation of the performance metrics from research to practice. The characteristics needed for the performance metrics to be more usable had to do with flexibility, training, and representation of people with disabilities. These themes align well with the previous literature, showing the need for increased training and support for ADA coordinators to be effective [19,41,42]. ADA coordinators play key roles in implementing the ADA in their local governments but are often unaware of the requirements or unsure of where to find resources [41]. While the need for the meaningful engagement of people with disabilities in urban planning is well understood [4,43], local governments continue to struggle with putting this objective into ADA transition planning practice [19]. Along with more training on disability participation in planning, using specific metrics on disability participation could advance the number of communities that achieve this important objective.
4.1. Implications for Policy and Practice
Proactively measuring progress toward ADA implementation of the pedestrian infrastructure has advantages for multiple stakeholders. Local governments with a heightened awareness of their progress are better equipped to identify processes that need improvement, sources of delay or cost elevation, and evaluation of contract service providers in a timely and efficient manner. The public would also benefit because the progress and evaluation of the implementation of the ADA plan would be transparent and well organized. Adding structure to a local government’s progress through the use of performance metrics can also make it less demanding and, therefore, more productive for members of the public, people with disabilities, and their advocates to monitor and evaluate progress toward barrier removal. At higher levels of government (i.e., federal level), the performance metrics could be used to monitor local-level implementation progress and identify areas in need of support. Potentially even more effective could be to require performance metrics in order to receive funds, as has been done by some US states, such as Indiana, which required local governments to have an ADA transition plan to receive funding [44]. Finally, the use of the same performance metrics could allow states to aggregate local government’s progress, showing impacts on accessibility across a state or the entire US.
Urban planners would benefit from aligning the use of these ADA transition plan performance metrics with other metrics and initiatives, such as complete streets and mobility management. Complete Streets refer to policy initiatives that ensure the same rights and safe access for all users of streets, including pedestrians, bicyclists, motorists, and transit riders of all ages and abilities [45]. Complete Streets initiatives have been a revolution in the US planning world, with over two-thirds of the states (1533 jurisdictions) across the US adopting the Complete Streets initiative [46]. Planners could easily integrate complete streets performance metrics [47] with the metrics for ADA transition plans. Moreover, these pedestrian-based metrics can be linked to general mobility metrics that incorporate the numerous modes of public transportation [39], which could facilitate better performance monitoring across modes. They could also be used alongside assessments of inclusive cities like the DIETool, which recommends the inclusion of performance metrics to assess progress towards the completion of goals. The metrics developed in our study could be used in the parts of the assessment that address the accessibility of pedestrian routes.
A significant barrier to implementing both ADA transition planning and Complete Streets initiatives that benefit pedestrians is limited funding and current measurement systems. A recent study highlighted that one of the key reasons as to why pedestrian infrastructure is underfunded is because funding decisions are often based on performance and evaluation metrics biased towards regional automobility mobility rather than accessibility for pedestrians [48]. Examples of primarily automobility-oriented metrics include flow, capacity, and delay, which are inappropriately applied to active modes of transportation [48,49]. This mismatch shows the necessity of developing metrics that are applicable to the type of transportation being promoted, in this case, pedestrian mobility, and highlights how performance metrics for ADA transition plans could be used as part of future funding decisions.
4.2. Limitations
This study uniquely applies the NGT to the practical need for performance monitoring of ADA transition planning. Implementation and piloting of these performance metrics were not within the scope of this study, but it would be necessary to evaluate them for clarity and applicability in communities with ADA transition plans.
Ensuring adequate participation is critical to the success of the NGT. Because of the COVID-19 pandemic, the NGT process had to be conducted entirely via remote connection. While this may benefit some participants who might otherwise find it difficult to access in-person meetings, it likely changed the dynamics of participation in the NGT. Remote participation may have impacted the level of engagement from participants. In addition, some participants dropped out of the NGT process between the first and second workshops. Out of the 12 participants in Workshop #1, eight also participated in Workshop #2, along with two new participants with similar qualifications. Certain participants could not attend Workshop #2 due to schedule conflicts. These metrics could be used as a source of reference for accessibility legislation internationally, but they would need to be altered because these metrics were explicitly created for the US ADA requirements.
5. Conclusions
Disability legislation in the US and internationally has identified the need for criteria to evaluate the progress toward accessible infrastructure, as standardized performance metrics may help communities stay on track and make sufficient progress in removing barriers. However, the existing metrics lack sufficient details for documenting actionable steps to removing barriers in pedestrian infrastructure, leaving a large gap for cities to be able to track progress over time. Our study contributes to the current state of knowledge and practice on measuring inclusive cities by presenting a new set of more specific metrics that include both outcome and process measures to allow for the better documentation of action steps to remove barriers in pedestrian infrastructure that the existing metrics do not provide.
The performance metrics we developed in this study were tailored to ADA transition planning to facilitate greater transparency for the general public and speed progress toward universal accessibility. A similar NGT process could be used by other international cities to develop new or adapt the metrics presented in this paper. Local governments that use the performance metrics can establish a strong record of barrier removal in the pedestrian infrastructure network that can also serve to prevent lawsuits. The NGT process improved the quality of the final metrics generated. The evaluation of local government’s use of the metrics could further validate the metrics’ applicability and feasibility, ensuring that progress will be made to transform cities into more accessible and inclusive cities for all community members.
Author Contributions
The authors confirm that their contributions to this paper are as follows: study conception and design: Y.E., A.H., D.L., R.G. and R.J.; data collection: Y.E., A.H. and M.H.; analysis and interpretation of results: Y.E., M.H. and D.L.; draft manuscript preparation: Y.E., M.H. and A.H. All authors have read and agreed to the published version of the manuscript.
Funding
This project was funded by the National Institute on Disability, Independent Living, and Rehabilitation Research (Grant # 90DPAD0012).
Data Availability Statement
The raw data supporting the conclusions of this article will be made available by the authors on request.
Acknowledgments
We thank all our participants for their time and insights.
Conflicts of Interest
The authors declare no conflicts of interest.
References
- Lawson, A.; Eskytė, I.; Orchard, M.; Houtzager, D.; Vos, E.L.D. Pedestrians with Disabilities and Town and City Streets: From Shared to Inclusive Space? J. Public Space 2022, 7, 41–62. [Google Scholar] [CrossRef]
- Bozovic, T.; Hinckson, E.; Stewart, T.; Smith, M. How street quality influences the walking experience: An inquiry into the perceptions of adults with diverse ages and disabilities. J. Urban. Int. Res. Placemaking Urban Sustain. 2024, 17, 111–136. [Google Scholar] [CrossRef]
- Hwang, J. A factor analysis for identifying people with disabilities’ mobility issues in built environments. Transp. Res. Part F Traffic Psychol. Behav. 2022, 88, 122–131. [Google Scholar] [CrossRef]
- Levine, K.; Karner, A. Approaching accessibility: Four opportunities to address the needs of disabled people in transportation planning in the United States. Transp. Policy 2023, 131, 66–74. [Google Scholar] [CrossRef]
- Maisel, J.; Ranahan, M.; Choi, J. Factors Influencing Fixed-Route Transit Decision-Making: Exploring Differences by Disability and Community Type. J. Public Transp. 2021, 23, 1–15. [Google Scholar] [CrossRef]
- Desai, R.H.; Hamlin, E.; Eyler, A.; Putnam, M.; Stark, S.; Morgan, K. Identifying built environment factors influencing the community participation of adults aging with long-term physical disabilities: A qualitative study. Disabil. Soc. 2023, 2023, 1–26. [Google Scholar] [CrossRef]
- Kapsalis, E.; Jaeger, N.; Hale, J. Disabled-by-design: Effects of inaccessible urban public spaces on users of mobility assistive devices—A systematic review. Disabil. Rehabil. Assist. Technol. 2022, 2022, 1–19. [Google Scholar] [CrossRef] [PubMed]
- U.S. Department of Transportation. Equity Action Plan. January 2022. Available online: https://www.transportation.gov/sites/dot.gov/files/2022-04/Equity_Action_Plan.pdf (accessed on 8 November 2023).
- Okoro, C.A. Prevalence of Disabilities and Health Care Access by Disability Status and Type Among Adults—United States, 2016. MMWR Morb. Mortal. Wkly. Rep. 2018, 67, 882–887. [Google Scholar] [CrossRef]
- Americans with Disabilities Act of 1990, Title II; 1990; 42 U.S.C. §§ 12131–12134.
- Rehabilitation Act of 1973; 1973; 87 Stat. 355.
- Ferleger, D. Planning for Access: Sidewalks and the Americans with Disabilities Act. Plan. Environ. Law 2012, 64, 3–8. [Google Scholar] [CrossRef]
- Project Civic Access Page. Available online: https://archive.ada.gov/civicac.htm (accessed on 31 December 2023).
- History of United Nations and Persons with Disabilities—The Decade of the Nineties|United Nations Enable. Available online: https://www.un.org/development/desa/disabilities/history-of-united-nations-and-persons-with-disabilities-the-decade-of-the-nineties.html (accessed on 31 December 2023).
- Convention on the Rights of Persons with Disabilities (CRPD)|Division for Inclusive Social Development (DISD). Available online: https://social.desa.un.org/issues/disability/crpd/convention-on-the-rights-of-persons-with-disabilities-crpd (accessed on 31 December 2023).
- Standard Rules on the Equalization of Opportunities for Persons with Disabilities. OHCHR. Available online: https://www.ohchr.org/en/instruments-mechanisms/instruments/standard-rules-equalization-opportunities-persons-disabilities (accessed on 31 December 2023).
- Rebernik, N.; Szajczyk, M.; Bahillo, A.; Goličnik Marušić, B. Measuring Disability Inclusion Performance in Cities Using Disability Inclusion Evaluation Tool (DIETool). Sustainability 2020, 12, 1378. [Google Scholar] [CrossRef]
- Henderson-Wilson, C.; Andrews, F.; Wilson, E.; Tucker, R. Global Benchmarking of Accessible and Inclusive Cities. JoSI 2022, 13. Available online: https://drive.google.com/file/d/1tWfIgEEsEFIIPqZarY_M2aefi-bHb6s-/view (accessed on 6 January 2024). [CrossRef]
- Eisenberg, Y.; Heider, A.; Gould, R.; Jones, R. Are communities in the United States planning for pedestrians with disabilities? Findings from a systematic evaluation of local government barrier removal plans. Cities 2020, 102, 102720. [Google Scholar] [CrossRef]
- Jacob’s Engineering Group. ADA Transition Plans: A Guide to Best Management Practices. The National Academies National Academy of Sciences National Cooperative Highway Research Program: 2009. US. Available online: https://www.fhwa.dot.gov/indiv/docs/ada_transition_plans_report.pdf (accessed on 12 February 2019).
- Brault, M.; Harrison, O.; Gips, K.; Angel, J.; Blakeslee, K. Results from the Identifying Challenges to Implementing the ADA Survey for Cities and Towns in New England. New England ADA Center a Project of the Institute for Human Centered Design. 2021. Available online: https://ne-ada.s3.amazonaws.com/s3fs-public/ICIADA%20Final%20Paper%20Accessible.pdf (accessed on 12 February 2019).
- The Americans with Disabilities Act Title II Technical Assistance Manual Covering State and Local Government Programs and Services. Available online: https://archive.ada.gov/taman2.htm (accessed on 12 February 2019).
- TransitCenter, Applied Predictive Technologies (a Mastercard Company), Texas A&M Transportation Institute. Mobility Performance Metrics (MPM) for Integrated Mobility and Beyond. U.S Department of Transportation Federal Transit Administration. 2020. Available online: https://www.transit.dot.gov/sites/fta.dot.gov/files/docs/research-innovation/147791/mobility-performance-metrics-integrated-mobility-and-beyond-fta-report-no-0152.pdf (accessed on 8 November 2023).
- Van Looy, A.; Shafagatova, A. Business process performance measurement: A structured literature review of indicators, measures and metrics. SpringerPlus 2016, 5, 1797. [Google Scholar] [CrossRef] [PubMed]
- Best Practices in Performance Measurement Developing Performance Measures. A National State Auditors Association Best Practices Document. November 2004. Available online: https://www.nasact.org/files/News_and_Publications/White_Papers_Reports/NSAA%20Best%20Practices%20Documents/2004_Developing_Performance_Measures.pdf (accessed on 15 June 2022).
- Braun, L.M.; Barajas, J.M.; Lee, B.; Martin, R.; Mashraky, R.; Rathor, S.; Shrivastava, M. Construction of Pedestrian Infrastructure along Transit Corridors. Illinois Center for Transportation Department of Civil and Environmental Engineering University of Illinois at Urbana-Champaign. 2021. Available online: https://apps.ict.illinois.edu/projects/getfile.asp?id=9525 (accessed on 15 March 2023).
- Boddy, C. The Nominal Group Technique: An aid to Brainstorming ideas in research. Qual. Mark. Res. Int. J. 2012, 15, 6–18. [Google Scholar] [CrossRef]
- Sink, D.S. Using the nominal group technique effectively. Natl. Prod. Rev. 1983, 2, 173–184. [Google Scholar] [CrossRef]
- Kottmann, A.; Krüger, A.J.; Sunde, G.A.; Røislien, J.; Heltne, J.K.; Carron, P.N.; Lockey, D.; Sollid, S.J. Establishing quality indicators for pre-hospital advanced airway management: A modified nominal group technique consensus process. Br. J. Anaesth. 2022, 128, e143–e150. [Google Scholar] [CrossRef] [PubMed]
- Rankin, N.M.; McGregor, D.; Butow, P.N.; White, K.; Phillips, J.L.; Young, J.M.; Pearson, S.A.; York, S.; Shaw, T. Adapting the nominal group technique for priority setting of evidence-practice gaps in implementation science. BMC Med. Res. Methodol. 2016, 16, 110. [Google Scholar] [CrossRef] [PubMed]
- Wallace, S.J.; Worrall, L.; Rose, T.; Le Dorze, G.; Cruice, M.; Isaksen, J.; Kong, A.P.H.; Simmons-Mackie, N.; Scarinci, N.; Gauvreau, C.A. Which outcomes are most important to people with aphasia and their families? an international nominal group technique study framed within the ICF. Disabil. Rehabil. 2017, 39, 1364–1379. [Google Scholar] [CrossRef]
- Michel, D.E.; Iqbal, A.; Faehrmann, L.; Tadić, I.; Paulino, E.; Chen, T.F.; Moullin, J.C. Using an online nominal group technique to determine key implementation factors for COVID-19 vaccination programmes in community pharmacies. Int. J. Clin. Pharm. 2021, 43, 1705–1717. [Google Scholar] [CrossRef]
- Paulus, P.B.; Larey, T.S.; Ortega, A.H. Performance and Perceptions of Brainstormers in an Organizational Setting. Basic Appl. Soc. Psychol. 1995, 17, 249–265. [Google Scholar] [CrossRef]
- Paulus, P.B.; Larey, T.S.; Putman, V.L.; Leggett, K.L.; Roland, E.J. Social Influence Processing in Computer Brainstorming. Basic Appl. Soc. Psychol. 1996, 18, 3–14. [Google Scholar] [CrossRef]
- Pinsonneault, A.; Barki, H.; Gallupe, R.B.; Hoppen, N. Electronic Brainstorming: The Illusion of Productivity. Inf. Syst. Res. 1999, 10, 110–133. [Google Scholar] [CrossRef]
- Performance Measures Guidebook-Publications-Bicycle and Pedestrian Program-Environment-FHWA. Available online: https://www.fhwa.dot.gov/environment/bicycle_pedestrian/publications/performance_measures_guidebook/?_gl=1*17vzws*_ga*NzI3NDQ3ODcxLjE3MDQwNTMyNzk.*_ga_VW1SFWJKBB*MTcwNDA1MzI3OS4xLjEuMTcwNDA1MzM3MC4wLjAuMA (accessed on 31 December 2023).
- Performance Measurement & Metrics. October 2013. Available online: https://www.associationforum.org/homedec (accessed on 20 March 2023).
- 16 Process Metrics to Track|Indeed.com. Available online: https://www.indeed.com/career-advice/career-development/process-metrics (accessed on 31 December 2023).
- Sen, L.; Majumdar, S.R.; Highsmith, M.; Cherrington, L.; Weatherby, C. Performance Measures for Public Transit Mobility Management. Texas Southern University, Sam Houston State University, Texas Transportation Institute the Texas A&M University System. 2011. Available online: https://static.tti.tamu.edu/tti.tamu.edu/documents/0-6633-1.pdf (accessed on 15 June 2022).
- Eisenberg, Y.; Heider, A.; Labbe, D.; Gould, R.; Jones, R. Planning accessible cities: Lessons from high quality barrier removal plans. Cities 2024, 148, 104837. [Google Scholar] [CrossRef]
- Switzer, J.V. Local Government Implementation of the Americans With Disabilities Act: Factors Affecting Statutory Compliance. Policy Stud. J. 2001, 29, 654–662. [Google Scholar] [CrossRef]
- Condrey, S.E.; Brudney, J.L. The Americans with Disabilities Act of 1990: Assessing its Implementation in America’s Largest Cities. Am. Rev. Public Adm. 1998, 28, 26–42. [Google Scholar] [CrossRef]
- van Holstein, E.; Wiesel, I.; Legacy, C. Mobility justice and accessible public transport networks for people with intellectual disability. Appl. Mobilities 2022, 7, 146–162. [Google Scholar] [CrossRef]
- Americans with Disabilities Act|Indiana Division|Federal Highway Administration. Available online: https://www.fhwa.dot.gov/indiv/ada.cfm (accessed on 31 December 2023).
- Zehngebot, C.; Peiser, R. Complete Streets Come of Age. Planning Magazine, May 2014. Available online: https://www.planning.org/planning/2014/may/completestreets.htm(accessed on 20 March 2023).
- McCann, B.; Boutros, A.; Biton, A. Complete Streets: Prioritizing Safety for All Road Users. In FHWA-HRT-23-002; 2023; Volume 86, No. 4. Available online: https://highways.dot.gov/public-roads/winter-2023/complete-streets-prioritizing-safety-all-road-users (accessed on 15 June 2022).
- Seskin, S.; Kite, H.; Searfoss, L. Evaluating Complete Streets: A Guide for Practitioners. April 2015. Available online: https://smartgrowthamerica.org/wp-content/uploads/2023/04/evaluating-complete-streets-projects.pdf (accessed on 20 March 2023).
- Makarewicz, C.; Adkins, A.; Frei, C.; Wennink, A. “A little bit happy”: How performance metrics shortchange pedestrian infrastructure funding. Res. Transp. Bus. Manag. 2018, 29, 144–156. [Google Scholar] [CrossRef]
- Dumbaugh, E.; Tumlin, J.; Marshall, W. Decisions, Values, and Data: Understanding Bias in Transportation Performance Measures. ITE J. 2014, 84. Available online: https://www.ite.org/publications/ite-journal/ (accessed on 20 March 2023).
Figure 1.
Process for conducting nominal group technique.

Figure 2.
Distribution of scores for the performance metrics. Note: goal 1: involve people with disabilities (metrics 1–6); goal 2: assess the pedestrian infrastructure (metrics 7–9); goal 3: plan and prioritize barrier removal (metrics 10–16); goal 4: implement barrier removal in the pedestrian network (metrics 17–37); goal 5: evaluate whether progress toward goals is sufficient (metrics 38–53).


Table 1.
Goals and objectives developed for the ADA transition plan performance metrics.
| Goals | Objectives |
|---|---|
| Involve people with disabilities | Make the ADA transition plan easy to access by public—online/hard copy |
| Engage people with disability in the development and updating of the ADA transition plan | |
| Ensure that participation from people with disabilities is representative of the breadth of diversity in disability | |
| Adopt a well-functioning complaint and grievance protocol | |
| Assess the pedestrian infrastructure | Maintain inventory of pedestrian infrastructure compliance through in-person examination of infrastructure |
| Plan and prioritize barrier removal | Prioritize use of funds for greatest impact on accessibility |
| Manage funding sources | |
| Implement barrier removal in the pedestrian network | Remove barriers in the pedestrian network as prioritized in the ADA transition plan |
| Improve understanding of the cause of failure to meet targeted number barrier removals | |
| Support and sustain the ADA coordinator | |
| Use standards that ensure compliance with appropriate pedestrian infrastructure construction guidelines (methods) | |
| Ensure that new barriers are not created in construction/repair projects | |
| Evaluate whether progress toward goals is sufficient | ADA transition plan is updated annually and made available to the public |
| Develop and use system for monitoring progress | |
| Ensure responsible person is kept up to date | |
| Set benchmarking goals by comparing progress to peer organizations |
Table 2.
Criteria for evaluating ADA transition plan performance metrics used by the expert group.
| Criteria | Score | Meaning |
|---|---|---|
| Applicability | 3 (high applicability) | This metric meaningfully contributes to this objective in an effective way. Tracking this metric is useful to understand the completion of this objective/goal. |
| 2 (moderate applicability) | This metric somewhat shows progress towards completion of this goal/objective and fits best under this objective. | |
| 1 (low applicability) | This metric barely contributes to the completion of this goal and could be left out. This metric may fit better underneath another objective. | |
| 0 (not applicable) | This metric does not contribute to tracking progress or completion of this object or goal. | |
| Feasibility | 3 (high feasibility) | This metric is achievable for most municipalities. It does not require complex resources and can be completed in a reasonable timeframe. The completion of this metric can be measured objectively. |
| 2 (moderate feasibility) | The metric is achievable but may be challenging for smaller municipalities due to resource needs and timeframe requirements. The completion of this metric can be measured objectively. | |
| 1 (low Feasibility) | This metric is challenging for most municipalities due to resource needs and timeframe requirements. The completion of this metric may not be able to be measured objectively. | |
| 0 (not feasible) | This metric is not achievable by most municipalities due to demanding resources and time. |
Table 3.
Performance metrics and average priority scores generated from the NGT process.
| Goal | Objective | Metric | Average Priority Score | |
|---|---|---|---|---|
| Goal 1: Involve People with Disabilities | Objective 1: Engaged with people with disabilities (representatives from all types) in the development and updating of the ADA transition plan. | 1 | Utilized a diversity of platforms (min. X platforms) for collecting public input: online, in-person, and multiple languages | 2.5 |
| 2 | Advertised stakeholder meeting through min. of X media outlets (posted publicly, sent through listserv, social media, and direct outreach through disability organizations) | 2.81 | ||
| 3 | Created an advisory committee of X stakeholders and met X number of times | 2.25 | ||
| 4 | Partnered with local disability organizations, county and aging disability resource centers, VFW branches (community orgs that involve people with disabilities from diverse backgrounds), orientation and mobility specialists, travel trainers, etc., to hold feedback sessions during the development and after completion of the ADA transition plan | 2.56 | ||
| 5 | Evaluated participant engagement to ascertain if individuals with different experiences of disability, access, functional needs, and demographics were represented and targeted new outreach for those groups | 2.56 | ||
| 6 | Paid people with disabilities for their participation in developing the plan | 1.5 | ||
| Goal 2: Assess the Pedestrian Infrastructure | Objective 1: Maintain inventory of pedestrian infrastructure compliance through examination of infrastructure | 7 | Determined and documented scope of existing and planned infrastructure by area of jurisdiction at the time of evaluation | N/A |
| 8 | Examined X% of the pedestrian infrastructure in X time frame for compliance with applicable accessibility standards | 2.56 | ||
| 9 | Made inventory data available through an open data portal and included in an annual report | 1.94 | ||
| Goal 3: Plan and Prioritize Barrier Removal | Objective 1: Prioritize use of funds for greatest impact on accessibility | 10 | Partnered with individuals with disabilities, self-advocacy groups, and/or disability orgs across disability types to obtain representative feedback on barrier removal prioritization | 2.63 |
| 11 | Utilized prioritization matrix based on (1) existing compliance level, (2) proximity to critical community destinations (e.g., hospitals, schools, city hall), and (3) submissions from the public | N/A | ||
| Objective 2: Manage funding sources | 12 | Documented alignment of plans, funding sources, and budgets across departments and areas of jurisdiction (e.g., public works, transportation, parks, and recreation) | 2.5 | |
| 13 | Dedicated line item to implement ADA transition plan issues not covered by other funding | 2.19 | ||
| 14 | Provide status report to city council on funds expended towards barrier removal and pedestrian infrastructure maintenance (annually) | 2.25 | ||
| 15 | Annually updated sources and quantity of funding received for barrier removal projects | 2.25 | ||
| 16 | Annually updated sources and quantity of anticipated revenue expected for the coming year for barrier removal projects | 2.31 | ||
| Goal 4: Implement Barrier Removal in the Pedestrian Network | Objective 1: Remove barriers in the pedestrian network as prioritized in the ADA transition plan | 17 | Met or exceeded goals for increased percentage of accessible pedestrian infrastructure features in low-income/marginalized areas of a jurisdiction within specified time frame (e.g., 1 year) | 2.29 |
| 18 | Met or exceeded goals for identified barrier removal by citizen/resident complaints, suggestions, and stakeholders within specified time frame (e.g., 1 year) | 2 | ||
| 19 | Met or exceeded goals for increased percentage of accessible pedestrian infrastructure features throughout the whole jurisdiction within specified time frame (e.g., 1 year) | 2.43 | ||
| 20 | Met or exceeded goals for increased percentage of accessible pedestrian infrastructure features within ¼ mile of priority locations, such as transit stops/stations, institutions, and popular destinations within specified time frame (e.g., 1 year) | 2.36 | ||
| Objective 2: Improve understanding of the cause of any delays to meet targeted number for barrier removal | 21 | Used annual reporting to understand the status of target goals by investigated cause of delay for not meeting targets (list must include any missing targets that are new to the list and any that have appeared for more than three consecutive years) | 2.79 | |
| 22 | Developed and implemented one corrective action plan for X unmet targets/metrics | 1.71 | ||
| Objective 3: Support and sustain the ADA coordinator | 23 | Appointed an ADA coordinator | 2.81 | |
| 24 | Determined the level of certification and areas of competence for ADA coordinator | 2.29 | ||
| 25 | Made funds available for annual training for the ADA coordinator | 2.21 | ||
| 26 | Retained ADA liaison and/or ADA program area representative in each department/division to assist the ADA coordinator and form a council within internal departments | 2.21 | ||
| 27 | ADA coordinator position or role is sustained by making the job or role in job description permanent and non-appointed | 2.43 | ||
| 28 | The responsible official is in a position with budget authority to enforce ADA compliance (e.g., Director of Public Works or other department) and buy-in from the legislative body | 2.43 | ||
| 29 | A plan was documented for replacing the ADA coordinator if the coordinator leaves, such as having an interim coordinator hired/appointed in the case of the ADA coordinator being unavailable | 2.5 | ||
| Objective 4: Use standards that ensure compliance with appropriate pedestrian infrastructure construction guidelines (methods) | 30 | Design standards (preferably Public Rights-Of-Way Guidelines (PROWAGs)) were adopted by city council or other appropriate regulatory body and codified in legislation, regulations, by-law, or other appropriate formal documents | 2.93 | |
| 31 | Notice of adopted design standards was placed online with link to access detailed guidelines | 2.86 | ||
| 32 | Sent annual reminder to appropriate existing staff or provide new staff with instructions for where and how to access most recent, up to date ADA guidelines | 2.36 | ||
| Objective 5: Ensure that new barriers are not created in construction/repair projects | 33 | Established ADA training for the inspection process of pedestrian infrastructure for contractors, inspectors, designers, project manager(s), and students in state design/architecture programs | 2.71 | |
| 34 | Established accessibility contract language that covers requirements and penalties for construction/repair projects | N/A | ||
| 35 | Reviews completed for all permitted construction projects in person or with photographs for compliance with design standards before committing final payment | 2.5 | ||
| 36 | Identified and documented reasons why construction fails ADA inspection | 2.57 | ||
| 37 | Increased percentage of pedestrian infrastructure construction/repair that passes inspection after the initial review annually | 2.07 | ||
| Goal 5: Evaluate Whether Progress Toward Goals is Sufficient | Objective 1: The ADA transition plan is easy to access by the public online and by hard copy | 38 | Published transition plan online is easily accessible through simple search engine inquiry on at least one city/government website | 2.94 |
| 39 | Published plan in hard copy available in person at the local agency’s city hall and libraries | 2.63 | ||
| 40 | Published plan in accessible formats using plain language and in multiple languages based on constituency. | 2.13 | ||
| 41 | Developed an online (GIS) map with easy navigation for constituency | 1.44 | ||
| Objective 2: ADA transition plan is updated regularly (time frame specified by community (1–3 years recommended) and made available to the public) | 42 | Written progress report for ADA transition planning has been updated regularly (every 1–3 years) | 2.36 | |
| 43 | Updated plan and related documents are published on city/government website and a hard copy available at city hall and other governmental buildings | 2.71 | ||
| Objective 3: Adopt a well-functioning complaint and grievance procedure | 44 | ADA coordinator is listed on the city website as point of contact for grievances | 3 | |
| 45 | Developed an online complaint/awareness system available through the city website, 311 system, or an app when available | 2.69 | ||
| 46 | Established time goals (# of business days, weeks) for each step of addressing incoming complaints | 2.88 | ||
| 47 | Created a system for delivering status updates on complaints until resolution where applicable and if not, still submitted some type of response to complaint | 2.63 | ||
| 48 | Documented and shared in an annual report how complaints or requests for accommodations were addressed or achieved | 2.31 | ||
| Objective 4: Develop and use system for monitoring progress by ADA coordinator | 49 | Adopted system for monitoring progress in achieving barrier removal targets | 2.36 | |
| 50 | Appropriate staff across departments can access and update the system | 2.14 | ||
| 51 | System is used in annual reporting and evaluation of progress | 2.36 | ||
| Objective 5: Ensure responsible person is up to date | 52 | Updated websites and documents with current information of responsible staff within X amount of time after a change | 2.43 | |
| 53 | Created a shared email and phone that allows a team to respond to inquiry | 2.64 |
Note: The metrics with scores that are labeled NA do not have scores from the survey because they were added after the survey was sent in response to additional comments from the experts.
Disclaimer/Publisher’s Note: The statements, opinions and data contained in all publications are solely those of the individual author(s) and contributor(s) and not of MDPI and/or the editor(s). MDPI and/or the editor(s) disclaim responsibility for any injury to people or property resulting from any ideas, methods, instructions or products referred to in the content. |
© 2024 by the authors. Licensee MDPI, Basel, Switzerland. This article is an open access article distributed under the terms and conditions of the Creative Commons Attribution (CC BY) license (https://creativecommons.org/licenses/by/4.0/).
Share and Cite
MDPI and ACS Style
Eisenberg, Y.; Hayes, M.; Hofstra, A.; Labbé, D.; Gould, R.; Jones, R. Performance Metrics for Implementation of Americans with Disabilities Act Transition Plans. Urban Sci. 2024, 8, 27. https://doi.org/10.3390/urbansci8020027
AMA Style
Eisenberg Y, Hayes M, Hofstra A, Labbé D, Gould R, Jones R. Performance Metrics for Implementation of Americans with Disabilities Act Transition Plans. Urban Science. 2024; 8(2):27. https://doi.org/10.3390/urbansci8020027
Chicago/Turabian StyleEisenberg, Yochai, Mackenzie Hayes, Amy Hofstra, Delphine Labbé, Robert Gould, and Robin Jones. 2024. "Performance Metrics for Implementation of Americans with Disabilities Act Transition Plans" Urban Science 8, no. 2: 27. https://doi.org/10.3390/urbansci8020027