Analysis of Upper-Limb and Trunk Kinematic Variability: Accuracy and Reliability of an RGB-D Sensor

 , ,
, ,
Abstract
:1. Introduction
2. Materials and Methods
2.1. Participants
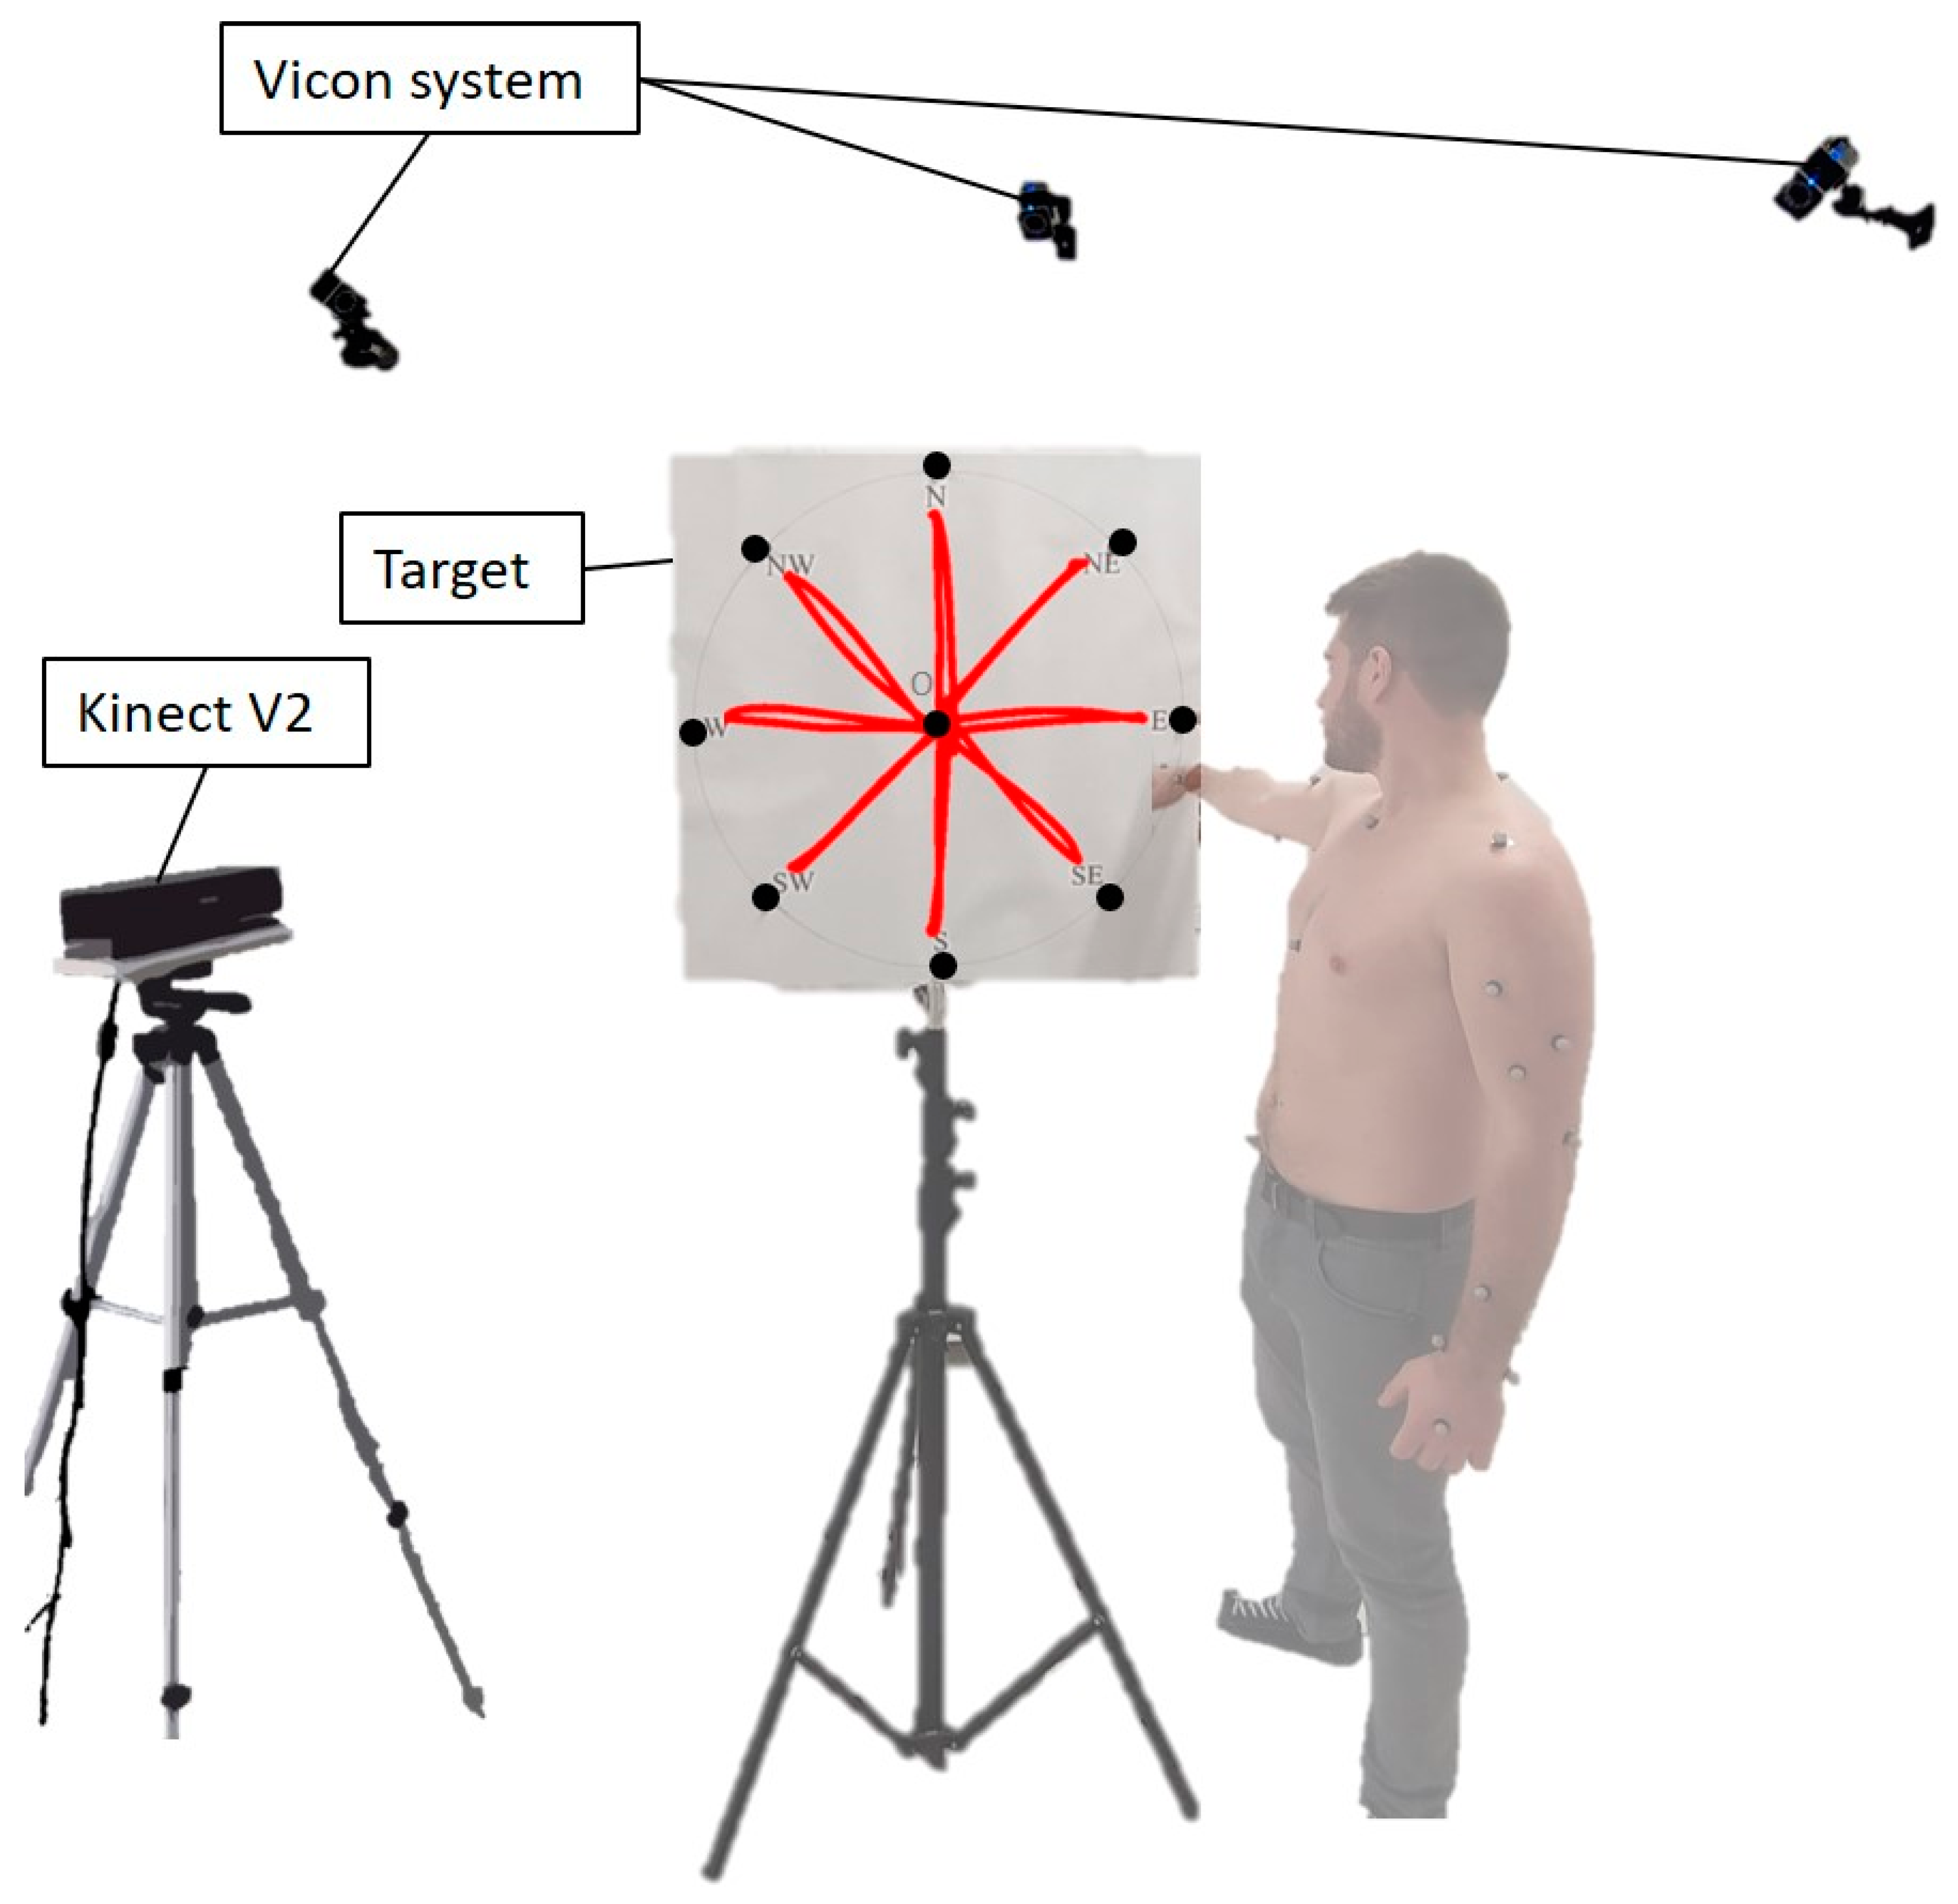
2.2. Equipment
- One Vicon Vero system, composed of 10 infrared cameras; a set of reflective markers for motion tracking to be used with the Vicon system. In this experimental condition, 34 markers were used (25 for the upper-limb model, 9 for the target);
- One Kinect V2.0 device to track the human body in space. Kinect uses an RGB-D camera, for frame acquisition at 30 Hz sampling frequency, and a time of flight infrared camera, for depth sensing. For more in-depth on the Kinect systems, exhaustive details can be found in previous works [55,56]. The Kinect was mounted on an easel and was at about 2.5 m from the recorded scene for best tracking [52];
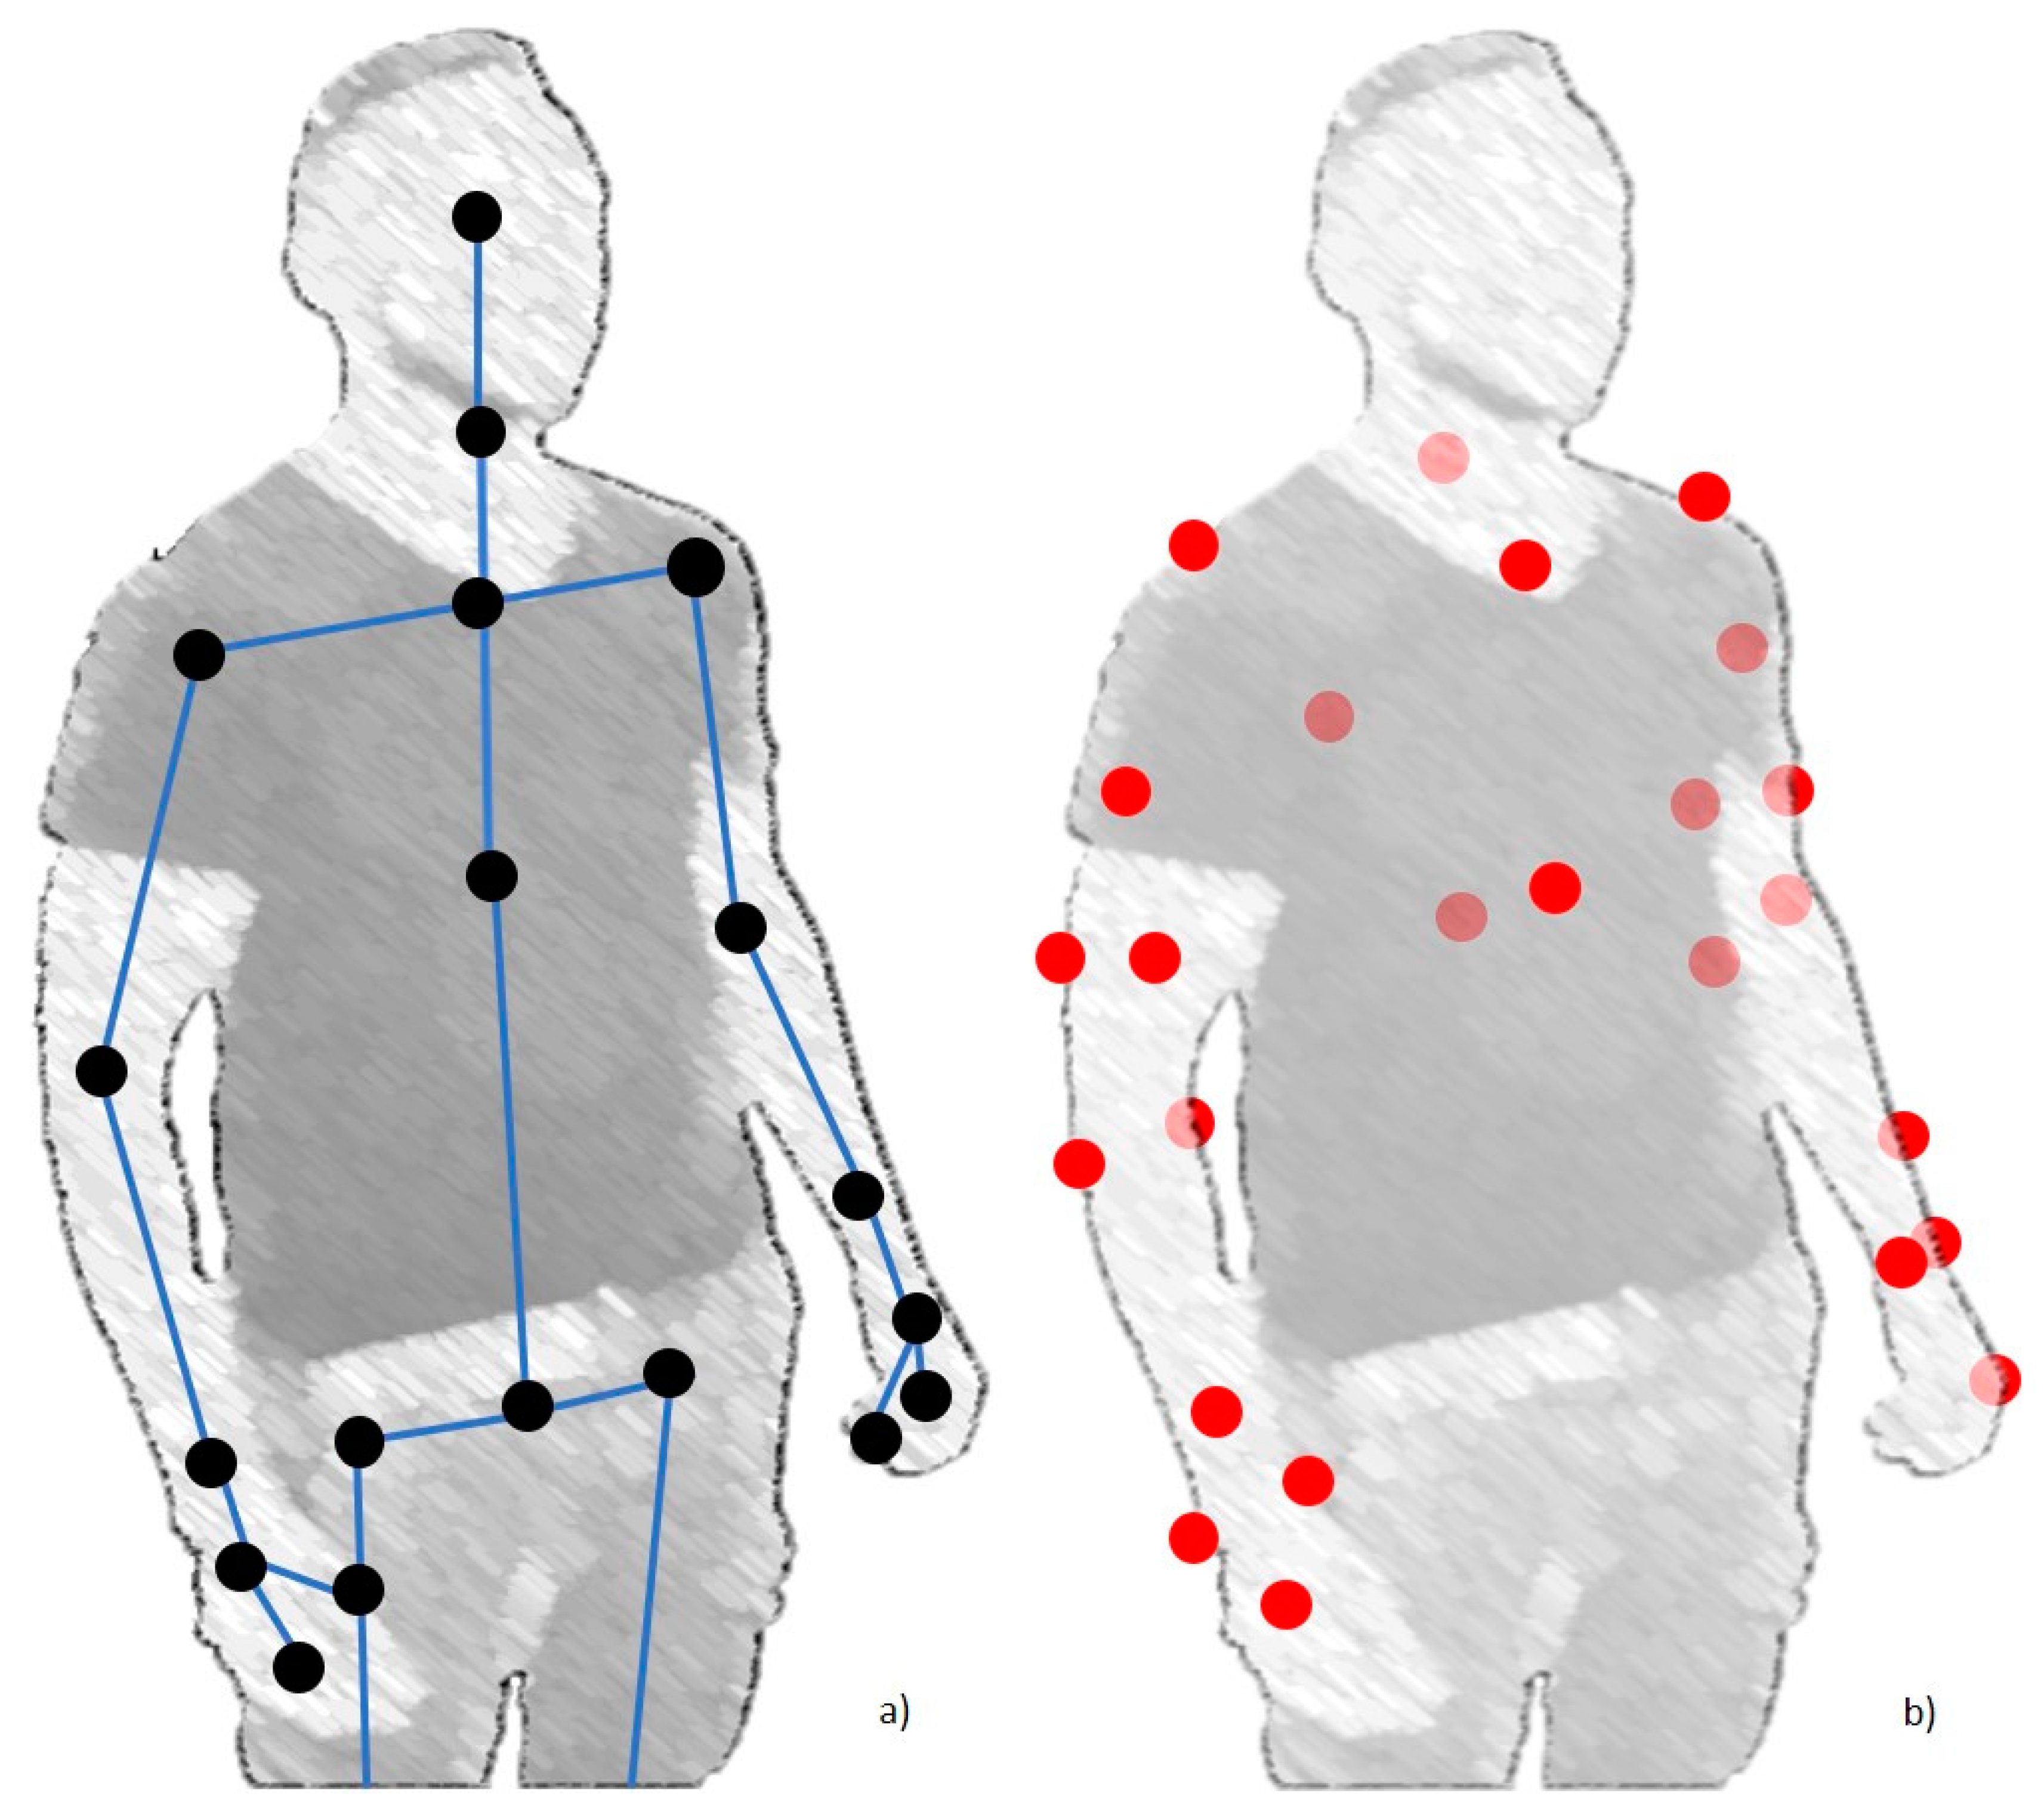
- Two general purpose computers: the first one connected to the Vicon system and containing the software for the acquisition and for the pre-processing of the tracking data, and the second one containing a custom-made software in C#, which communicated directly with the Kinect V2 device. It could generate a file containing 25 points of interest composing the SDK Kinect skeleton;
- One 60 cm diameter circular target with 9 points of interest named N, NE, E, SE, S, SW, W, NW, and O. This target was used as a reference for the subjects to execute point-to-point and workspace exploration movements [57].
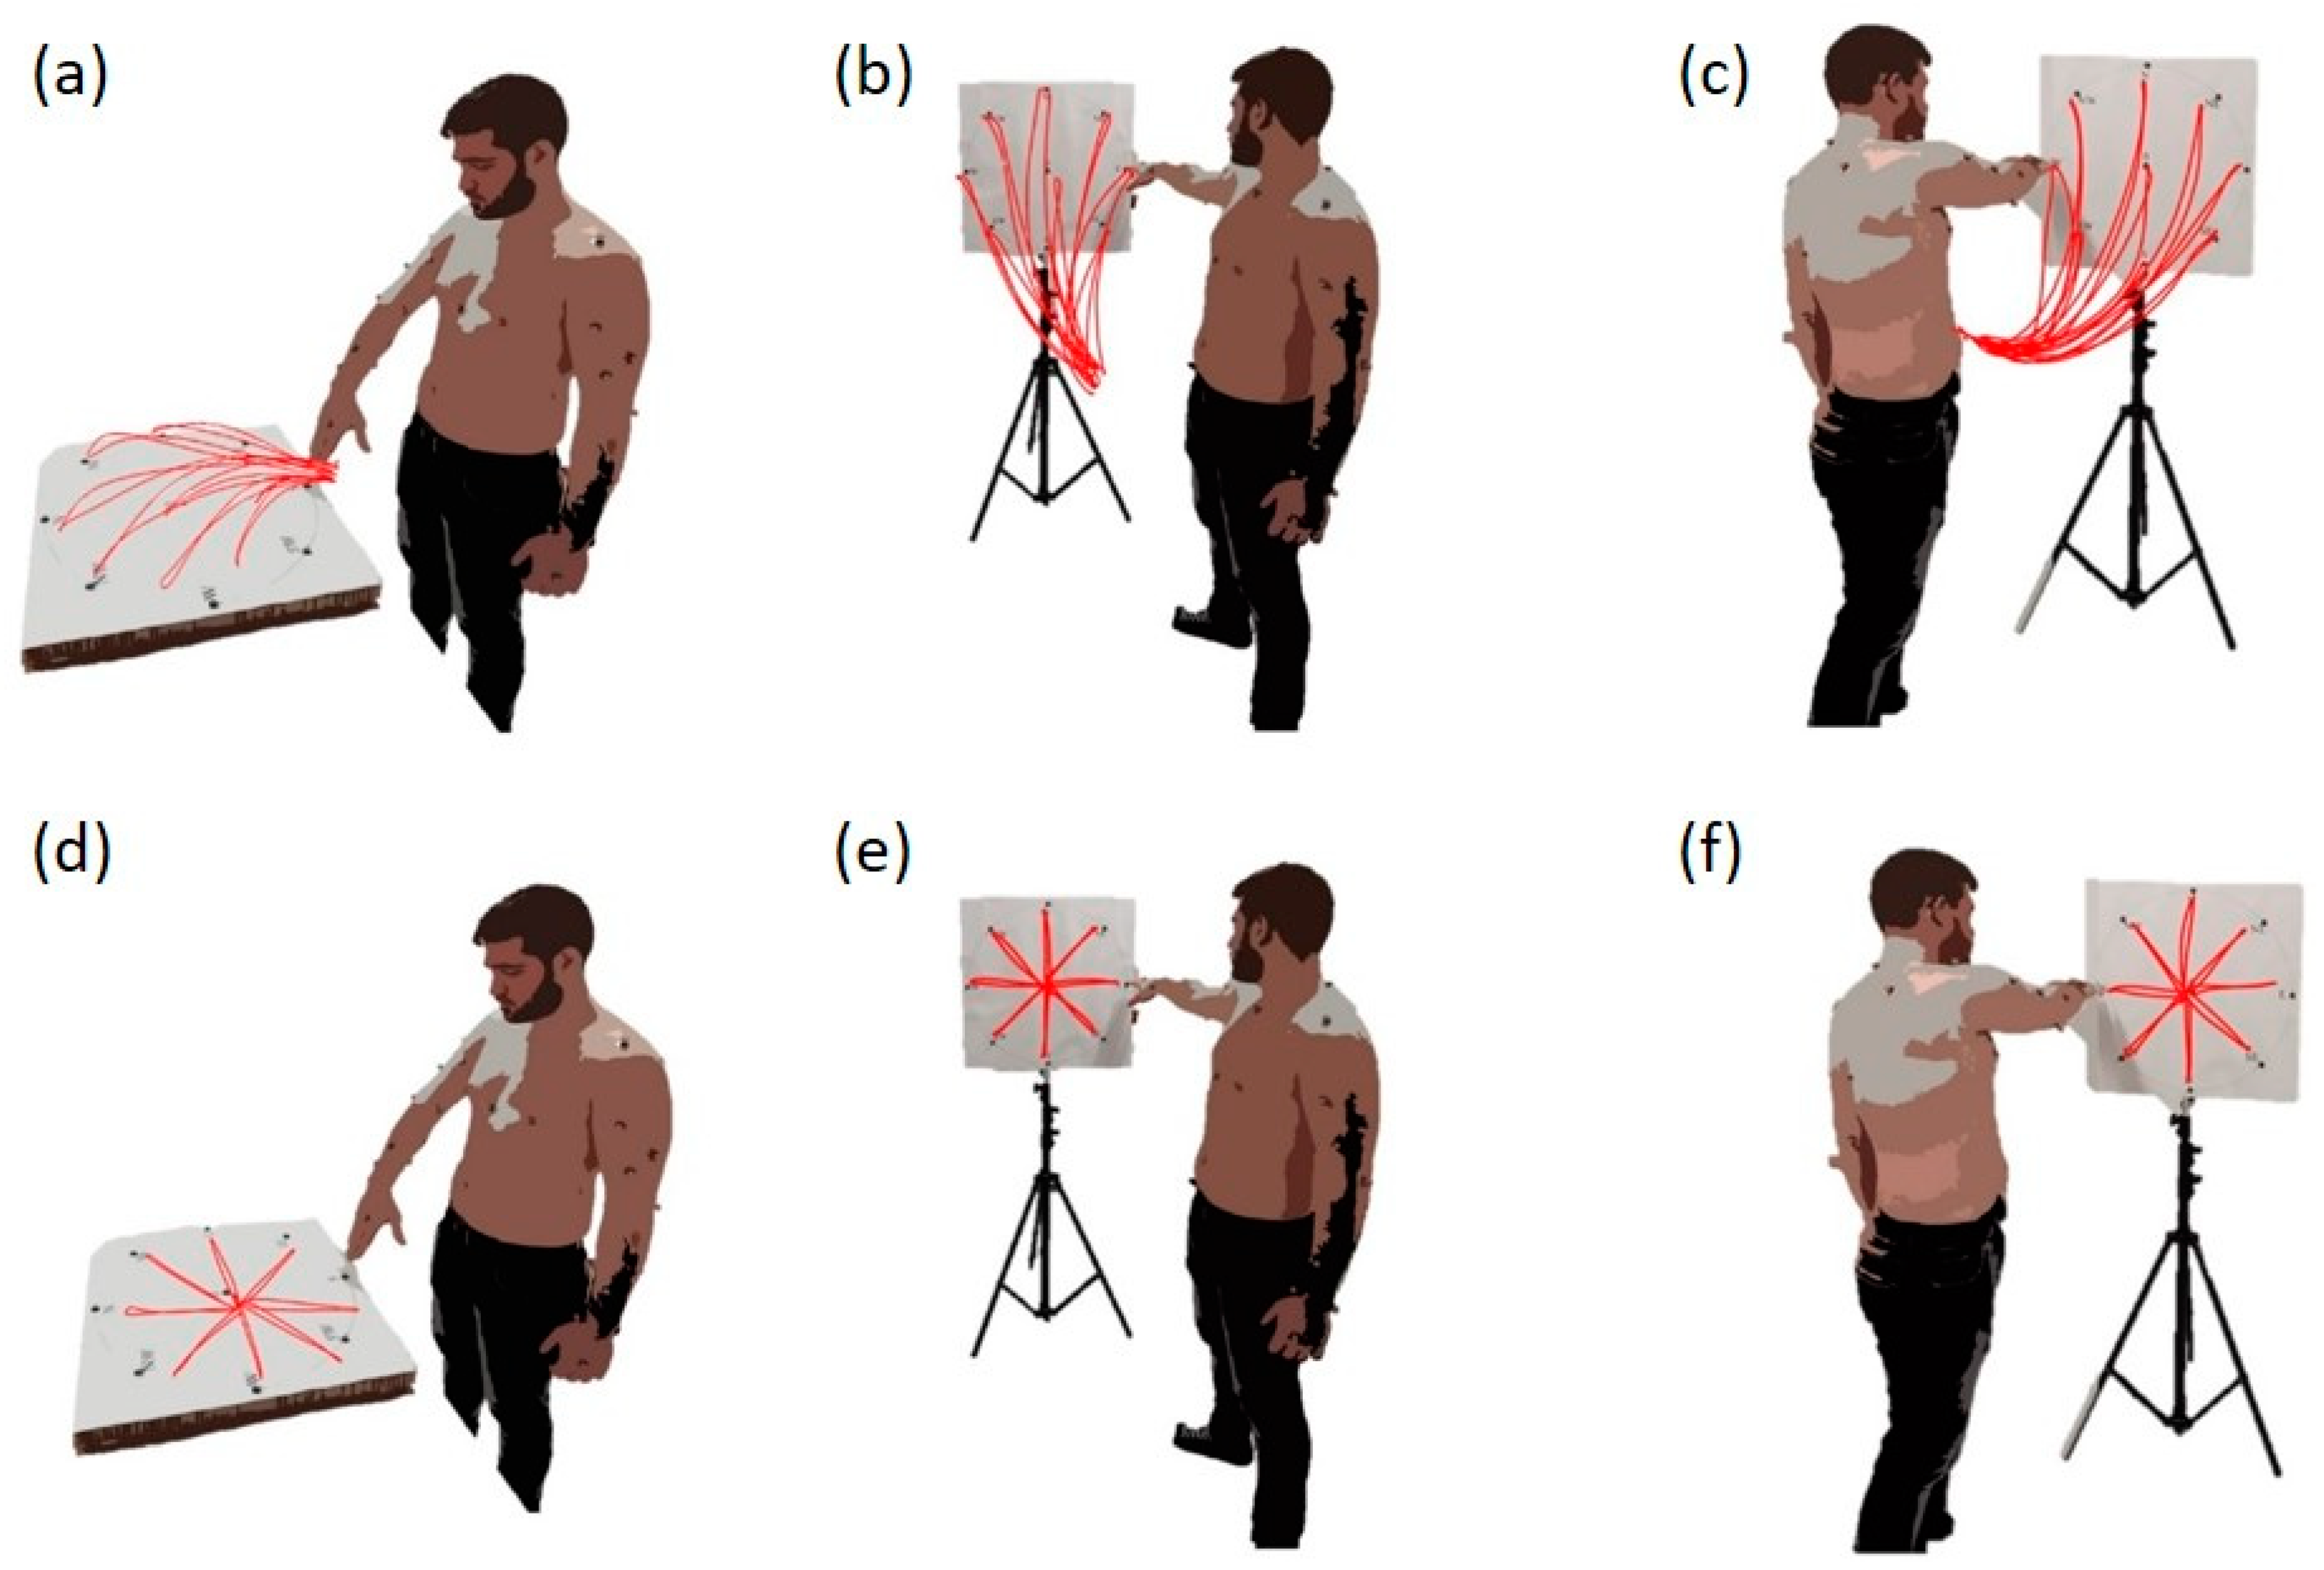
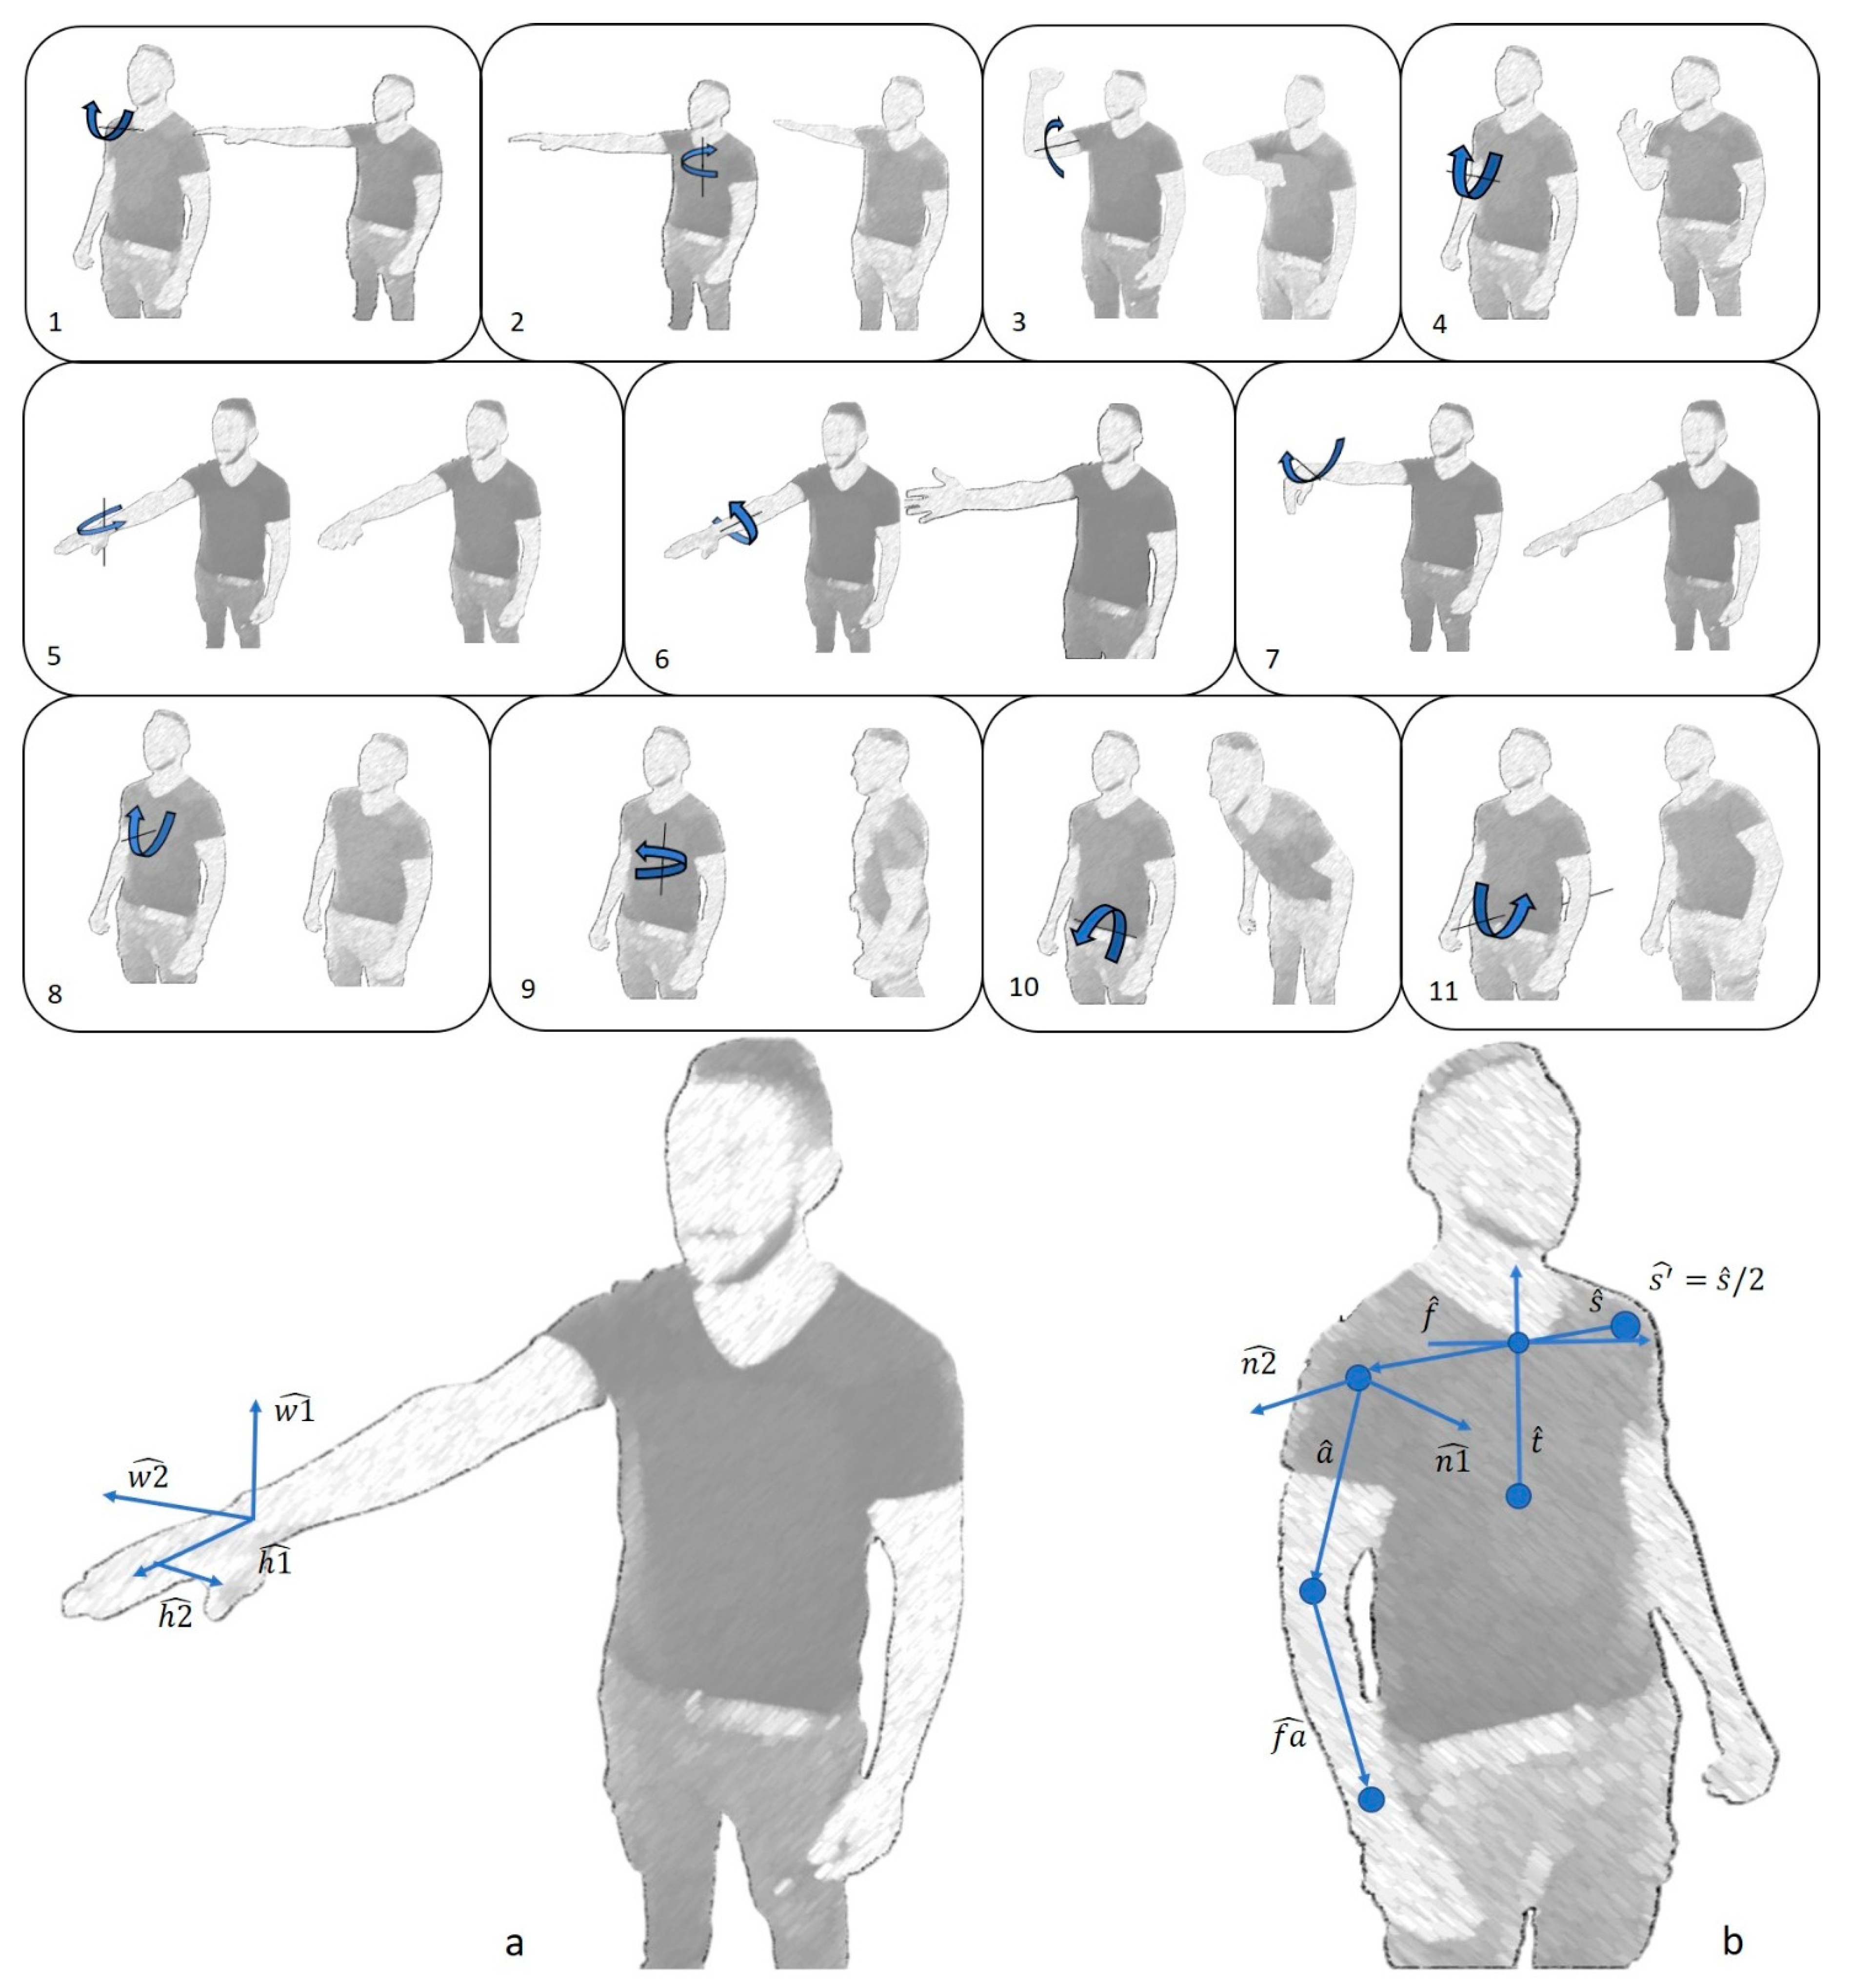
2.3. Movement Selection
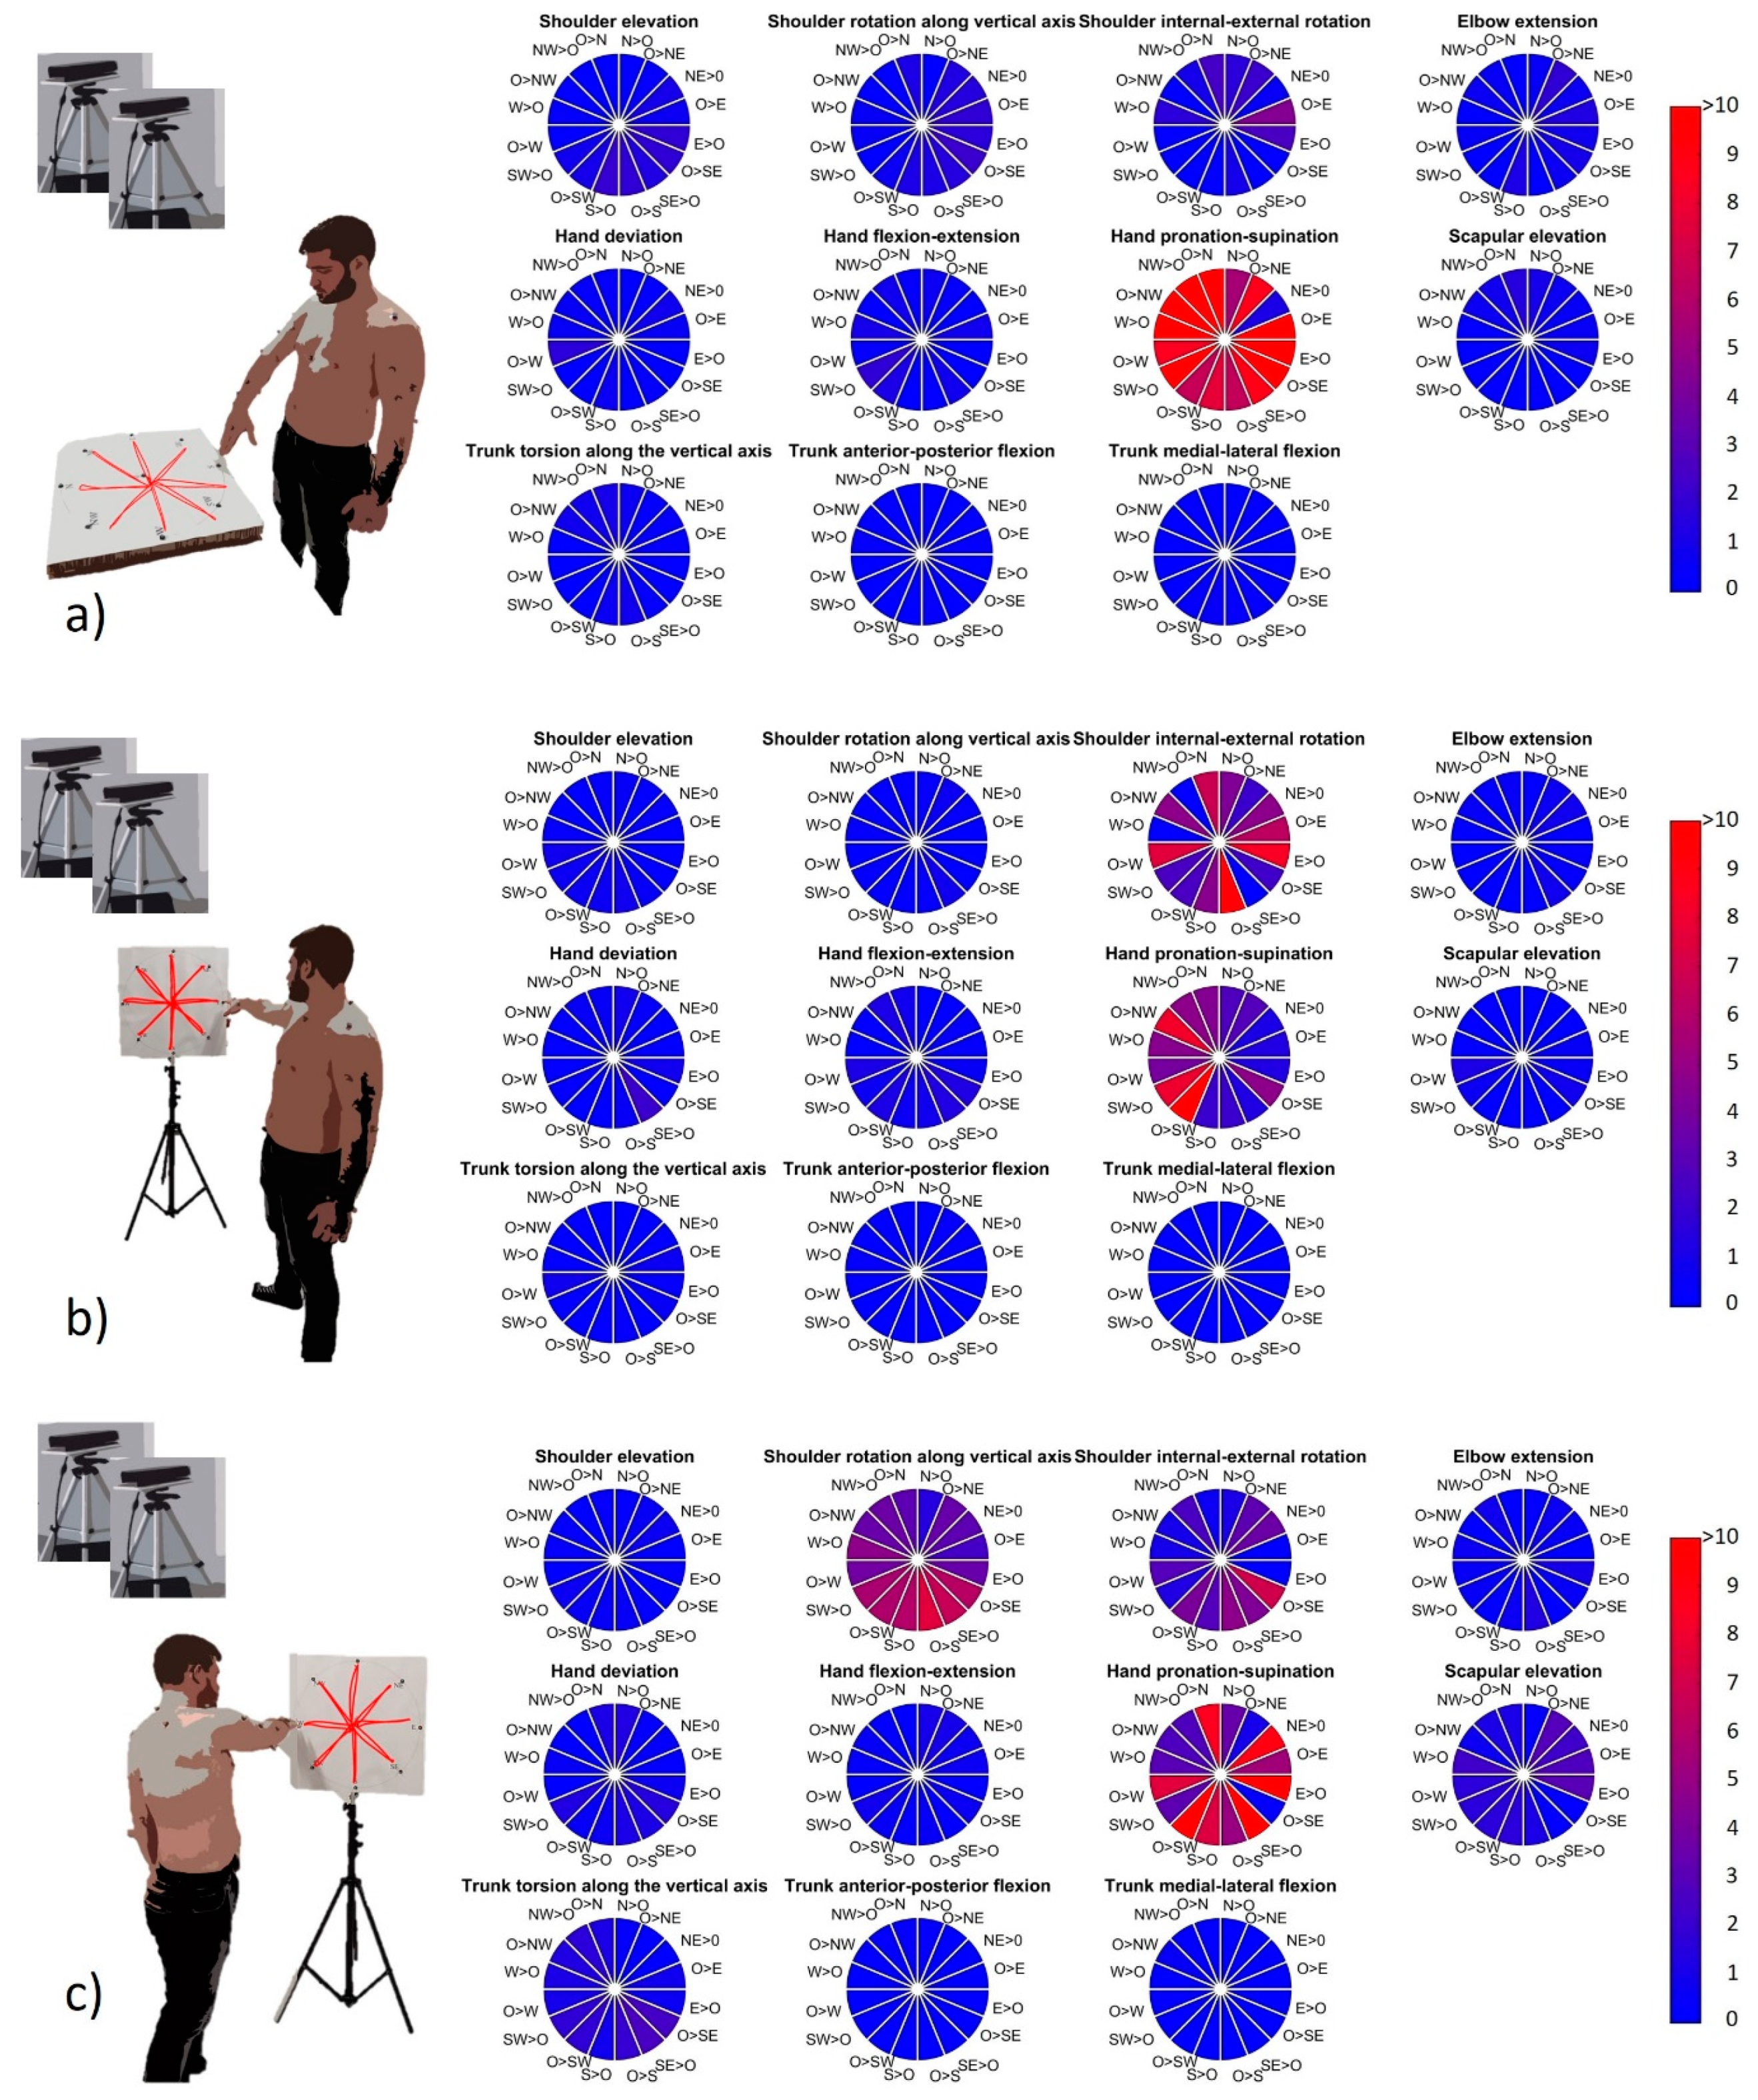
2.4. Experimental Set-Up
2.5. Acquisition
2.6. Data Analysis
2.7. Outcome Measures and Statistical Analysis
3. Results
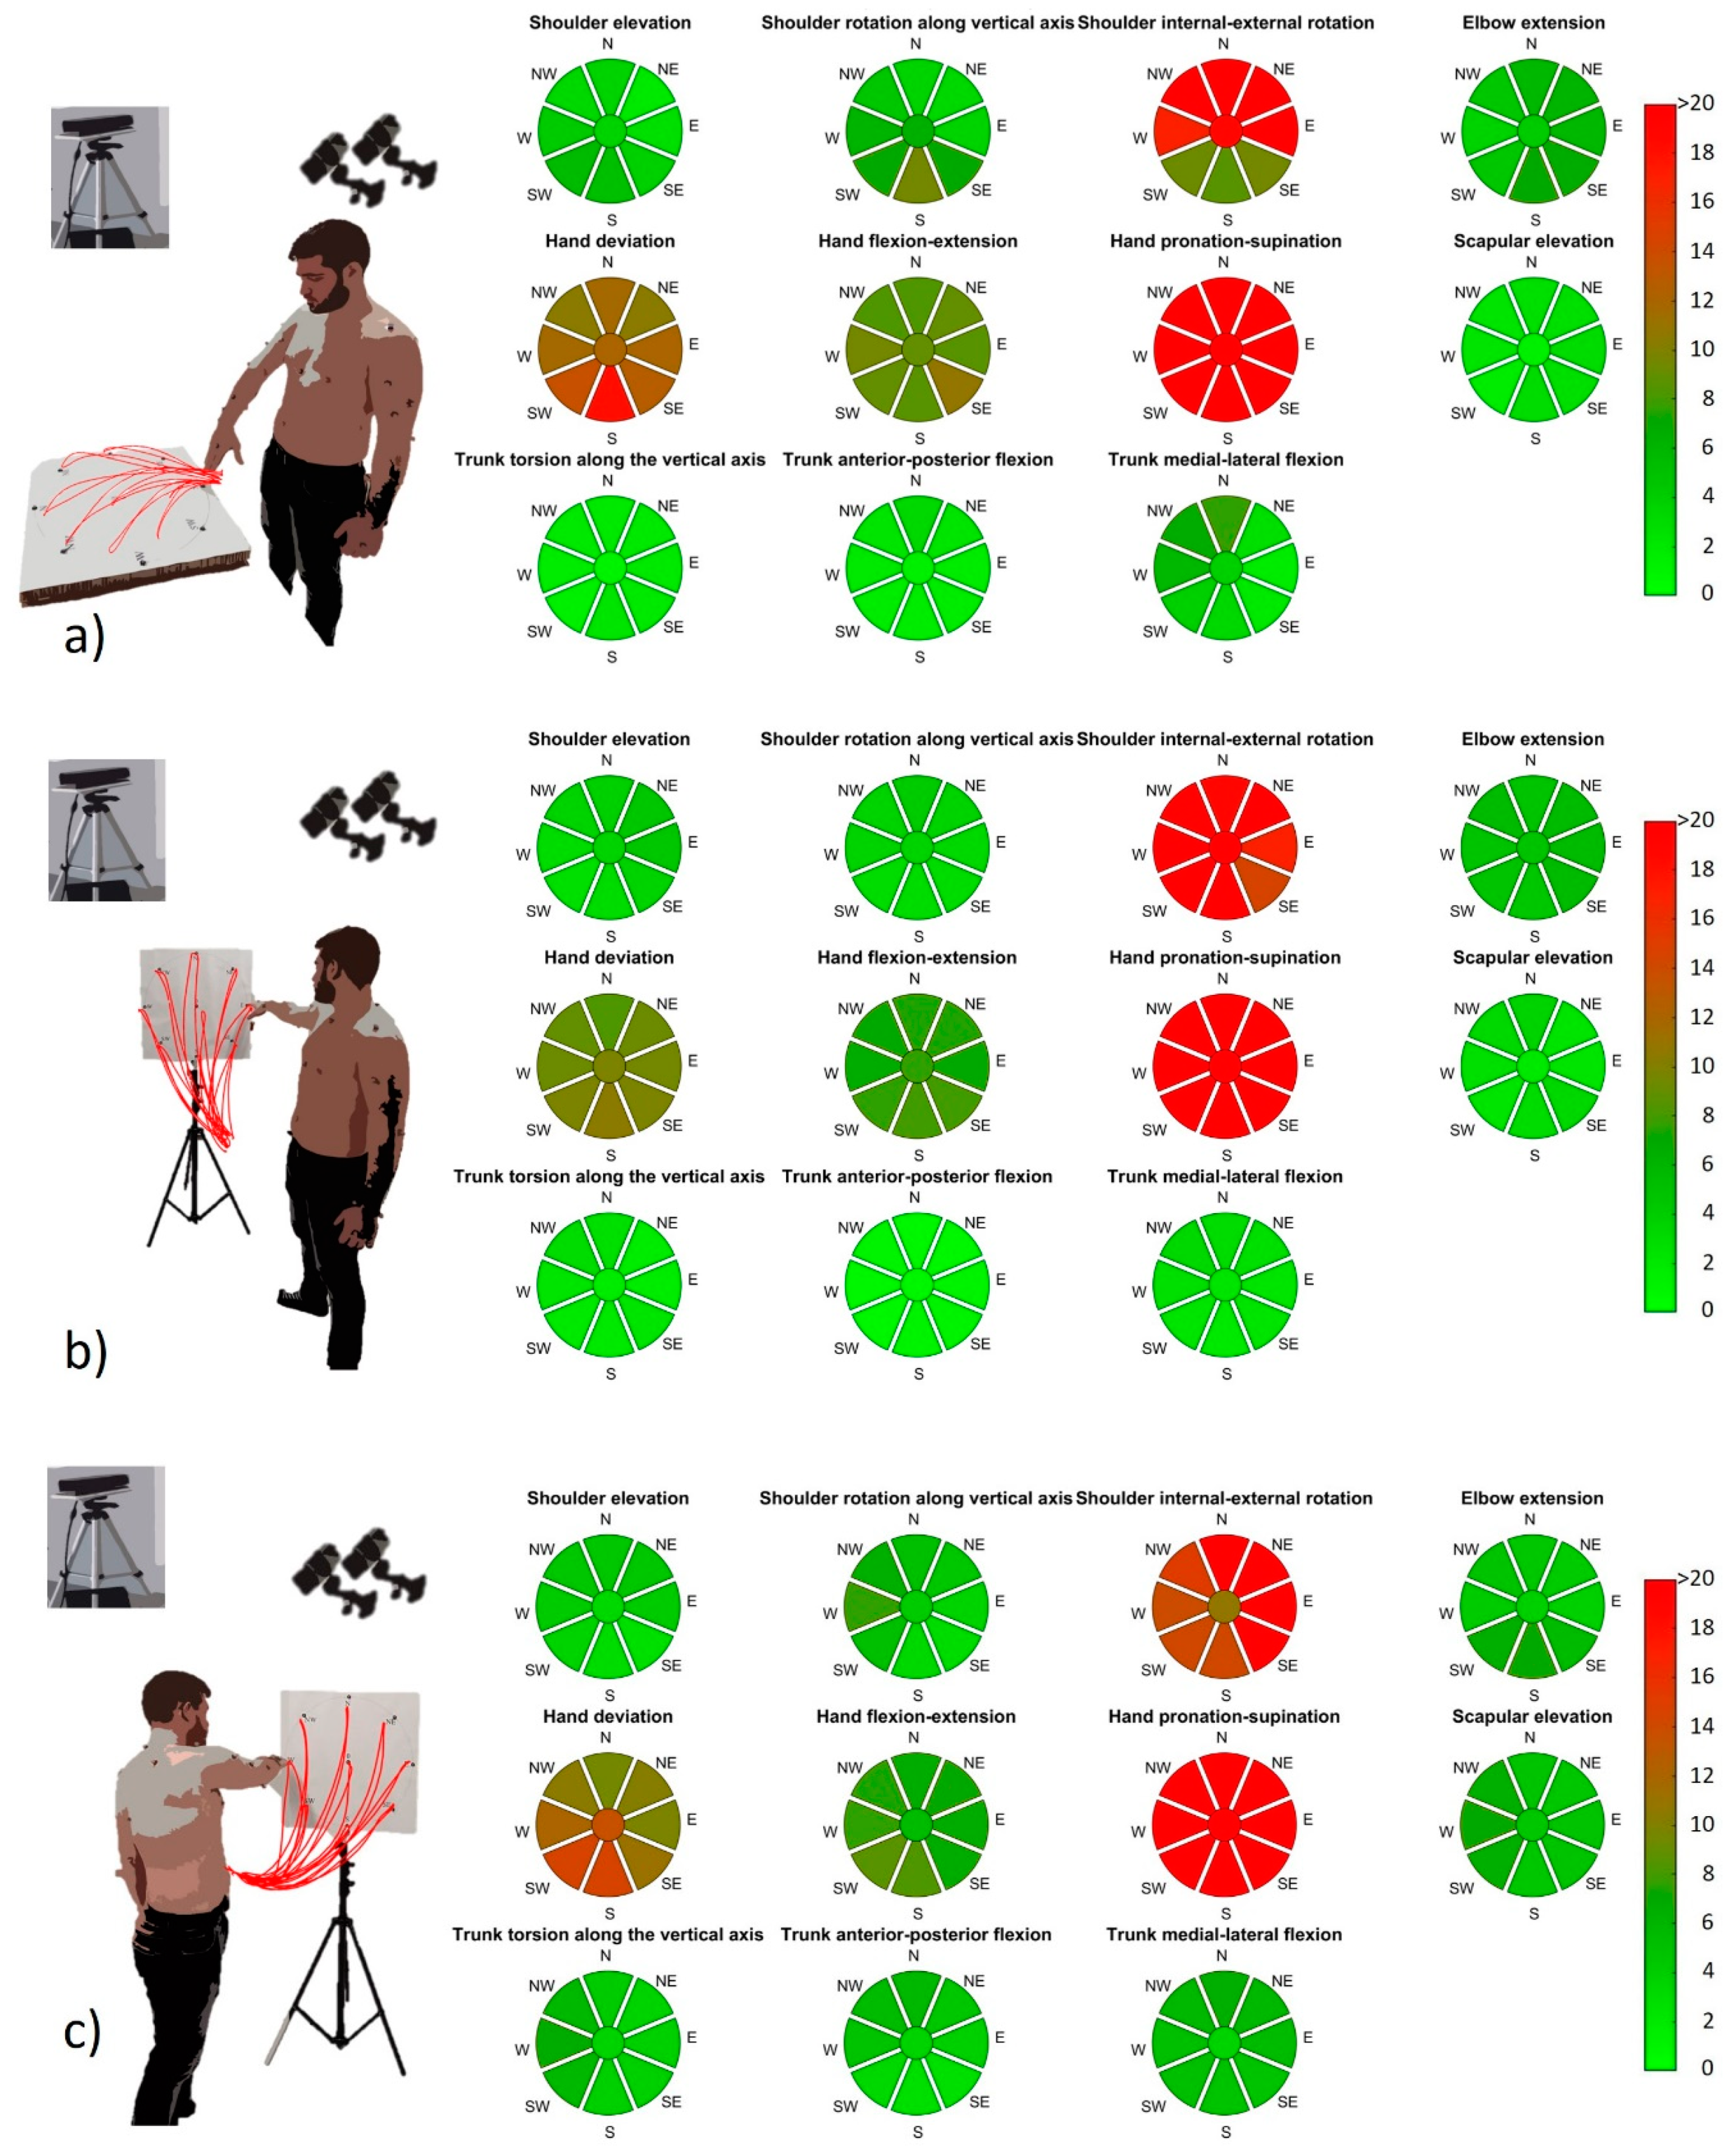
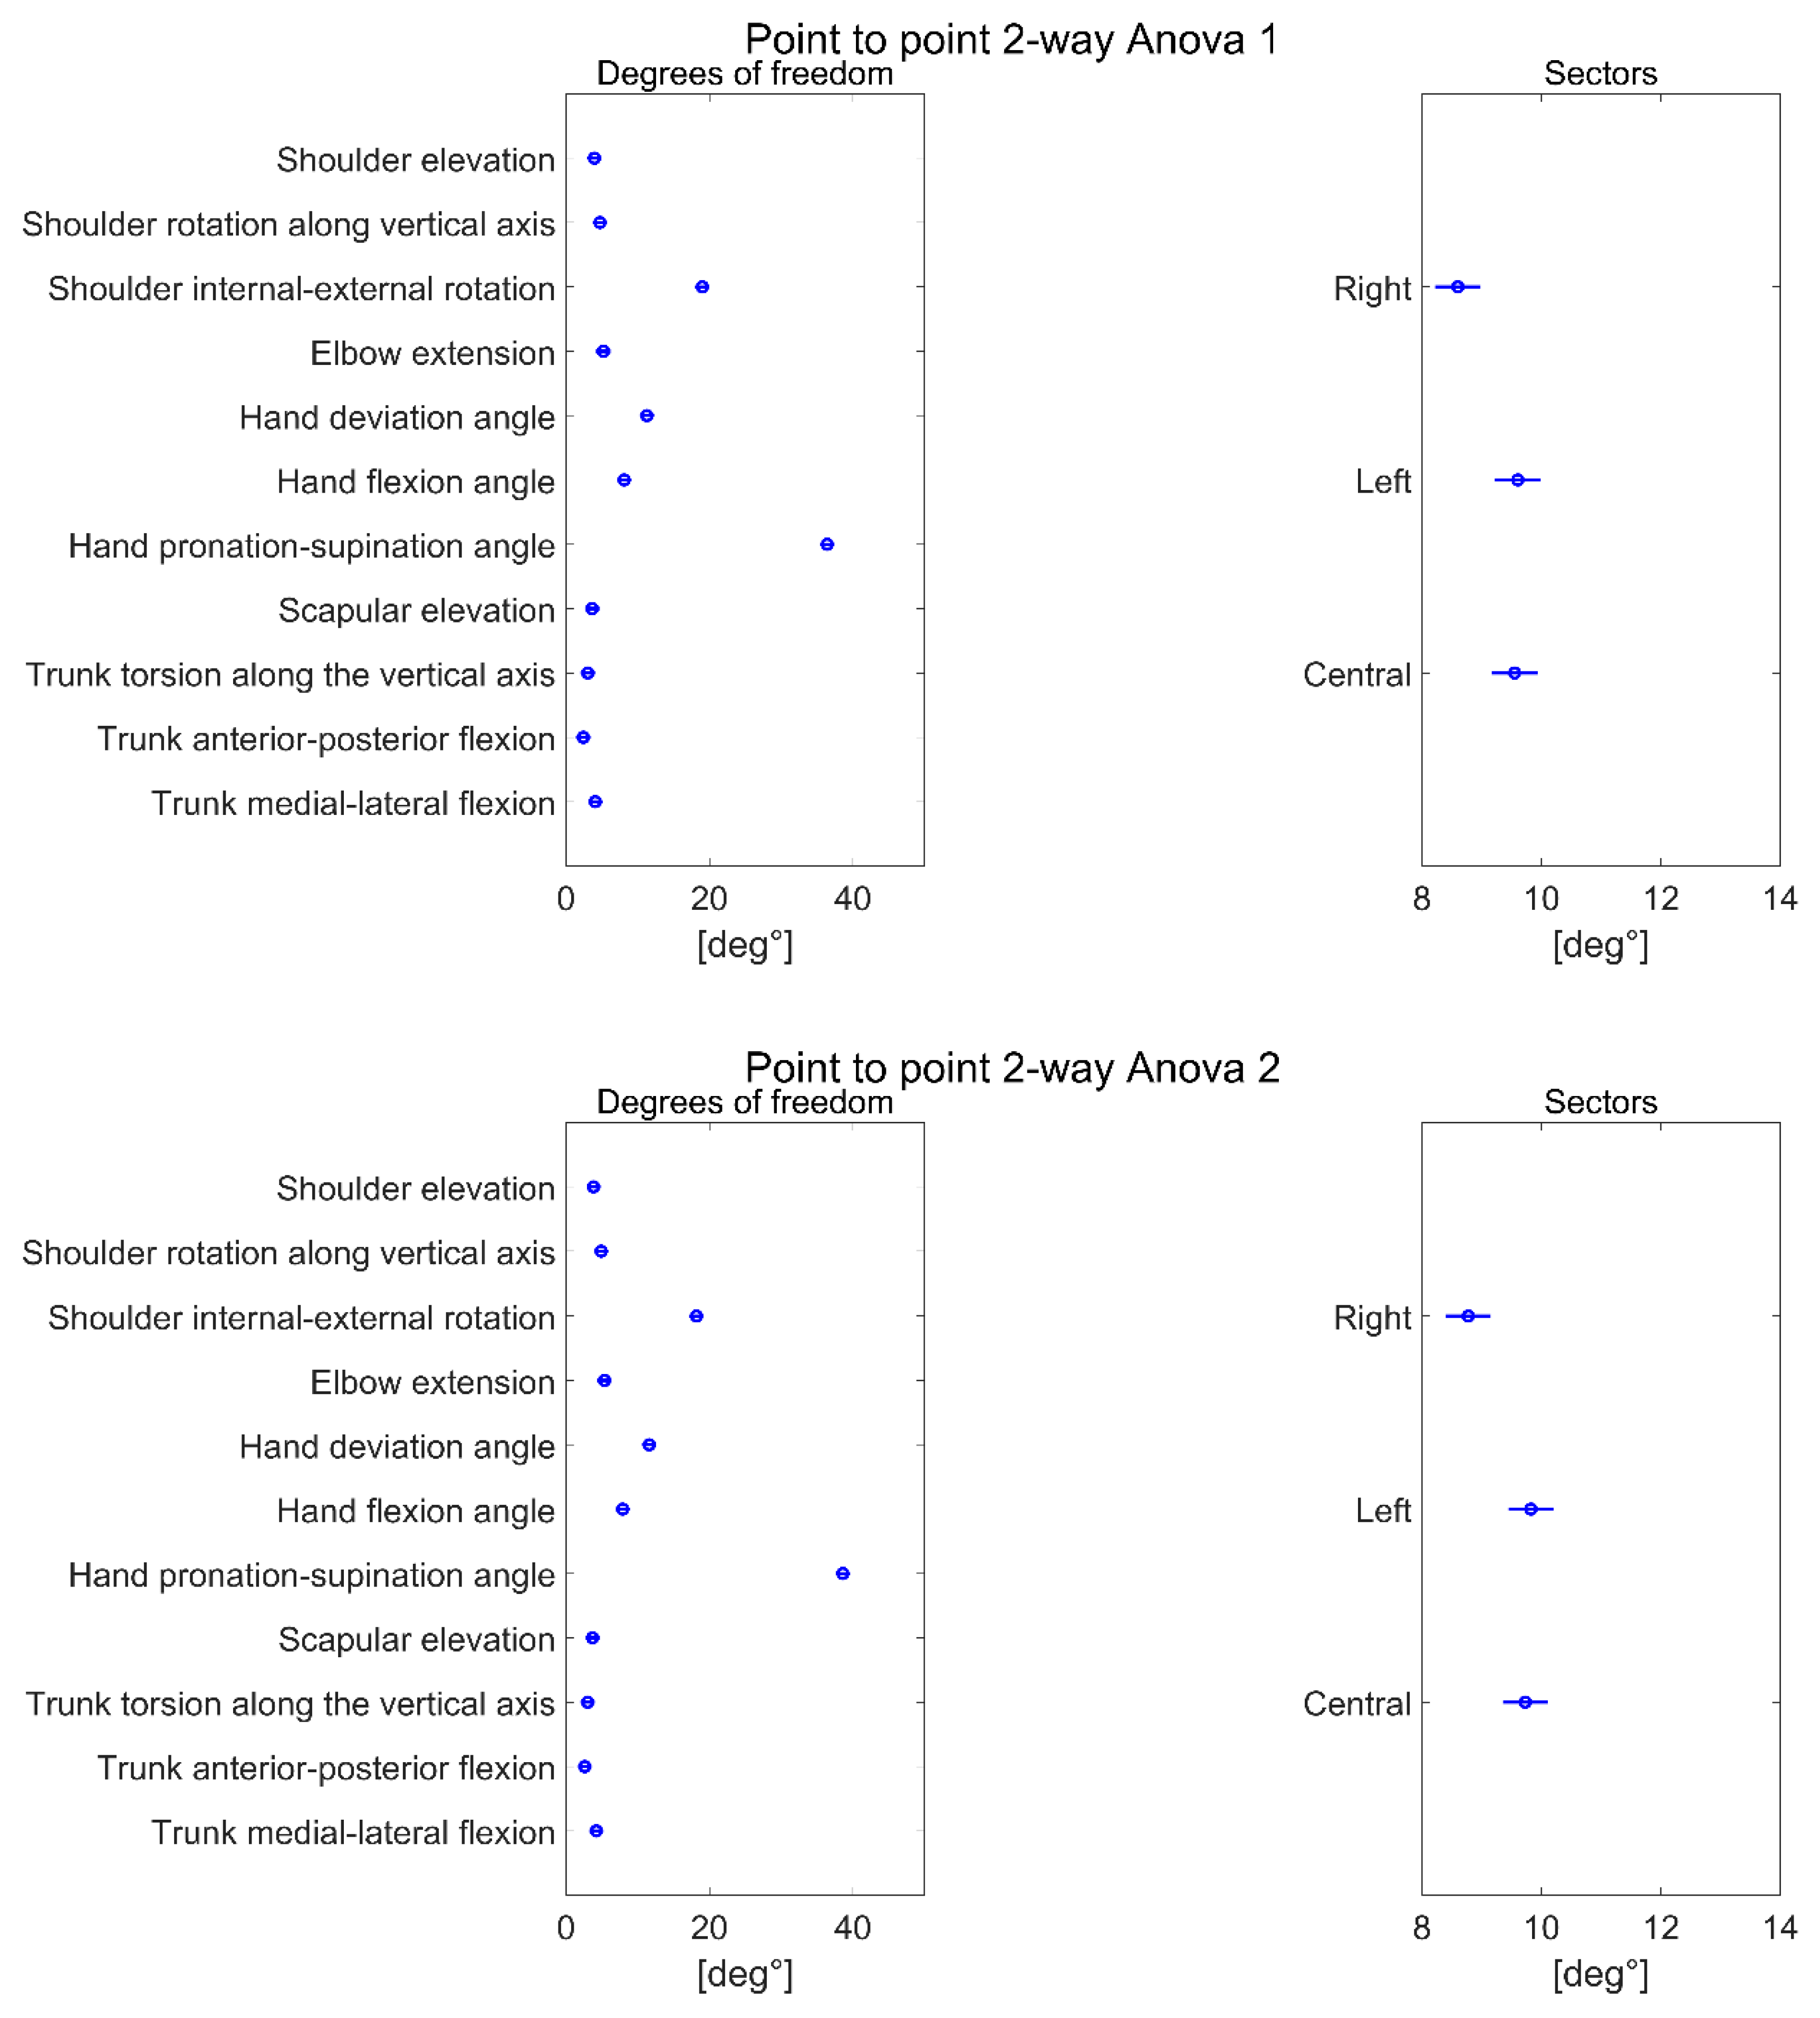
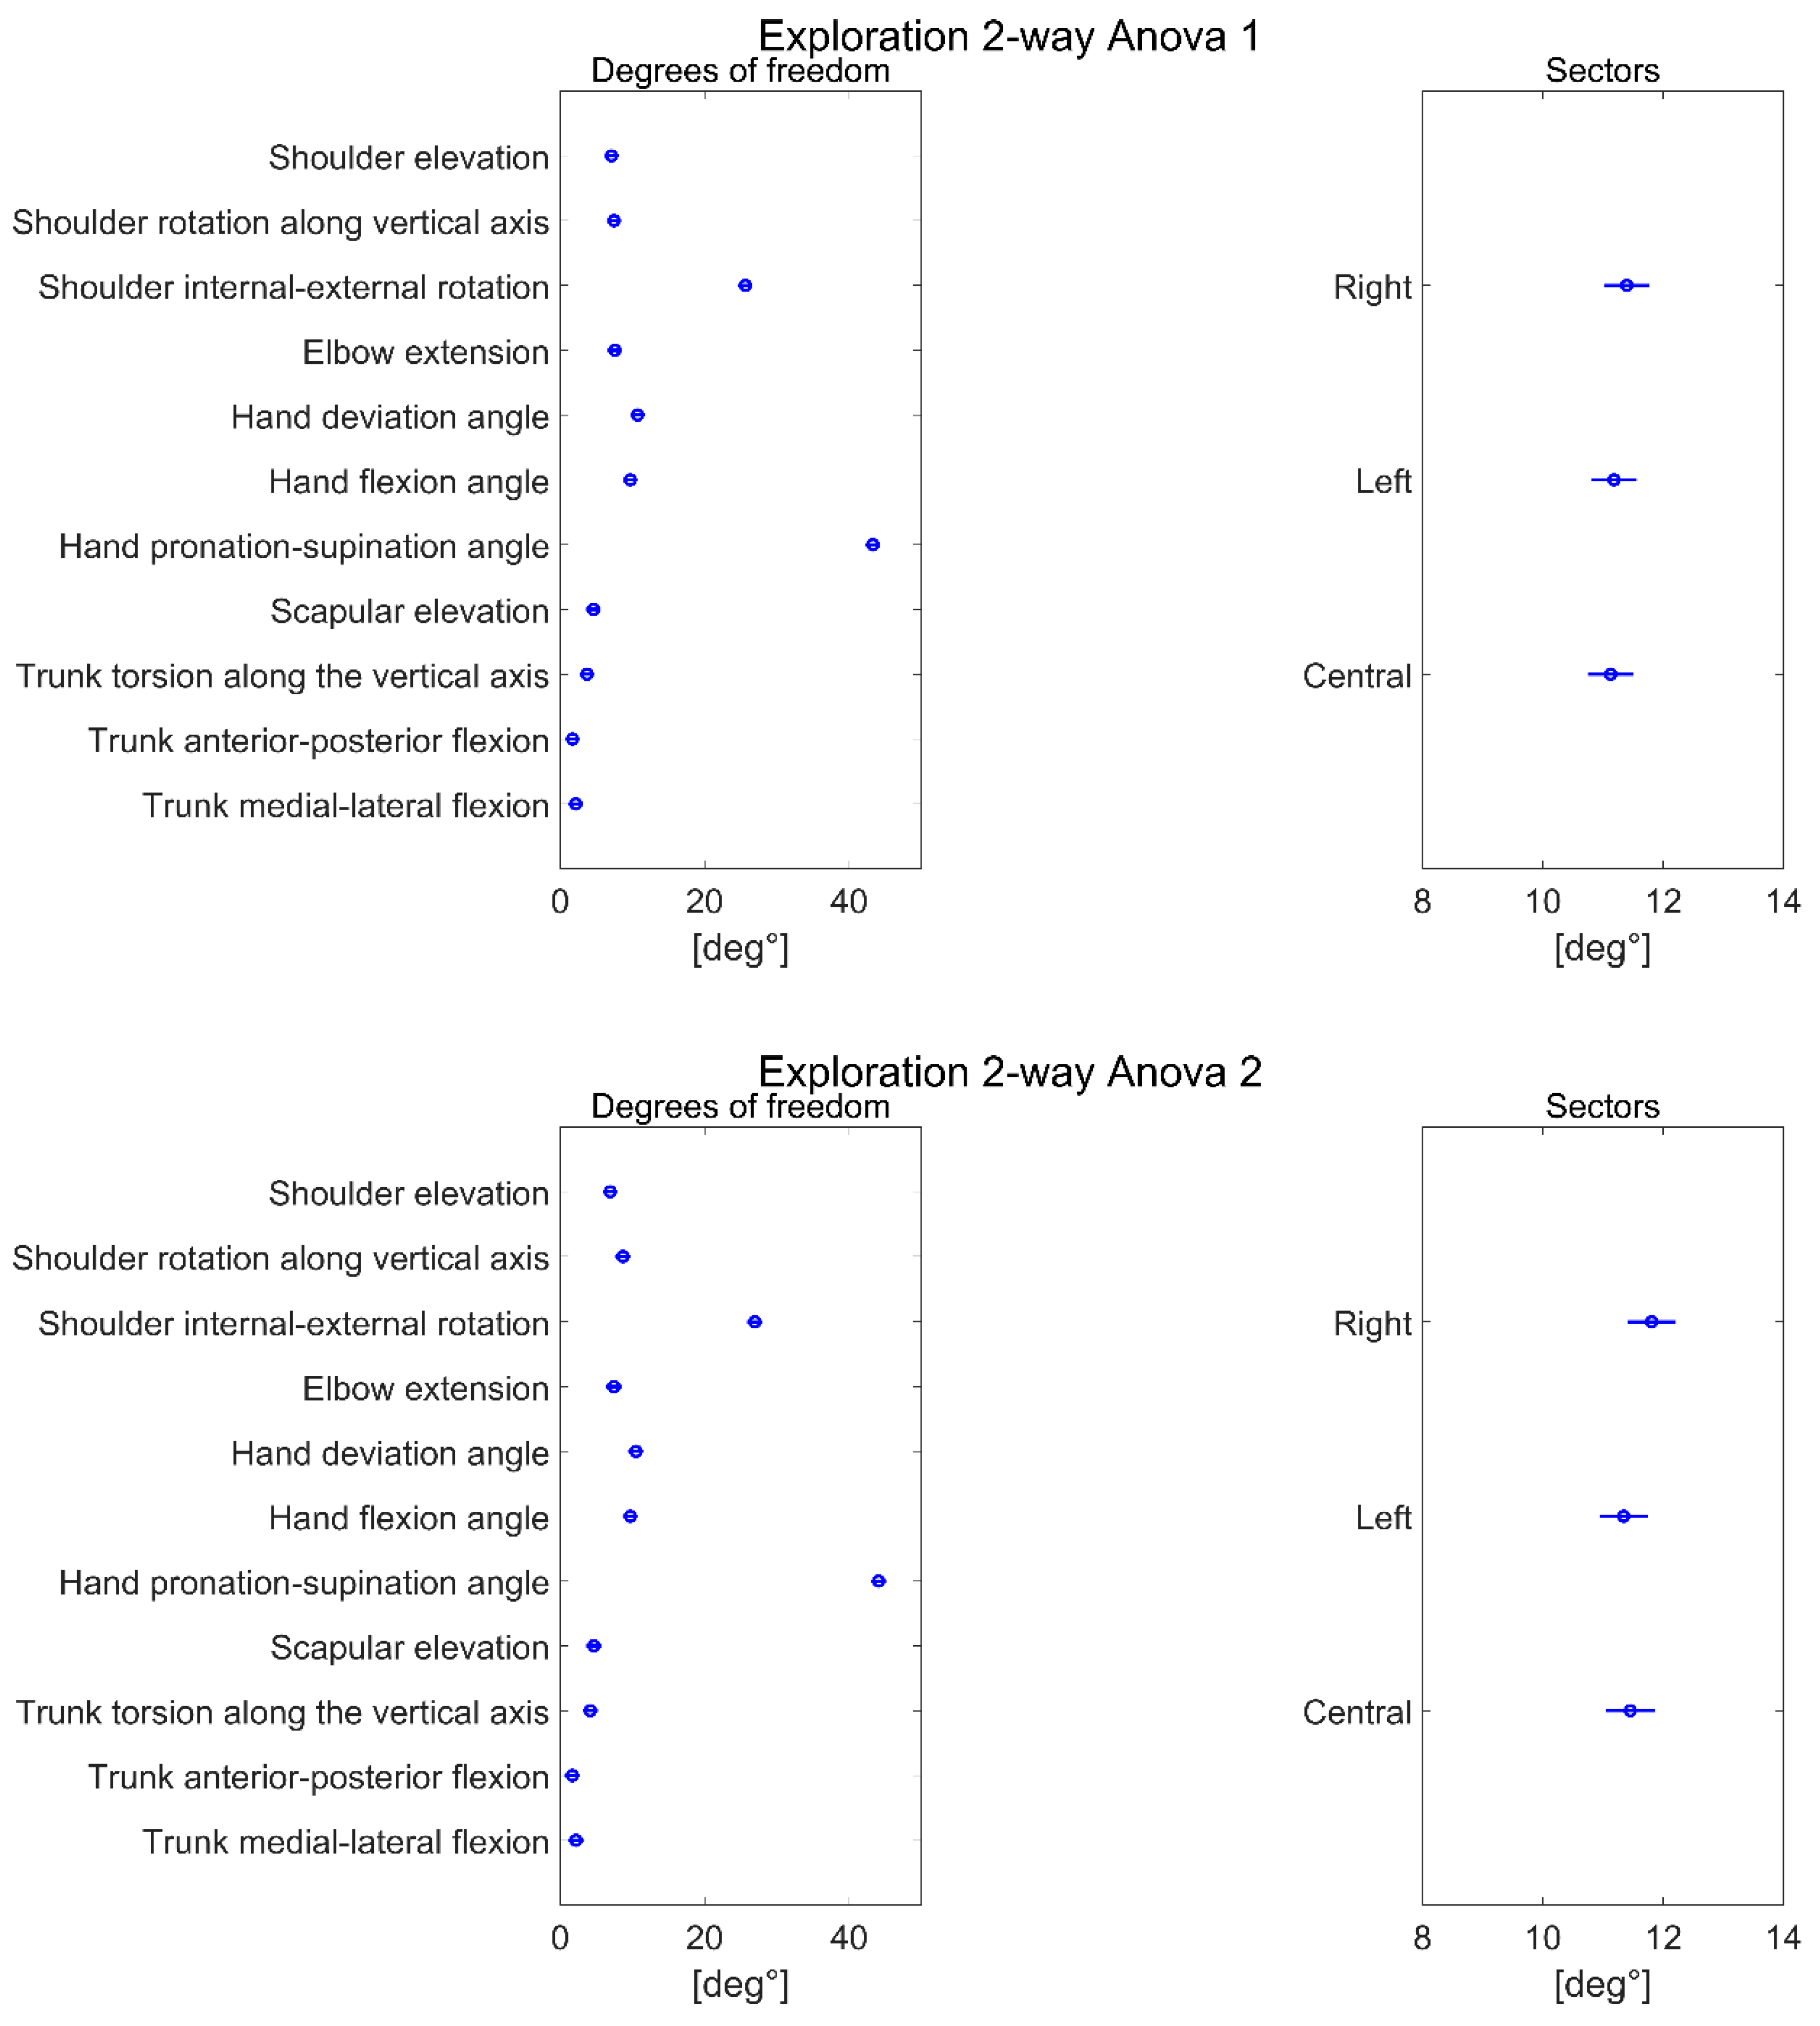
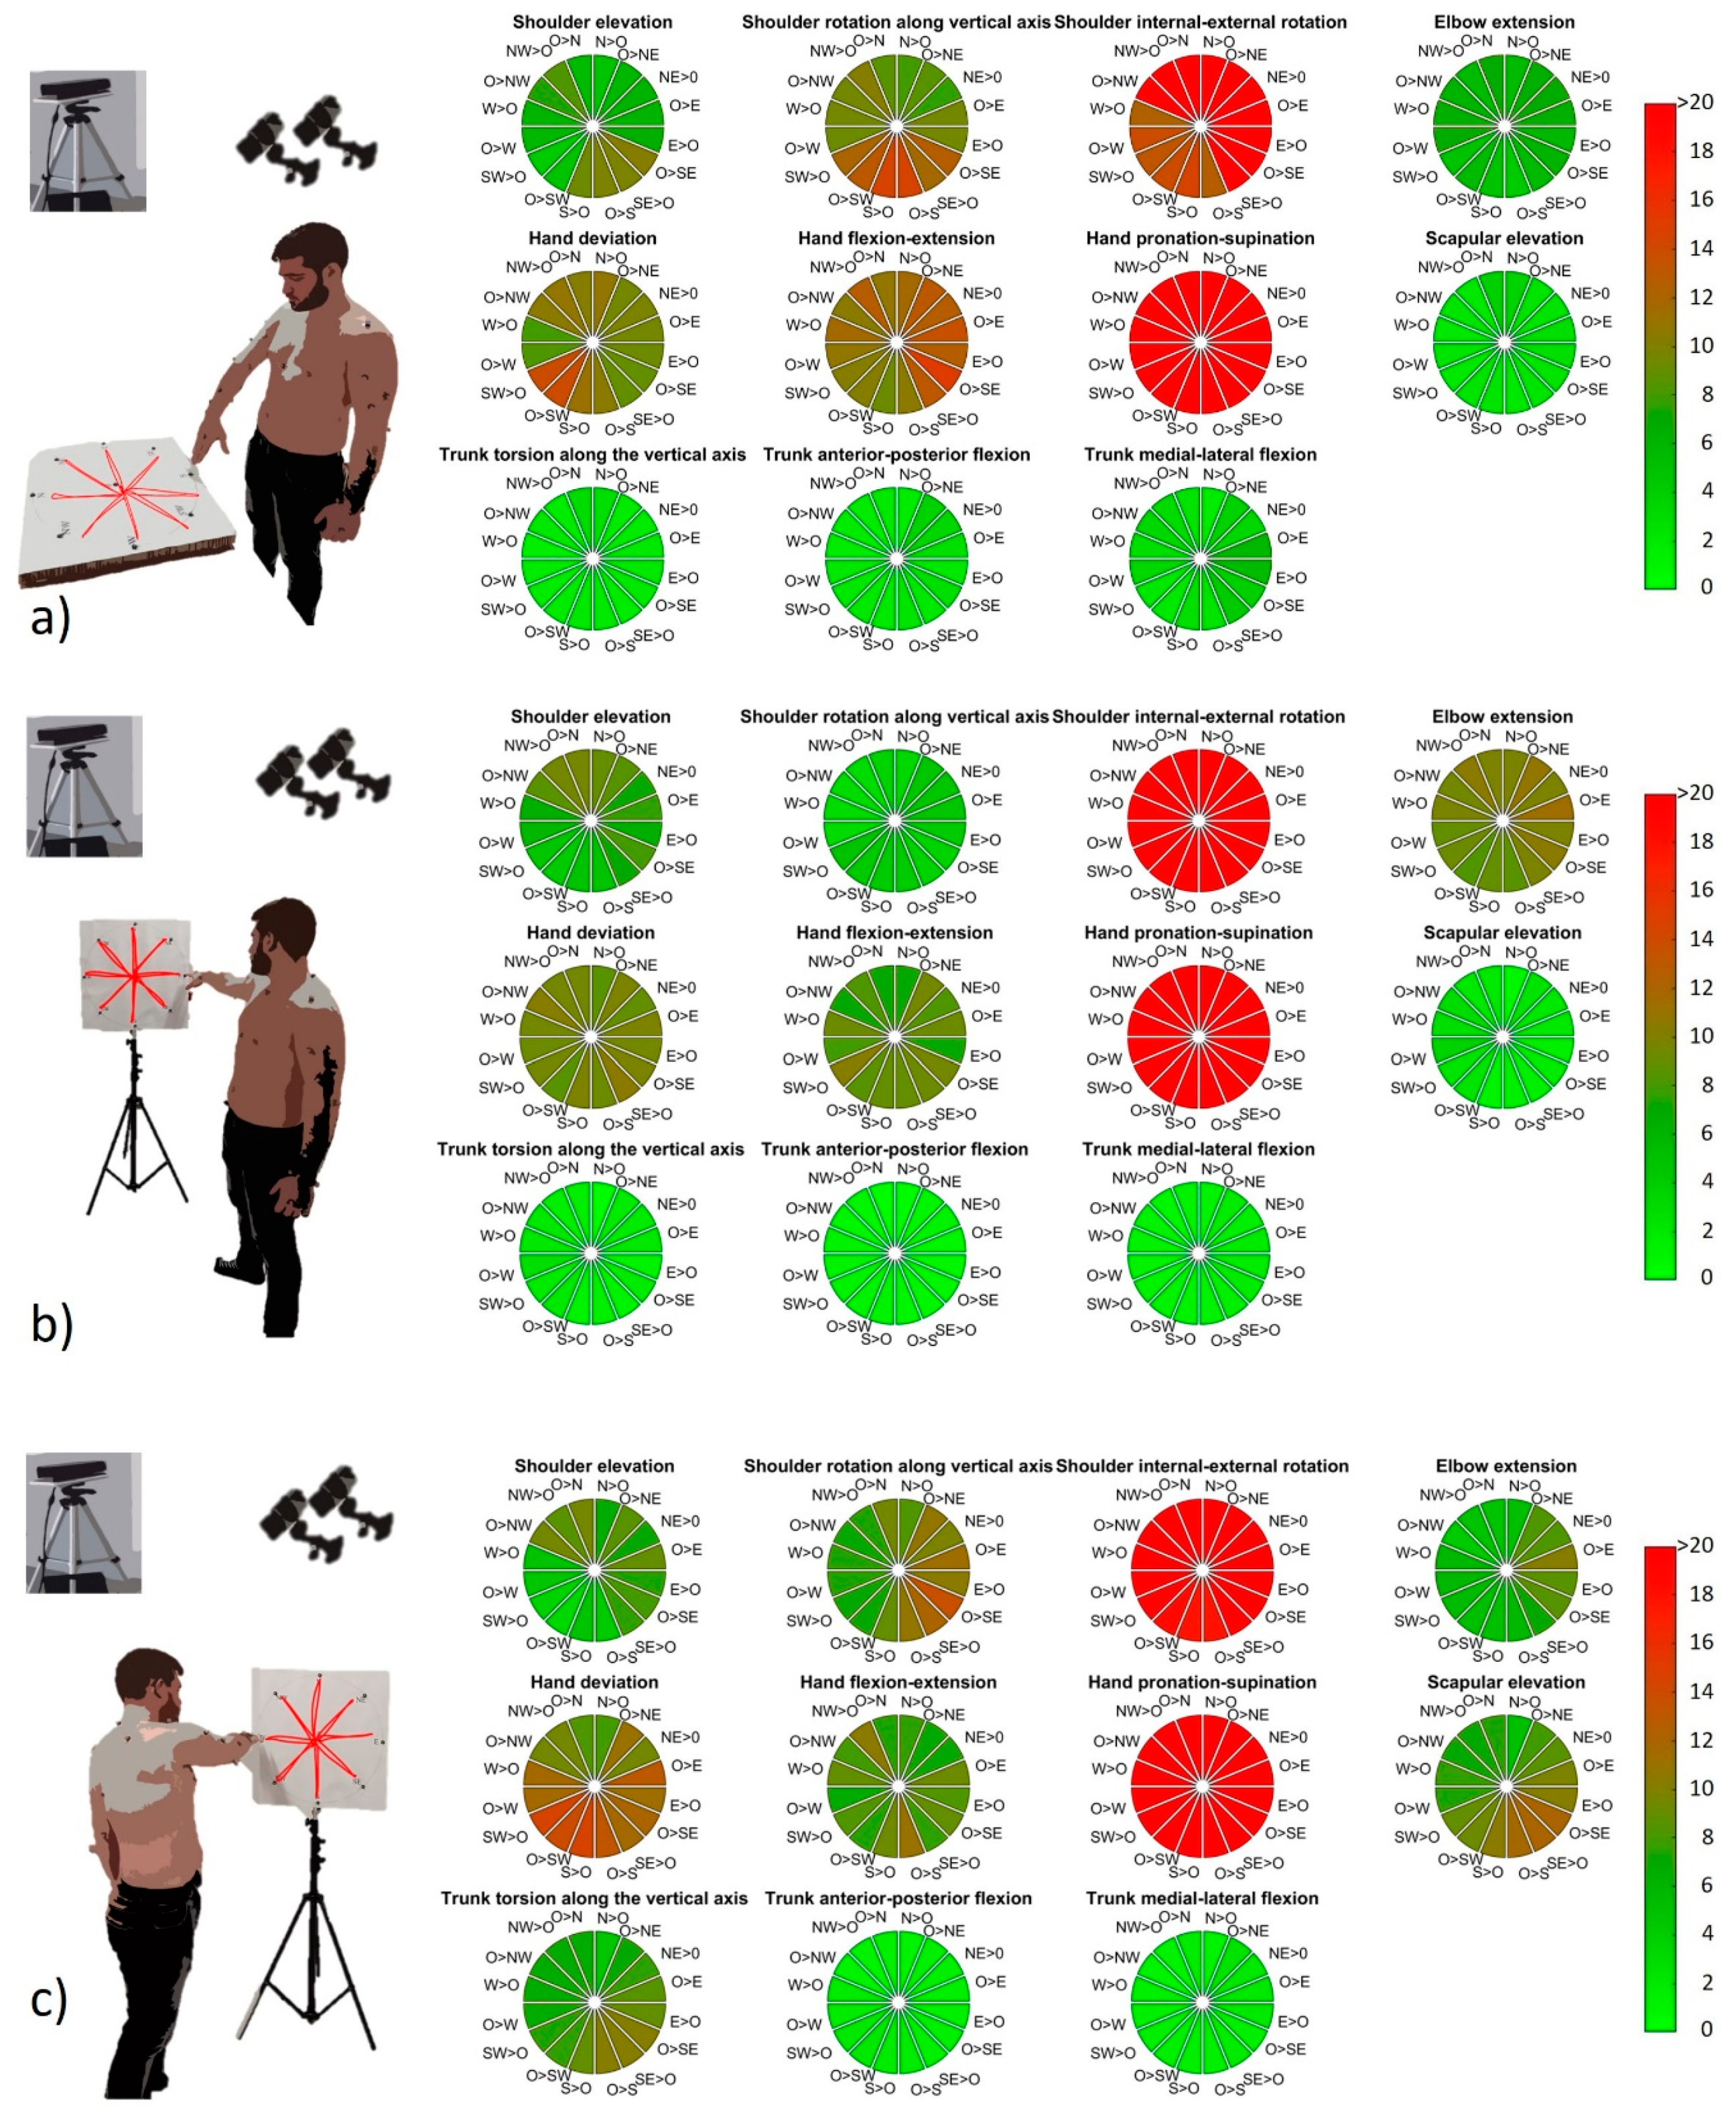
3.1. Marker-Based System vs. RGB-D Sensor
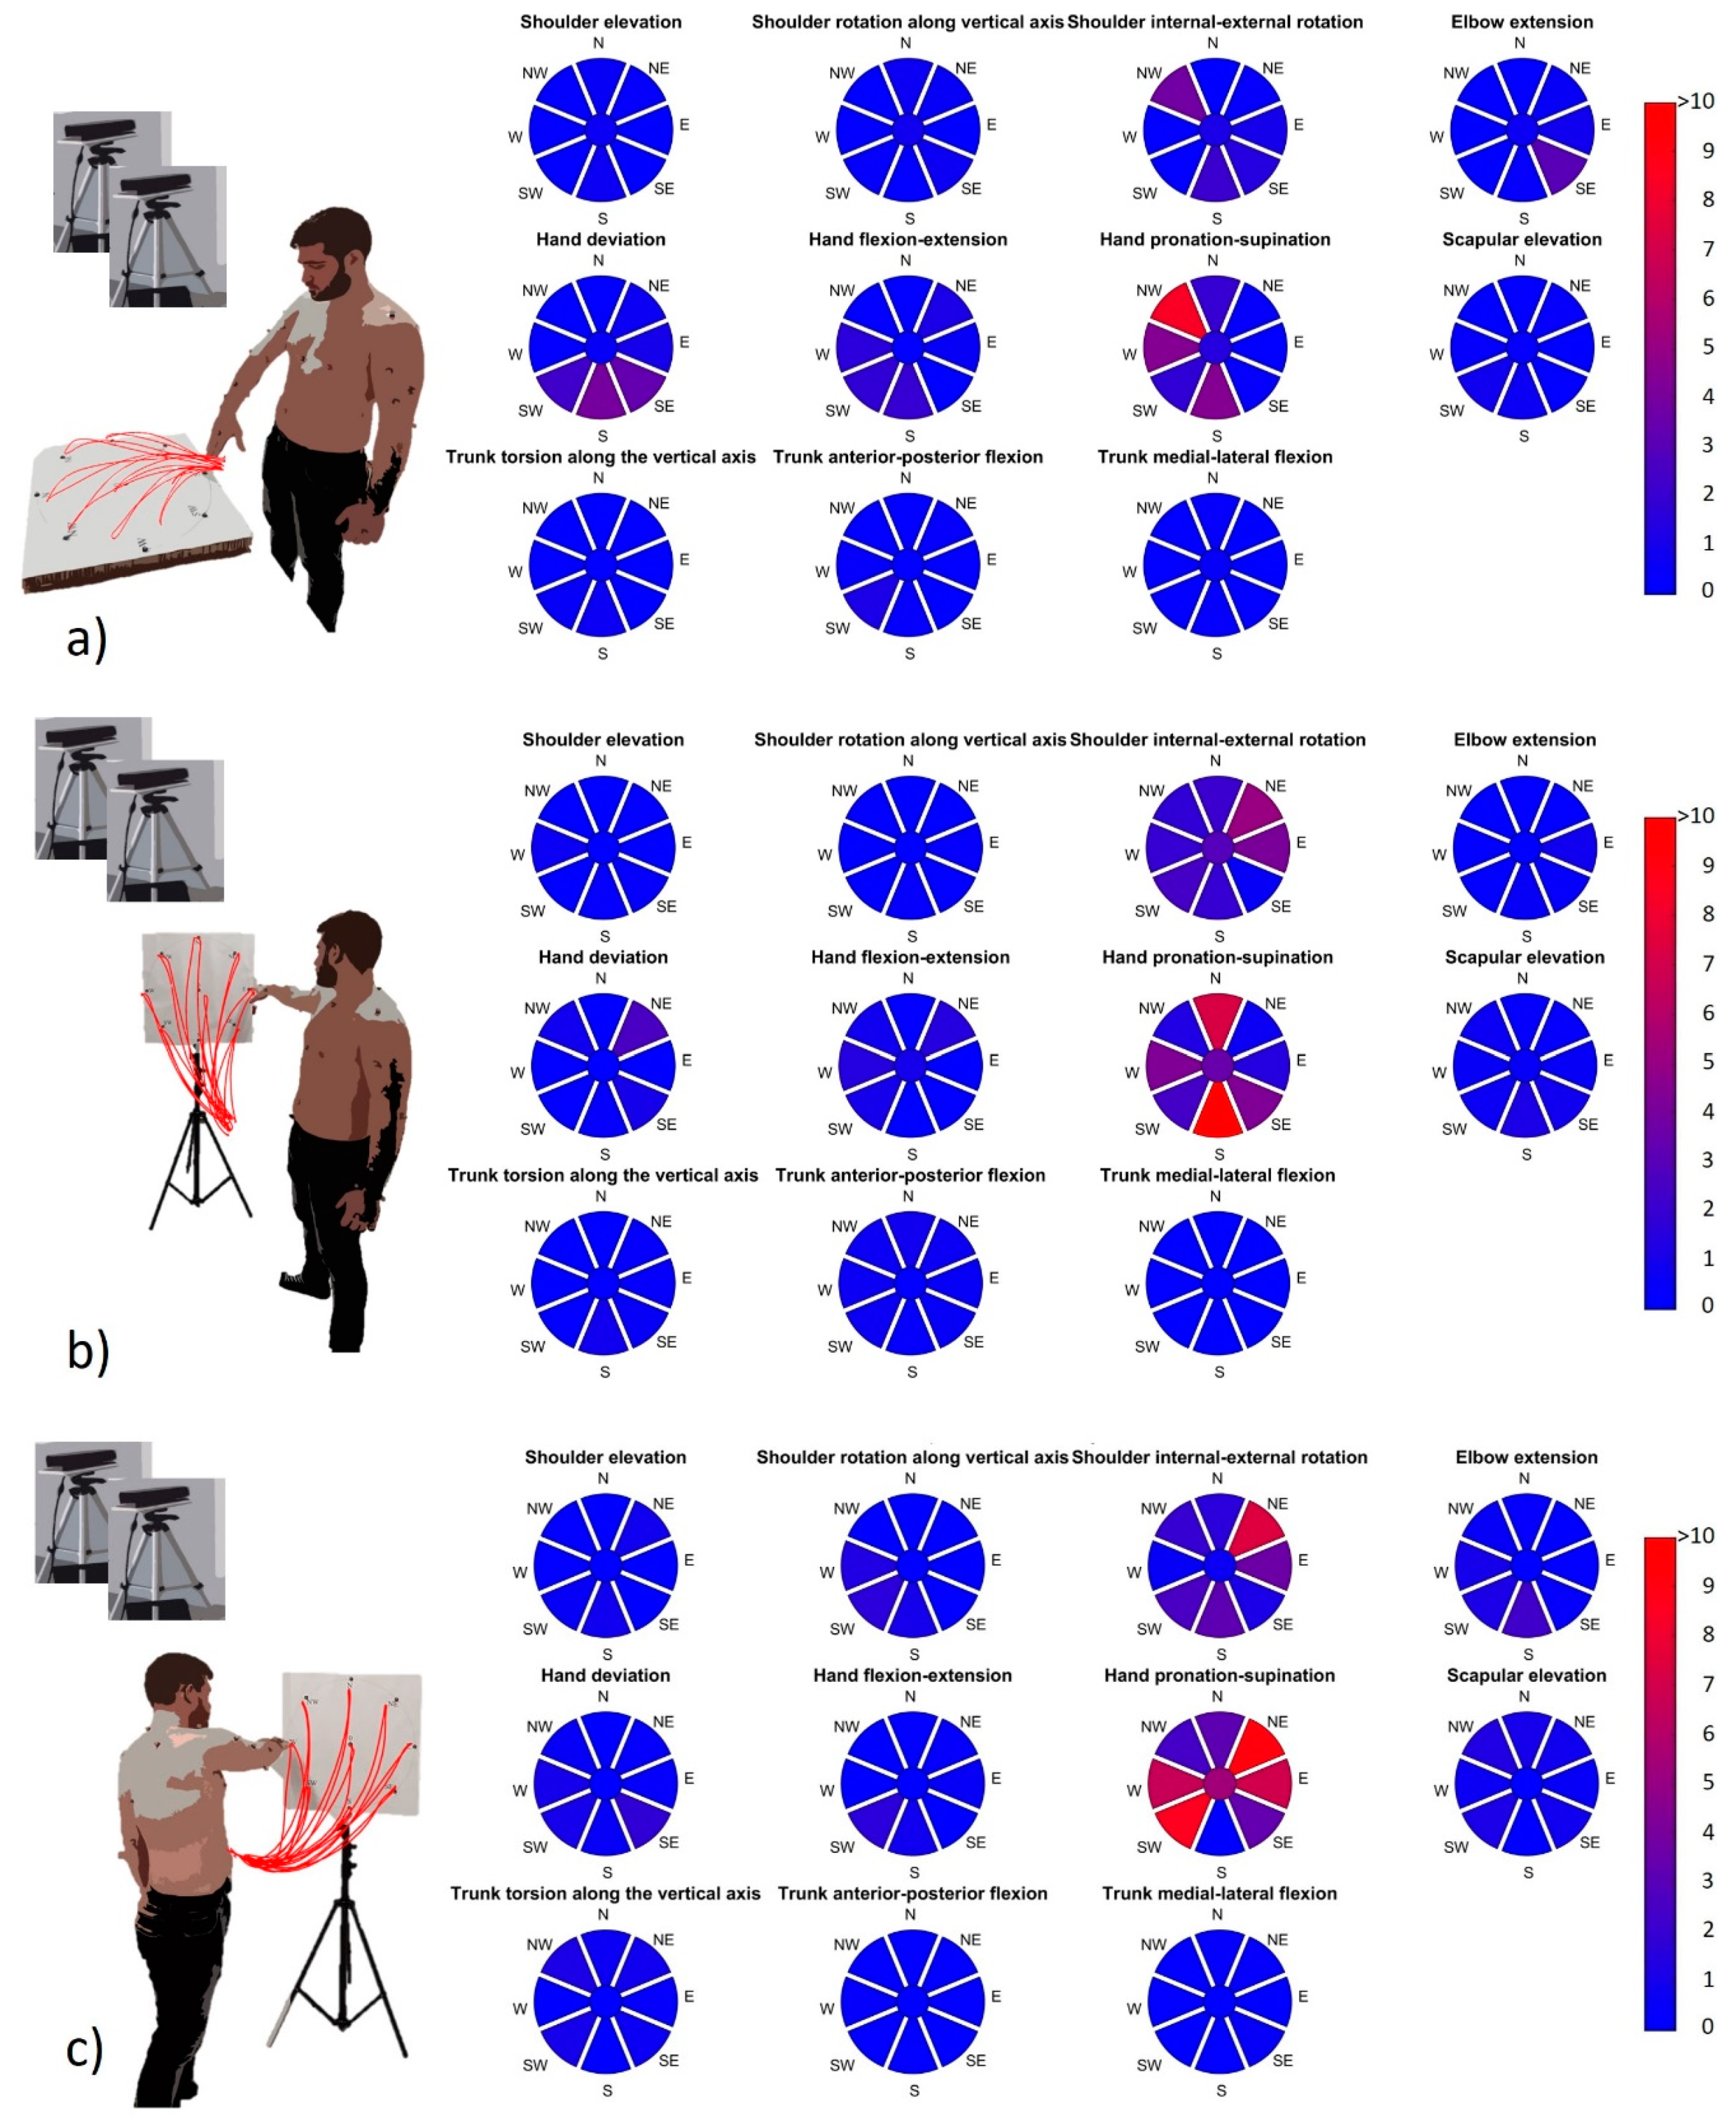
3.2. RGB-D Sensor Reliability
4. Discussion
4.1. Summary of the Results
4.1.1. Degrees of Freedom
4.1.2. Sectors
4.1.3. RGB-D Sensor: Reliability
4.1.4. Applications in Real Scenarios
4.2. Limitations
5. Conclusions
Author Contributions
Funding
Conflicts of Interest
Appendix A
References
- Colyer, S.; Evans, M.; Cosker, D.; Salo, A.I.T. A Review of the Evolution of Vision-Based Motion Analysis and the Integration of Advanced Computer Vision Methods Towards Developing a Markerless System. Sports Med. Open 2018, 4, 24. [Google Scholar] [CrossRef] [PubMed] [Green Version]
- Zhou, H.; Hu, H. Human motion tracking for rehabilitation—A survey. Biomed. Signal Process. Control. 2008, 3, 1–18. [Google Scholar] [CrossRef]
- Lu, T.W.; O’Connor, J. Bone position estimation from skin marker co-ordinates using global optimisation with joint constraints. J. Biomech. 1999, 32, 129–134. [Google Scholar] [CrossRef]
- Roux, E.; Bouilland, S.; Godillon-Maquinghen, A.-P.; Bouttens, D. Evaluation of the GO method within the upper limb kinematics analysis. J. Biomech. 2002, 35, 1279–1283. [Google Scholar] [CrossRef] [Green Version]
- Petuskey, K.; Bagley, A.; Abdala, E.; James, M.A.; Rab, G. Upper extremity kinematics during functional activities: Three-dimensional studies in a normal pediatric population. Gait Posture 2007, 25, 573–579. [Google Scholar] [CrossRef]
- Pontonnier, C.; Dumont, G. Inverse dynamics method using optimization techniques for the estimation of muscles forces involved in the elbow motion. Int. J. Interact. Des. Manuf. (IJIDeM) 2009, 3, 227–236. [Google Scholar] [CrossRef]
- Nussbaum, M.A.; Zhang, X. Heuristics for locating upper extremity joint centres from a reduced set of surface markers. Hum. Mov. Sci. 2000, 19, 797–816. [Google Scholar] [CrossRef]
- Cappozzo, A.; Catani, F.; Della Croce, U.; Leardini, A. Position and orientation in space of bones during movement: Anatomical frame definition and determination. Clin. Biomech. 1995, 10, 171–178. [Google Scholar] [CrossRef]
- Cappozzo, A.; Catani, F.; Leardini, A.; Benedetti, M.G.; Della Croce, U. Position and orientation in space of bones during movement: Experimental artefacts. Clin. Biomech. 1996, 11, 90–100. [Google Scholar] [CrossRef]
- Carpinella, I.; Cattaneo, D.; Ferrarin, M. Quantitative assessment of upper limb motor function in Multiple Sclerosis using an instrumented Action Research Arm Test. J. Neuroeng. Rehabil. 2014, 11, 67. [Google Scholar] [CrossRef]
- Carpinella, I.; Lencioni, T.; Bowman, T.; Bertoni, R.; Turolla, A.; Ferrarin, M.; Jonsdottir, J. Planar robotic training versus arm-specific physiotherapy: Effects on arm function and motor strategies in post-stroke subjects. Gait Posture 2019, 74, 7. [Google Scholar] [CrossRef]
- Dorazio, T.; Marani, R.; Renò, V.; Cicirelli, G. Recent trends in gesture recognition: How depth data has improved classical approaches. Image Vis. Comput. 2016, 52, 56–72. [Google Scholar] [CrossRef]
- Gesto-Diaz, M.; Tombari, F.; Rodríguez-Gonzálvez, P.; González-Aguilera, D. Analysis and Evaluation Between the First and the Second Generation of RGB-D Sensors. IEEE Sens. J. 2015, 15, 6507–6516. [Google Scholar] [CrossRef]
- Pagliari, D.; Pinto, L. Calibration of Kinect for Xbox One and Comparison between the Two Generations of Microsoft Sensors. Sensors 2015, 15, 27569–27589. [Google Scholar] [CrossRef] [Green Version]
- Kutlu, M.; Freeman, C.; Spraggs, M. Functional electrical stimulation for home-based upper-limb stroke rehabilitation. Curr. Dir. Biomed. Eng. 2017, 3, 25–29. [Google Scholar]
- Bonnechère, B.; Jansen, B.; Salvia, P.; Bouzahouene, H.; Omelina, Ľ.; Moiseev, F.; Sholukha, V.; Cornelis, J.; Rooze, M.; Jan, S.V.S. Validity and reliability of the Kinect within functional assessment activities: Comparison with standard stereophotogrammetry. Gait Posture 2014, 39, 593–598. [Google Scholar] [CrossRef]
- Cruz, L.M.V.; Lucio, D.; Velho, L. Kinect and RGBD Images: Challenges and Applications. In Proceedings of the 2012 25th SIBGRAPI Conference on Graphics, Patterns and Images Tutorials, Ouro Preto, Brasil, 22–25 August 2012; pp. 36–49. [Google Scholar]
- Scano, A.; Caimmi, M.; Malosio, M.; Tosatti, L.M. Using Kinect for upper-limb functional evaluation in home rehabilitation: A comparison with a 3D stereoscopic passive marker system. In Proceedings of the 5th IEEE RAS/EMBS International Conference on Biomedical Robotics and Biomechatronics, Ouro Preto, Brasil, 12–15 August 2014; pp. 561–566. [Google Scholar]
- Kurillo, G.; Chen, A.; Bajcsy, R.; Han, J.J. Evaluation of upper extremity reachable workspace using Kinect camera. Technol. Heal. Care 2013, 21, 641–656. [Google Scholar] [CrossRef] [Green Version]
- Lee, S.H.; Yoon, C.; Chung, S.G.; Kim, H.C.; Kwak, Y.; Park, H.-W.; Kim, K. Measurement of Shoulder Range of Motion in Patients with Adhesive Capsulitis Using a Kinect. PLoS ONE 2015, 10, e0129398. [Google Scholar] [CrossRef]
- Huber, M.E.; Seitz, A.; Leeser, M.; Sternad, D. Validity and reliability of Kinect skeleton for measuring shoulder joint angles: A feasibility study. Physiotherapy 2015, 101, 389–393. [Google Scholar] [CrossRef] [Green Version]
- Clark, R.; Pua, Y.-H.; Oliveira, C.C.; Bower, K.J.; Thilarajah, S.; McGaw, R.; Hasanki, K.; Mentiplay, B.F. Reliability and concurrent validity of the Microsoft Xbox One Kinect for assessment of standing balance and postural control. Gait Posture 2015, 42, 210–213. [Google Scholar] [CrossRef]
- Yahya, M.; Shah, J.; Kadir, K.; Warsi, A.; Khan, S.; Nasir, H. Accurate Shoulder Joint Angle Estimation Using Single RGB camera for Rehabilitation. In Proceedings of the 2019 IEEE International Instrumentation and Measurement Technology Conference (I2MTC), Auckland, New Zealand, 20–23 May 2019; pp. 1–6. [Google Scholar]
- Scano, A.; Chiavenna, A.; Malosio, M.; Tosatti, L.M. Kinect V2 Performance Assessment in Daily-Life Gestures: Cohort Study on Healthy Subjects for a Reference Database for Automated Instrumental Evaluations on Neurological Patients. Appl. Bionics Biomech. 2017, 2017, 1–16. [Google Scholar] [CrossRef] [PubMed] [Green Version]
- Chen, Y.C.; Lee, H.J.; Lin, K.H. Measurement of body joint angles for physical therapy based on mean shift tracking using two low cost Kinect images. In Proceedings of the 2015 37th Annual International Conference of the IEEE Engineering in Medicine and Biology Society (EMBC), Milan, Italy, 25–29 August 2015; Volume 2015, pp. 703–706. [Google Scholar]
- Scano, A.; Caimmi, M.; Chiavenna, A.; Malosio, M.; Tosatti, L.M. A Kinect-Based Biomechanical Assessment of Neurological Patients’ Motor Performances for Domestic Rehabilitation. Adv. Med Technol. Clin. Pract. 2016, 252–279. [Google Scholar] [CrossRef]
- Yang, Y.; Pu, F.; Li, Y.; Li, S.; Fan, Y.; Li, D. Reliability and Validity of Kinect RGB-D Sensor for Assessing Standing Balance. IEEE Sens. J. 2014, 14, 1633–1638. [Google Scholar] [CrossRef]
- Scano, A.; Chiavenna, A.; Malosio, M.; Tosatti, L.M.; Molteni, F. Kinect V2 implementation and testing of the reaching performance scale for motor evaluation of patients with neurological impairment. Med. Eng. Phys. 2018, 56, 54–58. [Google Scholar] [CrossRef] [PubMed]
- Kim, W.-S.; Cho, S.; Baek, D.; Bang, H.; Paik, N.-J. Upper Extremity Functional Evaluation by Fugl-Meyer Assessment Scoring Using Depth-Sensing Camera in Hemiplegic Stroke Patients. PLoS ONE 2016, 11, e0158640. [Google Scholar] [CrossRef] [PubMed]
- Fernández-Baena, A.; Susin, A.; Lligadas, X. Biomechanical Validation of Upper-Body and Lower-Body Joint Movements of Kinect Motion Capture Data for Rehabilitation Treatments. In Proceedings of the 2012 Fourth International Conference on Intelligent Networking and Collaborative Systems, Bucharest, Romania, 19–21 September 2012; pp. 656–661. [Google Scholar]
- Okuyama, K.; Kawakami, M.; Tsuchimoto, S.; Ogura, M.; Okada, K.; Mizuno, K.; Ushiba, J.; Liu, M. Depth Sensor–Based Assessment of Reachable Work Space for Visualizing and Quantifying Paretic Upper Extremity Motor Function in People with Stroke. Phys. Ther. 2020. [Google Scholar] [CrossRef]
- Latorre, J.; Colomer, C.; Alcañiz, M.; Llorens, R. Gait analysis with the Kinect v2: Normative study with healthy individuals and comprehensive study of its sensitivity, validity, and reliability in individuals with stroke. J. Neuroeng. Rehabil. 2019, 16, 11–97. [Google Scholar] [CrossRef] [Green Version]
- Scano, A.; Caimmi, M.; Chiavenna, A.; Malosio, M.; Tosatti, L.M. Kinect One-based biomechanical assessment of upper-limb performance compared to clinical scales in post-stroke patients. In Proceedings of the 2015 37th Annual International Conference of the IEEE Engineering in Medicine and Biology Society (EMBC), Milan, Italy, 25–29 August 2015; Volume 2015, pp. 5720–5723. [Google Scholar]
- Scano, A.; Molteni, F.; Tosatti, L.M. Low-Cost Tracking Systems Allow Fine Biomechanical Evaluation of Upper-Limb Daily-Life Gestures in Healthy People and Post-Stroke Patients. Sensors 2019, 19, 1224. [Google Scholar] [CrossRef] [Green Version]
- Gu, Y.; Pandit, S.; Saraee, E.; Nordahl, T.; Ellis, T.; Betke, M. Home-Based Physical Therapy with an Interactive Computer Vision System. In Proceedings of the 2019 IEEE/CVF International Conference on Computer Vision Workshop (ICCVW), Seoul, Korea, 27–28 October 2019; pp. 2619–2628. [Google Scholar]
- Cameirão, M.; Smailagic, A.; Miao, G.; Siewiorek, D. Coaching or gaming? Implications of strategy choice for home based stroke rehabilitation. J. Neuroeng. Rehabil. 2016, 13, 18. [Google Scholar] [CrossRef] [Green Version]
- Vieira, Á.; Gabriel, J.; Melo, C.; Machado, J. Kinect system in home-based cardiovascular rehabilitation. Proc. Inst. Mech. Eng. Part H J. Eng. Med. 2016, 231, 40–47. [Google Scholar] [CrossRef]
- Mosca, N.; Renó, V.; Marani, R.; Nitti, M.; D’Orazio, T.; Stella, E. Human Walking Behavior detection with a RGB-D Sensors Network for Ambient Assisted Living Applications. In Proceedings of the AI* AAL@ AI* IA, Bari, Italy, 14–17 November 2017; pp. 17–29. [Google Scholar]
- Terkaj, W.; Tolio, T. The Italian Flagship Project: Factories of the Future. In Factories of the Future; Springer Science and Business Media LLC: Berlin, Germany, 2019; pp. 3–35. [Google Scholar]
- Santos, C.; Mehrsai, A.; Barros, A.C.; Araújo, M.; Ares, E. Towards Industry 4.0: An overview of European strategic roadmaps. Procedia Manuf. 2017, 13, 972–979. [Google Scholar] [CrossRef]
- Geiselhart, F.; Otto, M.; Rukzio, E. On the Use of Multi-Depth-Camera Based Motion Tracking Systems in Production Planning Environments. Procedia CIRP 2016, 41, 759–764. [Google Scholar] [CrossRef] [Green Version]
- Duffy, V.G. A methodology for assessing industrial workstations using optical motion capture integrated with digital human models. Occup. Ergon. 2007, 7, 11–25. [Google Scholar]
- Ramey, A.; González-Pacheco, V.; Salichs, M.A. Integration of a low-cost RGB-D sensor in a social robot for gesture recognition. In Proceedings of the 6th international conference on Multimodal interfaces—ICMI ’04, Alicante, Spain, 14–18 November 2011; pp. 229–230. [Google Scholar]
- Basso, F.; Munaro, M.; Michieletto, S.; Pagello, E.; Menegatti, E. Fast and Robust Multi-people Tracking from RGB-D Data for a Mobile Robot. In Advances in Intelligent Systems and Computing; Springer Science and Business Media LLC: Berlin, Germany, 2013; Volume 193, pp. 265–276. [Google Scholar]
- Colombo, G.; Regazzoni, D.; Rizzi, C. Markerless Motion Capture Integrated with Human Modeling for Virtual Ergonomics. Lect. Notes Comput. Sci. 2013, V, 314–323. [Google Scholar] [CrossRef]
- Bachynskyi, M.; Oulasvirta, A.; Palmas, G.; Weinkauf, T. Is motion capture-based biomechanical simulation valid for hci studies? study and implications. In Proceedings of the SIGCHI Conference on Human Factors in Computing Systems, Toronto, ON, Canada, 26 April–1 May 2014; pp. 3215–3224. [Google Scholar]
- Pellegrinelli, S.; Moro, F.L.; Pedrocchi, N.; Tosatti, L.M.; Tolio, T. A probabilistic approach to workspace sharing for human–robot cooperation in assembly tasks. CIRP Ann. 2016, 65, 57–60. [Google Scholar] [CrossRef]
- Glasauer, S.; Huber, M.; Basili, P.; Knoll, A.; Brandt, T. Interacting in time and space: Investigating human-human and human-robot joint action. In Proceedings of the 19th International Symposium in Robot and Human Interactive Communication, Roman, Italy, 13–15 September 2010; pp. 252–257. [Google Scholar] [CrossRef]
- Field, M.; Stirling, D.; Naghdy, F.; Pan, Z. Motion capture in robotics review. In Proceedings of the IEEE International Conference on Control and Automation, Christchurch, New Zealand, 9–11 December 2009; pp. 1697–1702. [Google Scholar]
- Kim, S.; Nussbaum, M.A.; Esfahani, M.I.M.; Alemi, M.M.; Alabdulkarim, S.A.; Rashedi, E. Assessing the influence of a passive, upper extremity exoskeletal vest for tasks requiring arm elevation: Part I—“Expected” effects on discomfort, shoulder muscle activity, and work task performance. Appl. Ergon. 2018, 70, 315–322. [Google Scholar] [CrossRef]
- Pfister, A.; West, A.M.; Bronner, S.; Noah, J.A. Comparative abilities of Microsoft Kinect and Vicon 3D motion capture for gait analysis. J. Med. Eng. Technol. 2014, 38, 274–280. [Google Scholar] [CrossRef]
- Otte, K.; Kayser, B.; Mansow-Model, S.; Verrel, J.; Paul, F.; Brandt, A.U.; Schmitz-Hübsch, T. Accuracy and Reliability of the Kinect Version 2 for Clinical Measurement of Motor Function. PLoS ONE 2016, 11, e0166532. [Google Scholar] [CrossRef]
- Cai, L.; Ma, Y.; Xiong, S.; Zhang, Y. Validity and Reliability of Upper Limb Functional Assessment Using the Microsoft Kinect V2 Sensor. Appl. Bionics Biomech. 2019, 2019, 7175240. [Google Scholar] [CrossRef] [Green Version]
- Galna, B.; Barry, G.; Jackson, D.; Mhiripiri, D.; Olivier, P.; Rochester, L. Accuracy of the Microsoft Kinect sensor for measuring movement in people with Parkinson’s disease. Gait Posture 2014, 39, 1062–1068. [Google Scholar] [CrossRef] [Green Version]
- Sarbolandi, H.; Lefloch, D.; Kolb, A. Kinect range sensing: Structured-light versus Time-of-Flight Kinect. Comput. Vis. Image Underst. 2015, 139, 1–20. [Google Scholar] [CrossRef] [Green Version]
- Mahmoudzadeh, A.; Golroo, A.; Jahanshahi, M.R.; Yeganeh, S.F. Estimating Pavement Roughness by Fusing Color and Depth Data Obtained from an Inexpensive RGB-D Sensor. Sensors 2019, 19, 1655. [Google Scholar] [CrossRef] [Green Version]
- Scano, A.; Dardari, L.; Molteni, F.; Giberti, H.; Tosatti, L.M.; D’Avella, A. A Comprehensive Spatial Mapping of Muscle Synergies in Highly Variable Upper-Limb Movements of Healthy Subjects. Front. Physiol. 2019, 10, 1231. [Google Scholar] [CrossRef] [PubMed]
- Moore, K.L.; Dalley, A.F.; Agur, A.M. Clinically Oriented Anatomy, 7th ed.; Taylor, C., Ed.; Lippincott Williams & Wilkins: Philadelphia, PA, USA, 2013. [Google Scholar]
- Sinclair, J.; Taylor, P.; Hobbs, S.J. Digital Filtering of Three-Dimensional Lower Extremity Kinematics: An Assessment. J. Hum. Kinet. 2013, 39, 25–36. [Google Scholar] [CrossRef] [PubMed] [Green Version]
- Cicirelli, G.; Attolico, C.; Guaragnella, C.; D’Orazio, T. A Kinect-Based Gesture Recognition Approach for a Natural Human Robot Interface. Int. J. Adv. Robot. Syst. 2015, 12, 22. [Google Scholar] [CrossRef]
- Mobini, A.; Behzadipour, S.; Foumani, M.S. Test-retest reliability of Kinect’s measurements for the evaluation of upper body recovery of stroke patients. Biomed. Eng. Online 2015, 14, 75. [Google Scholar] [CrossRef] [Green Version]
- Capecci, M.; Ceravolo, M.G.; Ferracuti, F.; Iarlori, S.; Longhi, S.; Romeo, L.; Russi, S.N.; Verdini, F. Accuracy evaluation of the Kinect v2 sensor during dynamic movements in a rehabilitation scenario. In Proceedings of the 2016 38th Annual International Conference of the IEEE Engineering in Medicine and Biology Society (EMBC), Orlando, FL, USA, 16–20 August 2016; pp. 5409–5412. [Google Scholar]
- Bonnechère, B.; Sholukha, V.; Omelina, L.; Jansen, B.; Jan, S.V.S. Three-dimensional functional evaluation of the shoulder complex using the Kinect™ sensor. In Proceedings of the 4th Workshop on ICTs for improving Patients Rehabilitation Research Techniques, Lisbon, Portugal, 13–14 October 2016; pp. 5–8. [Google Scholar]
- Cordis European Commission. Available online: https://cordis.europa.eu/project/id/847926 (accessed on 15 February 2020).
- Microsoft Azure. Available online: https://azure.microsoft.com/it-it/services/kinect-dk/ (accessed on 2 February 2020).
- Jiang, S.; Liu, P.; Fu, D.; Xue, Y.; Luo, W.; Wang, M. A low-cost rapid upper limb assessment method in manual assembly line based on somatosensory interaction technology. In Proceedings of the 2017 5TH International Conference on Computer-Aided Design, Manufacturing, Modeling And Simulation (CDMMS 2017), Busan, Korea, 22–23 April 2017. [Google Scholar] [CrossRef] [Green Version]
- Miguez, S.A.; Hallbeck, M.S.; Vink, P. Work Movements: Balance Between Freedom and Guidance on an Assembly Task in a Furniture Manufacturer. In Advances in Intelligent Systems and Computing; Springer Science and Business Media LLC: Berlin, Germany, 2016; Volume 491, pp. 503–511. [Google Scholar]


| Degree of Freedom | Test Mean (deg°) | Retest Mean (deg°) | |||
| Shoulder elevation | 3.96 | 3.82 | |||
| Shoulder rotation along the vertical axis | 4.73 | 4.88 | |||
| Shoulder internal–external rotation | 19.00 | 18.18 | |||
| Elbow extension | 5.20 | 5.36 | |||
| Hand deviation angle | 11.25 | 11.60 | |||
| Hand flexion–extension angle | 8.10 | 7.89 | |||
| Hand pronation angle | 36.40 | 38.59 | |||
| Scapular elevation | 3.64 | 3.70 | |||
| Trunk torsion | 3.02 | 3.01 | |||
| Trunk anterior–posterior flexion | 2.41 | 2.61 | |||
| Trunk medial–lateral flexion | 4.06 | 4.22 | |||
| Sectors | Test Mean (deg°) | Retest Mean (deg°) | ICC | ||
| Right | 8.59 | 8.77 | 0.81 | ||
| Central | 9.55 | 9.73 | 0.82 | ||
| Left | 9.60 | 9.82 | 0.73 | ||
| Degree of Freedom | Test Mean (deg°) | Retest Mean (deg°) | ||||
| Shoulder elevation | 7.09 | 6.92 | ||||
| Shoulder rotation along the vertical axis | 7.44 | 8.67 | ||||
| Shoulder internal–external rotation | 25.63 | 26.93 | ||||
| Elbow extension | 7.56 | 7.43 | ||||
| Hand deviation angle | 10.70 | 10.47 | ||||
| Hand flexion–extension angle | 9.69 | 9.70 | ||||
| Hand pronation angle | 43.28 | 44.06 | ||||
| Scapular elevation | 4.60 | 4.67 | ||||
| Trunk torsion | 3.70 | 4.16 | ||||
| Trunk anterior–posterior flexion | 1.71 | 1.67 | ||||
| Trunk medial–lateral flexion | 2.16 | 2.17 | ||||
| Sectors | Test Mean (deg°) | Retest Mean (deg°) | ICC | |||
| Right | 11.39 | 11.81 | 0.84 | |||
| Central | 11.13 | 11.45 | 0.75 | |||
| Left | 11.18 | 11.34 | 0.62 | |||
© 2020 by the authors. Licensee MDPI, Basel, Switzerland. This article is an open access article distributed under the terms and conditions of the Creative Commons Attribution (CC BY) license (http://creativecommons.org/licenses/by/4.0/).
Share and Cite
Scano, A.; Mira, R.M.; Cerveri, P.; Molinari Tosatti, L.; Sacco, M. Analysis of Upper-Limb and Trunk Kinematic Variability: Accuracy and Reliability of an RGB-D Sensor. Multimodal Technol. Interact. 2020, 4, 14. https://doi.org/10.3390/mti4020014
Scano A, Mira RM, Cerveri P, Molinari Tosatti L, Sacco M. Analysis of Upper-Limb and Trunk Kinematic Variability: Accuracy and Reliability of an RGB-D Sensor. Multimodal Technologies and Interaction. 2020; 4(2):14. https://doi.org/10.3390/mti4020014
Chicago/Turabian StyleScano, Alessandro, Robert Mihai Mira, Pietro Cerveri, Lorenzo Molinari Tosatti, and Marco Sacco. 2020. "Analysis of Upper-Limb and Trunk Kinematic Variability: Accuracy and Reliability of an RGB-D Sensor" Multimodal Technologies and Interaction 4, no. 2: 14. https://doi.org/10.3390/mti4020014