Article

Predicting the Impact of Climate Change on the Distribution of a Neglected Arboviruses Vector (Armigeres subalbatus) in China

1
Department of Parasitology, Key Laboratory of Tropical Disease Control of the Ministry of Education, Sun Yat-sen University, Guangzhou 510080, China
2
CAEA Center of Excellence on Nuclear Technology Applications for Insect Control, Sun Yat-sen University, Guangzhou 510080, China
3
SYSU Nuclear and Insect Biotechnology Co., Ltd., Dongguan 523000, China
4
Guangdong Provincial Engineering Technology Research Center for Diseases-Vectors Control, Sun Yat-sen University, Guangzhou 510080, China
5
IAEA Collaborating Centre for Developing the Sterile Insect Technique (SIT) for Control of Mosquito, Sun Yan-sen University, Guangzhou 510080, China
6
Department of Zoology, Abdul Wali Khan University Mardan, Mardan 25000, Pakistan
*
Authors to whom correspondence should be addressed.
These authors contributed equally to this work.
Trop. Med. Infect. Dis. 2022, 7(12), 431; https://doi.org/10.3390/tropicalmed7120431
Submission received: 19 September 2022 / Revised: 23 November 2022 / Accepted: 2 December 2022 / Published: 12 December 2022
(This article belongs to the Special Issue Spatial Epidemiology of Infectious Diseases)

Abstract

:
The geographic boundaries of arboviruses continue to expand, posing a major health threat to millions of people around the world. This expansion is related to the availability of effective vectors and suitable habitats. Armigeres subalbatus (Coquillett, 1898), a common and neglected species, is of increasing interest given its potential vector capacity for Zika virus. However, potential distribution patterns and the underlying driving factors of Ar. subalbatus remain unknown. In the current study, detailed maps of their potential distributions were developed under both the current as well as future climate change scenarios (SSP126 and SSP585) based on CMIP6 data, employing the MaxEnt model. The results showed that the distribution of the Ar. subalbatus was mainly affected by temperature. Mean diurnal range was the strongest predictor in shaping the distribution of Ar. subalbatus, with an 85.2% contribution rate. By the 2050s and 2070s, Ar. subalbatus will have a broader potential distribution across China. There are two suitable expansion types under climate change in the 2050s and 2070s. The first type is continuous distribution expansion, and the second type is sporadic distribution expansion. Our comprehensive analysis of Ar. subalbatus’s suitable distribution areas shifts under climate change and provides useful and insightful information for developing management strategies for future arboviruses.

1. Introduction

Mosquitoes are a major public health concern, because a number of their species can play a pivotal role in the transmission of a variety of pathogens. The wide geographical distribution and dispersal dynamics of mosquitoes partly shapes the entomological risk of vector-borne disease transmission internationally [1,2]. Climate changes can significantly influence the distribution and dispersal of mosquitoes [3,4]. Due to climate change, many species of mosquito have successfully expanded and established populations in many parts of the world due to their strong ability to colonize different microhabitats [5]. In fact, climate change is increasing the introduction of mosquitoes to occupy the suitable areas where they were previously absent [6]. Therefore, the change in mosquito distribution dynamics under the influence of climate change will bring new challenges to controlling the transmission of mosquito-borne diseases.
Current knowledge suggests that climate change and mosquito-borne diseases have a well-studied relationship [7]. As the climate changes, more areas may become suitable habitats for vectors in the future [8], and mosquito vectors will introduce diseases to people living in non-endemic or low-transmission areas [9]. Therefore, mosquitoes and the arboviruses they transmit will increase dramatically [10,11,12,13]. This brings huge challenges to the monitoring and early warning of the emergence and spread of arboviruses.
Zika virus (ZIKV) is a pathogen primarily transmitted by the bite of an infected female mosquito from the Aedes genus that poses a serious threat to global health in tropical and subtropical regions [14,15]. Previous experimental infection and transmission studies have proved that Ae. aegypti and Ae. albopictus are potential vectors of ZIKV [16,17,18,19,20]. Some research has shown that ZIKV may be transmitted by more than one vector [15,21]. The public health community now recognizes the potential threat posed by these two widespread invasive species (Ae. aegypti and Ae. albopictus) [22]. However, continued focus on a few important mosquito species as a major threat ignores other potential vectors in the expansion of arboviruses’ (arthropod-borne viruses) transmission, which could increase the risk of vector-borne disease outbreaks.
Armigeres subalbatus (Coquillett, 1898) has been confirmed as a new potential transmission vector of ZIKV recently [18,23,24,25]. These studies confirm that some important potential vectors may have remained unexamined and long-neglected. Ar. subalbatus is a common mosquito species in China [26] that has the potential to transmit several pathogens (such as filariasis and Japanese encephalitis virus) [27,28]. However, there has been no systematic research on Ar. subalbatus, resulting in many vacancies in its important ecological characteristic data (such as distribution data) that can be used to evaluate public health security. A few studies have proven that most of the neglected vectors are spreading geographically, creating a significant threat of mosquito-borne virus transmission [4,22]. Therefore, before formulating specific prevention and control strategies, future distribution forecasts based on current mosquito distribution data to assess their transmission risk are becoming particularly important and urgent.
In China, Ar. subalbatus is found primarily in the south of the Yangtze River [26]. However, the specific distribution data has not been obtained and studied. Moreover, the potential range of Ar. subalbatus has not yet been investigated, and it is uncertain how climate variables may affect its distribution pattern. This knowledge is crucial for the prevention and management of this significant pest [29]. Recently, species distribution modeling (SDM) was introduced to describe the ecological needs of a given species using environmental factors associated with occurrence data [30,31,32,33,34]. Further, SDM has been intensively used as the best tool with which to assess, quantify, and visualize the potential impacts of climate change on mosquitoes’ geographic expansion [35]. Many previous studies have shown the importance of modeling the distribution of vectors for risk assessments of vector-borne diseases [36,37,38]. The results of these studies can be used to guide the implementation of controlling programs for vector-borne diseases.
Knowing the current distribution of Ar. subalbatus and its possible shift in response to climate changes in the future is essential for comprehensive public health planning. Hence, we generated prediction models of Ar. Subalbatus’ potential distribution in China under both present-day and future climate conditions (the 2050s and 2070s) using species distribution modeling.

2. Materials and Methods

2.1. Species Occurrence Data

Ar. subalbatus is a common mosquito species in the integrated regions between rural and urban areas of Asian countries [39]. The occurrence records of Ar. subalbatus were obtained from three frequently used sources: (1) published literature searched in Web of Science (https://www.webofscience.com/wos/alldb/basic-search, accessed on 1 August 2022) and CNKI (the Chinese National Knowledge Infrastructure, https://www.cnki.net/, accessed on 3 August 2022); (2) databases, including the GBIF (Global Biodiversity Information Facility, http://www.gbif.org, accessed on 3 August 2022) databases; and (3) field surveys during 2019 and 2021 in several provinces of China (including Shaanxi, Henan, and Guangdong). Initially, we received 531 presence records with exact coordinates (Figure 1).
The occurrence data obtained from web databases frequently contains sampling bias and has heterogeneous sampling intensities [40]. This will increase the over-representation of specific locations within a research area, resulting in a significant spatial bias in the occurrence data obtained [41,42]. Because those spatial relationships often lead to environmental bias, the difference between occurrence collecting and background sampling may result in erroneous models [43]. Thus, the function “Trim duplicate occurrences” of the ENMTOOLS software was then used to clean the occurrence records and reduce the potential spatial deviation caused by sampling bias [44]. The ENMTools tool can automatically match the size of the environmental factor grid used for analysis and delete redundant data in the same grid, thereby mitigating data sampling bias [44]. Afterwards, a data set with one record that occurred within each grid cell (5 × 5 km) can be obtained for follow-up analysis.

2.2. Environmental Predictor Variables

Two climate data sets were applied to summarize current and future climate conditions as environmental layers and cropped to the geographic area of China with a 5 × 5 km spatial resolution (2.5 arc-minutes). The data sets downloaded from PaleoClim (http://www.paleoclim.org/, accessed on 10 August 2022) for the Anthropocene v1.2b period (over the period 1979–2013) were regarded as the current environmental condition layer [45]. The other data sets downloaded from WorldClim version 2.1 (www.worldclim.org, accessed on 10 August 2022) were applied as the future periods’ environmental layers under different climate change scenarios [46]. Both datasets contain 19 bioclimatic variables that reflect monthly temperature and precipitation data obtained from climate stations across the world.
Predicting the future potential distribution of Ar. subalbatus, six different climate change scenarios were considered by combining the three global climate models (GCMs) (BCC-CSM2-MR, CNRM-CM6-1, and MIROC-6) with the two Shared Socio-Economic Pathways (SSPs) (SSP 126, green; SSP 585, high) [47]. Under each SSP, we used climate data from two periods (2041–2060, 2050s, and 2060–2080, 2070s) to project future habitat distribution changes. All operations were performed in QGIS v3.26.1 (https://www.qgis.org/en/site/, accessed on 23 July 2022).
Multicollinearity and dimensionality among bioclimatic variables will probably cause computational artefacts when analyzing species–environment relationships [48,49]. To reduce the impact of multicollinearity and dimensionality on the accuracy of the model fit, we process the bioclimatic variables as follows: (1) Due to known spatial distortions, the modelization excludes the bioclimatic variables Bio8 (mean temperature of the wettest quarter), Bio9 (mean temperature of the driest quarter), Bio18 (precipitation of the warmest quarter), and Bio19 (precipitation of the coldest quarter) [50,51]. (2) The multicollinearity and dimensionality between bioclimatic variables were reduced by performing the person correlation coefficient (PCC) and principal component analysis (PCA) with the remaining 15 environmental variables, respectively. Referring to the results of the PCA, only one bioclimatic variable was selected from a set of highly correlated variables (|r| ≥ 0.8), which was biologically important for Ar. subalbatus distribution [52]. The “corrplot” package and “factoextra” package in R were used to perform the PCC and PCA analysis. (3) The variance inflation factors (VIF) analysis was carried out to remove the highly correlated environmental variables, since their strong correlation reduced the accuracy of the model [38,53,54]. It was considered that variables with VIF values (greater than 10) had a multicollinearity issue [39]. The “USDM” package in R was used to analyze the VIF.

2.3. Species Distribution Modeling

The MaxEnt (maximum entropy algorithm), the most extensively used robust model for predicting species distribution, was used to predict the Ar. subalbatus potential habitat distribution under current and future climatic conditions. To improve the performance of Maxent and avoid overfitting, the ENMeval 0.2.1 R (version 4.1.3) package was employed to adjust the regularization multiplier (RM) and feature class (FC) parameters [55]. Model performance was evaluated based on the Akaike information criterion corrected (AICc) for small sample sizes.
The Maxent version 3.4.1 software [56] was used to develop the species distribution modeling (SDM) of Ar. subalbatus in different future climate scenarios. The jackknife method was utilized to determine the contribution of each bioclimatic variable. The distribution data were randomly divided into two parts: the test set (25% of the distributed data) and the training set (75% of the distributed data). The maximum number of iterations was set to 5000, and the maximum number of background points was set to 20,000. The model was repeated 10 times to obtain the average outputs.
The reliability of the models was evaluated according to four criteria, including values of AUC (area under the receiver operating characteristic curve) [56], the continuous boyce index (CBI) [57,58], AUCDIFF [59], and the minimum training presence value (ORMTP) [60]. AUC values range from 0 to 1, with larger values indicating better model performance. The CBI has a range of −1 to 1, signifying inferior performance to a random model [61] and positive values indicating a good model performance. For models based on presence-only test data, this index is the most suitable assessment metric [61]. The CBI was implemented in the ecospat R package [62]. Based on the intuitive notion that overfit models should often perform well on training data but badly on test data, the metric (AUCDIFF) was developed. The larger the value of AUCDIFF, the more serious the overfitting of the model we built [59]. Additionally, based on the minimum training presence value (ORMTP), we estimated the test point omission rate to determine whether the best model is overfitting. This statistic ranged from 0 (not overfitted) to 1 (overfitted) and was threshold-dependent [60].
The probability (between 0 and 1) was applied to display the logical output of SDM, which can be explained as the suitability levels of Ar. subalbatus in the corresponding grid cell. The threshold of the MTSPS (Maximum Training Sensitivity Plus Specificity) was selected to define suitable and unsuitable regions of Ar. subalbatus. Based on this, the habitat suitability was divided into four degrees depending on the threshold value. The distribution probability less than the threshold value was considered unsuitable. These distribution probability values greater than the threshold and less than 1 are considered suitable, and they are equally divided into three levels (highly suitable areas, moderately suitable areas, and lowly suitable areas). The grid cells with suitability greater than 0.2368 were defined as potential suitable areas (wherein 0.7456–1 for highly suitable areas, 0.4912–0.7456 for moderately suitable areas, and 0.2368–0.4912 for lowly suitable areas).

2.4. Evaluation of Changes in Potential Suitable Areas

To effectively evaluate the impacts of various periods (2050s and 2070s) and SSPs (SSP126 and SSP585) on Ar. subalbatus, the means for the outputs of the four GCMs under the same SSP during the same time periods were computed. Under present and projected climatic scenarios, the distributions and geographic centroids of Ar. subalbatus were compared using the software SDMtoolbox [63].

3. Results

3.1. Observed Distributions and Climate Factors Selected

In total, observed occurrence data (531 presence records) were cleaned and yielded 431 unique occurrence records for Ar. subalbatus. Occurrence points for Ar. subalbatus were available from 26 provinces in China (Figure 1a). The northernmost area of Ar. subalbatus was close to the Yanshan Mountains. The longitudinal distribution of the Ar. subalbatus habitat ranged from 91°06′15″ N to 121°51′15″ N (Figure 1b). The latitudinal distribution of the Ar. subalbatus habitat ranged from 16°53′45″ E to 40°08′45″ E (Figure 1c). PCC results showed a high correlation between bioclimatic variables (Figure 2a). Bio12 was highly correlated with Bio6, Bio7, Bio9, Bio11, Bio13, and Bio16. Bio5 was also found to be highly correlated with Bio1, Bio8, and Bio10. The distribution of the 431 records was presented based on the first two main components (PCs), according to the PCA results (Figure 2b). The first two PCs accounted for 76.7% of the variance. The representative variables in PC1 were Bio2 and Bio11, and in PC2, they were were Bio5, Bio10, and Bio12 (Table 1). The results of the PCA and PCC were applied to the VIF as upstream data. Finally, it was decided to include Bio2, Bio3, Bio5, Bio12, Bio14, and Bio15 in the model based on the results of the VIF.

3.2. Model Performance

Employing the package ENMeval in R, the regularization multiplier and feature combination were calculated under the selected environmental variables [55]. The optimal FC for Ar. subalbatus was linear-quadratic (LQ) features, and the optimal RM was 1. Model performance was evaluated based on the Akaike information criterion corrected (AICc) for small sample sizes (ΔAICc = 0). Our model was acceptable as a sufficient representation of the Ar. subalbatus habitat’s suitability based on evaluation metrics (AUC = 0.9024 ± 0.0085 SD (Figure 3); mean CBI = 0.9100). Furthermore, the average ORMTP value (0.0153) and the AUCDIFF (0.0005) showed that our models were not overfitted.

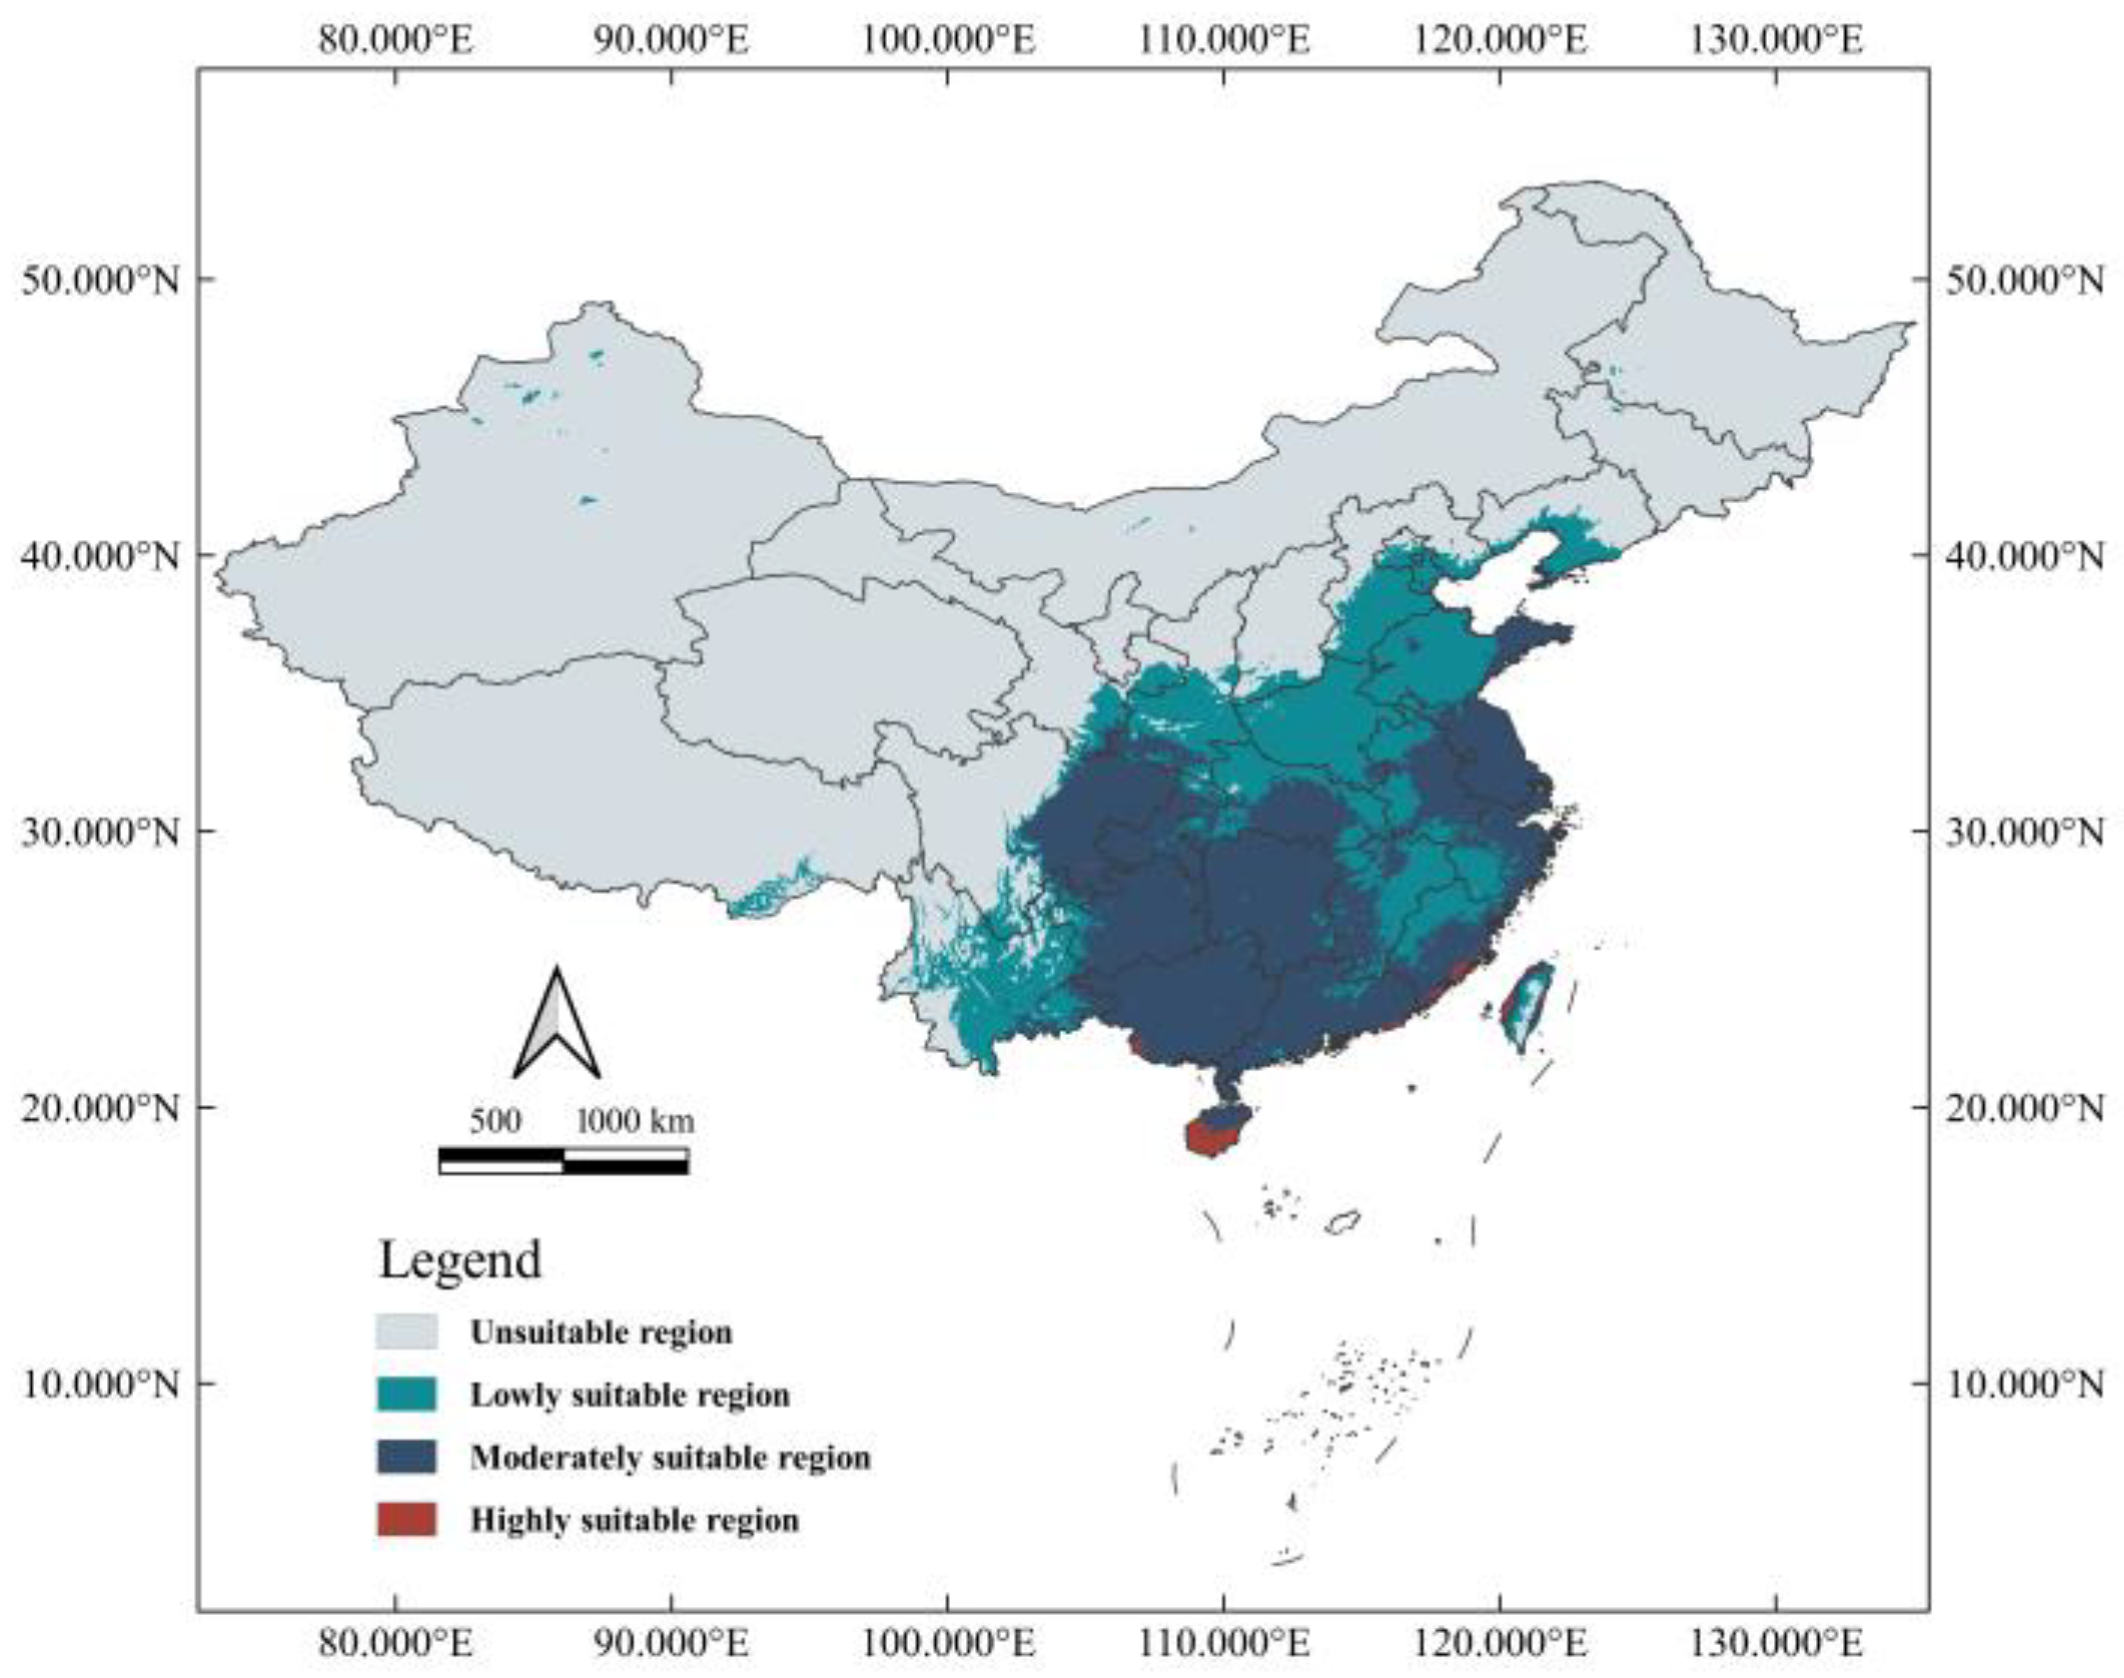
3.3. Current Distribution of Suitable Habitat

Currently, suitable habitats for Ar. subalbatus are predicted to exist in all provinces except Qinghai in China (Figure 4). In addition to the most continuous suitable areas, there were also discontinuous suitable areas scattered in several provinces. Small parts of six provinces (Inner Mongolia, Liaoning, Jilin, Heilongjiang, Ningxia, and Tibet) were also considered suitable habitats for Ar. subalbatus. The whole area of suitable habitats is spread across 3,676,508 km2, which accounts for about 38.27% of the national territory of China.

3.4. Important Bioclimatic Variables

The mean diurnal range (°C) (Bio2, 85.2%) and maximum temperature of the warmest month (°C) (Bio5, 9.7%) contributed significantly to the model compared to other bioclimatic variables (Figure 5). Precipitation seasonality (Bio15, 0.1%) was the least important factor. Isothermality (°C) (Bio3, 1.2%), annual precipitation (mm) (Bio12, 3.5%), and precipitation of the driest month (mm) (Bio14, 0.2%) were also substantial contributors to the model, with a cumulative contribution of 4.9% from these three variables (Figure 5).
The impact of bioclimatic variables on the probability of Ar. subalbatus occurrence is shown in Figure 6. The optimal range of Bio2 occurred between 3.867 °C and 18.306 °C. If Bio3 < 17.972 °C, the probability of presence decreased with the increase in the temperature. The impact of Bio5\Bio12\Bio14 on Ar. subalbatus increased at first and then showed a decreasing trend. The optimum range of Bio15 occurred at 18.271 mm–163.191 mm.

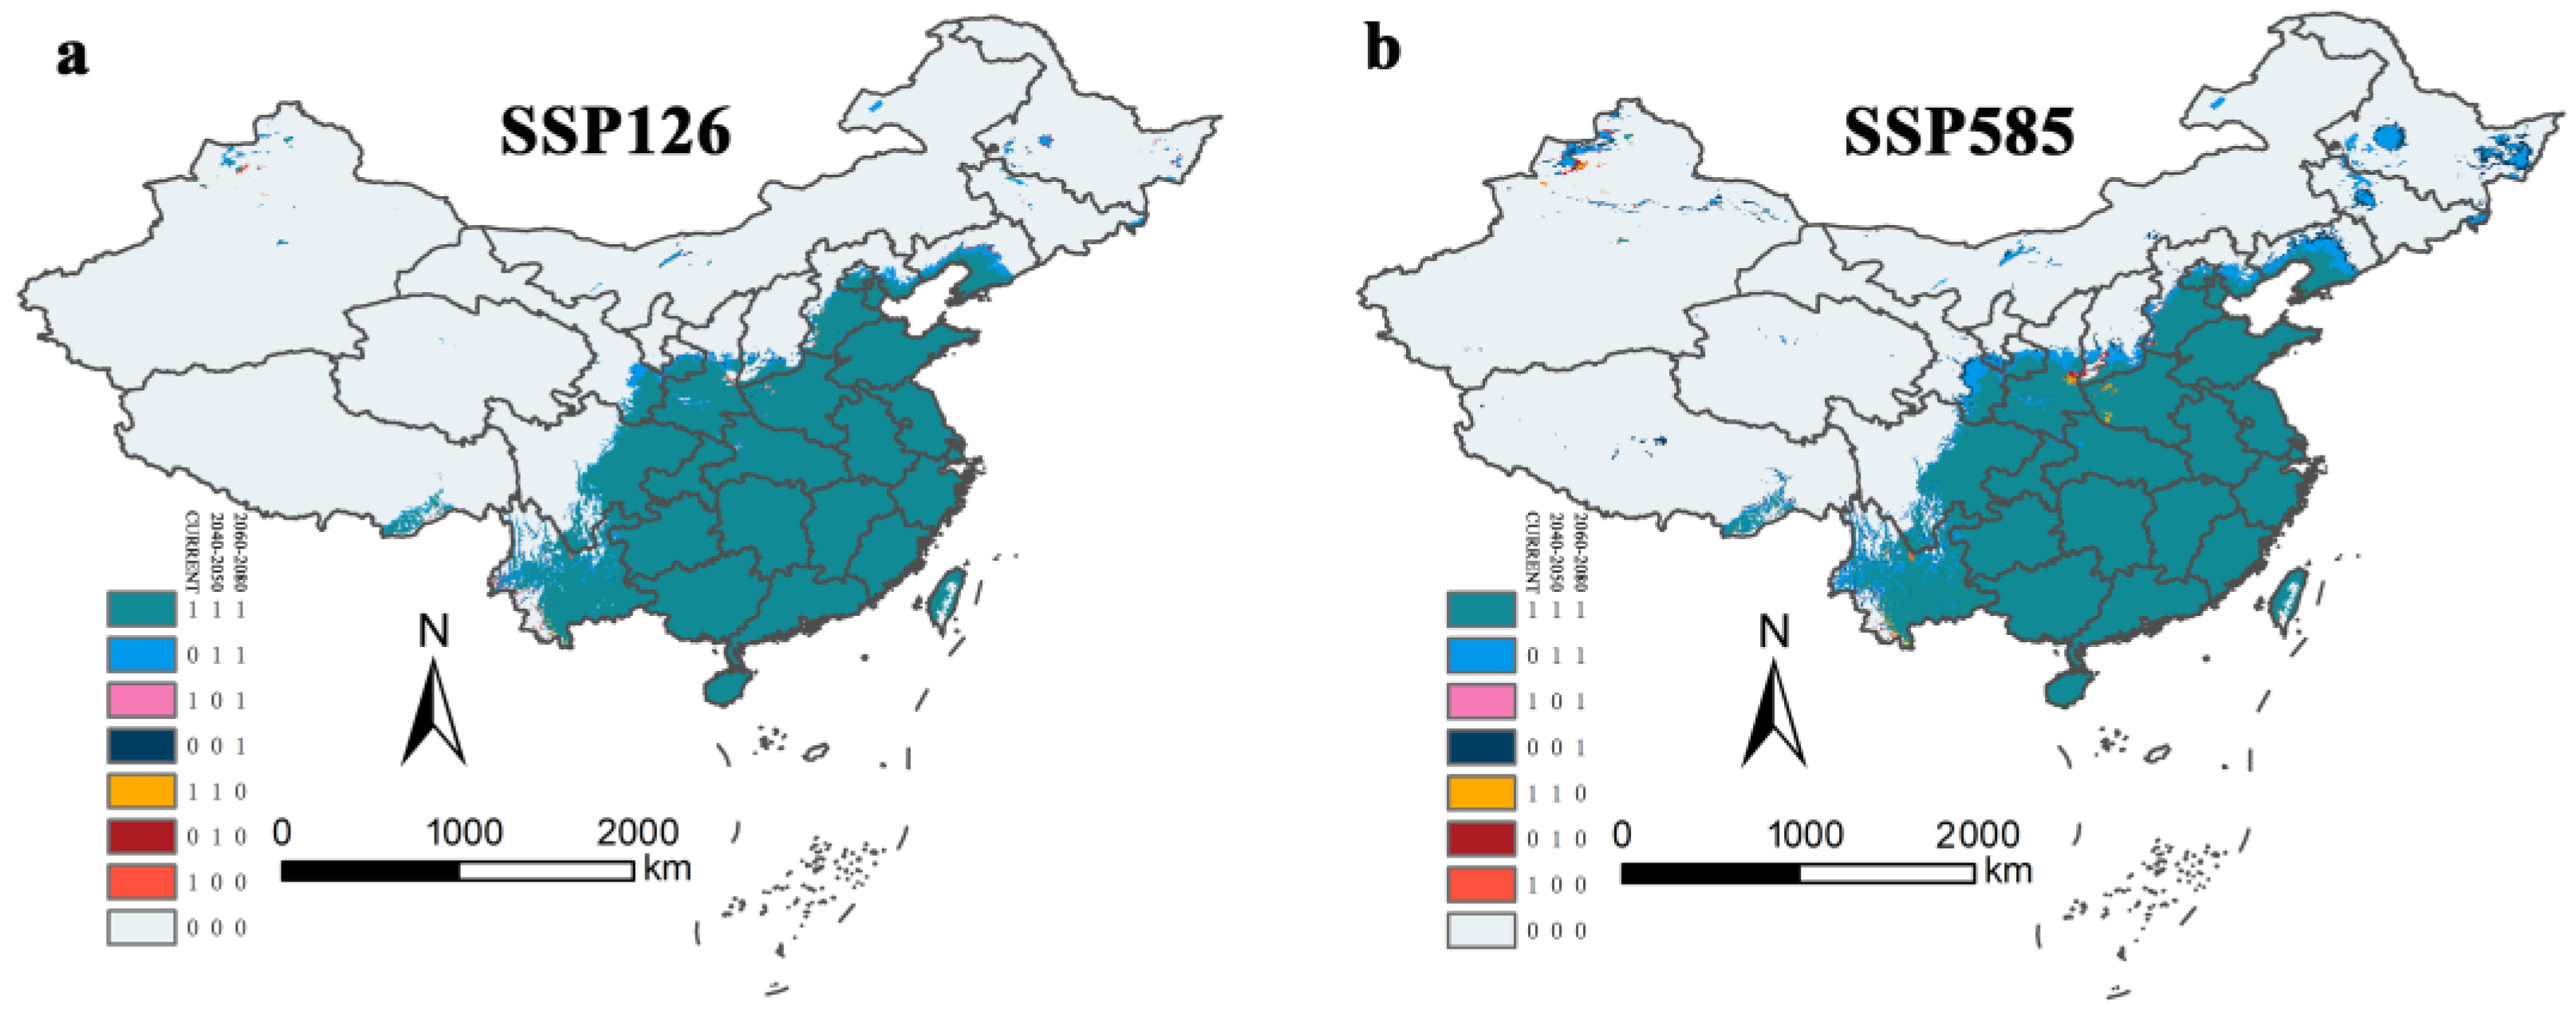
3.5. Potential Suitable Areas for Ar. subalbatus under Future Climate Scenarios

Under future climatic scenarios, the potential suitable areas of Ar. subalbatus were predicted to expand (Figure 7). Under the condition of SSP126, the potential suitable areas of the moderately and highly suitable areas will increase with the change in the time interval, and the area of the low-grade suitable area will decrease. Under the SSP585 condition, potential suitable areas changed in the other way. Low-grade suitable areas expanded dramatically, whereas suitable areas with intermediate and low levels shrank.
The binary distribution model explains the variation in suitable habitats well (Figure 8). The region of suitable habitats will significantly expand towards the northwest from the current suitable areas. Nevertheless, Ar. subalbatus will still mostly exist in the south of the Yanshan Mountains. Under SSP126 and SSP585 conductions, future suitable habitats’ expansion of Ar. subalbatus will take place in several provinces (Tibet, Xinjiang, Qinghai, Ningxia, Inner Mongolia, Yunnan, Sichuan, Gansu, Shaanxi, Shanxi, Hebei, Jilin, Heilongjiang, and Liaoning) within 2050s and 2070s. Qinghai will be the new suitable habitat in the future (2050s and 2070s). Sporadic regions of northeastern and northwestern China may develop into suitable habitats for Ar. subalbatus in all future climate scenarios.
The area of potentially suitable habitats for Ar. subalbatus in the future was also calculated according to the binary model (Table 2). Under different future climate scenarios, the current suitable area of Ar. subalbatus will remain stable. The area of suitable habitats for expansion (Figure 8) will increase over time (2050s and 2070s). According to the current study, suitable habitats’ area loss was negligible in comparison to its area increase. Under SSP585-2070s, the suitable area of Ar. subalbatus will expand to a maximum of about 372,929.9796 km2, which is 10.14% of the current suitable area covered.

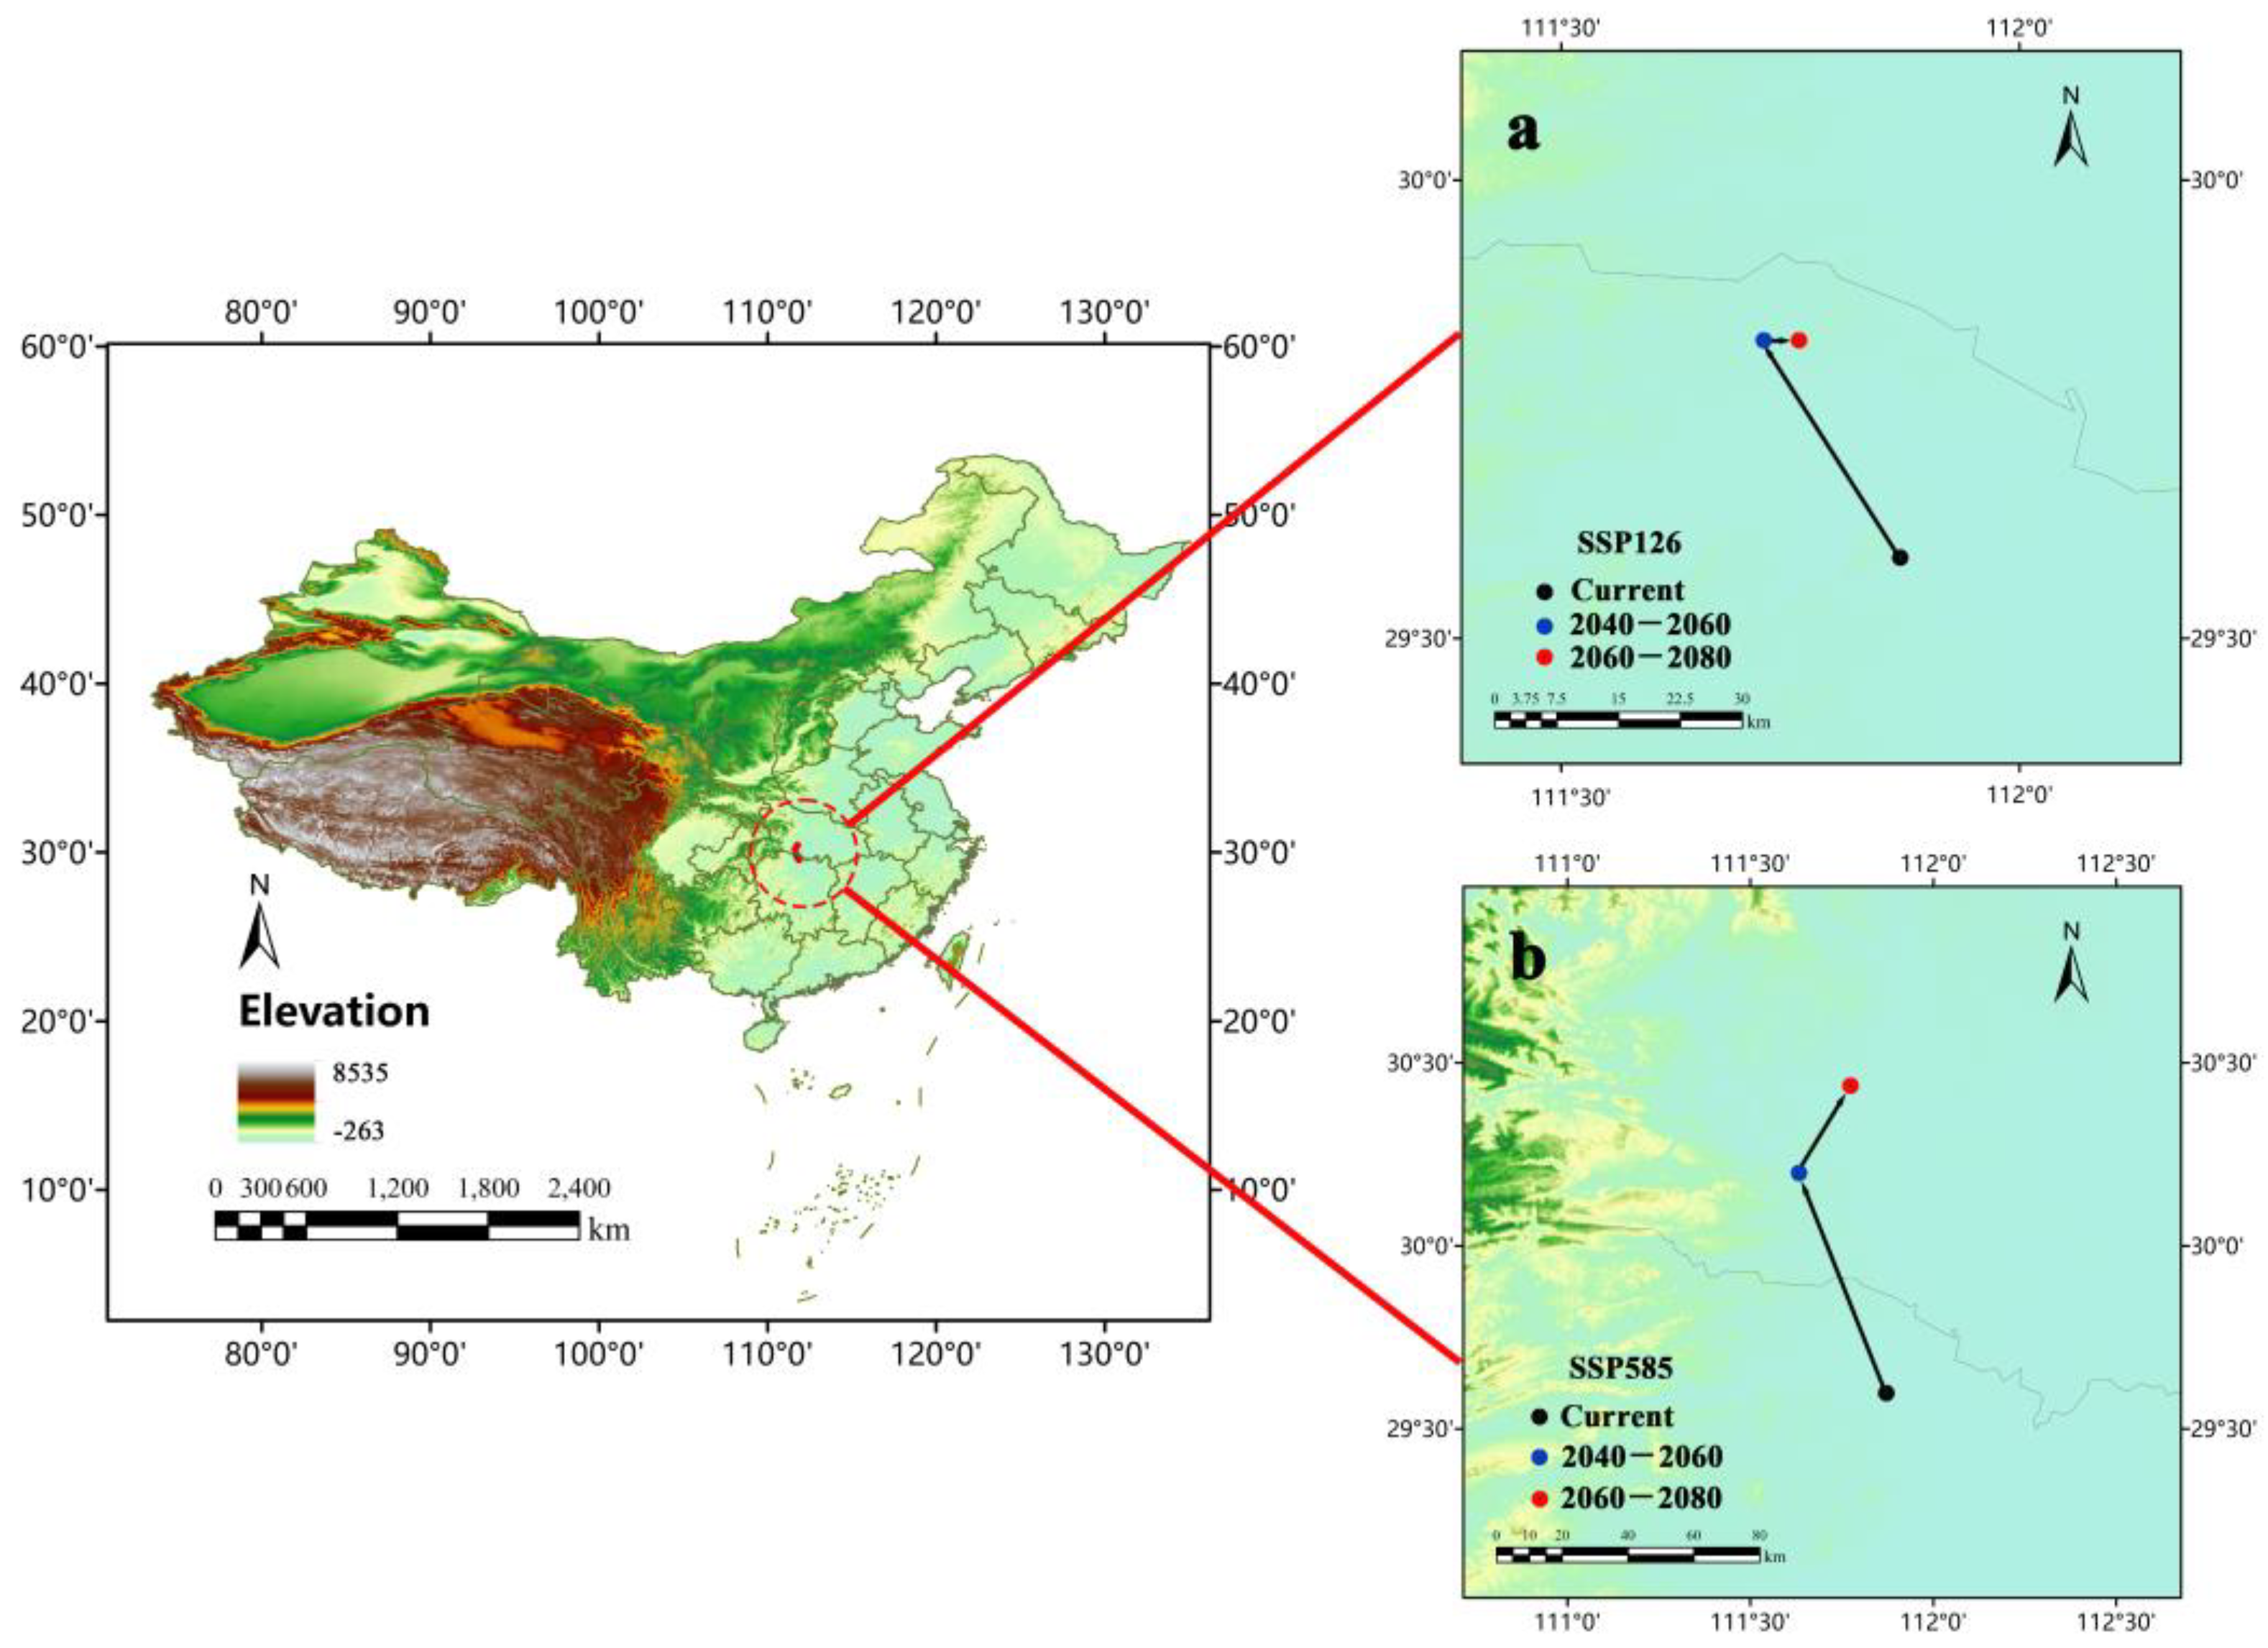
3.6. Centroid Shift and Potential Suitable Areas

Jinshi (111°52′11.648″ E, 29°35’32.732″ N), a city in Hunan province, was the centroid of Ar. subalbatus distribution under the current climatic conditions (Figure 9). The centroid was predicted to move toward the northeast under SSP585 (the 2050s: 111°37′50.058″ E, 30°11′57.017″ N; the 2070s: 111°46′18.177″ N). Under SSP126, the centroid may move toward the northeast (the 2050s: 111°45′18.273″ E, 29°49′32.371″ N) and then east (the 2070s: 111°43′18.788″ E, 29°49′32.371″ N). The results suggested the expansion of suitable habitats for Ar. subalbatus may be more toward the north.
Most current suitable areas of Ar. subalbatus were predicted to remain suitable, but parts of Sichuan, Tibet, Gansu, Shaanxi, Shanxi, Hebei, Liaoning, and south Ningxia might face unstable changes in suitability in the 2050s and recovery in the 2070s under two SSPs (SSP 126 and SSP 585) (Figure 10). The stable area (1, 1, 1) did not change much under different SSPs, and the non-suitable area (0, 0, 0) decreased by 91,431.79 km2 (SSP126) and 3735.00787 km2 (SSP585) (Table 3). The trend of change showed the same pattern, but the degree of change was different in the two SSPs and periods. The suitable regions present in parts of Sichuan, Yunnan, Gansu, Ningxia, Shaanxi, Shanxi, Hebei, and Liaoning provinces were the primary areas in which the expected suitable areas expanded. In addition, Xinjiang, Qinghai, Inner Mongolia, Jilin, and Heilongjiang were also predicted to be suitable areas for Ar. subalbatus. The loss of suitable areas for Ar. subalbatus might occur primarily in Shaanxi, Shanxi, Yunnan, Sichuan, and Henan. The suitable reduced area (1, 0, 0) was 5496.802 km2 (SSP126) and 26,192.03 km2 (SSP585). In addition, the suitable reduced area (1, 1, 0) was 2208.117 km2 (SSP126) and 15,644.75 km2 (SSP585). Furthermore, areas indicating areas of momentary fluctuations among the three timespans (0, 1, 0) were 2208.117 km2 (SSP 126) and 15,644.75 km2 (SSP585), and areas (1, 0, 1) were 249.004 km2 (SSP126) and 46.98122 km2 (SSP585) (Table 3).

4. Discussion

Although Ar. subalbatus has been proven to be a vector of a variety of pathogens, including several pathogens such as filariasis and the Japanese encephalitis virus [27,28], it has not received enough attention, and systematic research has not been carried out [64]. Recent studies have revealed that Ar. subalbatus is a new potential vector for the transmission of ZIKV, posing new challenges for the global prevention of ZIKV [18,23]. In fact, the risk of potential arboviruses’ (not just Zika) transmission may expand if the neglected vectors are still underrated. In this study, we predicted Ar. subalbatus will rapidly spread to all the provinces of China in the future and generated habitat suitability maps based on the MaxEnt model under current and future (the 2050s and 2070s) climatic conditions. Habitat suitability maps generated here will help predict to how the distribution of Ar. Subalbatus will change in the future and to focus attention on areas that can be prioritized for monitoring. Our research provided basic data on Ar. subalbatus for assessing the arboviruses’ epidemic risk.
The geographic range and abundance of insects were greatly affected by climate change [52]. The distribution, dispersion, and adaptation of insects may all be directly influenced by climatic variables including temperature, precipitation, and humidity [52,65]. We also proved that Ar. subalbatus distribution is significantly influenced by temperature and precipitation. In this study, response curves were utilized to evaluate the impact of various climatic factors on the probability that Ar. subalbatus would emerge. The results showed that 96.1% of the variance was accounted for by temperature parameters (Bio3, Bio2, and Bio5), whereas precipitation (Bio12, Bio14, and Bio15) contributed just 3.9%. Among all climate factors, bio2 (mean diurnal range) played the most important role, contributing 85.2%, and its variation range is 3.867 °C–18.306 °C. In the range of Bio2, the suitable probability declines as the value rises. In China, the north and west have higher mean diurnal ranges (Bio2) than the south and west [66]. The highest value (above 18 °C) appears in Xinjiang, Gansu, Qinghai, Tibet, etc. [66]. In fact, Ar. subalbatus is currently distributed in all provinces in China except Xinjiang, western Gansu, Qinghai, most of Tibet, Inner Mongolia, Liaoning, Heilongjiang, and Jilin. The distribution of Ar. subalbatus basically shows characteristics similar to the mean diurnal ranges in China. The implications of the mean diurnal range and vector distribution require further validation, but we may provide a good start. Relatively little research has been performed on Ar. Subalbatus. In a previous study [39], it was also found that two factors (temperature and relative humidity variation) may be important for the phenology of adult Ar. subalbatus, as the species was only found at temperatures above 14 °C and relative humidity above 65%. In addition, precipitation provides larval habitat and positively affects the activity and number of Ar. Subalbatus by impacting its egg hatching and diapause [39,67,68,69]. Our data showed that the contribution of precipitation is 3.9%, which may be related to precipitation that can affect the number of Ar. subalbatus, but its distribution range is mainly affected by temperature (especially the influence of Bio2).
Under the climate change scenarios of SSP126 and SSP585 compared to present climatic conditions, we can observe the expansion trend of suitable habitats for Ar. subalbatus in the 2050s and 2070s. The predictions under the SSP585-2070s scenario showed the worst results, followed by SSP585-2050s. Under SSP 585-2070s, the suitable area for Ar. subalbatus will reach a maximum value of about 4,179,713 km2, which is 1.137 times the current area. There are two types of new suitable habitats in different climatic conditions. The first type is continuous distribution expansion, and the expansion trend of suitable habitats for Ar. subalbatus is northward in Yunnan, Sichuan, Gansu, Ningxia, Shaanxi, Shanxi, Hebei, and Liaoning. Under the SSP585 and SSP126, the expansion can extend to southern Liaoning in mainland China. The second type (sporadic distribution expansion) showed that the new potential suitable areas are scattered in Xinjiang, Inner Mongolia, Qinghai, Heilongjiang, and Jilin for the first timespan, which do not border the current suitable habitat. The first type of expansion demands strengthening the monitoring of the occurrence and breeding of vectors. The second type deserves more complex monitoring and needs to pay attention to tourism and trade in addition to the requirements of the first type, because the frequency of Ar. subalbatus occurrence in new potential suitable areas will probably increase with increasing global trade and travel [66]. Furthermore, under all future modeling scenarios of this study, the distribution range of Ar. subalbatus may expand and provide more new suitable habitats, which might potentially put a bigger human population at risk.
As with studies that predict the impact of climate change on other mosquito species, Maxent models have some limitations and uncertainties in predicting future species distributions [4,22,54,70,71]. The assumption used to predict suitable habitats is that the species will not experience any dispersion limitations [22]. Additionally, the influence of biological interactions is ignored. Therefore, our predictions were made under ideal conditions. The models developed in our study emphasize that climate is a key driver of mosquito distribution, and our results established that temperature plays a major role in the distribution of Ar. subalbatus. As these predictions were not based on field investigation, our results can only be used as a reference for future mosquito monitoring. Decision-makers must fully understand the uncertainty of model predictions and combine field investigations to create the right strategy.

Author Contributions

Conceptualization, G.W., Z.W. and X.Z.; methodology, G.W. and J.K.; software, G.W. and D.Z.; validation, G.W., Y.S. and D.Z.; formal analysis, G.W., Y.W., Z.W. and X.Z.; investigation, J.G., Q.F., Y.S. and B.L.; resources, Y.W.; data curation, G.W.; writing—original draft preparation, G.W., J.K. and D.Z.; writing—review and editing, G.W., J.K. and D.Z.; visualization, G.W., J.K. and D.Z.; supervision, Y.W., Z.W. and X.Z.; project administration, Z.W. and X.Z.; funding acquisition, Z.W. and X.Z. All authors have read and agreed to the published version of the manuscript.

Funding

This research was funded by the National Key Research and Development Program of China (2020YFC1200100), the National Natural Science Foundation of China (82002168 and 82072308), the sixth Nuclear Energy R&D Project (20201192), the joint NSFC-BMGF (2022YFML1005) and the Fundamental Research Funds for the Central University (22qntd4801).

Institutional Review Board Statement

Not applicable.

Informed Consent Statement

Not applicable.

Data Availability Statement

The data presented in this study are available in this article. For the data provided in this study, see Section 2.1 and Section 2.2.

Conflicts of Interest

G.W., D.Z. and Y.S. are affiliated with SYSU Nuclear and Insect Biotechnology Co., Ltd., Dongguan, China. The other authors declare no conflict of interest.

References

  1. Gage, K.L.; Burkot, T.R.; Eisen, R.J.; Hayes, E.B. Climate and Vectorborne Diseases. Am. J. Prev. Med. 2008, 35, 436–450. [Google Scholar] [CrossRef] [PubMed]
  2. Lutambi, A.M.; Penny, M.A.; Smith, T.; Chitnis, N. Mathematical modelling of mosquito dispersal in a heterogeneous environment. Math. Biosci. 2013, 241, 198–216. [Google Scholar] [CrossRef] [PubMed]
  3. Leal, W.; Ternova, L.; Parasnis, S.A.; Kovaleva, M.; Nagy, G.J. Climate Change and Zoonoses: A Review of Concepts, Definitions, and Bibliometrics. Int. J. Environ. Res. Public Health 2022, 19, 893. [Google Scholar] [CrossRef]
  4. Outammassine, A.; Zouhair, S.; Loqman, S. Rift Valley Fever and West Nile virus vectors in Morocco: Current situation and future anticipated scenarios. Transbound. Emerg. Dis. 2022, 69, 1466–1478. [Google Scholar] [CrossRef] [PubMed]
  5. Weetman, D.; Kamgang, B.; Badolo, A.; Moyes, C.L.; Shearer, F.M.; Coulibaly, M.; Pinto, J.; Lambrechts, L.; McCall, P.J. Aedes Mosquitoes and Aedes-Borne Arboviruses in Africa: Current and Future Threats. Int. J. Environ. Res. Public Health 2018, 15, 220. [Google Scholar] [CrossRef] [Green Version]
  6. Bueno-Mari, R.; Jimenez-Peydro, R. Global change and human vulnerability to vector-borne diseases. Front. Physiol. 2013, 4, 158. [Google Scholar] [CrossRef] [Green Version]
  7. Ryan, S.J.; Carlson, C.J.; Mordecai, E.A.; Johnson, L.R. Global expansion and redistribution of Aedes-borne virus transmission risk with climate change. PLoS Negl. Trop. Dis. 2019, 13, e0007213. [Google Scholar] [CrossRef] [Green Version]
  8. Ng, V.; Rees, E.E.; Lindsay, L.R.; Drebot, M.A.; Brownstone, T.; Sadeghieh, T.; Khan, S.U. Could exotic mosquito-borne diseases emerge in Canada with climate change? Can. Commun. Dis. Rep. 2019, 45, 98–107. [Google Scholar] [CrossRef] [PubMed]
  9. Powell, J.R. Mosquitoes on the move. Science 2016, 354, 971–972. [Google Scholar] [CrossRef]
  10. Hoberg, E.P.; Brooks, D.R. Evolution in action: Climate change, biodiversity dynamics and emerging infectious disease. Philos. Trans. R. Soc. Lond. Ser. B Biol. Sci. 2015, 370, 20130553. [Google Scholar] [CrossRef]
  11. Heffernan, C. Climate change and multiple emerging infectious diseases. Vet. J. 2018, 234, 43–47. [Google Scholar] [CrossRef]
  12. Liang, L.; Gong, P. Climate change and human infectious diseases: A synthesis of research findings from global and spatio-temporal perspectives. Environ. Int. 2017, 103, 99–108. [Google Scholar] [CrossRef]
  13. Ogden, N.H.; Gachon, P. Climate change and infectious diseases: What can we expect? Can. Commun. Dis. Rep. 2019, 45, 76–80. [Google Scholar] [CrossRef]
  14. Garcia, E.; Yactayo, S.; Nishino, K.; Millo, V.; Perea, W.; Briand, S. Zika virus infection: Global update on epidemiology and potentially associated clinical manifestations. Wkly. Epidemiol. Rec. 2016, 91, 73–81. [Google Scholar]
  15. Musso, D.; Gubler, D.J. Zika Virus. Clin. Microbiol. Rev. 2016, 29, 487–524. [Google Scholar] [CrossRef] [PubMed] [Green Version]
  16. Chouin-Carneiro, T.; Vega-Rua, A.; Vazeille, M.; Yebakima, A.; Girod, R.; Goindin, D.; Dupont-Rouzeyrol, M.; Lourenco-de-Oliveira, R.; Failloux, A.B. Differential Susceptibilities of Aedes aegypti and Aedes albopictus from the Americas to Zika Virus. PLoS Negl. Trop. Dis. 2016, 10, e0004543. [Google Scholar] [CrossRef]
  17. Pei-Sze Jeslyn, W.; Mei-zhi Irene, L.; Chee-Seng, C.; Lee-Ching, N.; Cheong-Huat, T. Aedes (Stegomyia) albopictus (Skuse): A Potential Vector of Zika Virus in Singapore. PLoS Negl. Trop. Dis. 2013, 7, e2348. [Google Scholar]
  18. Li, C.X.; Guo, X.X.; Deng, Y.Q.; Liu, Q.M.; Xing, D.; Sun, A.J.; Wu, Q.; Dong, Y.D.; Zhang, Y.M.; Zhang, H.D.; et al. Susceptibility of Armigeres subalbatus Coquillett (Diptera: Culicidae) to Zika virus through oral and urine infection. PLoS Negl. Trop. Dis. 2020, 14, e0008450. [Google Scholar] [CrossRef]
  19. Lin, D.T.; Zheng, X.Y.; Sanogo, B.; Ding, T.; Sun, X.; Wu, Z.D. Bacterial composition of midgut and entire body of laboratory colonies of Aedes aegypti and Aedes albopictus from Southern China. Parasites Vectors 2021, 14, 586. [Google Scholar] [CrossRef]
  20. Diagne, C.T.; Diallo, D.; Faye, O.; Ba, Y.; Faye, O.; Gaye, A.; Dia, I.; Faye, O.; Weaver, S.C.; Sall, A.A.; et al. Potential of selected Senegalese Aedes spp. mosquitoes (Diptera: Culicidae) to transmit Zika virus. BMC Infect. Dis. 2015, 15, 492. [Google Scholar] [CrossRef] [PubMed] [Green Version]
  21. Braack, L.; Paulo Gouveia de Almeida, A.; Cornel, A.J.; Swanepoel, R.; De Jager, C. Mosquito-borne arboviruses of African origin: Review of key viruses and vectors. Parasites Vectors 2018, 11, 29. [Google Scholar] [CrossRef]
  22. Outammassine, A.; Zouhair, S.; Loqman, S. Global potential distribution of three underappreciated arboviruses vectors (Aedes japonicus, Aedes vexans and Aedes vittatus) under current and future climate conditions. Transbound. Emerg. Dis. 2022, 69, E1160–E1171. [Google Scholar] [CrossRef] [PubMed]
  23. Yang, W.Q.; Zhao, S.Y.; Xie, Y.G.; Liu, T.; Kong, L.; Guo, Y.J.; Xie, Z.S.; Liu, P.W.; Chen, X.G. Armigeres subalbatus is a potential vector for Zika virus but not dengue virus. Infect. Dis. Poverty 2022, 11, 62. [Google Scholar] [CrossRef]
  24. Fu, S.; Song, S.; Liu, H.; Li, Y.; Li, X.; Gao, X.; Xu, Z.; Liu, G.; Wang, D.; Tian, Z.; et al. ZIKA virus isolated from mosquitoes: A field and laboratory investigation in China, 2016. Sci. China-Life Sci. 2017, 60, 1364–1371. [Google Scholar] [CrossRef]
  25. Phumee, A.; Buathong, R.; Boonserm, R.; Intayot, P.; Aungsananta, N.; Jittmittraphap, A.; Joyjinda, Y.; Wacharapluesadee, S.; Siriyasatien, P. Molecular Epidemiology and Genetic Diversity of Zika Virus from Field-Caught Mosquitoes in Various Regions of Thailand. Pathogens 2019, 8, 30. [Google Scholar] [CrossRef] [Green Version]
  26. Dong, X.; Zhou, H.; Gong, Z. Insecta. VOIII. Diptera: Culicidae: Yunnan Mosquito Fauna; Yunnan Science & Technology Press: Kunming, China, 2009; p. 3. [Google Scholar]
  27. Zheng, Y.; Li, M.; Wang, H.; Liang, G. Japanese encephalitis and Japanese encephalitis virus in mainland China. Rev. Med. Virol. 2012, 22, 301–322. [Google Scholar] [CrossRef] [PubMed]
  28. Aliota, M.T.; Fuchs, J.F.; Rocheleau, T.A.; Clark, A.K.; Hillyer, J.F.; Chen, C.; Christensen, B.M. Mosquito Transcriptome Profiles and Filarial Worm Susceptibility in Armigeres subalbatus. PLoS Negl. Trop. Dis. 2010, 4, e666. [Google Scholar] [CrossRef] [PubMed] [Green Version]
  29. Zhang, H.; Wang, Y.; Wang, Z.; Ding, W.; Xu, K.; Li, L.; Wang, Y.; Li, J.; Yang, M.; Liu, X.; et al. Modelling the current and future potential distribution of the bean bug Riptortus pedestris with increasingly serious damage to soybean. Pest Manag. Sci. 2020, 78, 4340–4352. [Google Scholar] [CrossRef] [PubMed]
  30. Elith, J.; Graham, C.H.; Anderson, R.P.; Dudík, M.; Ferrier, S.; Guisan, A.J.; Hijmans, R.; Huettmann, F.; Leathwick, J.R.; Lehmann, A.; et al. Novel methods improve prediction of species’ distributions from occurrence data. Ecography 2006, 29, 129–151. [Google Scholar] [CrossRef] [Green Version]
  31. Zhu, G.P.; Liu, G.Q.; Bu, W.J.; Gao, Y.B. Ecological niche modeling and its applications in biodiversity conservation. Biodivers. Sci. 2013, 21, 90–98. [Google Scholar]
  32. Fan, J.; Wu, P.; Tian, T.; Ren, Q.; Haseeb, M.; Zhang, R. Potential distribution and niche differentiation of Spodoptera frugiperda in Africa. Insects 2020, 11, 383. [Google Scholar] [CrossRef]
  33. Raffini, F.; Bertorelle, G.; Biello, R.; D’Urso, G.; Russo, D.; Bosso, L. From nucleotides to satellite imagery: Approaches to identify and manage the invasive patho-gen Xylella fastidiosa and its insect vectors in Europe. Sustainability 2020, 12, 4508. [Google Scholar] [CrossRef]
  34. Srivastava, V.; Roe, A.D.; Keena, M.A.; Hamelin, R.C.; Griess, V.C. Oh the places they’ll go: Improving species distribution modelling for invasive forest pests in an uncertain world. Biol. Invasions 2021, 23, 297–349. [Google Scholar] [CrossRef]
  35. Wiens, J.A.; Stralberg, D.; Jongsomjit, D.; Howell, C.A.; Snyder, M.A. Niches, models, and climate change: Assessing the assumptions and uncertainties. Proc. Natl. Acad. Sci. USA 2009, 106, 19729–19736. [Google Scholar] [CrossRef] [Green Version]
  36. Miller, R.H.; Masuoka, P.; Klein, T.A.; Kim, H.C.; Somer, T.; Grieco, J. Ecological niche modeling to estimate the distribution of Japanese encephalitis virus in Asia. PLoS Negl. Trop. Dis. 2012, 6, 119–121. [Google Scholar] [CrossRef] [Green Version]
  37. González, C.; Wang, O.; Strutz, S.E.; González-Salazar, C.; Sánchez-Cordero, V.; Sarkar, S. Climate change and risk of leishmaniasis in North America: Predictions from ecological niche models of vector and reservoir species. PLoS Negl. Trop. Dis. 2010, 4, e585. [Google Scholar] [CrossRef] [Green Version]
  38. Liu, B.; Gao, X.; Ma, J.; Jiao, Z.; Xiao, J.; Hayat, M.A.; Wang, H. Modeling the present and future distribution of arbovirus vectors Aedes aegypti and Aedes albopictus under climate change scenarios in Mainland China. Sci. Total Environ. 2019, 664, 203–214. [Google Scholar] [CrossRef]
  39. Chaves, L.F.; Imanishi, N.; Hoshi, T. Population dynamics of Armigeres subalbatus (Diptera: Culicidae) across a temperate altitudinal gradient. Bull. Entomol. Res. 2015, 105, 589–597. [Google Scholar] [CrossRef] [Green Version]
  40. Kadmon, R.; Farber, O.; Danin, A. Effect of roadside bias on the accuracy of predictive maps produced by bioclimatic models. Ecol. Appl. 2004, 14, 401–413. [Google Scholar] [CrossRef]
  41. Edren, S.M.C.; Wisz, M.S.; Teilmann, J.; Dietz, R.; Söderkvist, T. Modelling spatial patterns in harbour porpoise satellite telemetry data using maximum entropy. Ecography 2010, 33, 698–708. [Google Scholar] [CrossRef]
  42. Jennings, A.P.; Veron, G. Predicted distributions and ecological niches of 8 civet and mongoose species in Southeast Asia. J. Mammal. 2011, 92, 316–327. [Google Scholar] [CrossRef]
  43. Phillips, S.J.; Dudík, M.; Elith, J.; Graham, C.H.; Lehmann, A.; Leathwick, J.; Ferrier, S. Sample selection bias and presence-only distribution models: Implications for background and pseudo-absence data. Ecol. Appl. 2009, 19, 181–197. [Google Scholar] [CrossRef] [Green Version]
  44. Warren, D.L.; Glor, R.E.; Turelli, M. ENMTools: A toolbox for comparative studies of environmental niche models. Ecography 2010, 33, 607–611. [Google Scholar] [CrossRef]
  45. Brown, J.L.; Hill, D.J.; Dolan, A.M.; Carnaval, A.C.; Haywood, A.M. PaleoClim, high spatial resolution paleoclimate surfaces for global land areas. Sci. Data 2018, 5, 180254. [Google Scholar] [CrossRef] [PubMed] [Green Version]
  46. Fick, S.E.; Hijmans, R.J. WorldClim 2: New 1-km spatial resolution climate surfaces for global land areas. Int. J. Climatol. 2017, 37, 4302–4315. [Google Scholar] [CrossRef]
  47. Eyring, V.; Bony, S.; Meehl, G.A.; Senior, C.A.; Stevens, B.; Stouffer, R.J.; Taylor, K.E. Overview of the Coupled Model Intercomparison Project Phase 6 (CMIP6) experimental design and organization. Geosci. Model Dev. 2016, 9, 1937–1958. [Google Scholar] [CrossRef] [Green Version]
  48. Heikkinen, R.K.; Araújo, M.B.; Virkkala, R.; Thuiller, W.; Sykes, M.T. Methods and uncertainties in bioclimatic envelop modeling under climate change. Prog. Phys. Geogr. Earth Environ. 2006, 30, 751–777. [Google Scholar] [CrossRef] [Green Version]
  49. Dormann, C.F.; Elith, J.; Bacher, S.; Buchmann, C.; Carl, G.; Carré, G.; Marquéz, J.R.G.; Gruber, B.; Lafourcade, B.; Leitão, P.J.; et al. Collinearity: A review of methods to deal with it and a simulation study evaluating their performance. Ecography 2013, 36, 27–46. [Google Scholar] [CrossRef]
  50. Escobar, L.E.; Lira-Noriega, A.; Medina-Vogel, G.; Peterson, A.T. Potential for spread of the white-nose fungus (Pseudogymnoascus destructans) in the Americas: Use of Maxent and NicheA to assure strict model transference. Geospat. Health 2014, 9, 221–229. [Google Scholar] [CrossRef]
  51. Kamal, M.; Kenawy, M.A.; Rady, M.H.; Khaled, A.S.; Samy, A.M. Mapping the global Mapping the global potential distributions of two arboviral vectors Aedes aegypti and Ae. albopictus under changing climate. PLoS ONE 2018, 13, e0210122. [Google Scholar] [CrossRef] [Green Version]
  52. Ramasamy, M.; Das, B.; Ramesh, R. Predicting climate change impacts on potential worldwide distribution of fall armyworm based on CMIP6 projections. J. Pest Sci. 2022, 95, 841–854. [Google Scholar] [CrossRef]
  53. Chen, S.; Ding, F.; Hao, M.; Jiang, D. Mapping the Potential Global Distribution of Red Imported Fire Ant (Solenopsis invicta Buren) Based on a Machine Learning Method. Sustainability 2020, 12, 10182. [Google Scholar] [CrossRef]
  54. Liu, B.; Jiao, Z.; Ma, J.; Gao, X.; Xiao, J.; Hayat, M.A.; Wang, H. Modelling the potential distribution of arbovirus vector Aedes aegypti under current and future climate scenarios in Taiwan, China. Pest Manag. Sci. 2019, 75, 3076–3083. [Google Scholar] [CrossRef] [PubMed]
  55. Muscarella, R.; Galante, P.J.; Soley-Guardia, M.; Boria, R.A.; Kass, J.M.; Uriarte, M.; Anderson, R.P. ENMeval: An R package for conducting spatially independent evaluations and estimating optimal model complexity for MAXENT ecological niche models. Methods Ecol. Evol. 2014, 5, 1198–1205. [Google Scholar] [CrossRef] [Green Version]
  56. Phillips, S.J.; Anderson, R.P.; Schapire, R.E. Maximum entropy modeling of species geographic distributions. Ecol. Model. 2006, 190, 231–259. [Google Scholar] [CrossRef] [Green Version]
  57. Boyce, M.S.; Vernier, P.R.; Nielsen, S.E.; Schmiegelow, F.K.A. Evaluating resource selection functions. Ecol. Model. 2022, 157, 281–300. [Google Scholar] [CrossRef] [Green Version]
  58. Engler, R.; Guisan, A.; Rechsteiner, L. An improved approach for pre-dicting the distribution of rare and endangered species from occurrence and pseudo-absence data. J. Appl. Ecol. 2004, 41, 263–274. [Google Scholar] [CrossRef]
  59. Warren, D.L.; Seifert, S.N. Ecological niche modeling in Maxent: The importance of model complexity and the performance of model selection criteria. Ecol. Appl. 2011, 21, 335–342. [Google Scholar] [CrossRef] [Green Version]
  60. Peterson, A.T.; Soberón, J.; Pearson, R.G.; Anderson, R.P.; Martínez-Meyer, E.; Nakamura, M.; Araújo, M.B. Ecological Niches and Geographic Distributions; Princeton University Press: Princeton, NJ, USA, 2011; p. 328. [Google Scholar]
  61. Hirzel, A.H.; Le Lay, G.; Helfer, V.; Randin, C.; Guisan, A. Evaluating the ability of habitat suitability models to predict species presences. Ecol. Model. 2006, 199, 142–152. [Google Scholar] [CrossRef]
  62. Di Cola, V.; Broennimann, O.; Petitpierre, B.; Breiner, F.T.; D’Amen, M.; Randin, C.; Engler, R.; Pottier, J.; Pio, D.; Dubuis, A.; et al. ecospat: An R package to support spatial analyses and modeling of species niches and distributions. Ecography 2017, 40, 774–787. [Google Scholar] [CrossRef]
  63. Brown, J.L.; Bennett, J.R.; French, C.M. SDMtoolbox 2.0: The next generation Python-based GIS toolkit for landscape genetic, biogeographic and species distribution model analyses. PeerJ 2017, 5, e4095. [Google Scholar] [CrossRef] [PubMed] [Green Version]
  64. Cunze, S.; Kochmann, J.; Klimpel, S. Global occurrence data improve potential distribution models for Aedes japonicus japonicus in non-native regions. Pest Manag. Sci. 2020, 76, 1814–1822. [Google Scholar] [CrossRef] [PubMed] [Green Version]
  65. Bale, J.S.; Masters, G.J.; Hodkinson, I.D.; Awmack, C.; Bezemer, T.M.; Brown, V.K.; Butterfield, J.; Buse, A.; Coulson, J.C.; Farrar, J.; et al. Herbivory in global climate change research: Direct effects of rising temperature on insect herbivores. Glob. Chang. Biol. 2002, 8, 1–16. [Google Scholar] [CrossRef]
  66. Wang, S.; Xie, W.; Yan, X. Evalution on CMIP6 Model Simulation of the Diurnal Temperature Range over China. Clim. Environ. Res. 2022, 27, 79–93. [Google Scholar]
  67. Barr, A.R.; Chellappah, W.T. The colonization and laboratory maintenance of Armigeres subalbatus (Coquillett). Bull. World Health Organ. 1964, 31, 439. [Google Scholar] [PubMed]
  68. Amerasinghe, F.P.; Munasingha, N.B. A predevelopment mosquito survey in the Mahaweli Development Project area, Sri Lanka: Adults. J. Med. Entomol. 1988, 25, 276–285. [Google Scholar] [CrossRef] [PubMed]
  69. Chaves, L.F.; Scott, T.W.; Morrison, A.C.; Takada, T. Hot temperatures can force delayed mosquito outbreaks via sequential changes in Aedes aegypti demographic parameters in autocorrelated environments. Acta Trop. 2014, 129, 15–24. [Google Scholar] [CrossRef] [Green Version]
  70. Ogden, N.H. Climate change and vector-borne diseases of public health significance. FEMS Microbiol. Lett. 2017, 364, fnx186. [Google Scholar] [CrossRef] [Green Version]
  71. Liu, B.; Gao, X.; Zheng, K.; Ma, J.; Jiao, Z.; Xiao, J.; Wang, H. The potential distribution and dynamics of important vectors Culex pipiens pallens and Culex pipiens quinquefasciatus in China under climate change scenarios: An ecological niche modelling approach. Pest Manag. Sci. 2020, 76, 3096–3107. [Google Scholar] [CrossRef]
Figure 1. Overview of the observed occurrence records used for predictions. (a) The observed occurrence records of Ar. subalbatus in China; (b) longitudinal distribution curve of Ar. subalbatus habitat in China; (c) latitudinal distribution curve of Ar. subalbatus habitat in China.
Tropicalmed 07 00431 g001
Figure 2. PCC (person correlation coefficient) and PCA (principal component analysis) of climatic factors. (a) Person correlation coefficient; (b) principal component analysis.
Tropicalmed 07 00431 g002
Figure 3. Receiver operating characteristic (ROC) curves and values of the area under the curves (AUC) of the modelling.
Tropicalmed 07 00431 g003
Figure 4. Modeled habitat suitability of Ar. subalbatus under current climate conditions in China.
Tropicalmed 07 00431 g004
Figure 5. The key bioclimatic variables affecting the distribution of Ar. subalbatus. Bio 2: Mean diurnal temperature range (°C); maximum temperature of warmest month (°C) (Bio5, 9.7%); Bio15: precipitation seasonality; isothermality (°C) (Bio3, 1.2%), annual precipitation (mm) (Bio12, 3.5%), and precipitation of driest month (mm) (Bio14, 0.2%).
Tropicalmed 07 00431 g005
Figure 6. Response curves for representative variables. The vertical axis represents the probability of presence for Ar. subalbatus, and the horizontal axis represents the variation range of the corresponding variable.
Tropicalmed 07 00431 g006
Figure 7. Habitat suitability of Ar. subalbatus under future climate change scenarios. (a) Potentially suitable areas to distribution of Ar. subalbatus within a context of climate change for 2050s (2040–2060), under the SSP126 scenario; (b) Potentially suitable areas to distribution of Ar. subalbatus within a context of climate change for 2070s (2060–2080), under the SSP126 scenario; (c) Potentially suitable areas to distribution of Ar. subalbatus within a context of climate change for 2050s (2040–2060), under the SSP585 scenario; (d) Potentially suitable areas to distribution of Ar. subalbatus within a context of climate change for 2070s (2060–2080), under the SSP585 scenario.
Tropicalmed 07 00431 g007
Figure 8. Changes to suitable habitats of Ar. subalbatus under future climate change predicted by the binary model. (a) Changes to suitable habitats of Ar. subalbatus within 2050s (2040–2060), under the SSP126 scenario; (b) Changes to suitable habitats of Ar. subalbatus within 2070s (2060–2080), under the SSP126 scenario; (c) Changes to suitable habitats of Ar. subalbatus within 2050s (2040–2060), under the SSP585 scenario; (d) Changes to suitable habitats of Ar. subalbatus within 2070s (2060–2080), under SSP585 scenario.
Tropicalmed 07 00431 g008
Figure 9. Changes of environmental suitability centroid for Ar. subalbatus within the years 2050s (2040–2060) and 2070s (2060–2080), under the (a) SSP126 and (b) SSP585 scenario.
Tropicalmed 07 00431 g009
Figure 10. Changes to suitable areas under the (a) SSP126 and (b) SSP585 scenario. Eight colors refer to eight situations that occurred in specific locations. Green (1, 1, 1) area refers to a relatively stable region that is suitable for Ar. subalbatus; yellow (1, 1, 0) and orange (1, 0, 0) areas refer to a threatened region that will no longer be suitable in the 2050s or 2070s; blue (0, 1, 1) and dark-blue (0, 0, 1) areas refer to a promising region in which conditions will become suitable from an unsuitable state in the 2050s or 2070s; grey (0, 0, 0) areas remain absent throughout the entire time period. Pink (1, 0, 1) and dark-red (0, 1, 0) areas indicate areas of momentary fluctuations among the three timespans.
Tropicalmed 07 00431 g010
Table 1. Bioclimatic variables used in the model.
Bioclimatic VariableDescriptionIncluded
Bio01Annual mean temperature
Bio02Mean diurnal temperature rangeYes
Bio03IsothermalityYes
Bio04Temperature seasonality
Bio05Max temperature of the warmest monthYes
Bio06Min temperature of the coldest month
Bio07Annual temperature range
Bio08Mean temperature of the wettest quarter
Bio09Mean temperature of the driest quarter
Bio10Mean temperature of the warmest quarter
Bio11Mean temperature of the coldest quarter
Bio12Annual precipitationYes
Bio13Precipitation of the wettest month
Bio14Precipitation of the driest monthYes
Bio15Precipitation seasonalityYes
Bio16Precipitation of the wettest quarter
Bio17Precipitation of the driest quarter
Bio18Precipitation of the warmest quarter
Bio19Precipitation of the coldest quarter
Table 2. Estimated gain, stability, and loss of suitable habitat area for Ar. subalbatus under future climate change scenarios.
Time PeriodSSPS ScenariosArea Change (%)
Range ExpansionNo ChangeRange ContractionNet
Change
2040–2060SSP1264.193%78.385%0.160%4.033%
2040–2060SSP5857.755%78.466%0.079%7.675%
2060–2080SSP1264.151%78.388%0.157%3.994%
2060–2080SSP58510.144%78.140%0.404%9.739%
Table 3. Changes to suitable areas under climate change: 0 refers to an absence of the species, and 1 refers to its presence.
Present or Absent in Different PeriodsAreas under Climate Scenarios (km2)
CURRENT2045–20602060–2070SSP126SSP585
11136,378.9736,286.65
01118,778.3936,541.99
101249.00446.98122
00117,030.6915,327.62
1102208.11715,644.75
01017,970.3226,192.03
1005496.80226,192.03
00091,431.793735.007
Publisher’s Note: MDPI stays neutral with regard to jurisdictional claims in published maps and institutional affiliations.

