As mentioned before, this paper focuses on the evaluation of the low Reynolds number measurement data and discusses in detail an operating point with an inlet Reynolds number of = 50,000. This operating point provides a good insight into the operating limits of the fluidic actuators as an open flow separation occurs on the suction side without active flow control.
4.1. Integral Total Pressure Loss
The wake traverses with the five hole probe at
or
of the chord length
l behind the trailing edge of the middle blade are used to determine an integral pressure loss coefficient according to the method reported in Amecke [
17] which calculates a mixed out state using the conservation of mass, momentum and energy. The integral total pressure loss coefficient is determined as:
In Equation (
1)
is the total inlet pressure,
the static inlet pressure and
the outlet pressure which is computed according to Amecke [
17] with the five hole probe pressures. If experiments are conducted with active flow control by pulsed blowing, the definition has to be slightly changed to account for the energy addition by the fluidic oscillators. This can be done by computing a corrected total inlet pressure by using conservation of energy as shown by Ardey [
18]:
The inlet mass flow per passage
is calculated by subtracting the AFC mass flow of one blade from the outlet mass flow per passage which is gained from the measurements with the five hole probe as:
The total plenum temperature as well as the total plenum pressure are the average values of all three plenums.
With the actuation mass flow corrected inlet total pressure
a corrected integral total pressure loss coefficient can be defined accordingly to the definition as:
In order to respect the proprietary nature of the experimental data, all total pressure losses are normalized with a reference integral total pressure loss . It is the total pressure loss in the aerodynamic design point of a state of the art TEC.
4.2. Determination of the Optimal Mass Flow Rate
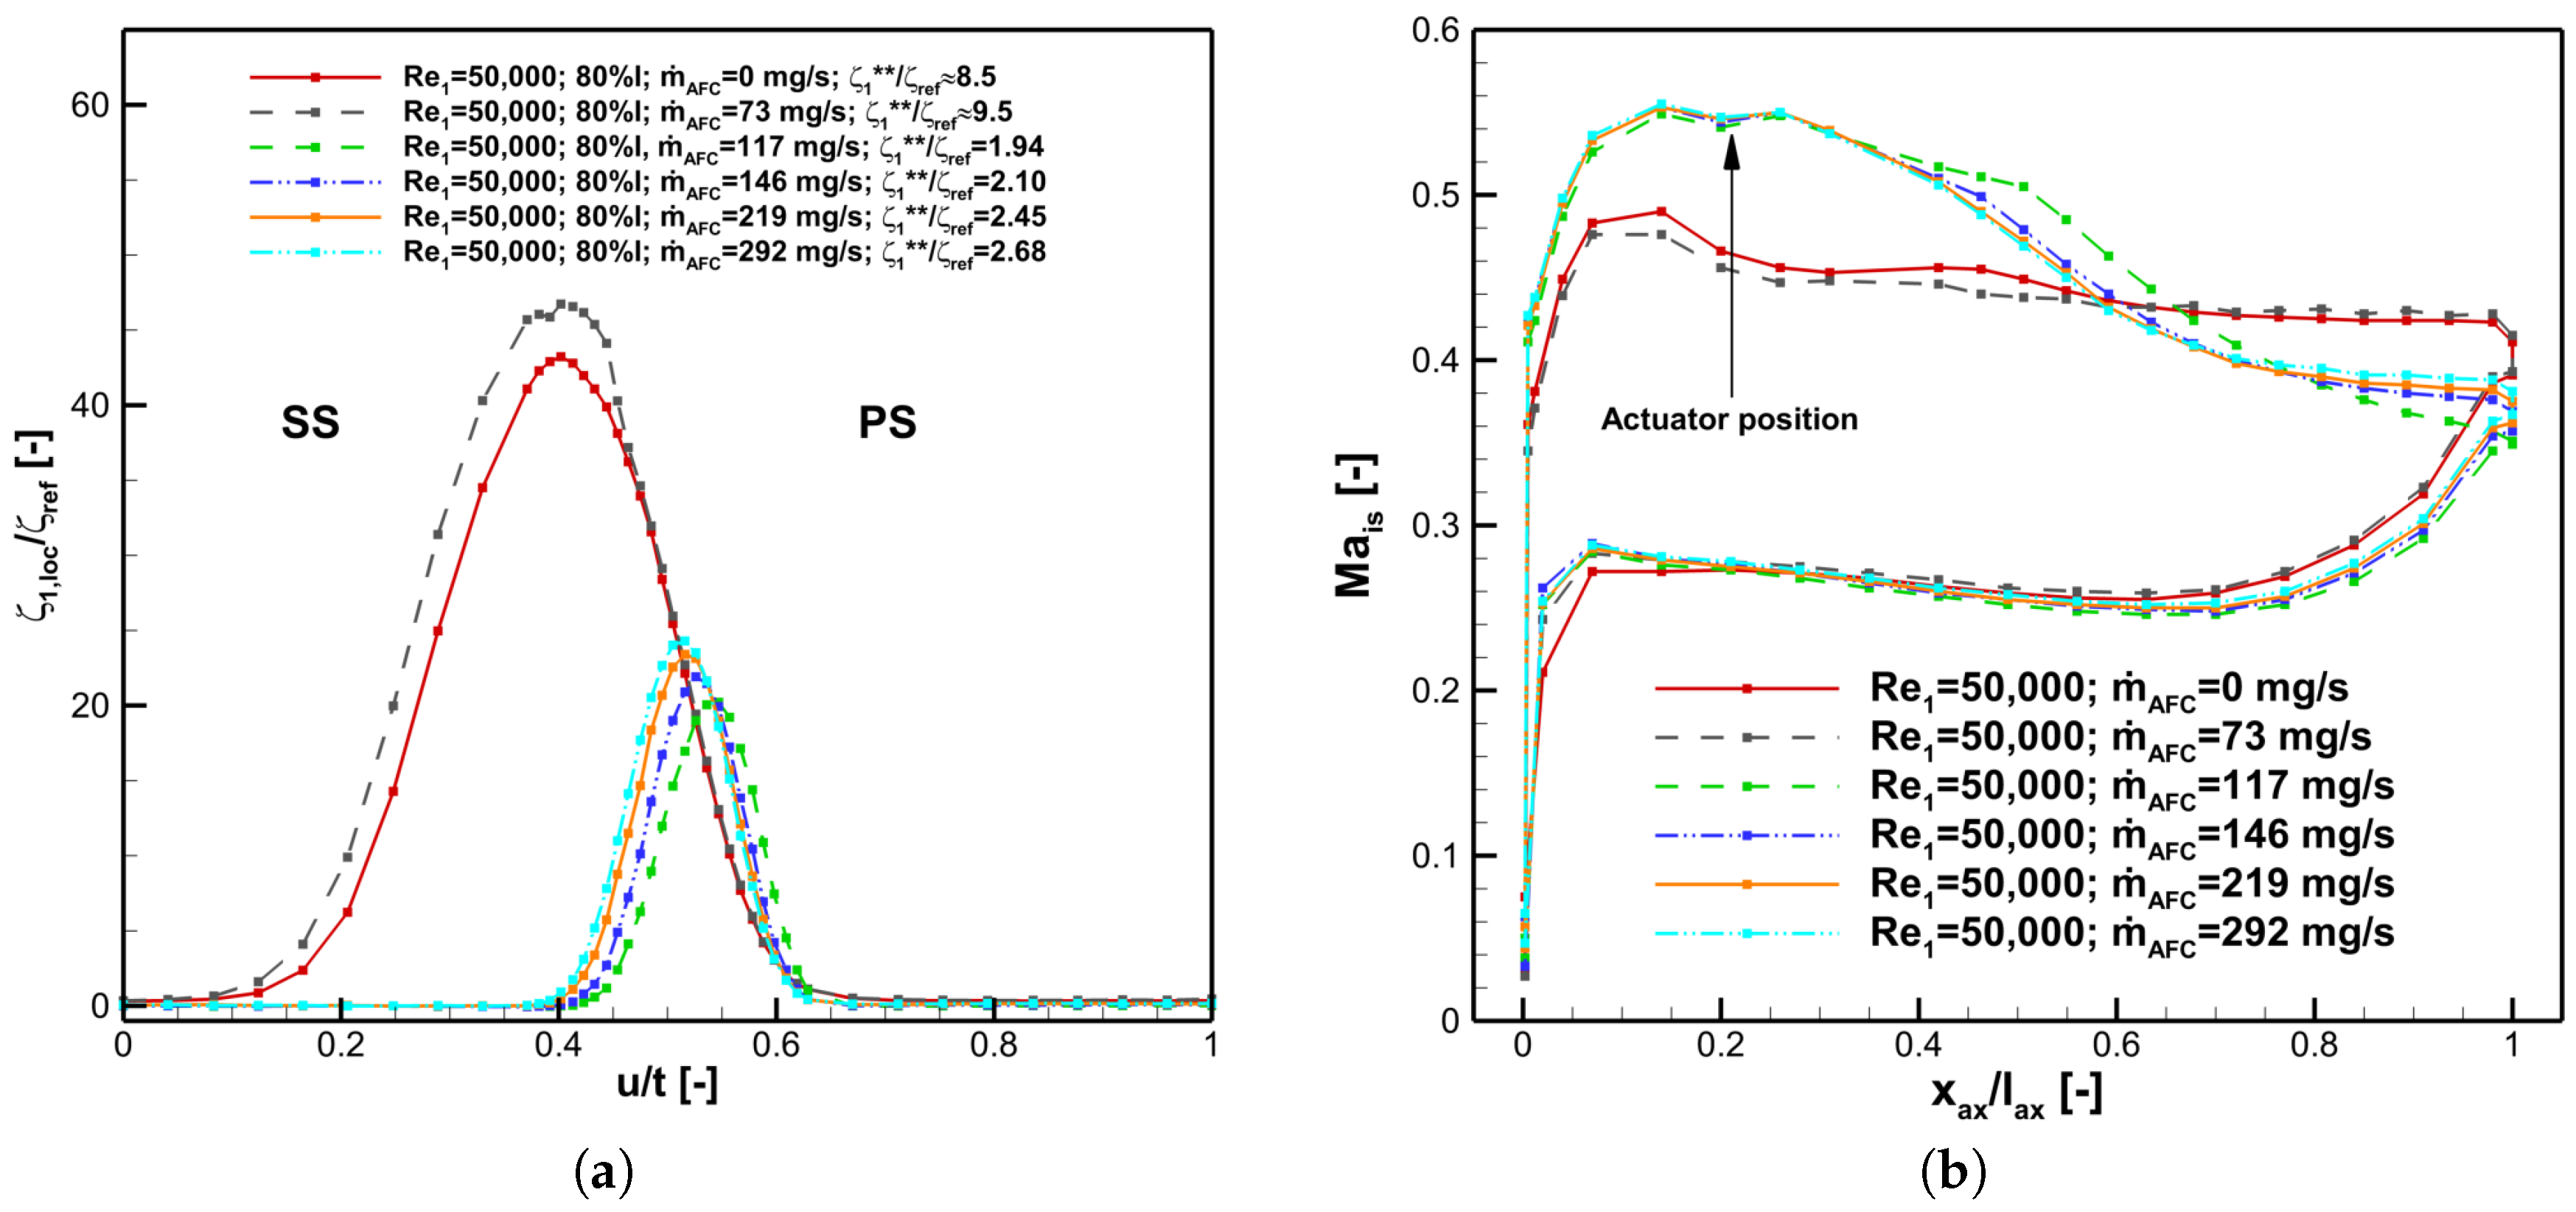
The optimal mass flow rate for each operating point was determined experimentally. Therefore, the resolution is limited as only discrete mass flow rates could be tested. Selection criterion for the optimal mass flow rate was the minimum corresponding total pressure loss. The effect of AFC on the total pressure losses and the profile Mach number distribution is exemplary shown for
= 50,000 in
Figure 4.
Without actuation and with a mass flow rate of
mg/s the Mach number distribution looks completely different than with higher mass flows. This indicates an open flow separation without reattachment. The impact on the whole flow behaviour around the profile is very strong as shown by
Figure 4b. The peak Mach number on the suction side is considerably smaller and the Mach number at the trailing edge is much higher. That means the profile is not able to decelerate the flow as much as it was supposed to.
The referenced integral total pressure losses are also given in the left part of
Figure 4. For this operating point a mass flow rate of
mg/s is associated with the smallest total pressure losses. The corresponding mass flow ratio is
and the local pressure ratio is
. Without active flow control, the losses are more than four times higher than in the case with optimal actuation mass flow. This is an impressive result and demonstrates the usefulness of the boundary layer control by this type of fluidic oscillator. As can be seen in
Figure 4a at a mass flow rate of
mg/s the measured total pressure losses are even higher than without actuation. Regarding the measured total pressure losses as a result of the profile boundary layer development, the increase in total pressure losses can be explained by a slightly thicker boundary layer on the suction side due to a negative effect of the additional mass flow from the actuator. However, this disturbance of the boundary layer by the actuators is not sufficient to initiate boundary layer transition and the associated reattachment of the flow on the suction side.
Increasing the mass flow rate above
mg/s leads to higher total pressure losses. Yet, these losses are considerably lower than the losses of the two fully separated cases with and without
mg/s mass flow rate. The data indicate that the optimal actuation flow rate is the smallest actuation flow rate which is able to initiate boundary layer transition and leads to reattachment of the flow on the suction side for operating points with small Reynolds numbers and open flow separation. For this profile, smaller losses can occur with a small separation bubble on the suction side compared to a case without separation bubble but earlier transition. By design intent, the displacement effect of the separation bubble can shift the diffusion of the flow towards the trailing edge. Ludewig et al. [
19] also reported for steady blowing on a low pressure turbine profile that minimum total pressure losses occur with a small separation bubble on the suction side.
The profile Mach number distribution in the right part of
Figure 4 shows that with the optimal mass flow rate of
mg/s, the smallest Mach number at the trailing edge is measured. This is confirmed by the data from the wake traverse. For the optimal mass flow rate, the smallest outlet Mach number and the highest flow turning was computed with the measurement data in the outlet plane.
4.3. Actuation Frequency
In former publications e.g., by Mack et al. [
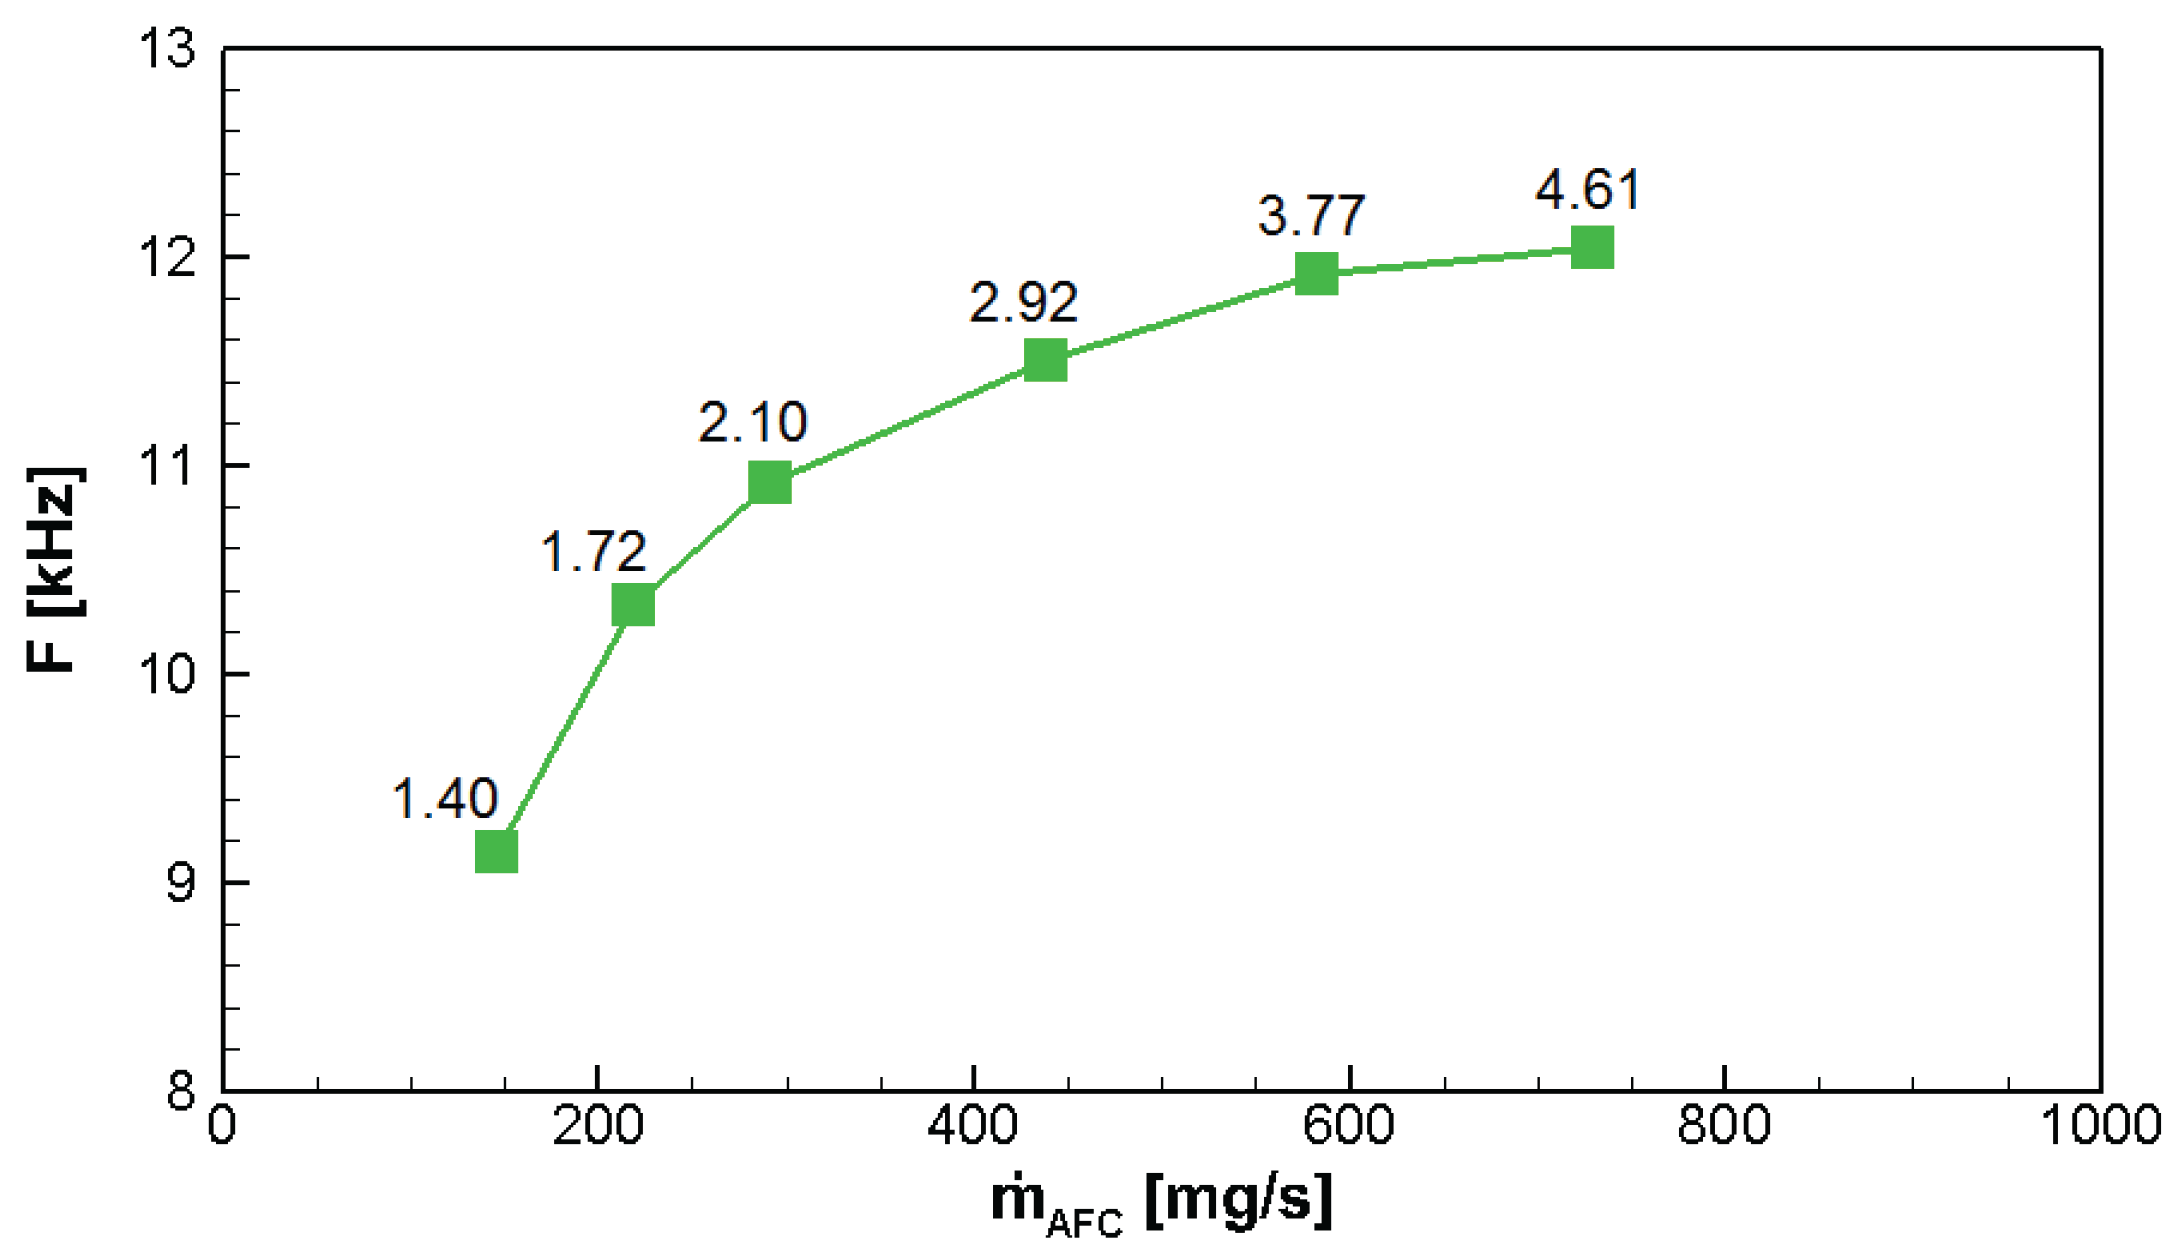
10] it was also stated that the frequency of the oscillation plays a major role for the effectiveness of the actuation. Therefore, the frequencies belonging to the different mass flow rates were measured here with a single-sensor hot wire probe. The results from these measurements are presented in
Figure 5 for
= 50,000. Furthermore, the corresponding pressure ratio
of the oscillator is shown directly next to every data point in
Figure 5.
The lowest frequency shown in
Figure 5 was measured for a mass flow rate of
mg/s. For a mass flow rate of
mg/s no stable oscillation frequency could be detected. Unfortunately, no measurement data for the optimal mass flow rate of
mg/s is available yet, as the frequencies were measured before the optimal mass flow rate was determined.
Niehuis and Mack [
4] reported that the amplification of Tollmien-Schlichting waves could be beneficial as this would accelerate the transition process. Therefore, a CFD study was conducted with MISES to determine the boundary layer data at the location of the fluidic actuators. More information on the CFD data and the utilized setup can be found in Kurz et al. [
20]. With the numerical data, a stability analysis using the Orr-Sommerfeld equations as shown by Mack et al. [
10] can be conducted. This leads to actuation frequencies at the blowing position between
kHz and
kHz with an optimum at approximately
kHz. These frequencies were not reached by the fluidic oscillators applied here. However, active flow control by these fluidic oscillators was successful as stated by the reduced total pressure losses. As reported by Kurz et al. [
20], the most amplified instability frequencies according to linear stability theory decrease significantly towards the separation point. At the separation point of the operating conditions of
= 50,000, the optimal instability frequency was calculated as
kHz. As a consequence, the range of the amplified instability frequencies is met by the actuator close to the separation point, if the actuator frequencies are not completely damped by the main flow. Furthermore, the current experiments suggest that the actuation mass flow is an important criterion for effective flow control. Therefore, more experimental data with independent variation of mass flow and frequency is desirable and needed to determine more precise criteria for AFC concepts by pulsed blowing.
4.4. Boundary Layer Development on the Suction Surface
In order to gain more information on the influence of active flow control on the aerodynamics of the TEC-profile, measurements with a flattened Pitot probe were conducted. As the suction side aerodynamics are essential for the losses, the boundary layer measurements are constrained to the suction side of the profile.
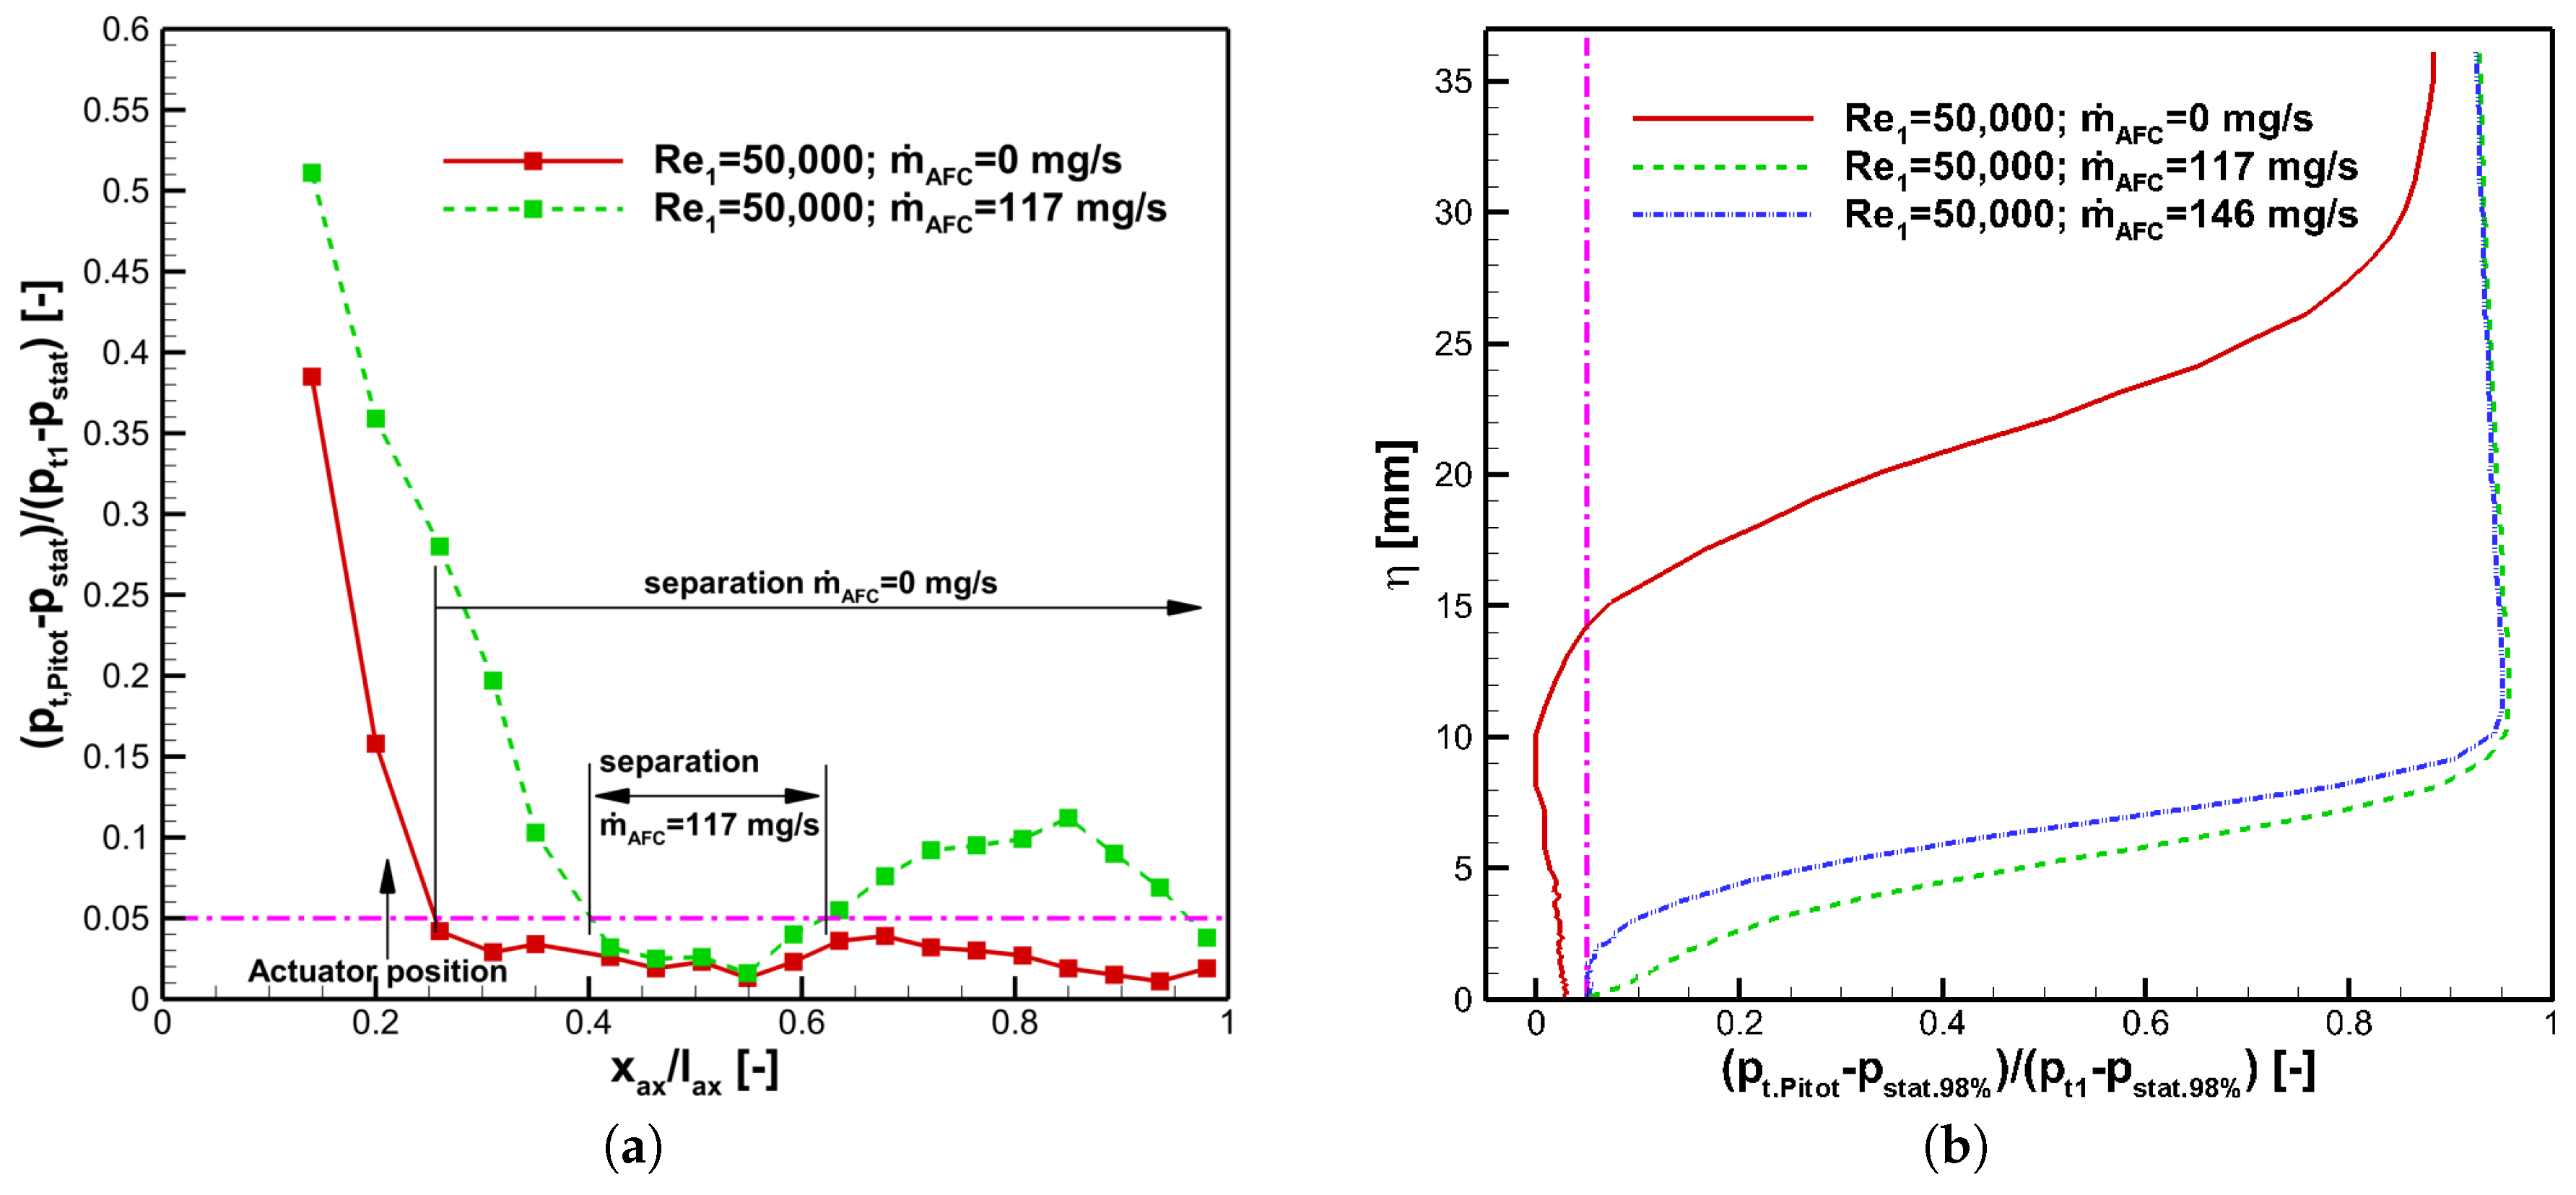
In
Figure 6 a dynamic pressure ratio according to the definition
is shown. In Equation (
5)
is defined as total pressure measured with the flattened Pitot probe at the position
with the distance
to the profile surface. The total inlet pressure
is measured at the same instant of time. The local surface pressure on the suction side
at the position
is measured with the static pressure taps, but with the flattened Pitot probe moved to a position where it does not affect the profile pressure distribution. During the measurements of the surface pressure ratio, the distance to the profile surface
is geometrically half of the probe head height of the flattened Pitot probe as the probe head is supposed to lie flat on the suction side surface:
mm.
For the measurement of the boundary layer with the flattened Pitot probe, the same dynamic pressure ratio is utilized. The static surface pressure is in this case the static pressure at the position of the boundary layer traverse. This means it is the static surface pressure at .
In separation bubbles, the dynamic pressure ratio
ought to be zero or at least close to zero as the reverse flow occurring in separation bubbles is not supposed to be measured by the flattened Pitot probe. Due to vortex structures in the bubble as well as the distance between the stream line through the Pitot probe head and the suction side surface, the actually measured dynamic pressure ratios are normally slightly bigger than zero especially when the separation bubbles are thin. This was also confirmed by Stotz et al. [
14] who compared constant temperature anemometry (CTA) boundary layer measurements to this measurement technique. In the current measurements, due to the comparison with the Mach number distribution, a pressure ratio below
is regarded as close enough to zero to represent a separation zone. The limit is shown in
Figure 6a as a pink dash dot line.
The dynamic pressure ratios shown in
Figure 6a start at
which was the first static pressure tap that could be reached with the flattened Pitot probe. Without active flow control, the dynamic pressure ratio decreases from the first measurement position with a steep gradient. For a laminar boundary layer with a Blasius profile this means that the boundary layer thickness is increasing. The pressure ratio reaches a very small value below
at
and does not rise above this value for all following measurement points on the suction side. Hence, there is separation on the suction side which does not reattach before the trailing edge of the profile. This is also called an open flow separation on the suction side.
With active flow control at the optimal mass flow rate of
mg/s the dynamic pressure ratio also decreases below the separation line at approximately at
. However, a short separation region is followed by a rise of the dynamic pressure ratio above the separation line which is an indication for boundary layer transition from laminar to turbulent. Schlichting [
21] stated by experiments on a flat plate without separation that due to the change in the boundary layer profile between a laminar and a turbulent boundary layer profile, a Pitot probe which is moved parallel to a wall with a fixed distance will measure a total pressure increase in the transition zone.
Using the pressure increase as selection criterion, the transition zone can be located in the region from about
to
of the axial chord length for the case with active flow control. Towards the trailing edge, the pressure ratio decreases. Thus, the boundary layer thickness is increasing towards the trailing edge. The last measurement point is even below the pressure ratio separation limit of
which could be an indication for turbulent flow separation. However, the boundary layer profile measurements in
Figure 6b for this mass flow rate show a pressure gradient directly at the suction surface which supports the assertion that the boundary layer is attached to the suction surface. In separated flows the pressure gradient measured with the flattened Pitot probe is supposed to be zero or close to zero as for example shown by the red curve without AFC in
Figure 6b.
Comparing the boundary layer measurements perpendicular to the suction surface at
of the axial chord length which are shown in the right part of
Figure 6, there is a considerable difference between the cases with and without active flow control. Without active flow control the pressure ratio stays close to zero for approximately
mm perpendicular to the surface. From this it can be concluded that there is a thick layer on the suction side surface where no flow parallel to the profile suction surface in flow direction can be observed. This flow phenomenon is typical for separation bubbles. For both actuated cases the boundary layers are remarkably thinner. The optimal mass flow rate of
mg/s has a slightly thinner boundary layer than the higher mass flow rate. This coincides with the total pressure losses which are also lowest for the mass flow rate of
mg/s. As the boundary layer measurements and the wake traverses were all conducted at the same positions, the results can be directly compared to each other. For the cases without and with AFC an approximately three times higher boundary layer thickness on the suction side leads to an approximately two times wider wake (see
Figure 4, left). The main difference of the wake can be localized on the suction side part of the wake. Regarding the boundary layer, development especially on the suction side of the profile as reported by Curtis et al. [
1] as the main contributor to the total pressure losses represented by the wake, the results match very well.
4.5. Reynolds Number Variation
After the detailed discussion of the benefit of active flow control in the low Reynolds number range, it is worth taking a look at the full operating range.
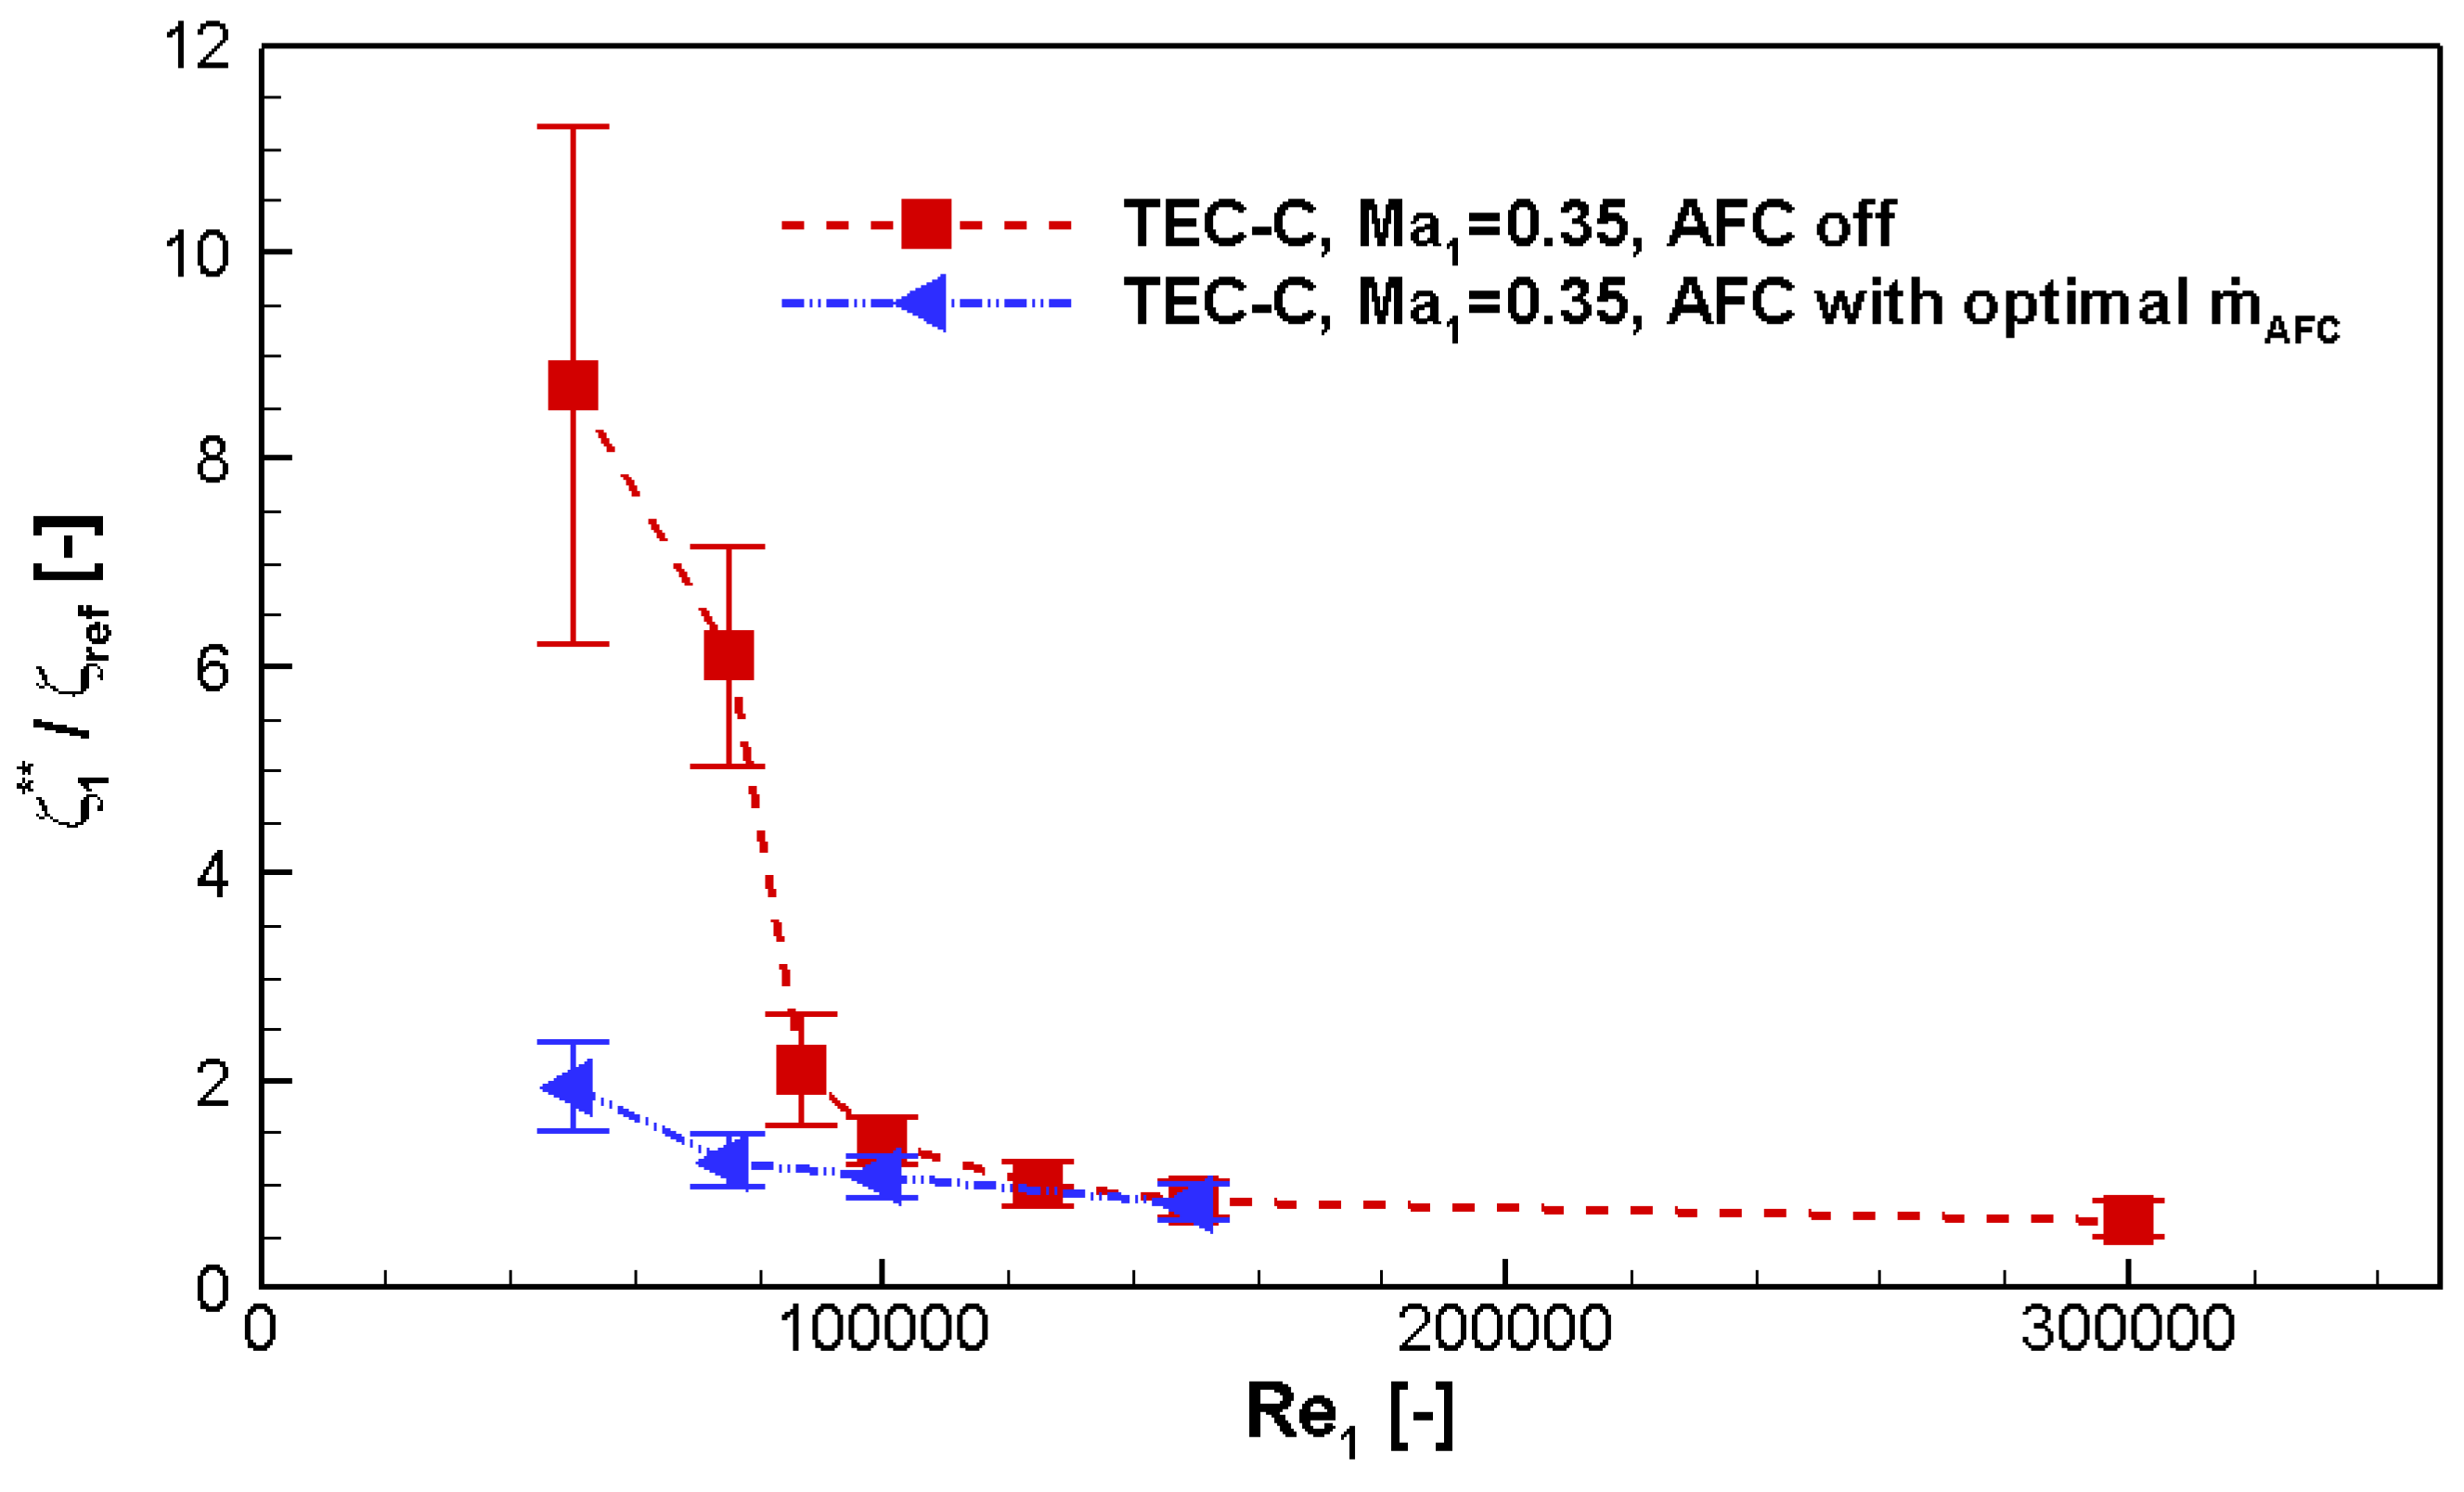
Figure 7 shows the normalized and corrected integral total pressure loss as it is defined in Equation (
4) for different Reynolds numbers.
The data which is labeled as “AFC off” was measured with the same measurement setup, but without actuation mass flow. The measurement data “AFC with optimal ” was gained as described before by using for each Reynolds number the data with the lowest integral total pressure losses which were tested in the current experiments. For = 300,000 there is no measurement value as every mass flow rate which was tested produced higher total pressure losses than the case without active flow control.
The measurement data for the integral total pressure loss in
Figure 7 show that losses can be reduced by active flow control over the major part of the operating range of the TEC profile. For the low Reynolds number range the loss reduction is very significant as open flow separation could be prevented successfully. Nevertheless, active flow control also reduces the integral total pressure losses when there are only small separation bubbles present on the suction side for Reynolds numbers above
87,000.
