Article

Evaporation Modeling of Water Droplets in a Transonic Compressor Cascade under Fogging Conditions †

1
Institute of Aerospace Thermodynamics, University of Stuttgart, 70569 Stuttgart, Germany
2
Laboratory of Turbomachinery, Helmut Schmidt University, 22043 Hamburg, Germany
*
Author to whom correspondence should be addressed.
This paper is an extended version of our paper published in Proceedings of the European Turbomachinery Conference, ETC’13, 2019, Paper No. 136.
Int. J. Turbomach. Propuls. Power 2020, 5(1), 5; https://doi.org/10.3390/ijtpp5010005
Submission received: 20 December 2019 / Revised: 6 February 2020 / Accepted: 14 February 2020 / Published: 19 February 2020

Abstract

:
High-fogging is widely used to rapidly increase the power outputs of stationary gas turbines. Therefore, water droplets are injected into the inflow air, and a considerable number enter the compressor. Within this paper, the primary process of droplet evaporation is investigated closely. A short discussion about the influential parameters ascribes a major significance to the slip velocity between ambient gas flow and droplets. Hence, experimental results from a transonic compressor cascade are shown to evaluate the conditions in real high-fogging applications. The measured parameter range is used for direct numerical simulations to extract evaporation rates depending on inflow conditions and relative humidity of the air flow. Finally, an applicable correlation for the Sherwood number in the form of S h ( R e 1 / 2 S c 1 / 3 ) is suggested.

1. Introduction

1.1. Motivation

Water injection into the compressor of stationary gas turbines, also called high-fogging, is an effective and widely used procedure to increase the power output rapidly. It is, for example, used to overcome fluctuations in the power grid. In the past, the authors extensively investigated the interaction between droplets and blades in the compressor cascade, both experimentally and numerically. Several publications emphasize the applicability of the derived interaction models ([1,2,3]). However, the evaporation of droplets within the processes has been neglected due to the very short timescales of the regarded cases of just one compressor stage. Nevertheless, evaporation of injected droplets into the main flow is the primary process in high-fogging applications if one considers the full compressor with all stages, and therefore, needs to be investigated and modeled accurately. Difficulties in developing such a model for this context arise from the complexity of the process and the diverse influencing quantities. The evaporation depends on droplet characteristics and on flow conditions. Kolaitis and Founti [4] mentioned the importance of the slip velocity especially. This will also be one focus of the current paper, as strong velocity gradients occur within the cascade. Although many empirical correlations to predict the evaporation of droplets already exist, e.g., [5,6,7], their validity for the current application has yet to be proven.

1.2. Aim of the Work

The main goal of this paper is to outline the prevailing range of the influencing parameters experimentally and to introduce a Lagrangian model which reproduces the phenomena of droplet evaporation accurately in the given parameter range. Evaporation of droplets in general depends on various factors: First of all, on the droplet characteristics themselves, such as diameter, shape or deformation, temperature, and material properties of the liquid. Furthermore, the flow conditions, which the droplets experience, are important. Here, relative velocity, turbulence, gas temperature, and relative humidity of the air flow have to be named. To ensure the applicability of the model, the parameter range needs to match the conditions in high-fogging applications. Therefore, measurements in a transonic compressor cascade at the Laboratory of Turbomachinery were carried out. Within this investigation, the evaporation of water droplets inside the grid of a compressor of a stationary gas turbine are evaluated numerically. Regarding this application, liquid and gas temperatures are within a rather small range, and therefore of secondary interest. Instead, droplet diameters and the relative velocity between droplets and ambient gas flow are the most variable quantities, and hence of major importance. This is for two reasons: On the one hand, small droplets evaporate faster than larger droplets due to a smaller volume to surface ratio, which is equivalent to a smaller Sauter mean diameter D 32 . On the other hand, the droplet size strongly effects the relaxation behavior, and with it, the occurring relative velocities between liquid and gas. Kolaitis and Founti [4] mentioned the importance of the slip velocity, which can also be seen in various correlations for the Sherwood number ( S h ) in the form of S h = A + B R e c S c d , as the Reynolds number ( R e D ) is directly proportional to the slip velocity. A, B, c, and d are empirical constants. Especially, the knowledge of the maximum relative velocities is important, as with higher velocities, the concentration boundary layer thickness δ X around the droplet is smaller, and therefore, the vapor mass flow is increased. Another focus of this paper is on the influence of the relative humidity of the air flow, as it effects the evaporation rate directly and strongly. Hence, all simulations will be conducted with dry and partially saturated ambient gas flow.

2. Methods and Results

2.1. Experimental Setup

After presenting the test rig’s structure and the undertaken measurement campaign briefly, limits of slip velocity are examined. Nine blades shaped similar to compressors’ outer cross-sections were mounted within a cascade as shown in Figure 1 with notable cross-section parameters as listed in Table 1. The flow field is similar to the one found in the tip region of gas turbine axial compressor stages. It is believed that this region, where velocity is highest throughout the stage, would contain maximum values of slip velocity, and therefore, represents a limiting case in terms of slip velocity for an evaporation model. Previous studies showed a nearly undisturbed flow around the center blades regarding the lower and upper test section walls. Hence, all measurements are conducted along the passage between the fifth and the sixth blade counting from the lower wall. The accompanied wind tunnel is supplied with outside air by a radial compressor whose excess air may be bypassed to adjust the mass flow precisely. The settling chamber is a boiler-shaped cylinder, 1.6 m in diameter. Several sieves equalize the flow before it is accelerated through a nozzle to enter the test section. Afterwards, the outlet air is purged in a water-separator before it is discharged through the chimney. The cascade section itself may be rotated around the fifth blades’ leading edge to set the angle of incidence α . Further details of the test rig can be found in [8].
One data set, at incidence α = 4°, was measured at half span. During that, droplet mass fraction was set to ξ m = 1% while the inlet Mach number and relative back pressure were kept constant at design conditions of M a 1 = 0.89 and Δ p back = 0 Pa, respectively. This was monitored using six pressure taps and the phase-Doppler system. The optical measurement setup used was identical to that presented in [9], and thus, the reader is referred to this publication for more detailed information.
Demineralised water is sprayed into the settling chamber via a manifold of ten impingement nozzles (PJ10, BETE Germany GmbH) generating a spray with a Sauter mean diameter of D 32 = 32.0 µm and a mean diameter of D 10 = 4.0 µm at the cascade’s entrance. The latter value can be thought of the spray’s lower 10% mass division. The spray characteristics are measured directly in front of the compressor grid. Eventually, the spray equals those utilized in industrial high-fogging applications as shown in Figure 2 [2].
As can be seen in Figure 1, a total of 1000 data points were evenly distributed and recorded over the passage. Based on that, velocity mean vector and droplet diameters were extracted at each point.

2.2. Experimental Results

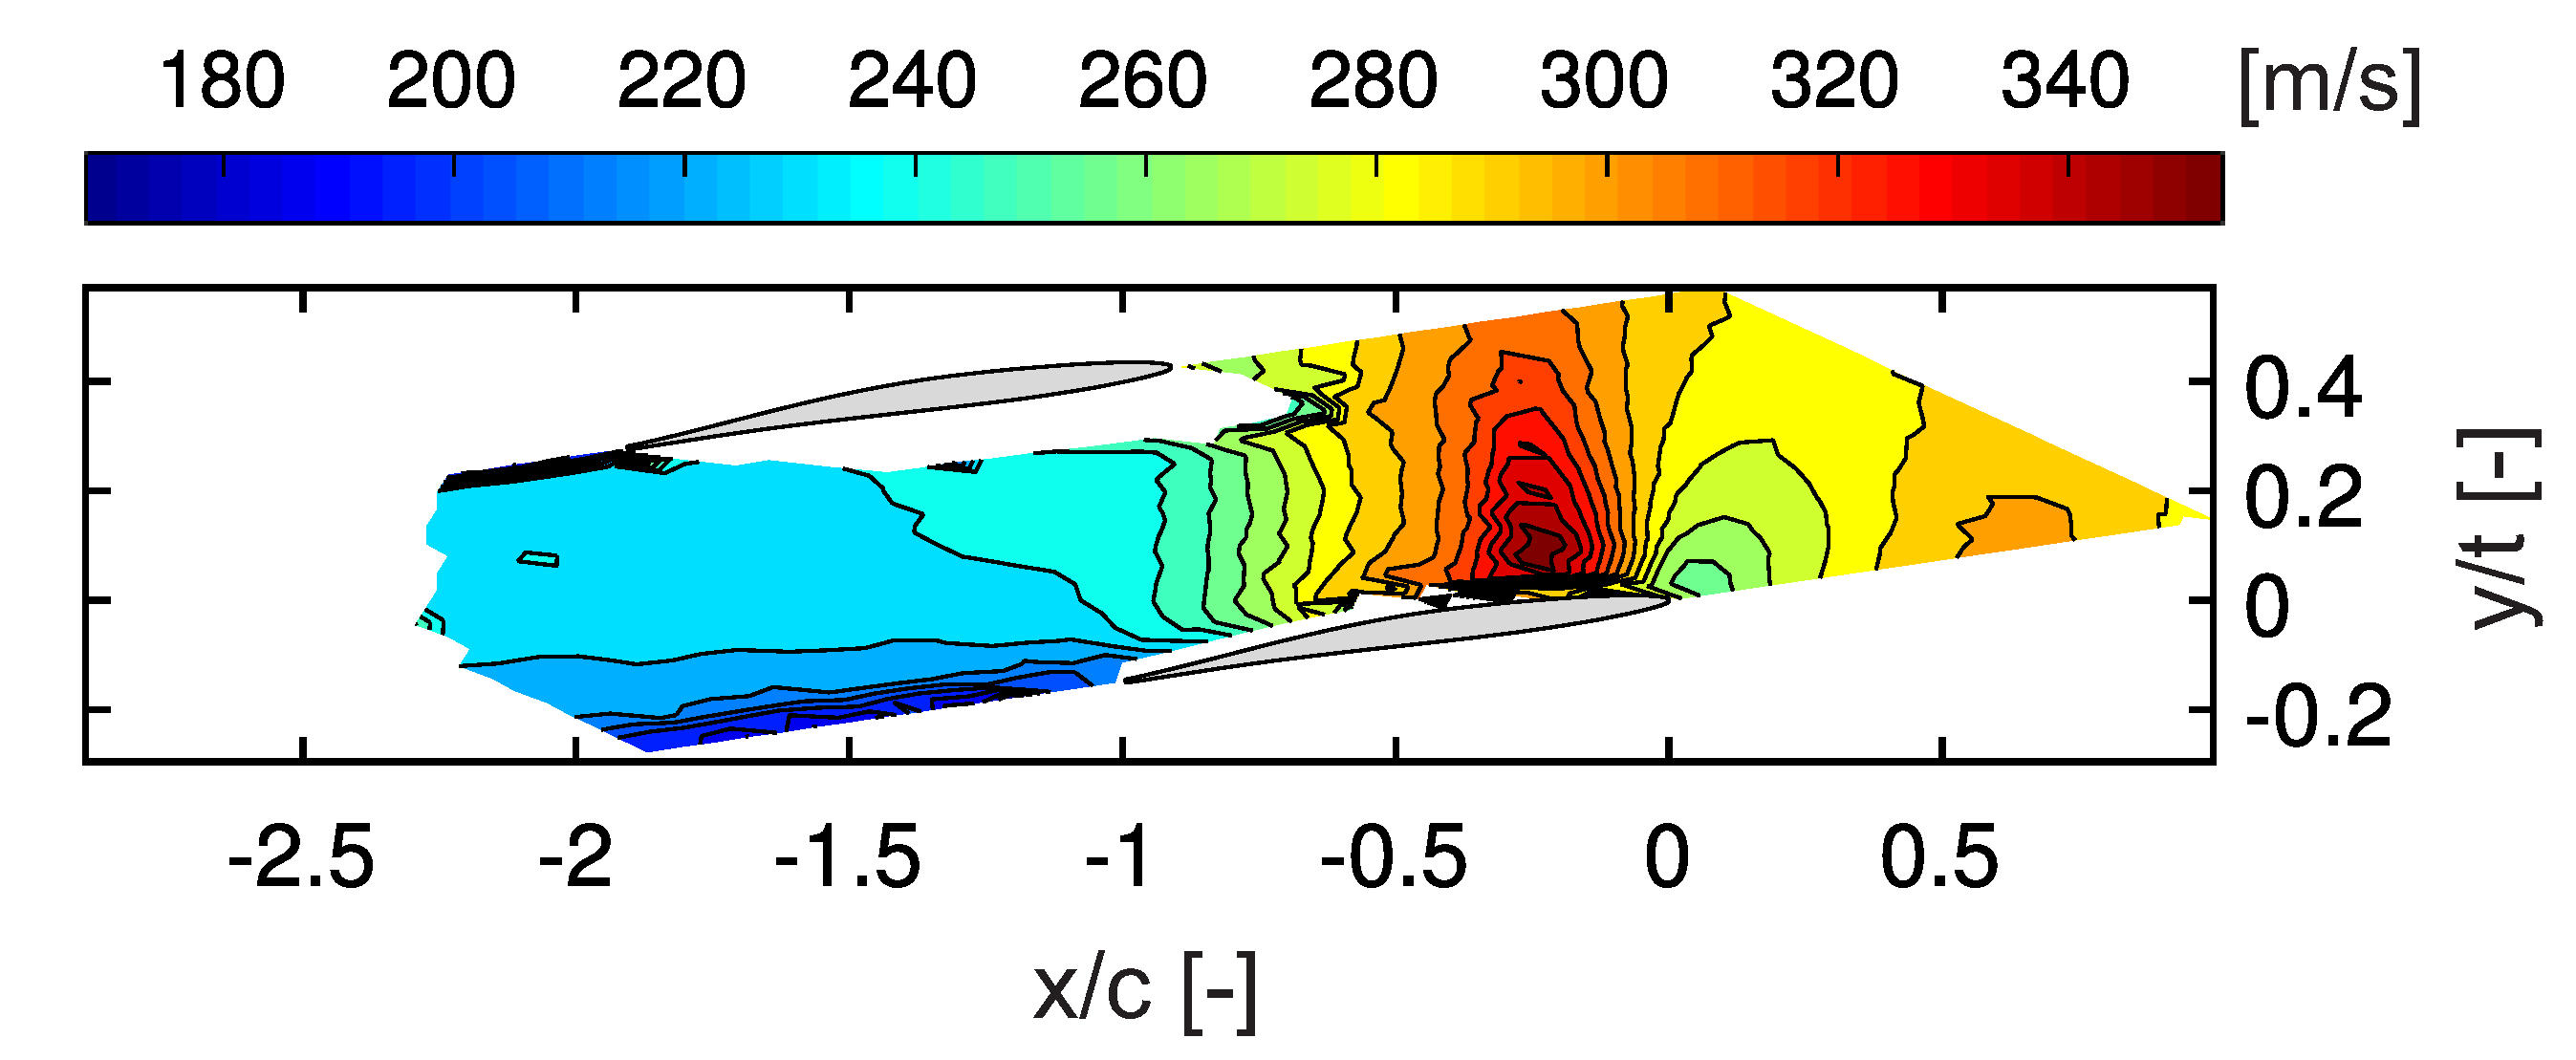
The corresponding flow field velocity magnitudes are shown in Figure 3. Due to the chosen laser configuration, not all channels delivered valid signals at all positions, because at least one beam was blocked by the measurement blade or its neighbors. As a result, the boundary layers around the blades were not fully resolved. Furthermore, the third component was missing along a vast region in front of the upper neighbor. To fully document the test case, Table 1 contains the gas temperature T gas and the relative humidity φ taken from the settling chamber, the water temperature T liquid from the water pump, and the turbulent intensity T u measured along the inlet line of the measurement region.
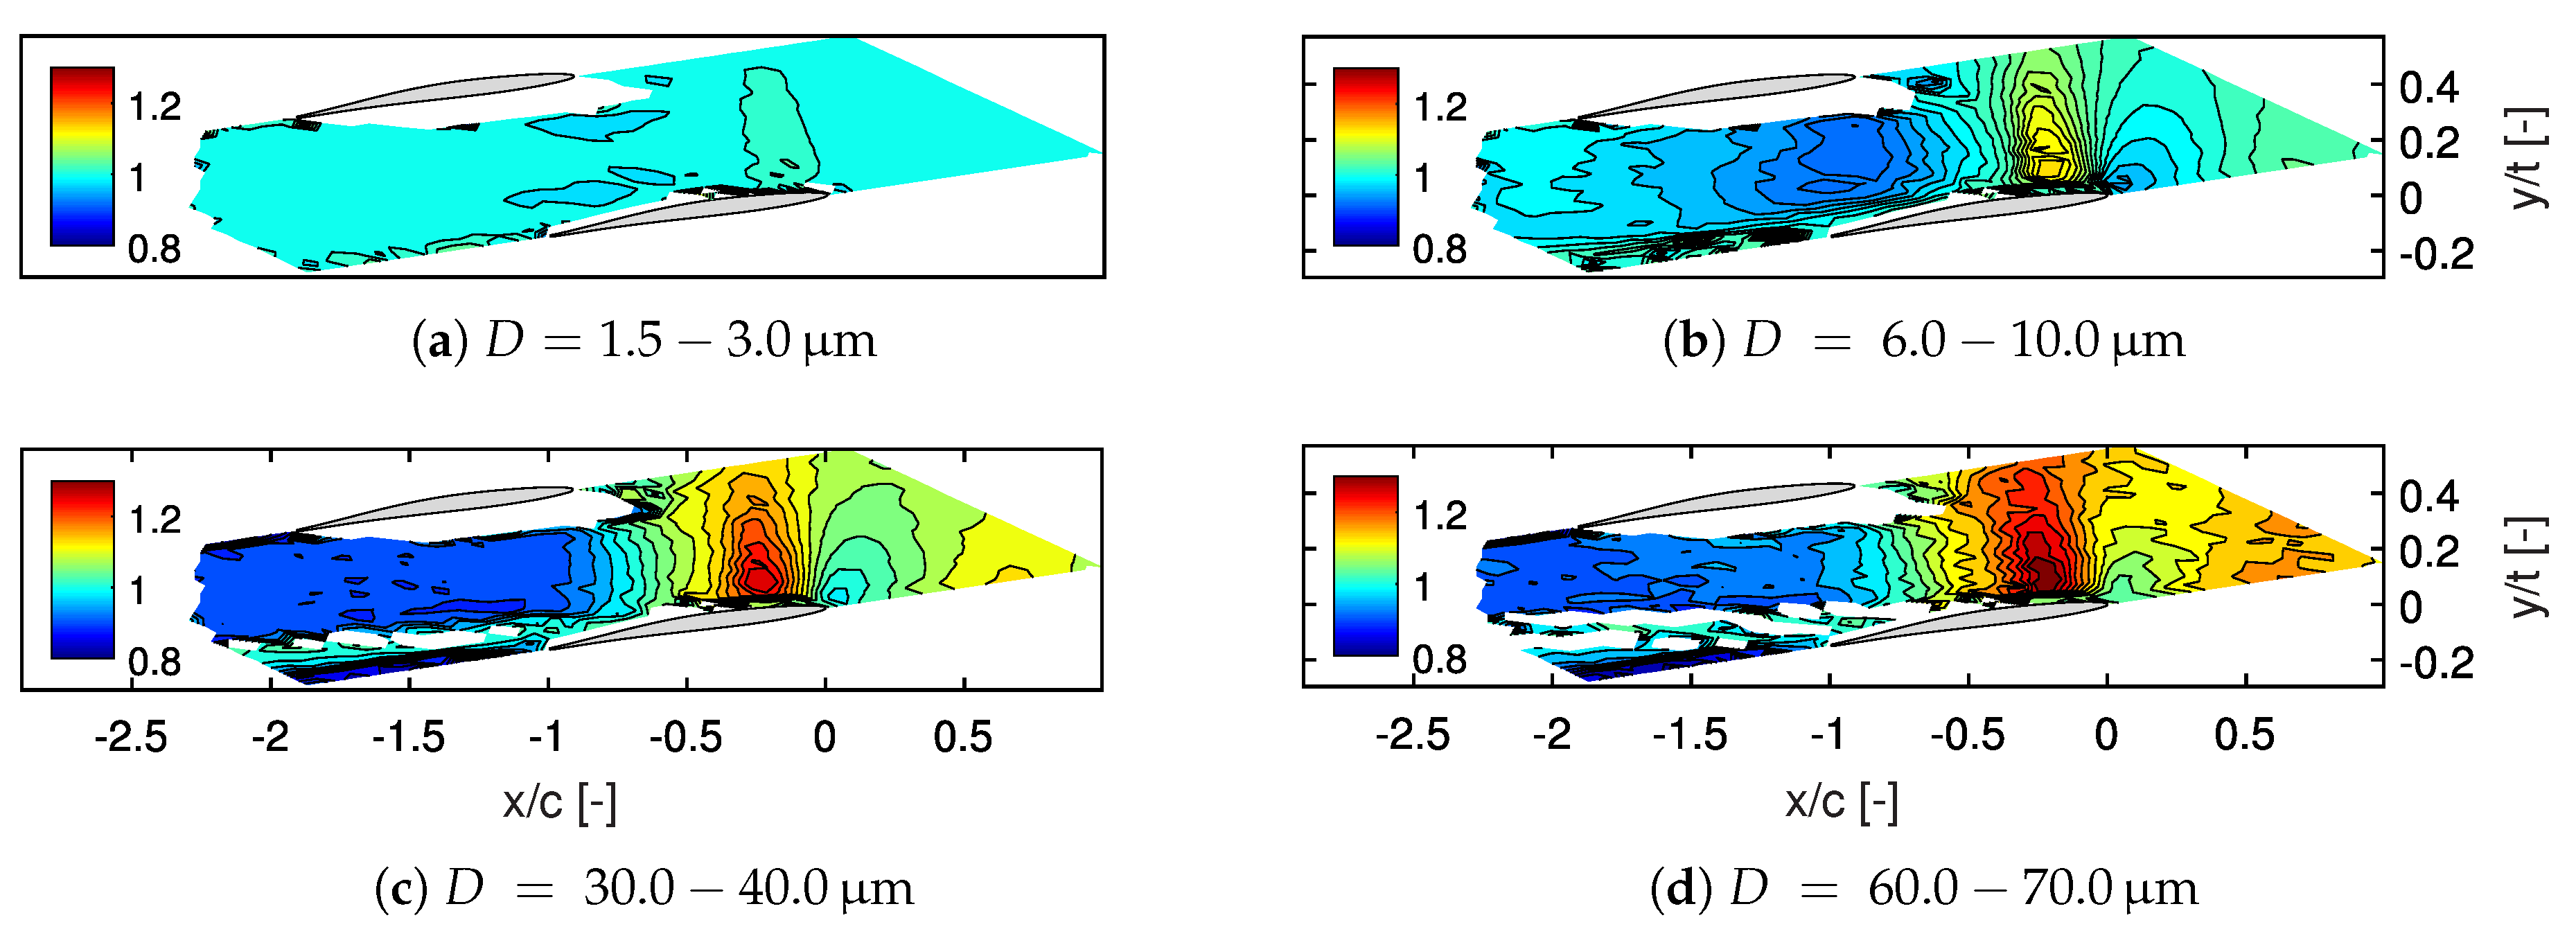
The slip velocity can be expressed by the slip ratio
S = v gas v liquid
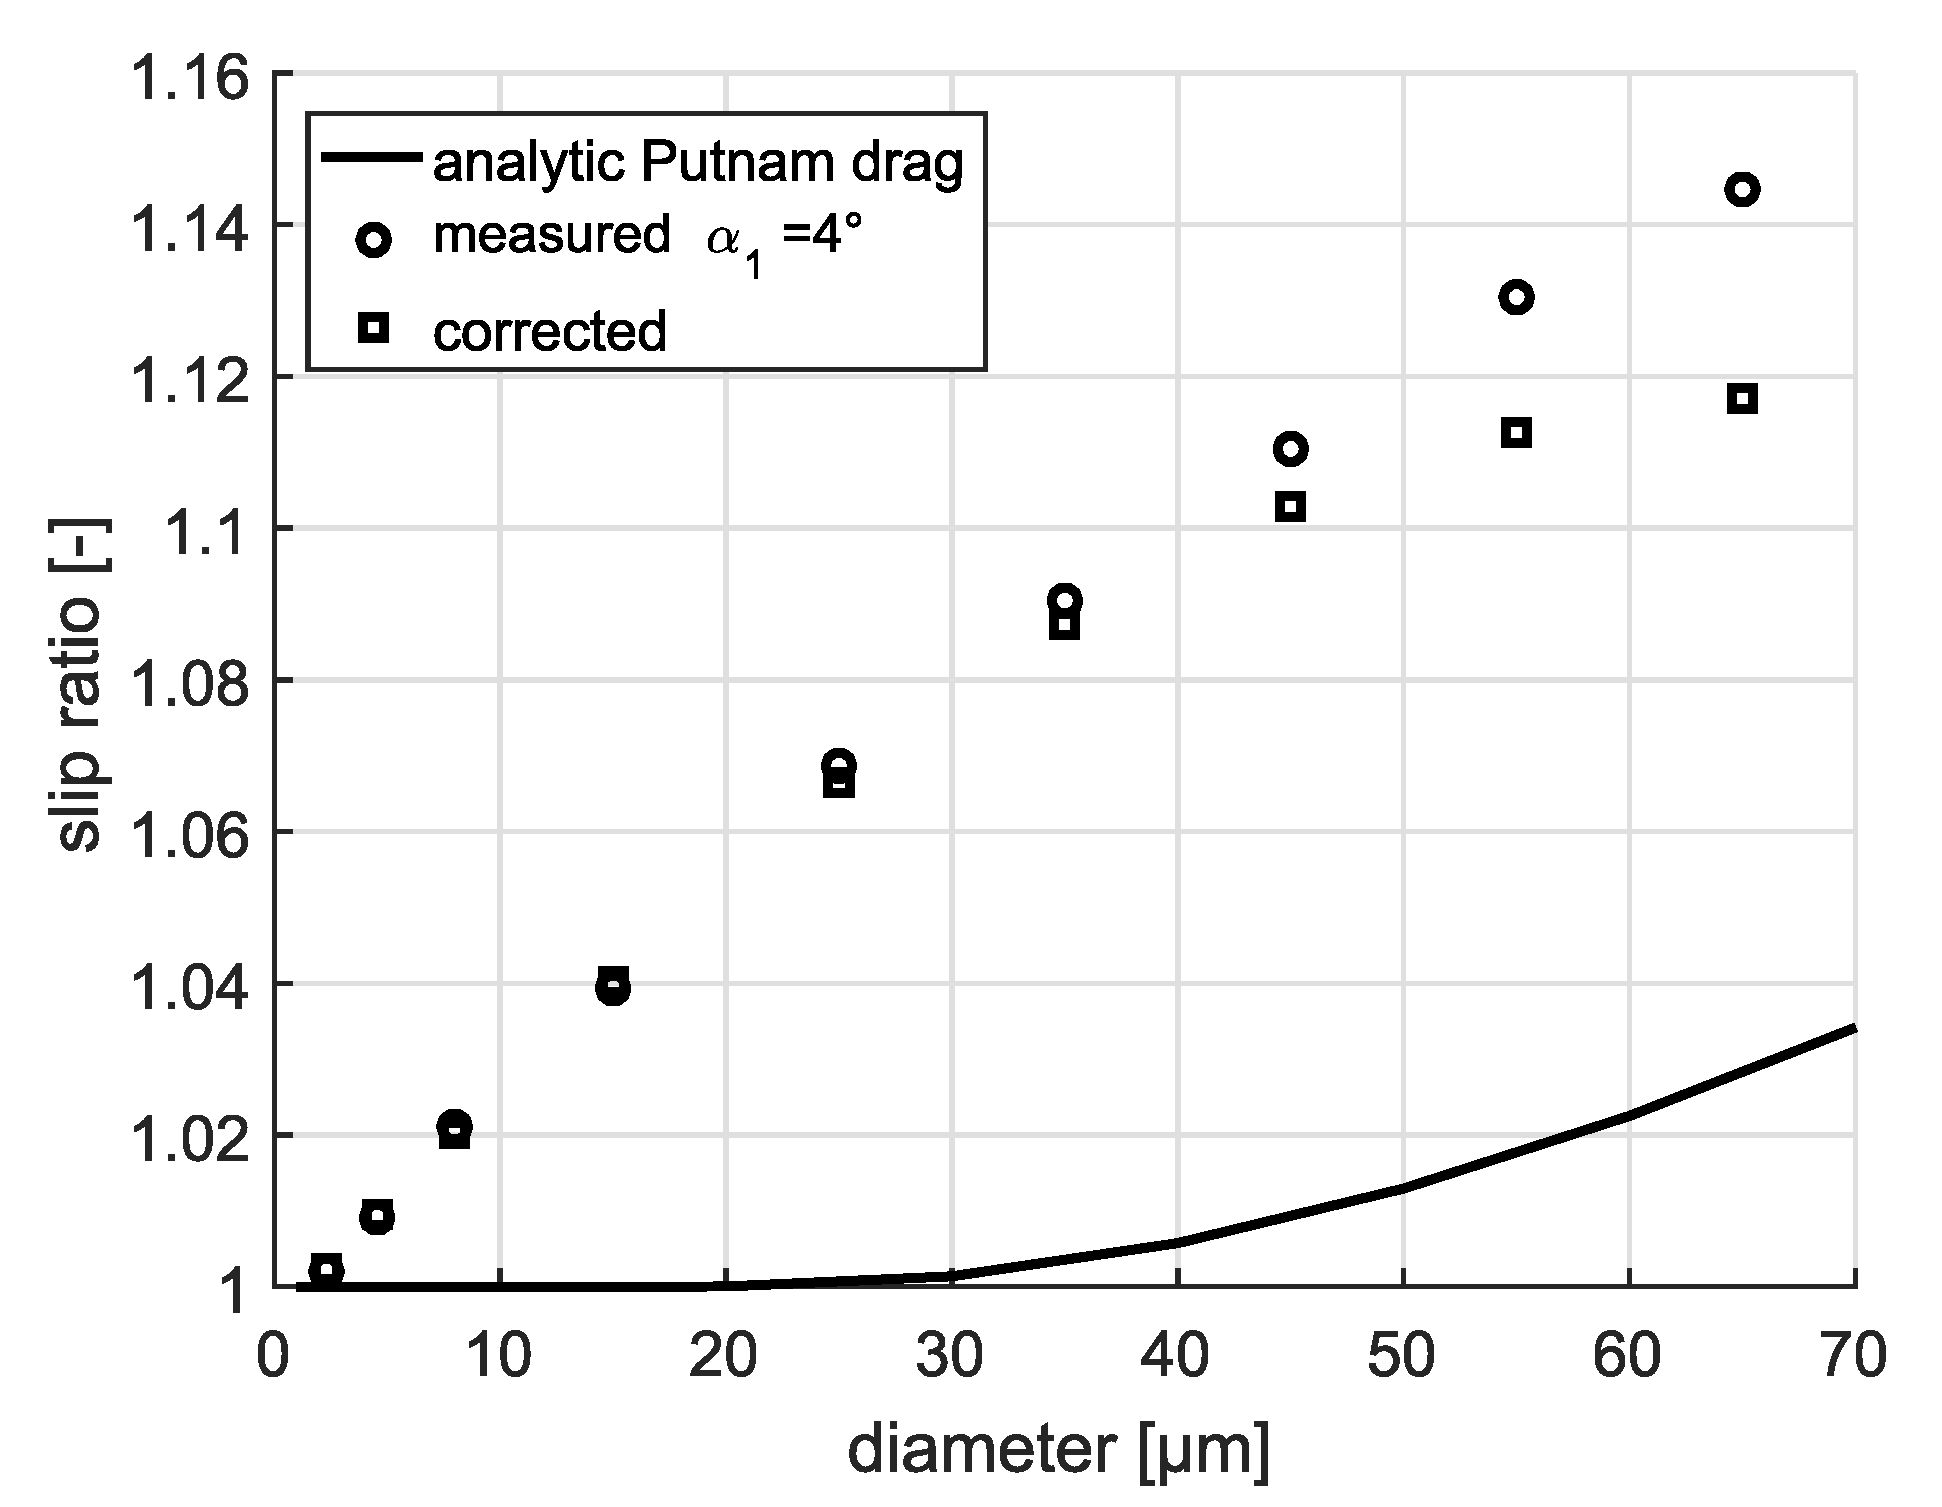
as a normalized measure to better spot regions of high velocity differences for various diameter classes, as shown in Figure 4a–d. At first glance, an increased number of blank values is evident in the wake region of the blade for larger droplets. Their following behavior prevents them from entering that region, which decreases data significantly. For values of S > 1.0 the liquid phase lacks velocity compared to the gas phase, indicating regions of gas acceleration. In contrast, values of S < 1.0 indicate gas deceleration. As expected, due to their increased inertia, larger droplets exhibit larger slip velocities. For the cascade at hand, maximum slip ratios are observed in the accelerating region ( 0.0 > x / c > 0.5 ), whereas the lowest slip ratios are observed in the deceleration region after the passage ( 1.5 > x / c > 2.0 ). Smallest droplets follow the flow easily, exhibiting almost no slip in Figure 4a, and slip ranges up to more than 20% in the acceleration region for the largest droplets within the spectrum in Figure 4d. Similarly, droplets from the largest diameter class are about 15% faster in the blades’ aft region. However, the droplets enter the cascade with a certain pre-slip, because they are injected into the settling chamber and need to be accelerated in the nozzle before they reach the plane cascade. This becomes evident in the contour plots of the largest class where slip ratio is high in front of the cascade, although the gas flow is still at the stated inlet conditions. This relaxation effect is considered by calculating the distance it takes for each droplet class to be fully relaxed, starting from a quiescent droplet. For this, the Bernoulli equation using the Putnam drag coefficient [10] can be solved and integrated to evaluate the droplet trajectory along the 2.55 m duct between nozzle entrance and measurement area, assuming constant gas velocity, as shown in Figure 5.
As the Putnam solution indicates, only droplets up to a diameter of 25 µm are fully relaxed at the beginning of the measurement area. With growing diameters, the degree of under-relaxation increases. Thus, the remaining slip velocity caused by the under-relaxation was subtracted from the measured slip velocities to obtain a corrected range.
Next, maximum slip velocities for each class are derived from the entire region giving two limits: a lower limit of negative slip velocities from the aft region and an upper limit of positive slip velocities from the acceleration zone. Figure 6 illustrates these two limits and the region of relevant slip velocities in between. Here, the positive slip velocities saturate at about v slip = 80 m/s as soon as the droplets exceed a diameter of D = 40 µm. The negative slip velocities decrease much faster, and saturate early, at D = 15 µm. Due to the relaxation correction, which, as shown in Figure 4, is only relevant for larger droplet classes, the slip velocity drops again at a diameter greater than 50 µm. In addition, isolines of constant droplet Weber numbers are shown. Since it is always below 12, no bag breakup occurs for this case according to [11]. Furthermore, illustrations of the droplet shapes taken from the simulations, described further below, show only small deformations, which is consistent with the small droplet Weber number. Neupert et al. [12] further showed that the vibrational breakup ( W e d 12 ) for the present compressor cascade occurs only for higher droplet mass fractions, ξ m = 1.3% and ξ m = 2.1%. In case of a droplet mass fraction of ξ m = 1.3%, a higher incidence angle of more than α ≥ 5° is required to cause vibrational breakup. Since no breakup occurs within the whole application range, the evaporation model must model all slip velocities shown in Figure 6.

2.3. Numerical Method and Setup

The numerical simulations were performed using the ITLR in-house code Free Surface 3D (FS3D). This direct numerical simulation (DNS) code has been developed especially to solve the Navier-Stokes equations for incompressible flows with free surfaces. It is based on the volume of fluid (VOF) method by Hirt and Nichols [13] and uses a staggered grid to discretize the equations employing a finite volume method. In [14], a brief overview of the main features is given.
For the calculation of multiphase flow with evaporation, two scalar fields, f 1 and f 2 , are introduced. f 1 represents the volume fraction of the liquid phase. The definition for f 1 is
f 1 = 0 in the gaseous phase , 0 < f 1 < 1 in interfacial cells , 1 in the liquid phase .
f 2 represents the vapor volume fraction and has an analogue definition. The convective transport of the VOF variables is performed using the PLIC technique by Rider and Kothe [15] to maintain a sharp interface and to minimize numerical diffusion. Furthermore, it needs to be mentioned that vapor is assumed to be insoluble inside the liquid phase; diffusion into the gaseous phase is possible, however. Hase [16] and Schlottke [17] describe the details of the numerical models. Within this simulation, the energy equation is solved to consider non-isothermal effects. The method was used and validated extensively in past years. For more details, the reader is referred to [18,19].
The setup of the current simulations is as follows: All simulations are performed on a Cartesian grid. The computational domain with the evaporating droplet is shown in Figure 7.
On the left, there is an inflow boundary condition; all other boundaries are modeled as continuous (Neumann) conditions. To be able to simulate the droplet over a longer time period without having to use large grids, the system is transformed into the droplet system. The computational domain has a size of five times the droplet diameter in lateral direction and ten times in longitudinal direction. With the experience from earlier evaporation simulations, the grid resolution is set to 256 × 128 × 128 cells, resulting in the resolution of the diameter of a spherical droplet being approximately 26 cells.
Finally, the evaluated parameter range is given in Table 2. In total, more than 130 DNSs have been performed, covering the whole range of parameters. As mentioned earlier, the shape of the droplets will change with diameter and relative velocity, and thereby contribute to the evaporation behavior. However, since DNSs were performed, the droplets were fully resolved and the effect of droplet shape was directly taken into account. Nevertheless, one set of simulations with an initially elliptic deflected droplet has been performed. The ratio between major and minor half axis was set to 1.5.
The DNSs for the Lagrangian model are based on incompressible calculations. This is due to the low Reynolds and Weber numbers for the droplets under consideration. In addition, the Mach numbers based on the slip velocity v slip are smaller than 0.3. Of course, the model is limited to flow areas without shock interaction.

2.4. Numerical Results

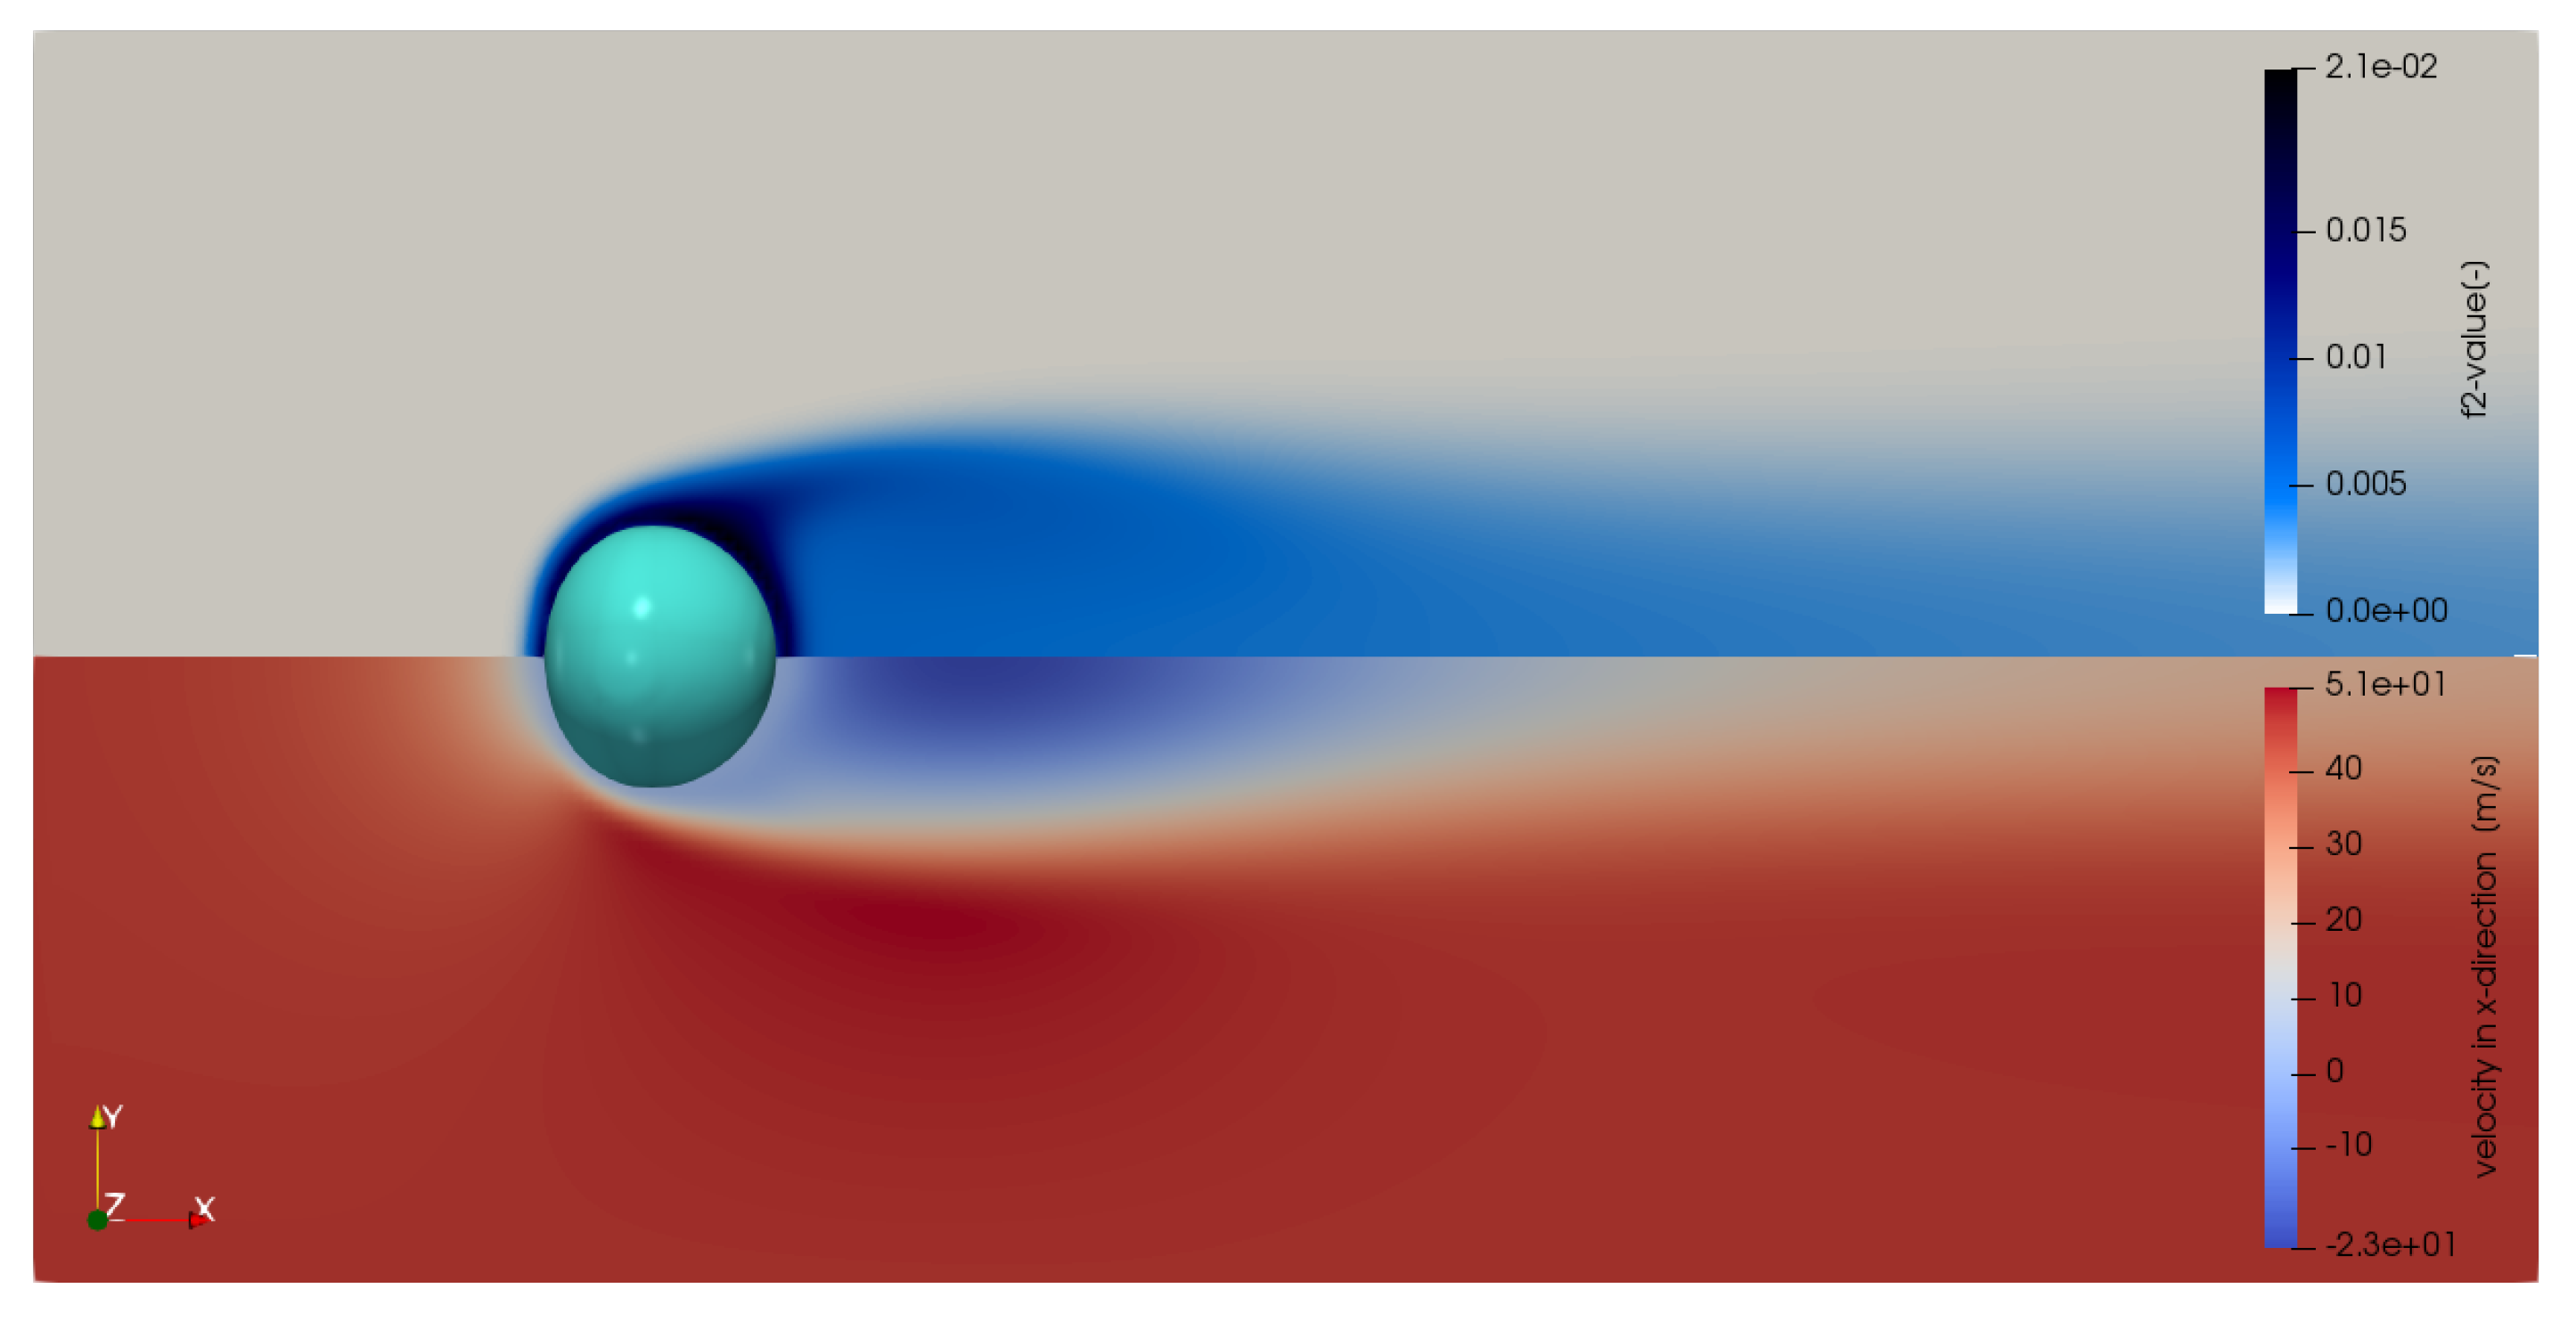
The DNS gives a complete insight into the detailed processes during the droplet evaporation. Figure 8 shows the converged state at t = 4.87 × 10 5 s of a droplet with an initial diameter of D = 75 µm and T liquid = 295 K. The dry inflow is at T gas = 300 K with a speed of u = 46.17 m/s in positive x-direction, so the flow is from left to right. On the upper half, the vapor volume fraction, and in the lower half, the velocity magnitude in x-direction, are shown. The light blue surface in the middle depicts the contour of the droplet surface. These two contour plots show the main characteristics of the simulation results and are representative for all simulations at hand. In the vicinity of the droplet, the vapor volume fraction is highest due to the assumption of fully saturated air at the surface. The vapor is then carried away by the surrounding gas flow. Looking at the flow field, the typical stagnation region in front and recirculation zone in the wake of the droplet can be seen. As this example shows the results of a rather large initial droplet diameter under relatively strong cross flow, the droplet shape does not stay perfectly spherical. Nevertheless, the deformation is small due to the small Weber number ( W e = 2.59). Comparing the surface areas of the initially spherical droplet and the area of the final droplet shape results in a deviation of only 5.9%. This justifies the assumption of a spherical droplet shape for the following analysis. With this, an equivalent droplet diameter can be evaluated from the actual droplet volume, which comes out of the simulation. Figure 9 shows the development over time of the squared ratio between actual and initial droplet diameter ( D / D 0 ) 2 in blue for two selected simulation settings. It is shown that the ratio decreases linearly for both cases. This can be seen for all simulations performed, and was expected, as it reflects the well known D 2 -law, which generally holds for evaporation processes. Consequently, the evaporation rate β , which can also be calculated as the slope of ( D / D 0 ) 2 over time, underlines the validity of the D 2 -law, as it tends towards a constant value after a short initial time period. It can be seen in Figure 9 in orange.

3. Discussion

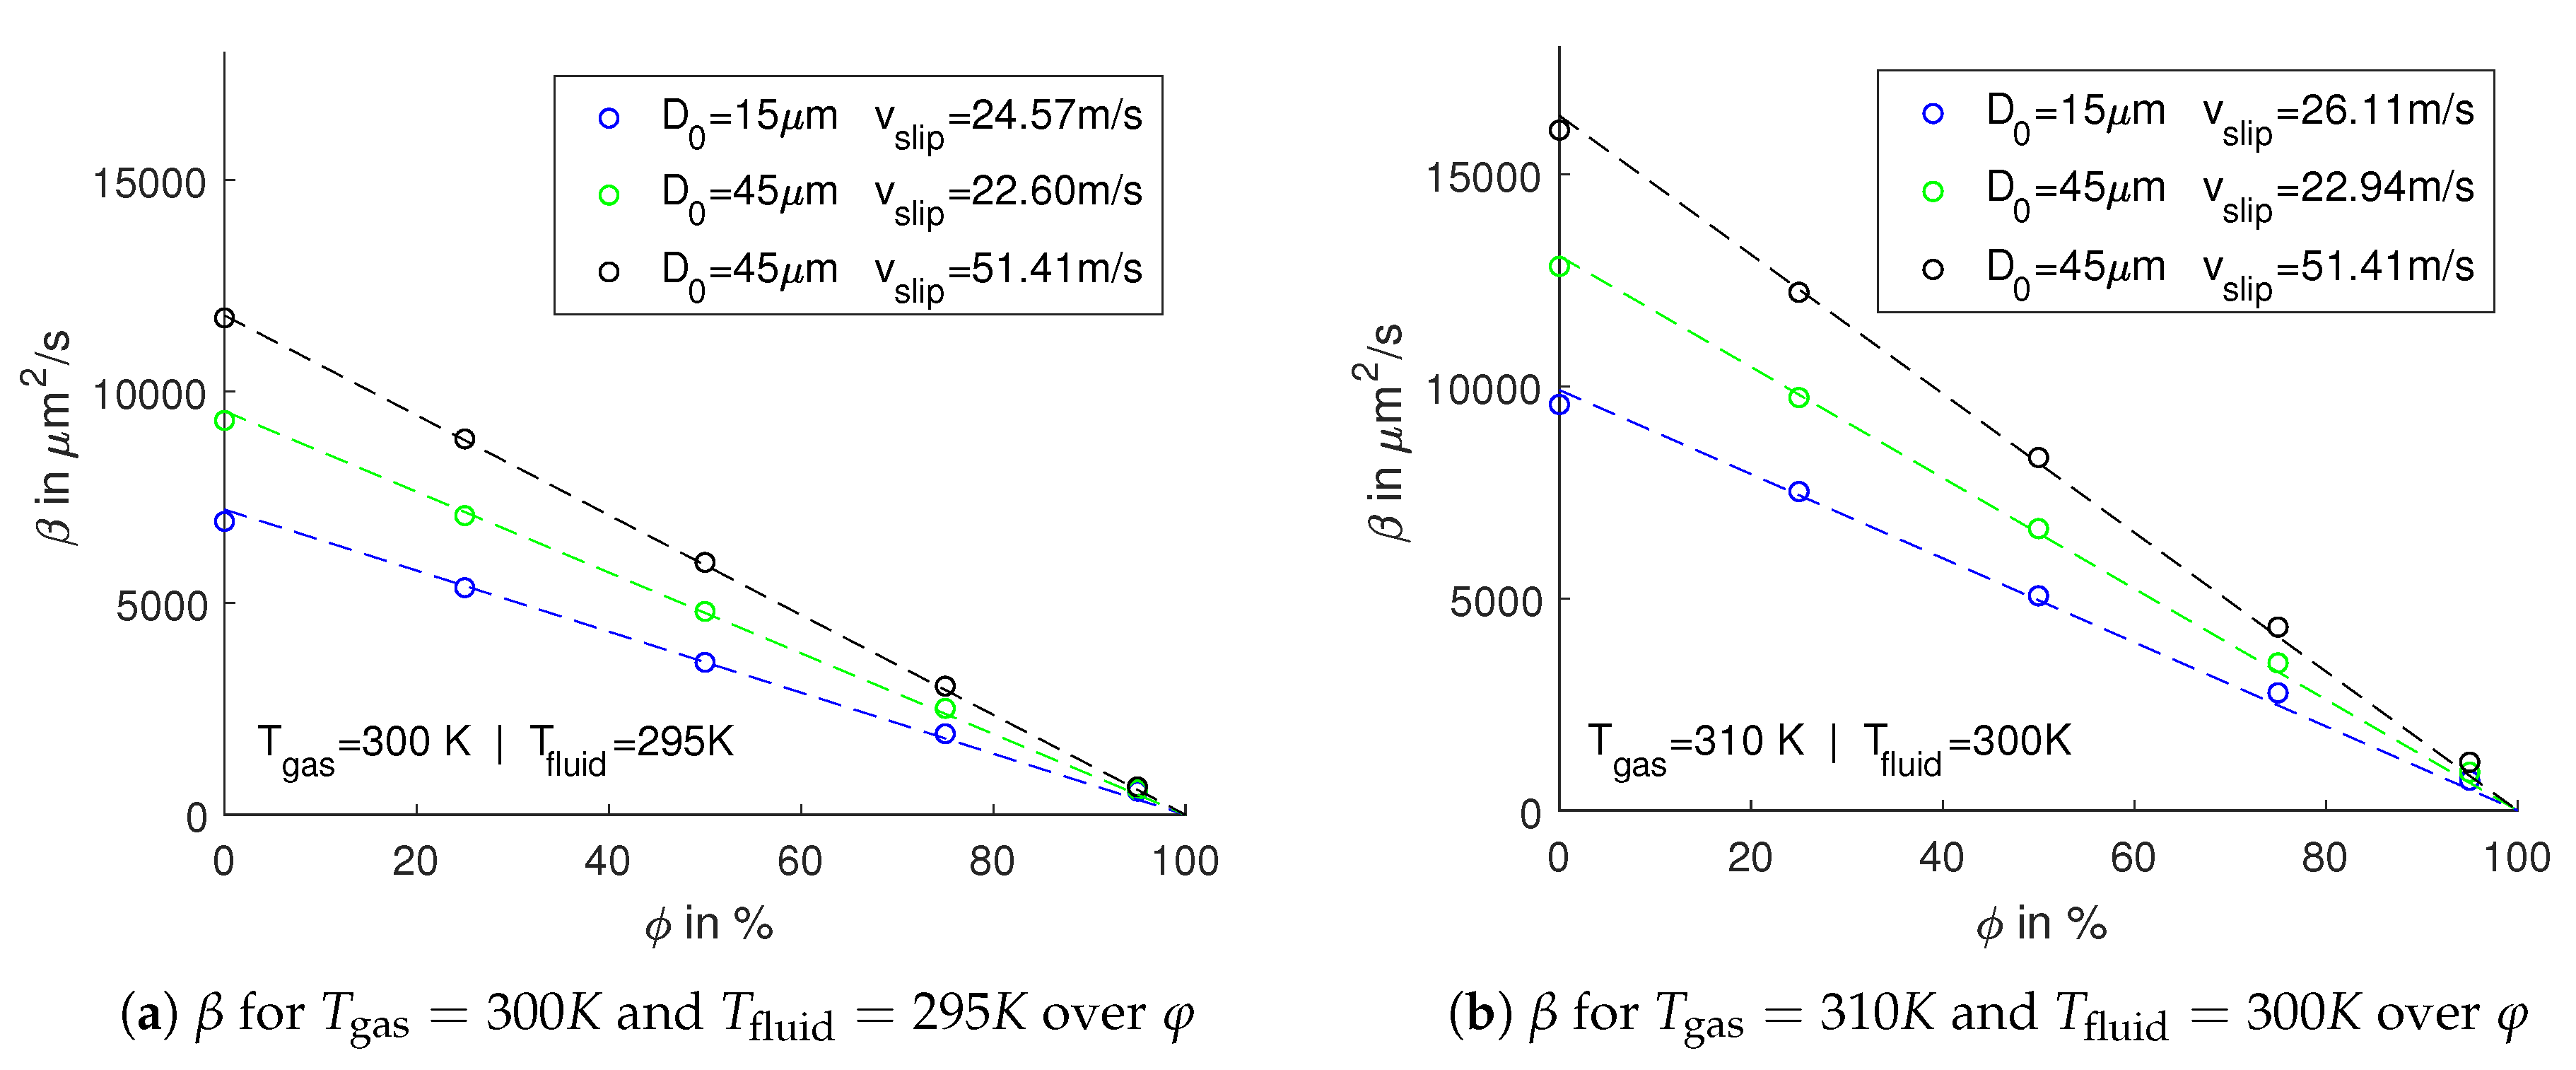
Within this discussion, the focus lies on the description of the evaporation rate β behavior within the given parameter range. Subsequently, S h is evaluated for all simulations. In Figure 10 β is plotted over the relative humidity φ in the air inflow for three different setups at two temperature levels: The lower one is at T gas = 300 K and T fluid = 295 K in Figure 10a; the higher one is at T gas = 310 K and T fluid = 300 K in Figure 10b. The setups are chosen to additionally elucidate the development of β with increasing initial droplet diameter D 0 and slip velocity v slip . A closer look at Figure 10a shows a linear decrease of β with increasing φ . This finding is highlighted with the dashed lines, showing the linear regression under the assumption that there is no evaporation for fully saturated air, so β = 0 for φ = 100%. Such linear behavior has been found for all evaluated simulations, as it has also been found experimentally and numerically in [19] for supercooled droplets. The present results show that the magnitude of the evaporation rate increases with increasing droplet diameter, slip velocity, and temperature level. This can be explained by an increased droplet surface, a smaller concentration boundary layer thickness as δ X / D 1 / R e S c , and a higher binary diffusion coefficient D b i n and saturated vapor pressure, respectively.
Finally, the Sherwood numbers of all simulations have been evaluated. S h is defined as the ratio h c D / D b i n , where h c denotes the convective mass transfer coefficient and D the droplet diameter, respectively. In the literature, experimental data and correlations resulting from the experiments can be found. One of the first correlations which states a linear dependence of S h on R e 1 / 2 S c 1 / 3 originates from [5]. Other well-known and often cited correlations can be found in [6,7]. The correlations are listed in Equations (3)–(5).
S h = 2 + 0.552 R e 1 / 2 S c 1 / 3
S h = 2 + 0.6 R e 1 / 2 S c 1 / 3
S h = 2.009 + 0.514 R e 1 / 2 S c 1 / 3
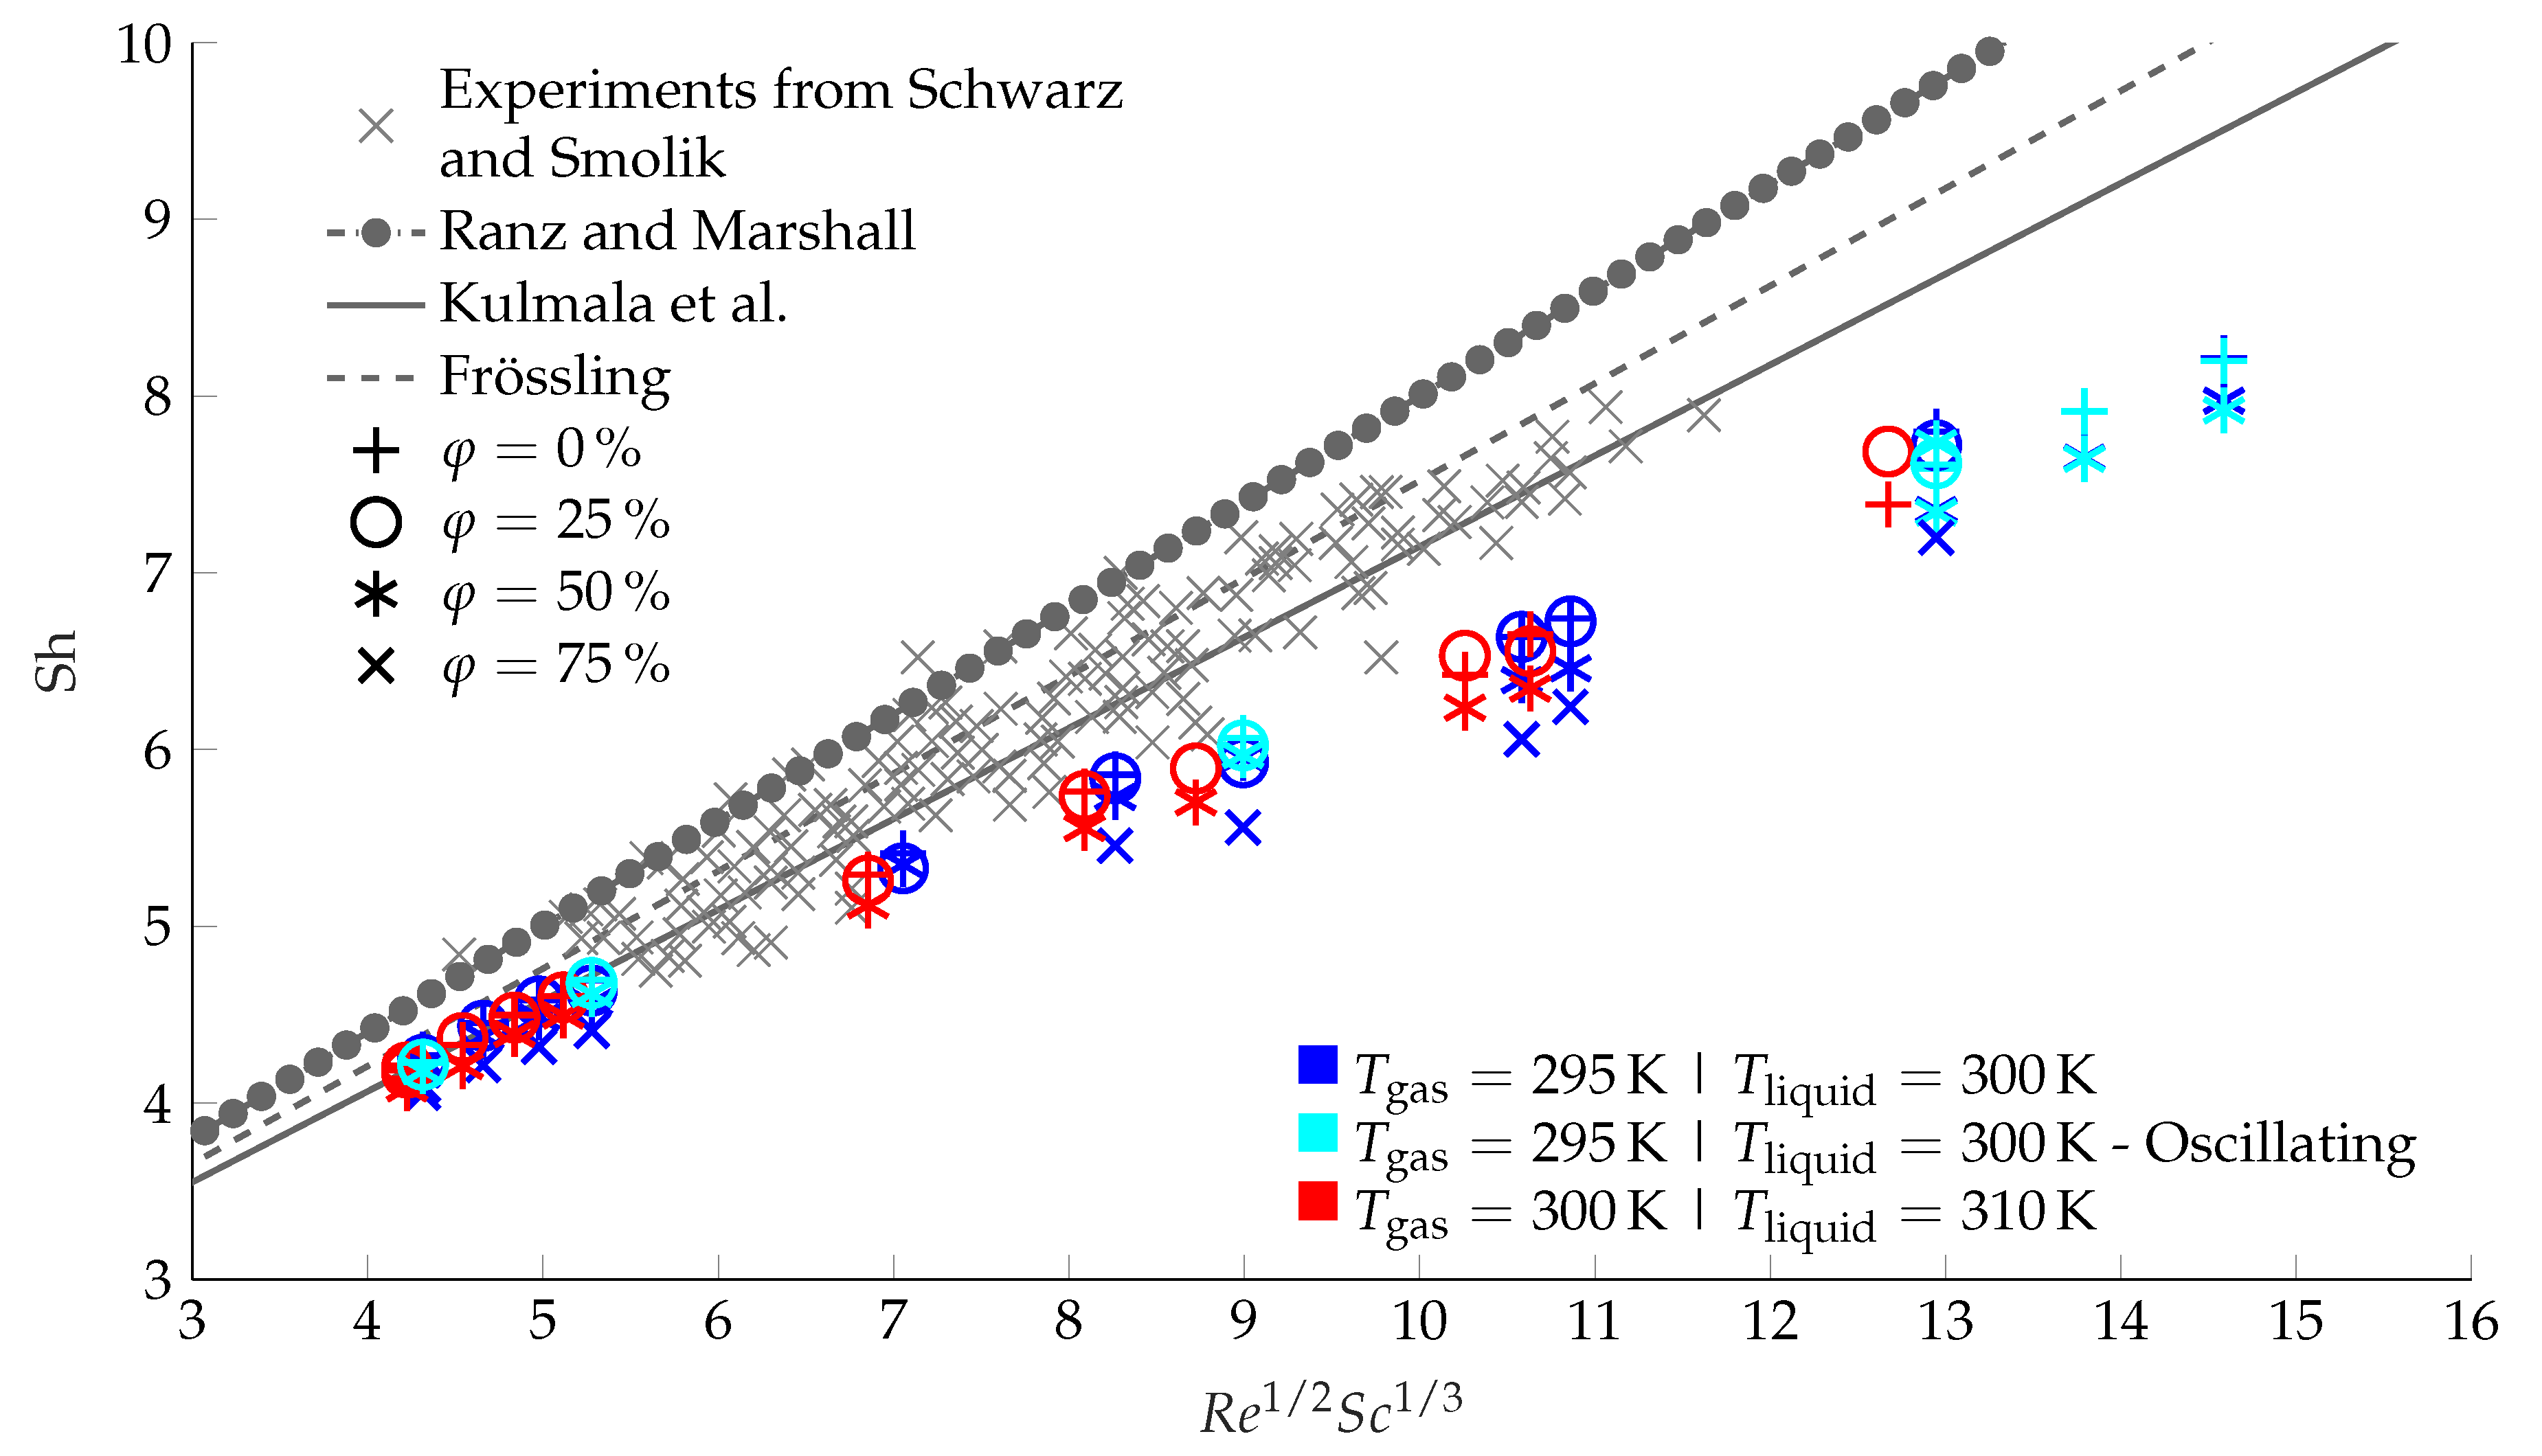
As can be seen, they are all cast in the same form, varying only in the proportionality factor. The final goal of this work is to propose a correlation in the same form of S h = A + B R e 1 / 2 S c 1 / 3 , that fits all simulation results. Following [5,7] and for physical reasons, A = 2 should be used [20]. Figure 11 shows S h in dependence on R e 1 / 2 S c 1 / 3 . Experimental data from Schwarz and Smolik [21], and the above mentioned correlations (Equations (3)–(5)) are visualized in gray. The data points from the current simulations are plotted in color, where the color indicates the temperature level and the shape resembles the level of ambient relative humidity. At first glance, two main features of the simulation results are apparent: First, the evaluated S h numbers at each position of R e 1 / 2 S c 1 / 3 are in a range of less than 8.9%, which is smaller than the difference of the experimental data (up to 15.5%). Second, the results show good agreement with the experimental data, and hence, with the given correlation for R e 1 / 2 S c 1 / 3 < 6 . Going to larger values, a shift in the slope is visible, which results in a growing deviation between the simulation results and the experimental data and the correlation in Equation (5), respectively.
The first feature is very interesting, as the data points of all simulation setups are plotted. The small deviation in the S h number leads to the conclusion that none of the varied parameters have a strong effect on the relation between S h and R e 1 / 2 S c 1 / 3 . Hence, the whole physical parameter range can be dealt with via one dimensionless correlation.
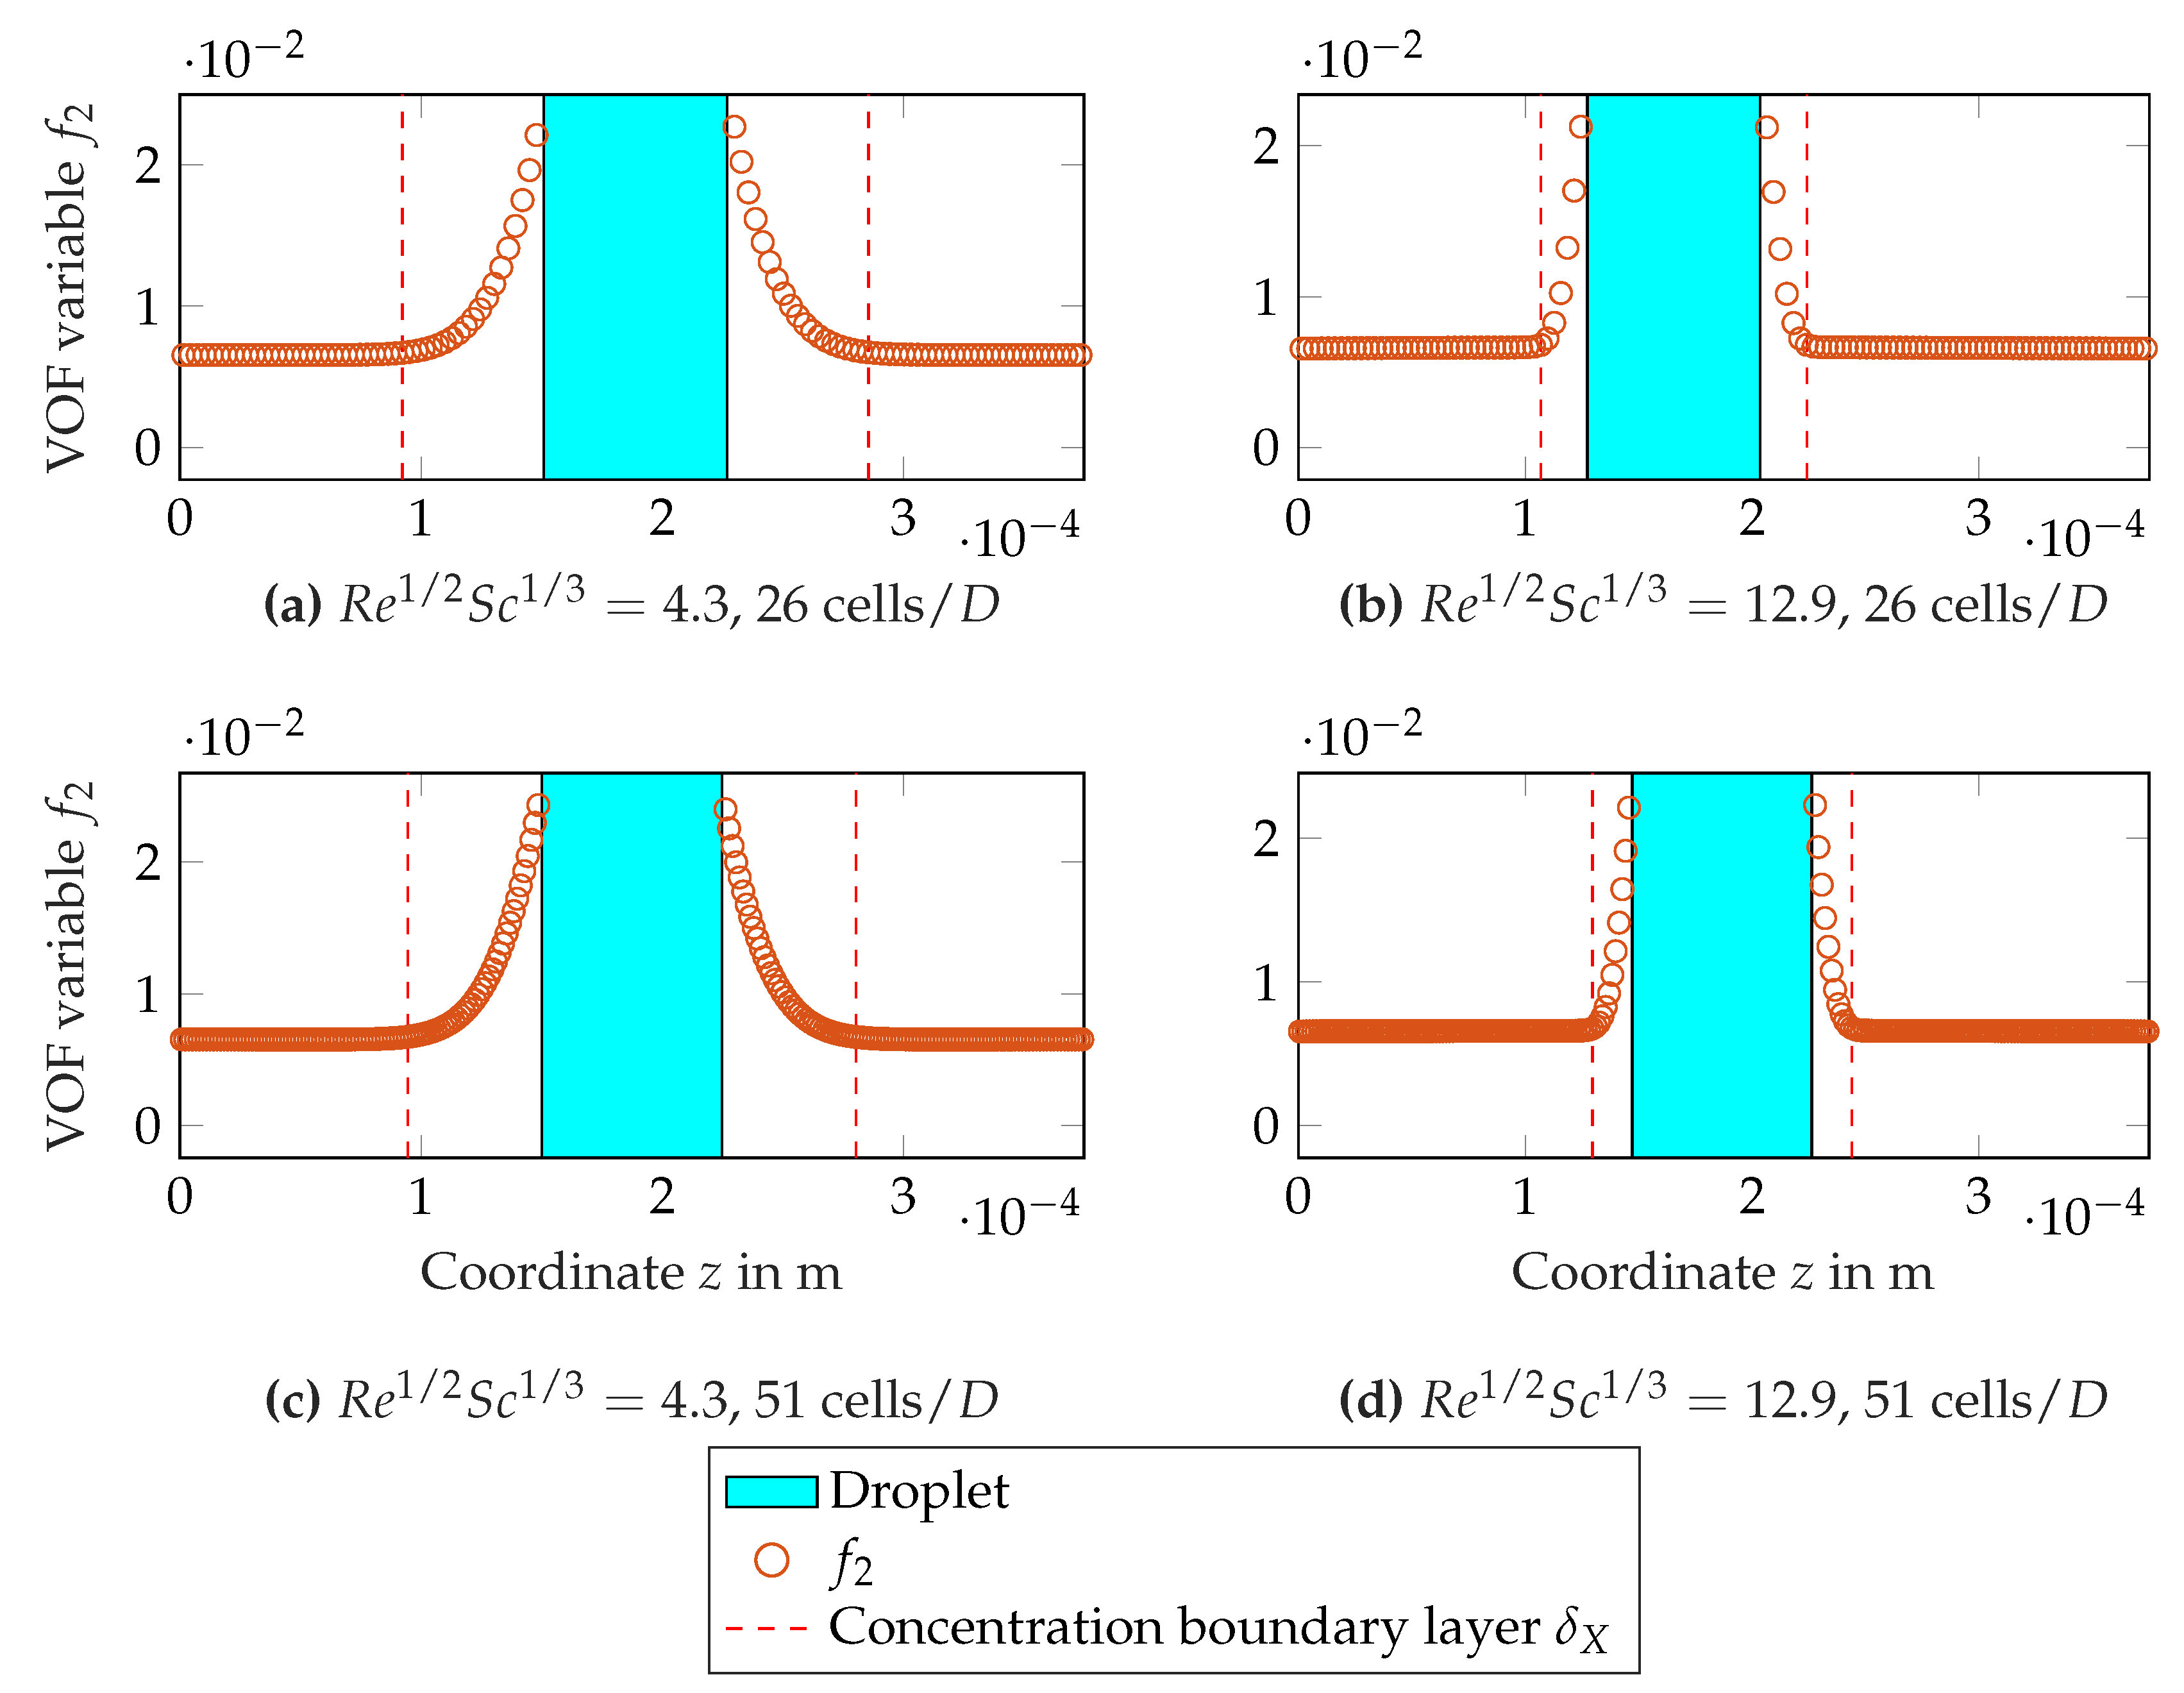
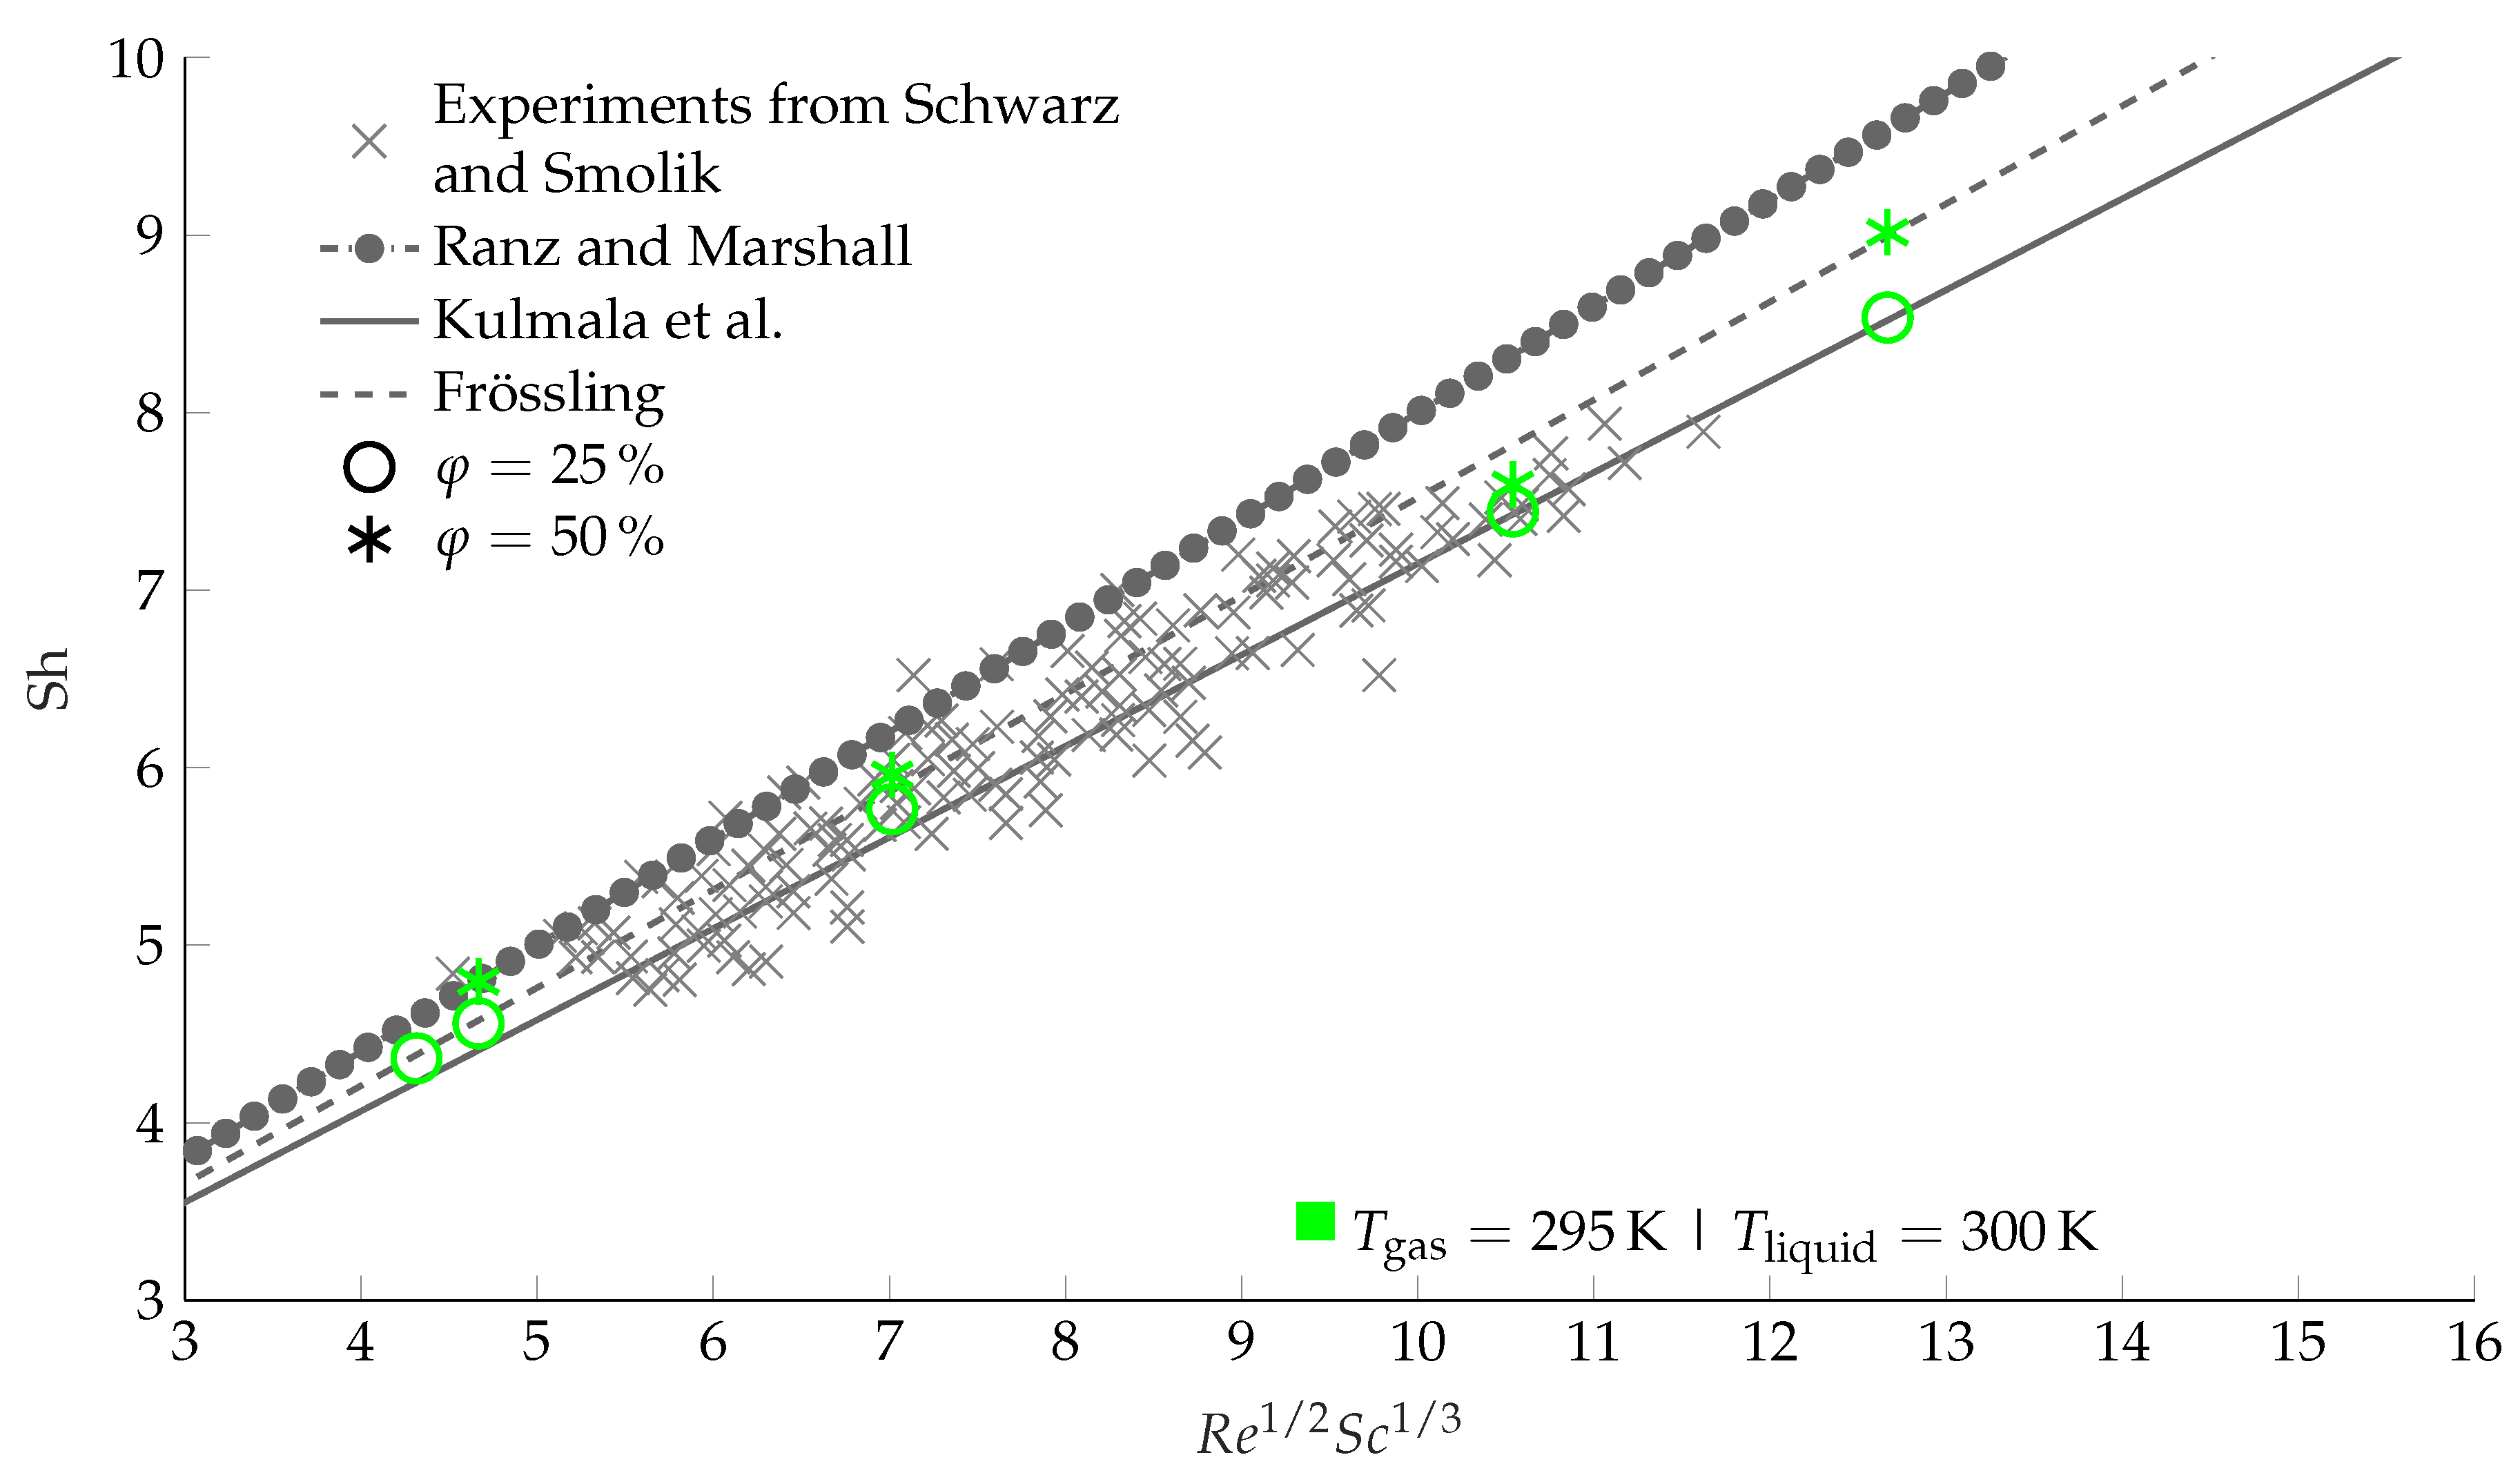
Unfortunately, the second feature shows a growing deviation for R e 1 / 2 S c 1 / 3 > 6 . All simulations were performed with water, so S c = 0.70 is constant. Considering one constant droplet diameter, R e changes with velocity. With increasing velocity and R e , the thickness of the concentration boundary layer δ X around the droplet decreases. δ X is defined as the distance from the droplet surface to the point where the difference between the local f 2 value and the ambient condition is less or equal than 1%. Finally, this leads to an under-resolved concentration boundary layer δ X and to errors in the simulation. This can be easily explained: S h depends mainly on h c , as D and D b i n are constant. Within the simulation, the convective mass transfer coefficient h c itself depends strongly on the gradient of f 2 around the droplet. As long as δ X , spatially, cannot be resolved sufficiently, the gradient of f 2 will not be correct. To prove this theory, selected cases have been simulated again with a doubled resolution in each spacial direction, giving a resolution of about 51 cells per diameter. The concentration boundary layer around the droplet has been evaluated. There is comparison of the line plots through the droplet center, showing f 2 values of two cases with φ = 25% and R e 1 / 2 S c 1 / 3 = 4.3 and R e 1 / 2 S c 1 / 3 = 12.9 at the lower temperature level ( T gas = 295 K, T liquid = 300 K) as an example in Figure 12. Although S h fits the experiments and the correlation, the case with R e 1 / 2 S c 1 / 3 = 4.3 is shown in Figure 12a,c. It justifies the original chosen resolution of 26 cells per diameter, as the evaluated thickness values and form of δ X in both simulations are identical. The doubled number of grid points within the concentration boundary layer is not necessary here. In contrast, Figure 12b,d shows the result for R e 1 / 2 S c 1 / 3 = 12.9 . The under-resolved concentration boundary layer with the original resolution is visible, as with higher resolution the height decreases. With it the gradient of f 2 and the resulting S h number increase. This can be seen for R e 1 / 2 S c 1 / 3 > 6 , and explains the deviation between the simulated S h numbers and the experimental results and the correlation, respectively. The eight times higher resolution comes along with a correspondingly higher computational time. The effort to recompute most of the parameters is not proportional. Therefore, only some simulations were performed again. The results are plotted in Figure 13 in green. The shapes resemble the same ambient relative humidities as in Figure 11. All recomputed simulations have been performed at the lower temperature level. The results show first, that there is again only a small difference in the S h number for different φ . Second, the results lie perfectly within the experimental data points and very close to the correlation from Kulmala et al. [6]. That is why the finding, saying the ambient conditions, e.g., relative humidity, temperature level, and oscillation, have a negligible influence on the S h number, is assumed to still be valid. However, the correct values of S h are close to the existing correlation given by Equation (5).

4. Conclusions

The current paper investigates the evaporation of water droplets under conditions present in compressors of stationary gas turbines used with high-fogging. First, measurements in a transonic compressor cascade revealed the prevailing conditions. Here, the focus was on the measurement of slip velocities for each droplet diameter occurring in the spray. As expected, the results show that the slip velocity increases with growing droplet diameters. Interestingly, the slip velocity already reaches a maximum of v slip ≈ 80 m/s for D = 40 µm and stays nearly constant for larger droplets. Subsequently, DNS results of single evaporating droplets yield the stated linear behavior of β ( φ ) . The discussion on S h ( R e 1 / 2 S c 1 / 3 ) yields two principal conclusions. One is that the physical ambient conditions relative humidity, temperature level, and droplet oscillation have a negligible influence on the S h number. On the other hand, it can be stated that the correlation from Kulmala et al. [6] can be used to reliably predict the evaporation process for high-fogging applications within the parameter range at hand.

Author Contributions

Conceptualization, B.W. and F.J.; methodology, A.S., S.G., J.H., F.J. and B.W.; validation, S.G. and J.H.; formal analysis, A.S., S.G. and J.H.; investigation, A.S., S.G. and J.H.; writing—original draft preparation, A.S., S.G. and J.H.; writing—review and editing, A.S., S.G., J.H., F.J. and B.W.; visualization, A.S.; supervision, B.W. and F.J. All authors have read and agreed to the published version of the manuscript.

Funding

This research was funded by German Research Foundation (DFG), grant numbers WE2549/36-1 and JO633/6-1.

Conflicts of Interest

The authors declare no conflict of interest.

Abbreviations

The following symbols and abbreviations are used in this manuscript:
α Angle of incidence, °
β Evaporation rate, m2/s
δ X Concentration boundary layer thickness, m
D bin Binary diffusion coefficient, m2/s
φ Relative humidity, -
ξ m Droplet mass fraction, -
A , B , c , d Constants, -
cBlade chord length, m
D 10 Mean diameter, m
D 32 Sauter mean diameter, m
D 0 Initial diameter, m
DDiameter, m
f 1 , f 2 VOF variable for liquid and vapor, -
h c Convective mass transfer coefficient, m/s
M a 1 Inlet Mach number, -
Δ p back Relative back pressure, Pa
R e Reynolds number, -
SSlip ratio, -
S c Schmidt number, -
S h Sherwood number, -
T gas Gas temperature, K
T liquid Droplet temperature, K
tBlade spacing, m
tTime, s
T u Turbulence level, -
u Inlet velocity, m/s
v slip Slip velocity, m/s
W e Weber number, -
x , y , z Cartesian coordinates, m
DNSDirect numerical simulation
FS3DFree Surface 3D
ITLRInstitute of Aerospace Thermodynamics
LSMLaboratory of Turbomachinery
VOFVolume of fluid

References

  1. Gomaa, H. Modeling of Liquid Dynamics in Spray Laden Compressor Flows. Ph.D. Thesis, University of Stuttgart, Stuttgart, Germany, 2014. [Google Scholar]
  2. Neupert, N.; Harbeck, J.; Joos, F. An experimentally derived model to predict the water film in a compressor cascade with droplet laden flow. In Proceedings of the ASME Turbo Expo 2017: Turbomachinery Technical Conference and Exposition, Charlotte, NC, USA, 26–30 June 2017. [Google Scholar]
  3. Seck, A.; Gomaa, H.; Weigand, B. Improved modeling approach for the interaction between droplets and blades in a compressor cascade. In Proceedings of the ISROMAC-17, Maui, HI, USA, 16–21 December 2017. [Google Scholar]
  4. Kolaitis, D.; Founti, M. A comparative study of numerical models for Euler-Lagrangian simulations of turbulent evaporating sprays. Int. J. Heat Fluid Flow 2006, 27, 424–435. [Google Scholar] [CrossRef]
  5. Frössling, N. Über die Verdunstung fallender Tropfen. Gerlands Beiträge Geophysik 1938, 52, 170–216. [Google Scholar]
  6. Kulmala, M.; Vesala, T.; Schwarz, J.; Smolik, J. Mass transfer from a drop-II. Theoretical analysis of temperature dependent mass flux correlation. Int. J. Heat Mass Transf. 1995, 38, 1705–1708. [Google Scholar] [CrossRef]
  7. Ranz, W.; Marshall, W. Evaporation from drops—Part 2. Chem. Eng. Prog. 1952, 48, 173–180. [Google Scholar]
  8. Ober, B. Experimental Investigation on the Aerodynamic Performance of a Compressor Cascade in Droplet Laden Flow. Ph.D. Thesis, Helmut-Schmidt-Universität, Hamburg, Germany, 2013. [Google Scholar]
  9. Geist, S.; Harbeck, J.; Joos, F. A 3D-LDA study of the relation between coincident and time stepped non-coincident stress measurements in a linear compressor cascade. In Proceedings of the ASME Turbo Expo 2018: Turbine Technical Conference and Exposition, Oslo, Norway, 11–15 June 2018. [Google Scholar]
  10. Putnam, A. Integratable form of droplet drag coefficient. ARS J. 1961, 31, 1467–1468. [Google Scholar]
  11. Pilch, M.; Erdman, C. Use of breakup time data and velocity history data to predict the maximum size of stable fragments for acceleration-induced breakup of liquid drop. Int. J. Multiph. Flow 1987, 13, 741–757. [Google Scholar] [CrossRef]
  12. Neupert, N.; Ober, B.; Joos, F. Experimental investigation on droplet behavior in a transonic compressor cascade. J. Turbomach. 2015, 137, 031009:1–031009:8. [Google Scholar] [CrossRef]
  13. Hirt, C.; Nichols, B. Volume of fluid (VOF) method for the dynamics of free boundaries. J. Comput. Phys. 1981, 39, 201–225. [Google Scholar] [CrossRef]
  14. Eisenschmidt, K.; Ertl, M.; Gomaa, H.; Kieffer-Roth, C.; Meister, C.; Rauschenberger, P.; Reitzle, M.; Schlottke, K.; Weigand, B. Direct numerical simulations for multiphase flows. Appl. Math. Comput. 2016, 272, 508–517. [Google Scholar]
  15. Rider, W.; Kothe, D. Reconstructing volume tracking. J. Comput. Phys. 1998, 141, 112–152. [Google Scholar] [CrossRef] [Green Version]
  16. Hase, M. Numerische Berechnung dreidimensionaler Transportvorgänge an angeströmten, sich verformenden Tropfen. Ph.D. Thesis, University of Stuttgart, Stuttgart, Germany, 2005. [Google Scholar]
  17. Schlottke, J. Direkte Numerische Simulation von Mehrphasenströmungen mit Phasenübergang. Ph.D. Thesis, University of Stuttgart, Stuttgart, Germany, 2008. [Google Scholar]
  18. Schlottke, J.; Weigand, B. Direct numerical simulation of evaporating droplets. J. Comput. Phys. 2008, 227, 5215–5237. [Google Scholar] [CrossRef]
  19. Ruberto, S.; Reutzsch, J.; Roth, N.; Weigand, B. A systematic experimental study on the evaporation rate of supercooled water droplets at subzero temperatures and varying relative humidity. Exp. Fluids 2017, 58, 55. [Google Scholar] [CrossRef]
  20. Ranz, W.; Marshall, W. Evaporation from drops—Part 1. Chem. Eng. Prog. 1952, 48, 141–146. [Google Scholar]
  21. Schwarz, J.; Smolik, J. Mass transfer from a drop-I. Experimental study and comparison with existing correlations. Int. J. Heat Mass Transf. 1994, 37, 2139–2143. [Google Scholar] [CrossRef]
Figure 1. Illustration of the measurement section at the LSM. Detail: Depiction of the cascade nomenclature with the measurement grid positions underneath.
Ijtpp 05 00005 g001
Figure 2. Measured spray number and mass fraction distribution at cascade inlet.
Ijtpp 05 00005 g002
Figure 3. Measured absolute velocity contour across te passage. M a 1 = 0.89 , α = 4°.
Ijtpp 05 00005 g003
Figure 4. Contours of slip ratio S throughout the cascade passage for small, intermediate, and large droplet diameters. Flow is from right to left.
Ijtpp 05 00005 g004
Figure 5. Calculated Putnam drag-based relaxation of different droplet classes at the inlet plane and resulting slip ratio maxima.
Ijtpp 05 00005 g005
Figure 6. Measured maximum slip velocity range map for droplets at hand. Depicted droplets give an impression of the slip velocity’s influence on the droplets’ shape.
Ijtpp 05 00005 g006
Figure 7. Computational domain (size: 10 D × 5 D × 5 D , grid resolution: 256 × 128 × 128 ) with boundary conditions for direct numerical simulations (DNSs) with FS3D.
Ijtpp 05 00005 g007
Figure 8. Contour plot of vapor field ( f 2 value) and velocity magnitude in mid cross section from converged DNS results at t = 4.87 × 10 5 s. Initial conditions were D = 75 µm, u = 46.17 m/s, T gas = 300 K, T liquid = 295 K, φ = 0 .
Ijtpp 05 00005 g008
Figure 9. ( D / D 0 ) 2 and β over time for two selected simulation settings.
Ijtpp 05 00005 g009
Figure 10. Evaporation rate β over relative humidity φ .
Ijtpp 05 00005 g010
Figure 11. S h over R e 1 / 2 S c 1 / 3 : Experimental results [21] and correlations from the literature ([5,6,7]) plotted together with results from simulations with a resolution of 26 cells per diameter.
Ijtpp 05 00005 g011
Figure 12. Line plot of volume of fluid (VOF) variable f 2 at constant x,y-position through droplet center, showing the thickness of the concentration boundary layer δ X for different velocities and resolutions. The red dashed line shows the position of the concentration boundary layer δ X . (a) δ X = 5.56 × 10 6 m, (b) δ X = 2.34 × 10 6 m, (c) δ X = 5.56 × 10 6 m, (d) δ X = 1.76 × 10 6 m.
Ijtpp 05 00005 g012
Figure 13. S h over R e 1 / 2 S c 1 / 3 : Experimental results [21] and correlations from the literature ([5,6,7]) plotted together with results from simulations with a resolution of 51 cells per diameter.
Ijtpp 05 00005 g013
Table 1. Summary of test rig and influencing parameters.
α [°]c [m]t [m]Ma1 [-]Tliquid [K]Tgas [K]φ [%]Tu [-]
40.050.050.89303.15310.1536.90.02
Table 2. Parameter range for DNSs.
Diameter D [µm]Velocity u [m / s]Temperature [K]Relative Humidity φ [-]
T gas T liquid
15/45/754.91–58.6300/310295/3000/0.25/0.5/0.75