Technical Note

Improvement of the Parallel Compressor Model and Application to Inlet Flow Distortion

by
Emmanuel Benichou
*,†,
Nicolas Binder
*,†,
Yannick Bousquet
and
Xavier Carbonneau
ISAE-SUPAERO, Université de Toulouse, 31013 Toulouse, France
*
Authors to whom correspondence should be addressed.
These authors contributed equally to this work.
Int. J. Turbomach. Propuls. Power 2021, 6(3), 34; https://doi.org/10.3390/ijtpp6030034
Submission received: 22 June 2021 / Revised: 11 August 2021 / Accepted: 19 August 2021 / Published: 25 August 2021

Abstract

:
This paper introduces a semi-analytical approach which enables one to deal with distorted inflow in axial fans or compressors. It is inspired by the classical parallel compressor (PC) theory but relies on a local flow-loading coefficient formalism. It is applied to non-uniform flow conditions to study the aerodynamic behavior of a low-speed fan in response to upstream flow distortion. Experimental measurements and 3D RANS simulations are used to evaluate the prediction of fan performance obtained with the local PC method. The comparison proves that, despite its simplicity, the present approach enables to correctly capture first order phenomena, offering interesting perspectives for an early design phase if different fan geometries are to be tested and if the upstream distortion maps are available.

1. Introduction

Increasingly stringent environmental constraints push the aeronautical industry to drastically decrease airplane emissions. Many theoretically promising innovative airplane technologies can be collected under the umbrella term “integrated propulsion airplanes”. These are characterized by the propulsive system being conceived to operate in synergy with other airplane parts for an overall system-level energy benefit [1].
Consequently, the interactions between the propulsive system and its environment are enhanced and often lead to additional flow complexity, especially when involving Boundary Layer Ingestion (BLI). In that case, quantifying the fuel savings at the system level for a whole mission remains a very challenging issue. The StarC-ABL from NASA provides a good example: in 2016, this hybrid-electric single-aisle concept was expected to save 12% of block fuel compared to the reference baseline [2]. Later work brought the block fuel reduction to 3.4% [3] and more recent work even concluded that this configuration leads in fact to increasing block fuel up to 5.4% [4,5], largely due to a huge increase in the mass of the propulsive system. This illustrates how difficult it is to predict the performance of an innovative configuration during preliminary design with an adequate accuracy.
For this reason, new methods are needed to provide reliable performance prediction during an early design phase and, as stated by Hall [4], this means improving individual component models. Concerning propulsion with BLI, special attention must be paid to the fan aerodynamic behavior under distorted inflow conditions, in terms of stability margin and efficiency penalty, among others. Some 3D parametric studies have recently been conducted, for example, by Fernandez et al. [6], Schmollgruber et al. [7] or Habermann et al. [8]. However, the cost and complexity of these simulations remain prohibitive and the design space they explore is limited in terms of geometries, propulsor characteristics or operating conditions. Thus, usual Computational Fluid Dynamics (CFD) tools may not be adapted to a preliminary design.
This work presents an adaptation of the parallel compressor (PC) theory. This approach classically considers independent circumferential flow zones evolving through a compressor, without interacting between each other. In the present work, this theory has been modified in order to locally use a flowloading coefficient ( ϕ ψ ) formalism. Instead of relying on a global performance curve, the user inputs are some basic geometric elements of the blades and flow deviation correlations. It enables dealing with any upstream flow distortion map, and the downstream flow field provided can then be averaged in order to update the corresponding fan performance.
In the first section of this paper, the local PC formulation is described in detail. Next, it is applied to a low-speed fan for two operating points with distortion. The results are compared to experimental measurements and higher-fidelity CFD simulations in order to validate the approach and discuss its limitations.

2. Local Parallel Compressor Model

The approach referred to as the parallel compressor theory was first introduced by Pearson [9] and has been extensively used to predict the impact of an inlet flow distortion on the stability limit of a fan or a compressor. The idea consists of subdividing the compressor in different segments along the circumferential direction (for an azimuthal distortion), considering each of them as independent and fed by a uniform inflow. The initial formulation assumes a steady behavior and a uniform outlet static pressure distribution, each compressor segment operating at the same rotational speed and different pressure ratios. A lot of research work has been carried out to enrich the physical modeling:
  • Defining a critical extent for the distorted angular sector [10];
  • Combining an analytical description with empirical results in order to determine an appropriate characteristic time [11,12,13,14,15];
  • Coupling this approach with dynamic system modeling tools to better capture the inertia of multi-stage configurations [16,17,18,19,20,21,22].
Most of the time, the use of PC involves global performance, e.g., fan pressure ratio maps and efficiency penalties or pressure loss correlations when available. An example of implementation and application of classical PC can be found in [23], for example. Additional research has been carried out in order to achieve a local flow prediction. Doulgeris combined the classical parallel compressor approach with a streamline curvature (SLC) method to account for the variations in the radial direction [24]. Valencia also started from meanline modeling but added local loss correlations based on Miller’s work [25], which is described as the discretized Miller approach [26]. More recently, Menegozzo presented a similar approach intended for enhancing performance prediction [27].
Less work is available with regard to the modeling of distortion itself. A two-zone model has been proposed by Budziszewski [28]: it involves boundary layer integral quantities, namely displacement and momentum thicknesses, and creates an equivalent 1D upstream distortion profile. This two-zone profile is then combined with classical parallel compressors based on clean flow performance curves, which gives access to the fan performance under distortion. This semi-analytical modeling is promising but there is room for improvement in the fan stage treatment.
In line with this philosophy, the present work aims at establishing a local method, discretizing the fan blade geometry and relying on Euler’s theorem in order to produce a customized outlet flow field. This improvement makes it possible to access the 2D distortion map downstream of the rotor, from which the fan performance under distortion can then be deduced. Thus, it is a relevant tool to study a BLI propulsive configuration without resorting to costly unsteady CFD simulations.
The parallel compressor model is implemented here using a flowloading coefficient ( ϕ ψ ) formalism. Given the low-speed test case, an incompressible formulation is adopted for ϕ (Equations (1) and (2)). In this framework, the fan iso-speed performance curves are all superimposed in a unique line, as pictured in Figure 1, which provides a relevant and practical linearized relationship between massflow rate and work exchange. ϕ P represents the transition point between compressor and turbine modes, for which there is zero global work exchange, referred to as free windmill in the following.
ϕ = V z U
ψ = Δ h i U 2
The necessary inputs are the rotor LE and TE stagger angles, the rotational speed, the target massflow rate and the 2D upstream distortion maps for total temperature, total pressure, axial velocity and absolute flow angle. Whether global or local, this type of simplified modeling requires additional information at some point. In the following, two experimental inputs are also used (see Figure 2):
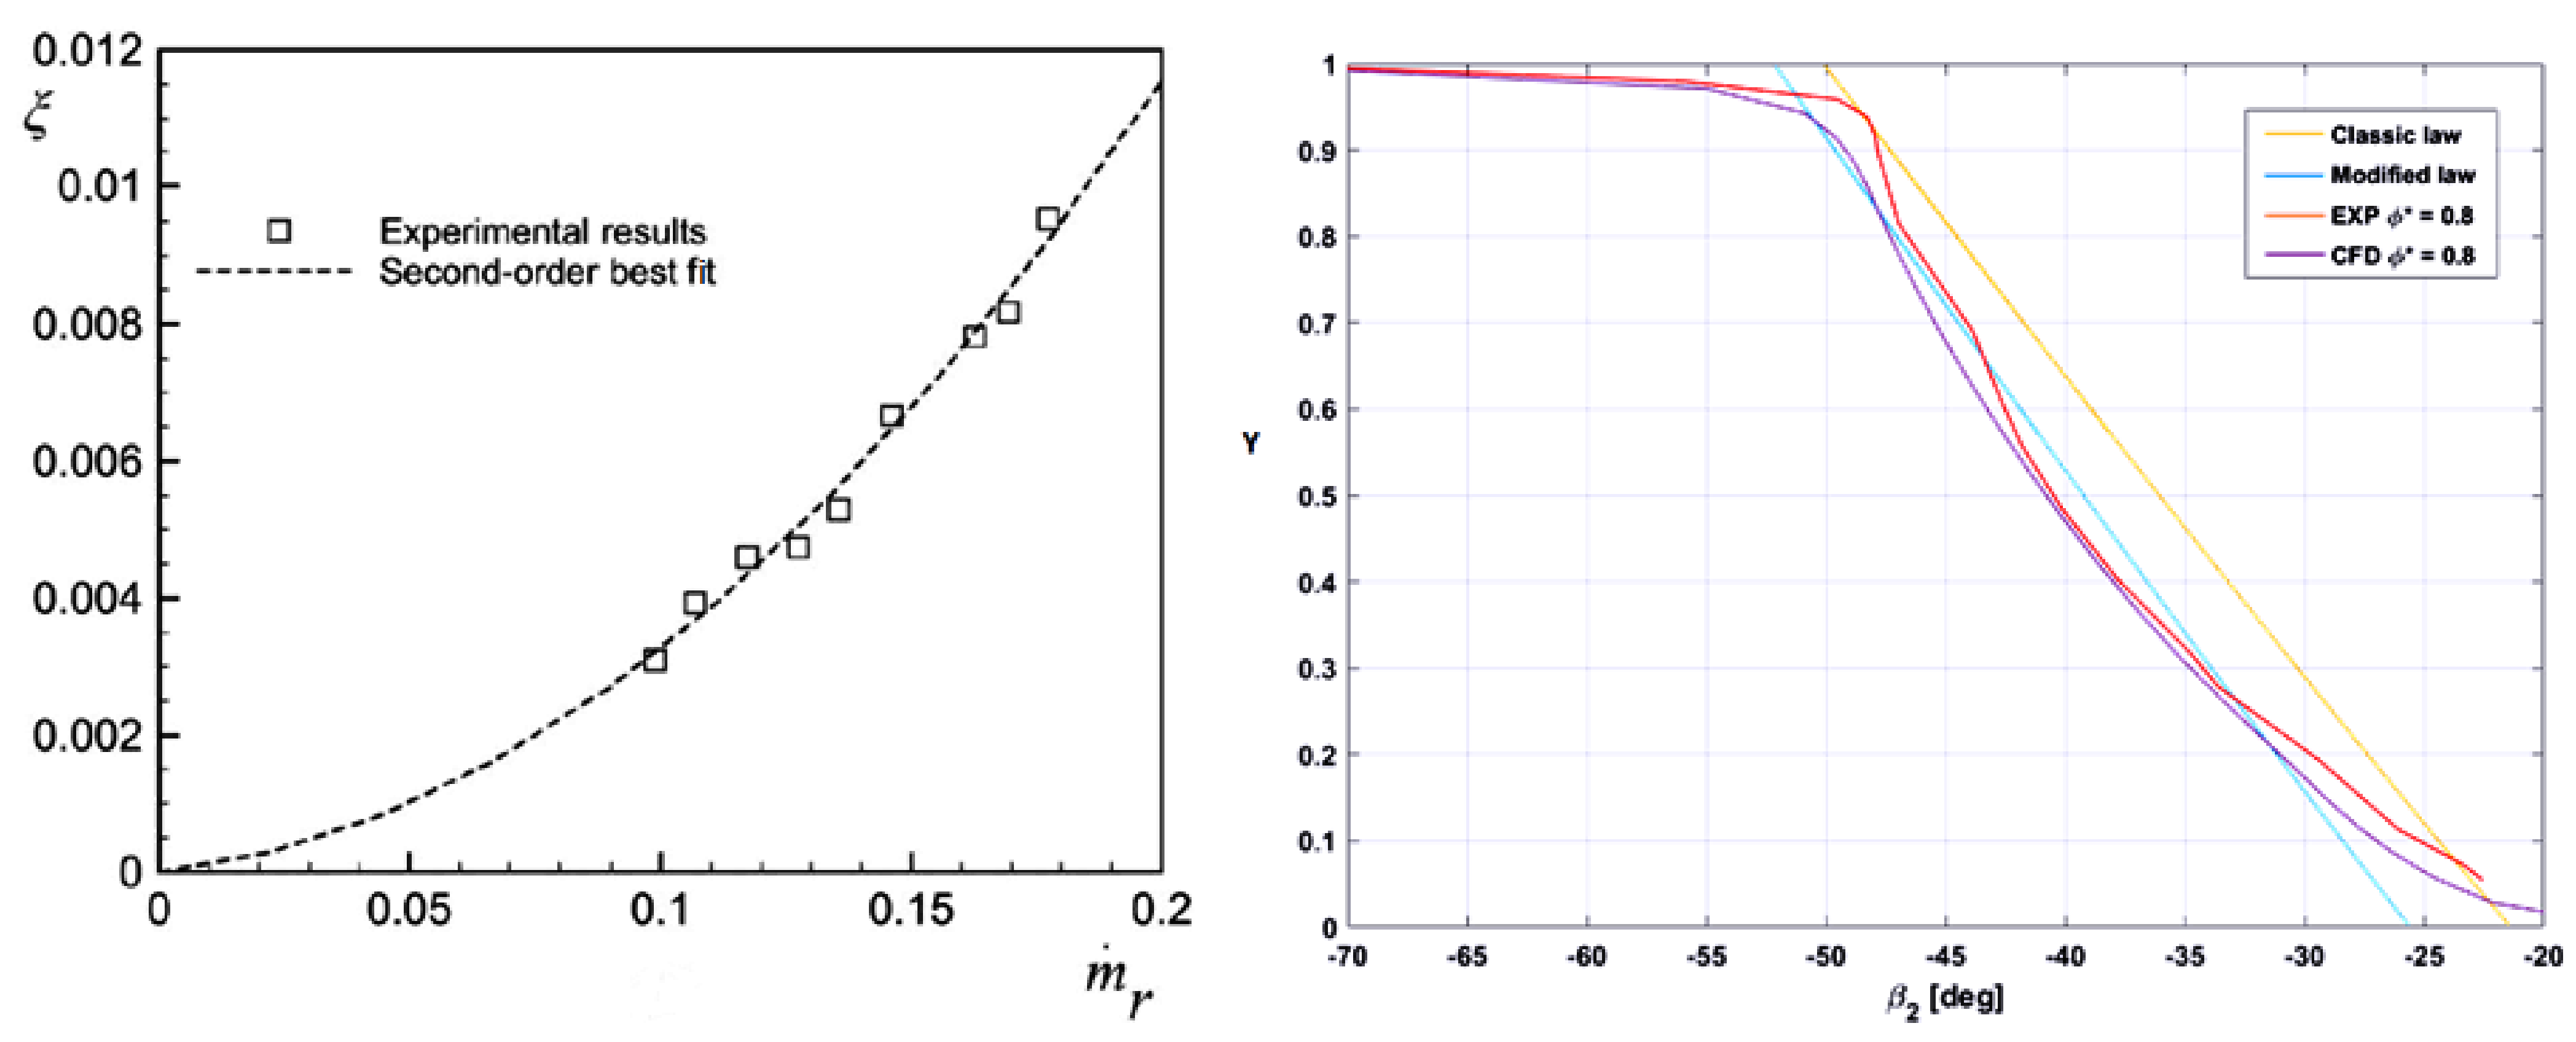
  • A loss correlation for the fan stage, expressed as a function of massflow rate with a second-order polynom;
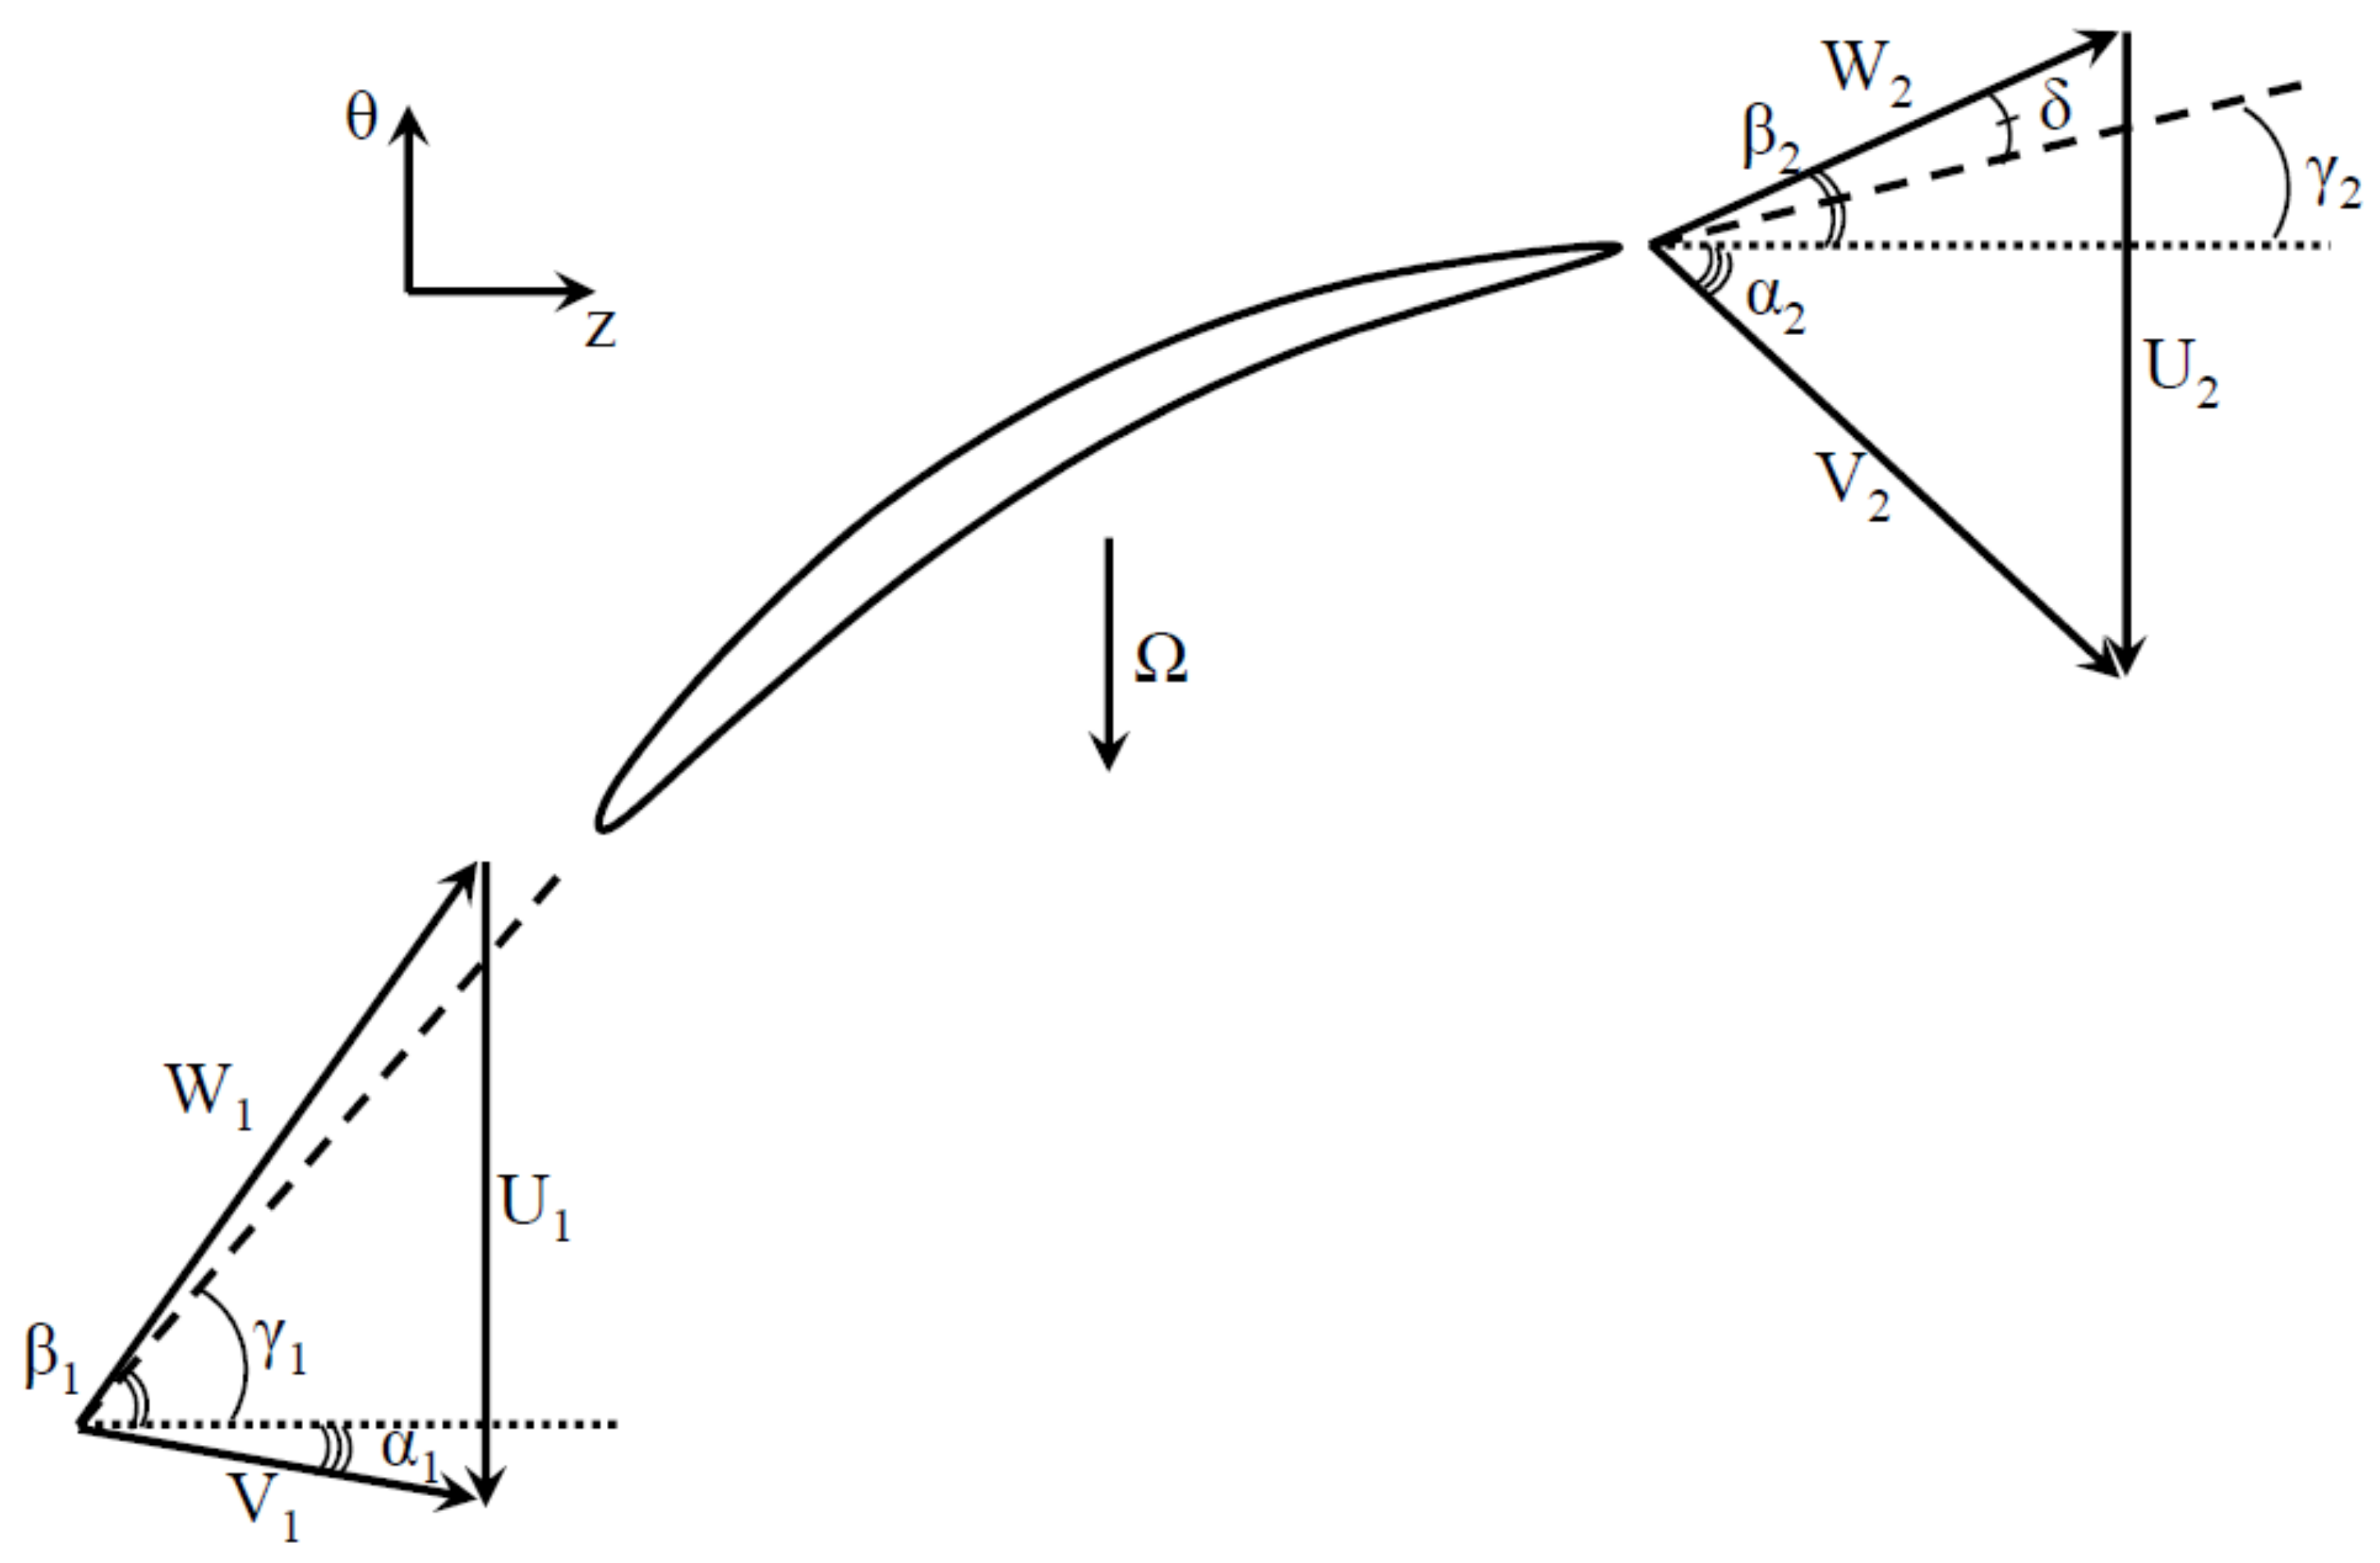
  • A modification of McKenzie’s original law (Equation (3)) for flow deviation angle at the rotor outlet [29], based on measured radial profiles (Equation (4)). θ c and σ refer to the blade camber and solidity, respectively. This correlation is used in the following for both presented operating points, although it should ideally be adapted to the operating conditions.
All radial velocity components are neglected. No radial equilibrium is prescribed at the outlet, which means that no radial flow redistribution is taking place. This point can be limiting, especially for off-design operating points, but as discussed by Cousins [30], it is particularly difficult to implement and has been put on hold for now.
Figure 3 introduces the notations used in the following to describe the velocity triangles at the rotor LE and TE. In order to apply this model to the fan stage, two 2D meshes are created to represent the rotor LE and TE sections, as illustrated in Figure 4. In line with the principle of parallel compressors, there is no interaction between a mesh cell and its neighbors. In the following, all the quantities are mass-averaged, but in case some have to be area-averaged, the spatial discretization ensures that the surface of all the cells is the same, in order to not create an unwanted geometric weighting. In the present work, the 2D mesh is composed of 64 and 360 cells in the radial and circumferential directions, respectively. For each cell, the method follows the steps below:
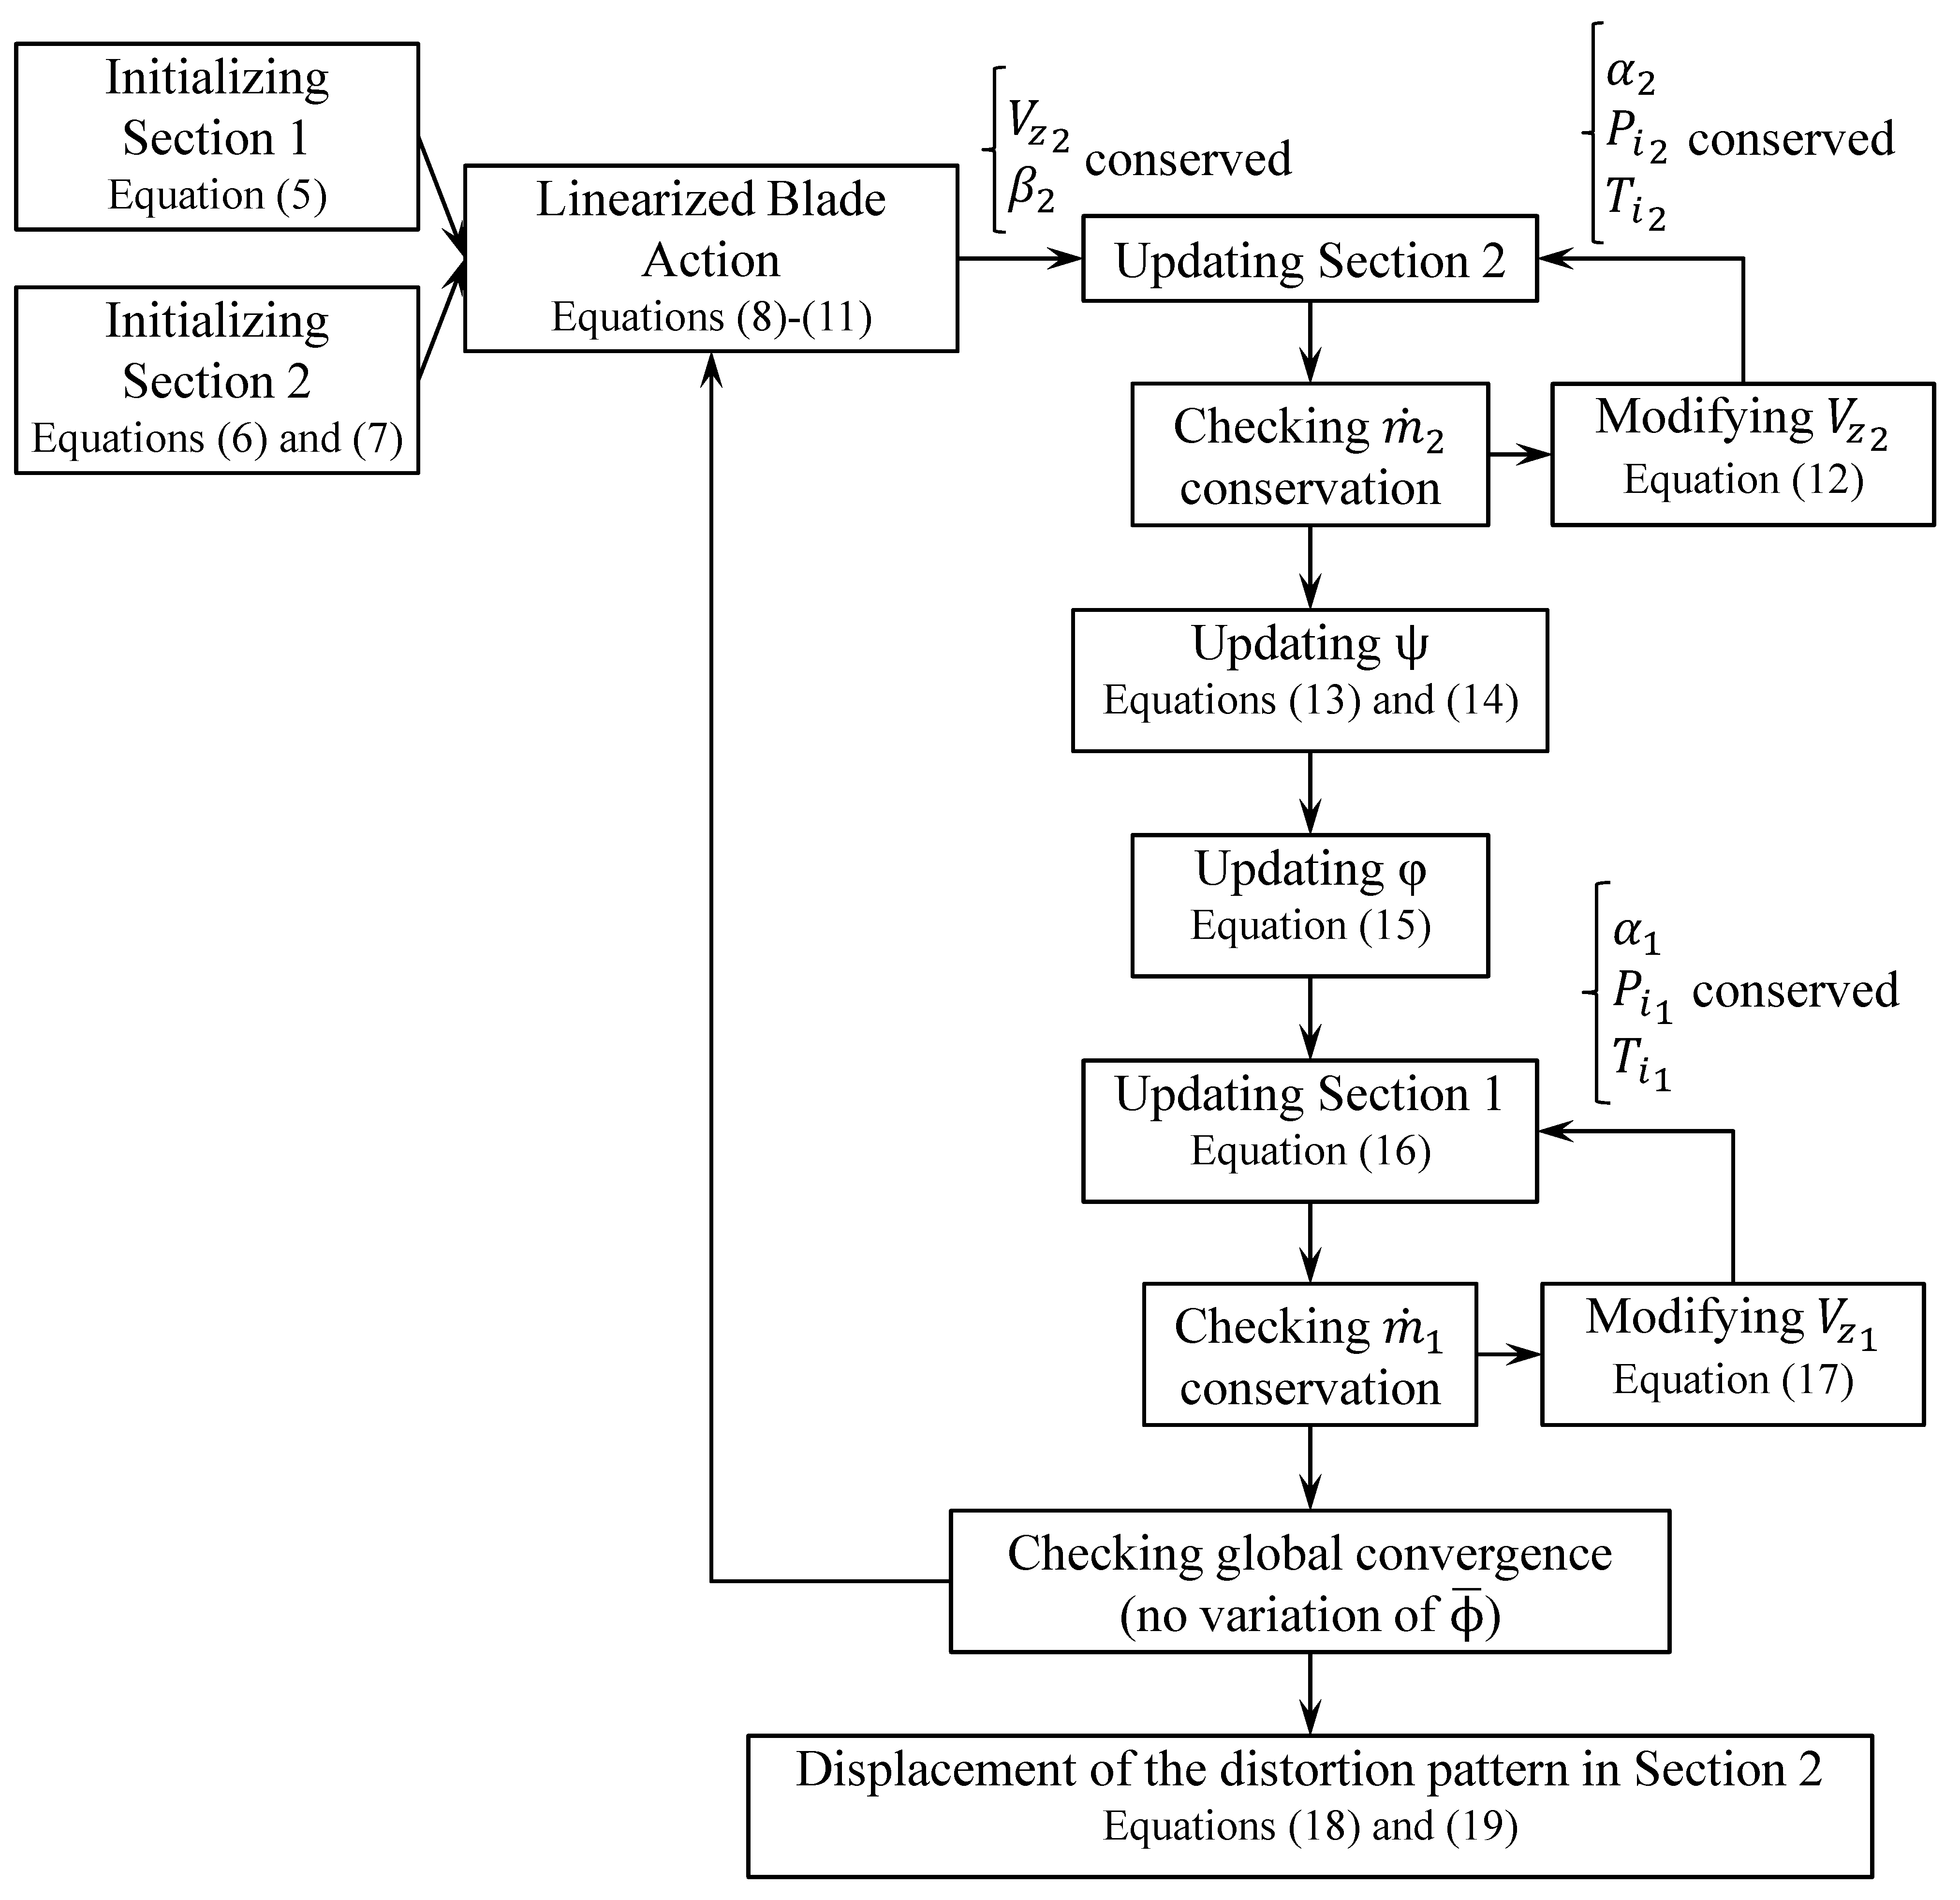
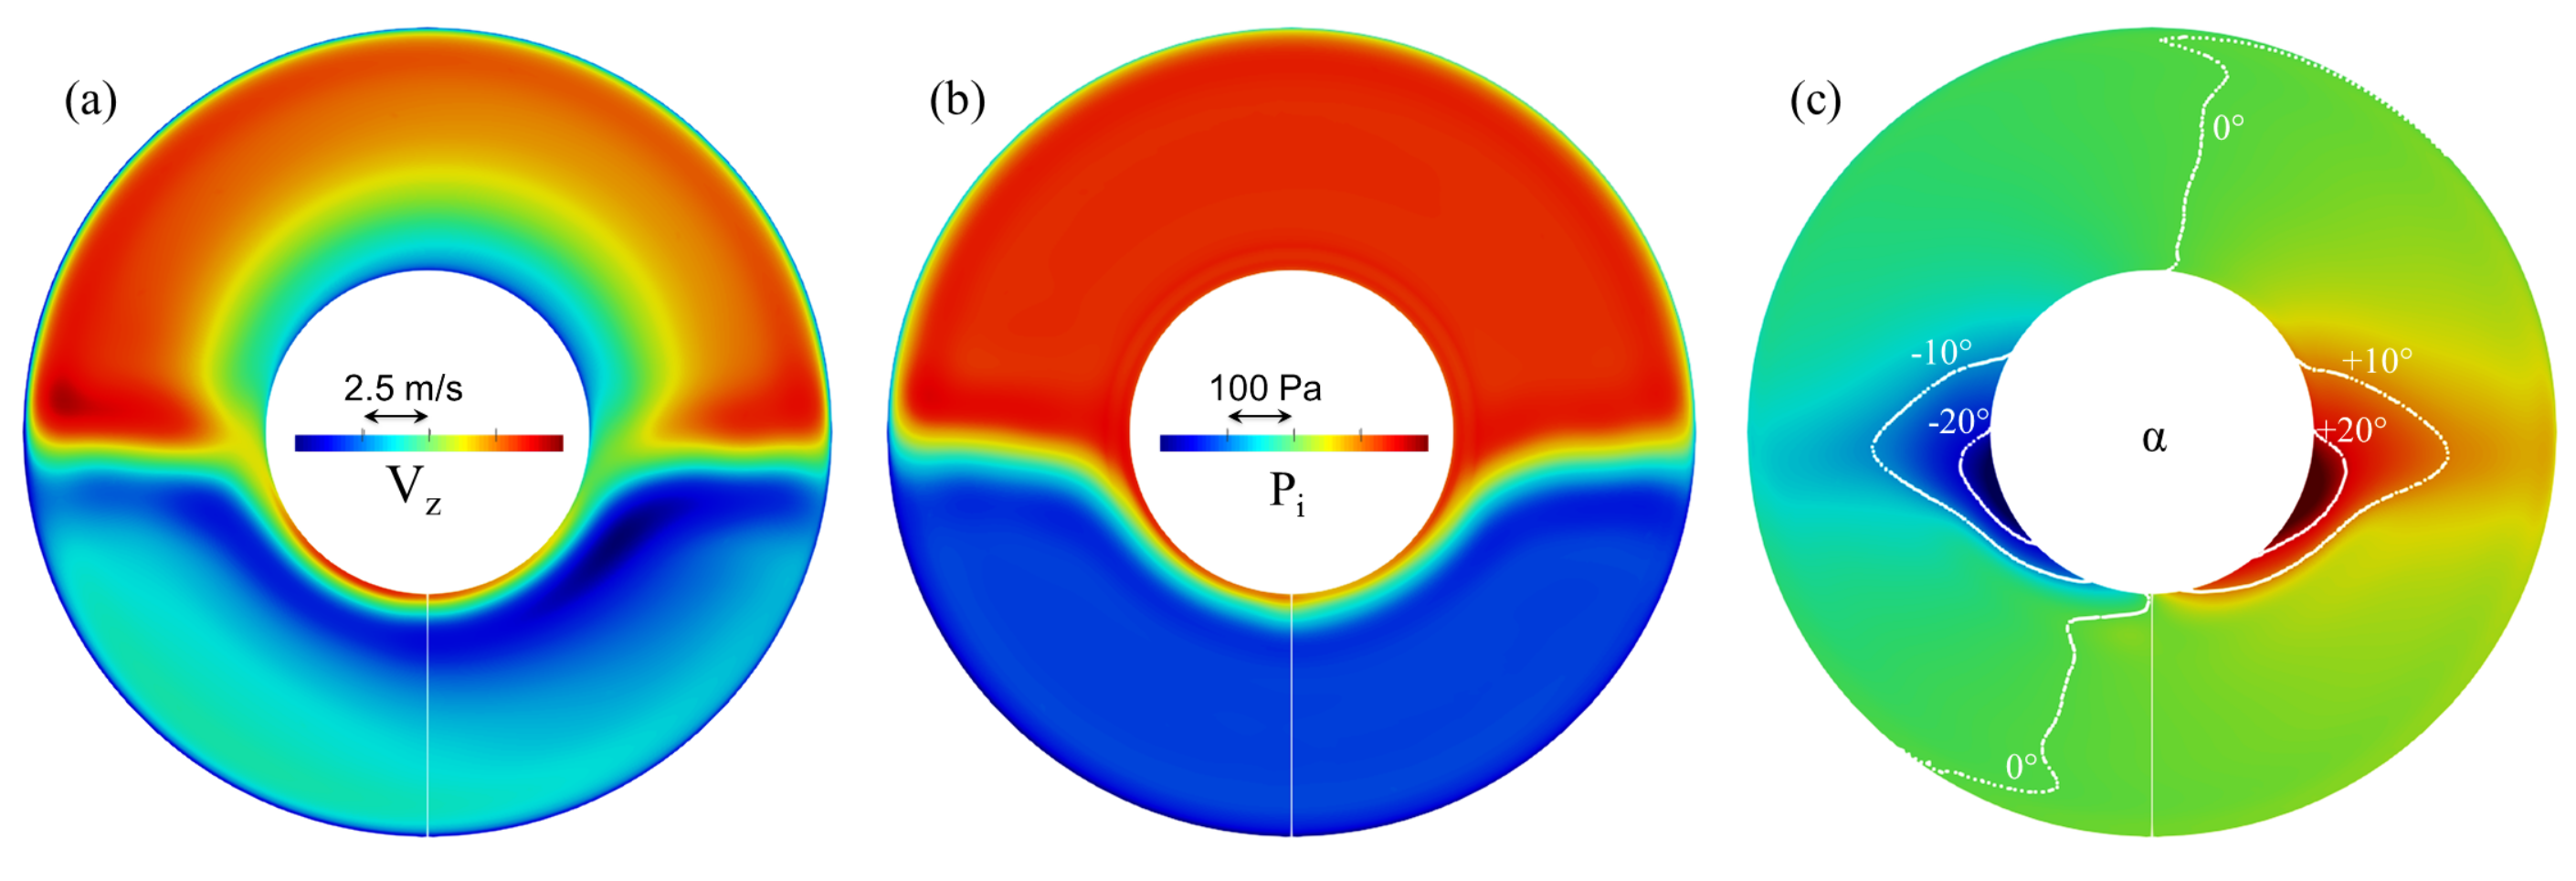
  • Section 1 is initialized by sampling URANS results for four quantities: V z , P i , T i , α (Figure 8 and 9) and the velocity triangles in Section 1 are calculated. Indeed, URANS maps are coherent with experimental ones (see, for example, Figure 10 for the upstream swirl angle α ) and enable the use of an adequate 2D mesh while importing the exact same boundary conditions at the rotor LE for a proper comparison to 3D CFD. Section 2 is initialized by calculating the rotor relative outlet angle β 2 thanks to the modified McKenzie’s law for flow deviation (Equation (5)). The axial velocity V z 2 is initialized using massflow conservation for an incompressible flow (Equation (4)).
  • The loading coefficient ψ of the fan is calculated using a simplified analytical model (Equations (6)–(9)), valid under certain assumptions (see [31]);
  • Section 2 is updated accordingly: keeping V z 2 and β 2 constant, accounting for pressure loss and modifying the velocity triangles. The massflow rate in Section 2 is computed and V z 2 is corrected until massflow conservation is reached (Equation (10));
  • ψ is re-evaluated based on Euler’s theorem (Equations (11) and (12)) and ϕ is updated using the same value of n as in step 2;
  • Section 1 is updated using the new value of ϕ (Equation (14)). The massflow rate in Section 1 is computed and V z 1 is corrected until massflow conservation is reached (Equation (15));
  • ϕ is mass-averaged in Section 1 (Equation (19)) and steps 2 to 6 are repeated until convergence is reached;
  • For each radius, a mean fluid particle passage time and circumferential displacement are calculated (Equations (16)–(18)), which reshapes the resulting field in Section 2.
    δ M c K o r i g i n a l = 1.1 + 0.31 θ c σ 1 3
    δ M c K m o d i f i e d = 1.1 + 0.43 θ c σ 1 4
Figure 5 depicts the associated workflow. m ˙ o b j refers to the target massflow rate, imposed from measurements or CFD results. X ˜ represents the mass-averaged value of quantity X along a given annulus and depends on the radius. X ¯ represents the mass-averaged value of X in the whole 2D section. As mentioned by Valencia [32], although this method is very basic, it has some advantages, such as dealing with any distortion pattern, involving no pre-calculated fan performance map and requiring very low CPU resources.
ϕ = V z 1 U 2
V z 2 = V z 1 S 1 S 2
β 2 = γ 2 + δ M c K
k = V z 2 V z 1
u = R 1 R 2
n = k tan β 2 u tan α 1
ψ = 1 + n ϕ
V z 2 = V z 2 m ˙ 2 m ˙ o b j ρ 2 ¯ S 2
Δ h i = 1 2 W 1 2 W 2 2   +   V 2 2 V 1 2   +   U 2 2 U 1 2
ψ = Δ h i U 2 2
ϕ = ψ 1 n
V z 1 = ϕ U 2
V z 1 = V z 1 m ˙ 1 m ˙ o b j ρ 1 ¯ S 1
Δ t = c z 1 2 V z 1 ˜ + V z 2 ˜
Δ θ = 1 2 V θ 1 ˜ + V θ 2 ˜ r Δ t
X ˜ ( r ) = 0 2 π X ρ V z r d θ 0 2 π ρ V z r d θ
X ¯ = r h u b r t i p 0 2 π X ρ V z r d r d θ m ˙

3. Higher-Fidelity CFD Simulations

In order to evaluate the local PC approach, two types of numerical simulations are presented:
  • The first one is body force modeling (BFM), which consists of using source terms to reproduce the passage-averaged effect of the blades on the flow. Previous work already evaluated this approach in presence of an upstream flow distortion for a low-speed fan operating as a compressor [33]. This work is extended in this paper to a free windmilling operating point, keeping a simple distortion pattern at the inlet;
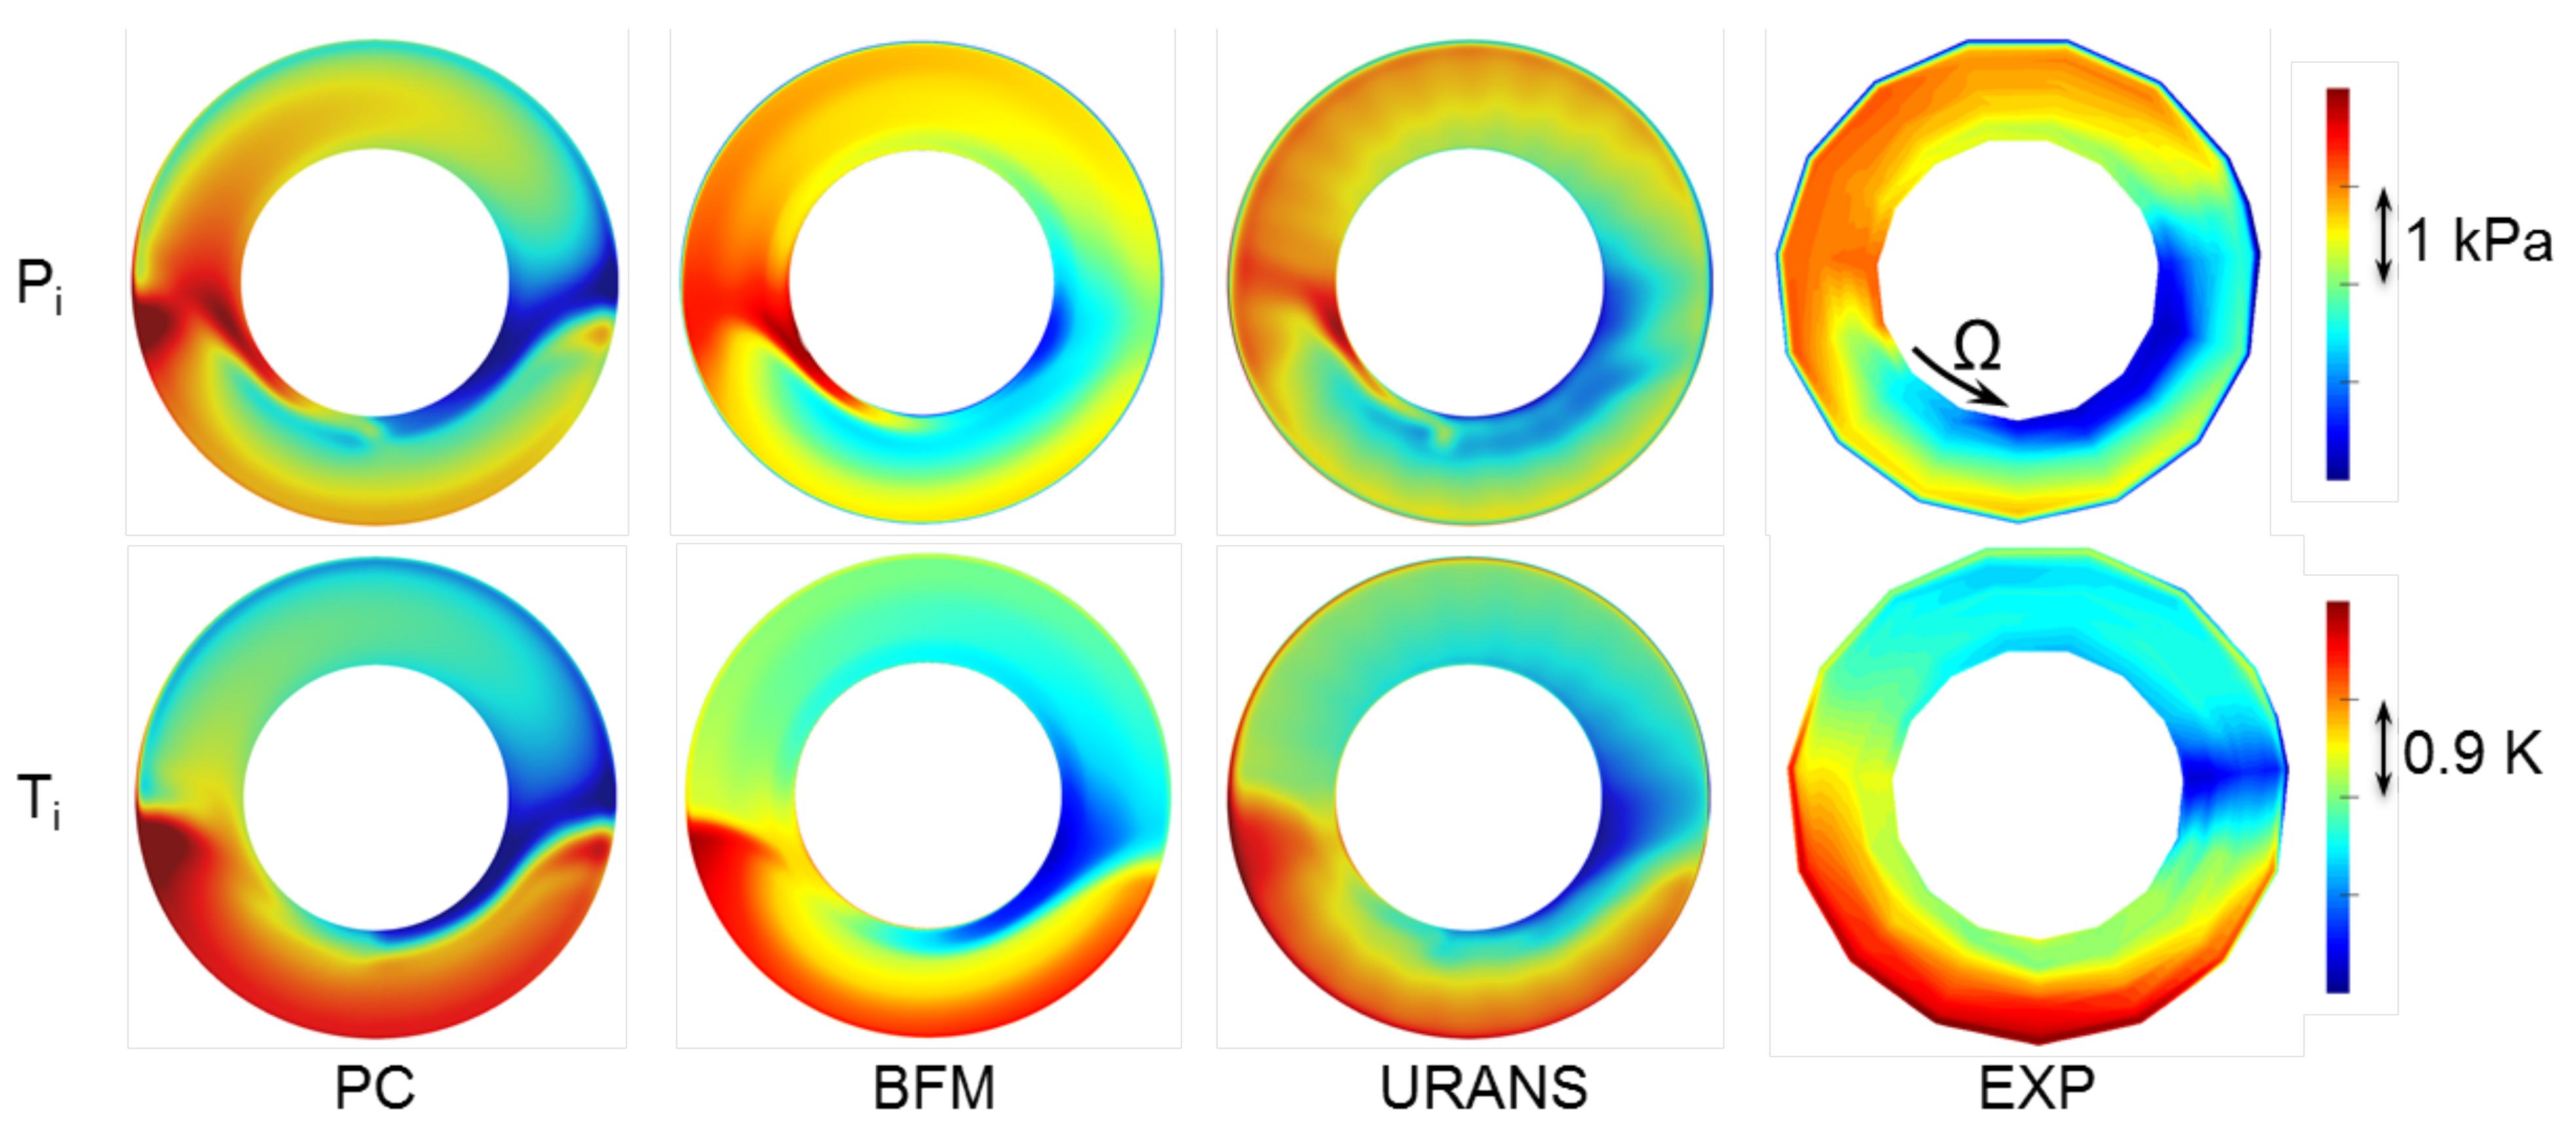
  • The finest level of fidelity relies on unsteady Reynolds-averaged Navier–Stokes simulations (URANS) performed on the whole annulus of the fan stage. It represents a reference method to capture the aerodynamics of the fan with inflow distortion, but its cost still remains prohibitive for early design phases. It is shown here to complete the experimental results and to evaluate the other approaches.

3.1. Body Force Modeling (BFM)

The general idea of BFM is to avoid directly simulating the 3D geometry of a turbomachinery blade row and to fill in the bladed areas with source terms which represent the forces exerted by the blades on the fluid. The formulation retained in the present work is based on Hall’s model [34] and extensively explained in Thollet’s work [35]. Previous work showed that it provides satisfactory results in presence of a distorted inflow compared to URANS blade simulations for a compressor-like operating point (see [33] for the details of the implementation and the analysis). This method has also been validated using Gong’s model in the case of a small turbofan under windmill conditions [36]. All the BFM simulations presented here rely on the Hall–Thollet model.

3.2. Unsteady RANS Simulations

The highest level of fidelity consists here of full-annulus URANS simulations, carried out with the elsA software. They feature two sliding mesh interfaces, between the inlet of the domain and the rotor and between the rotor and the stator. All the numerical settings are presented in [33]. Except for the turbulence modeling, this approach requires no particular hypothesis. It enables oe to capture rotor-stator interactions and interblade passage phenomena and is therefore considered here as a numerical reference.

4. Validation Test Case

The test case is a low-speed cooling fan stage, designed and produced by Safran Ventilation Systems. A 3D view of the fan stage is shown in Figure 6 and its main characteristics are given in Table 1. More information about the test rig and the instrumentation used for experimental measurements can be found in Ortolan’s PhD work [37].

5. Distortion Patterns and Operating Points
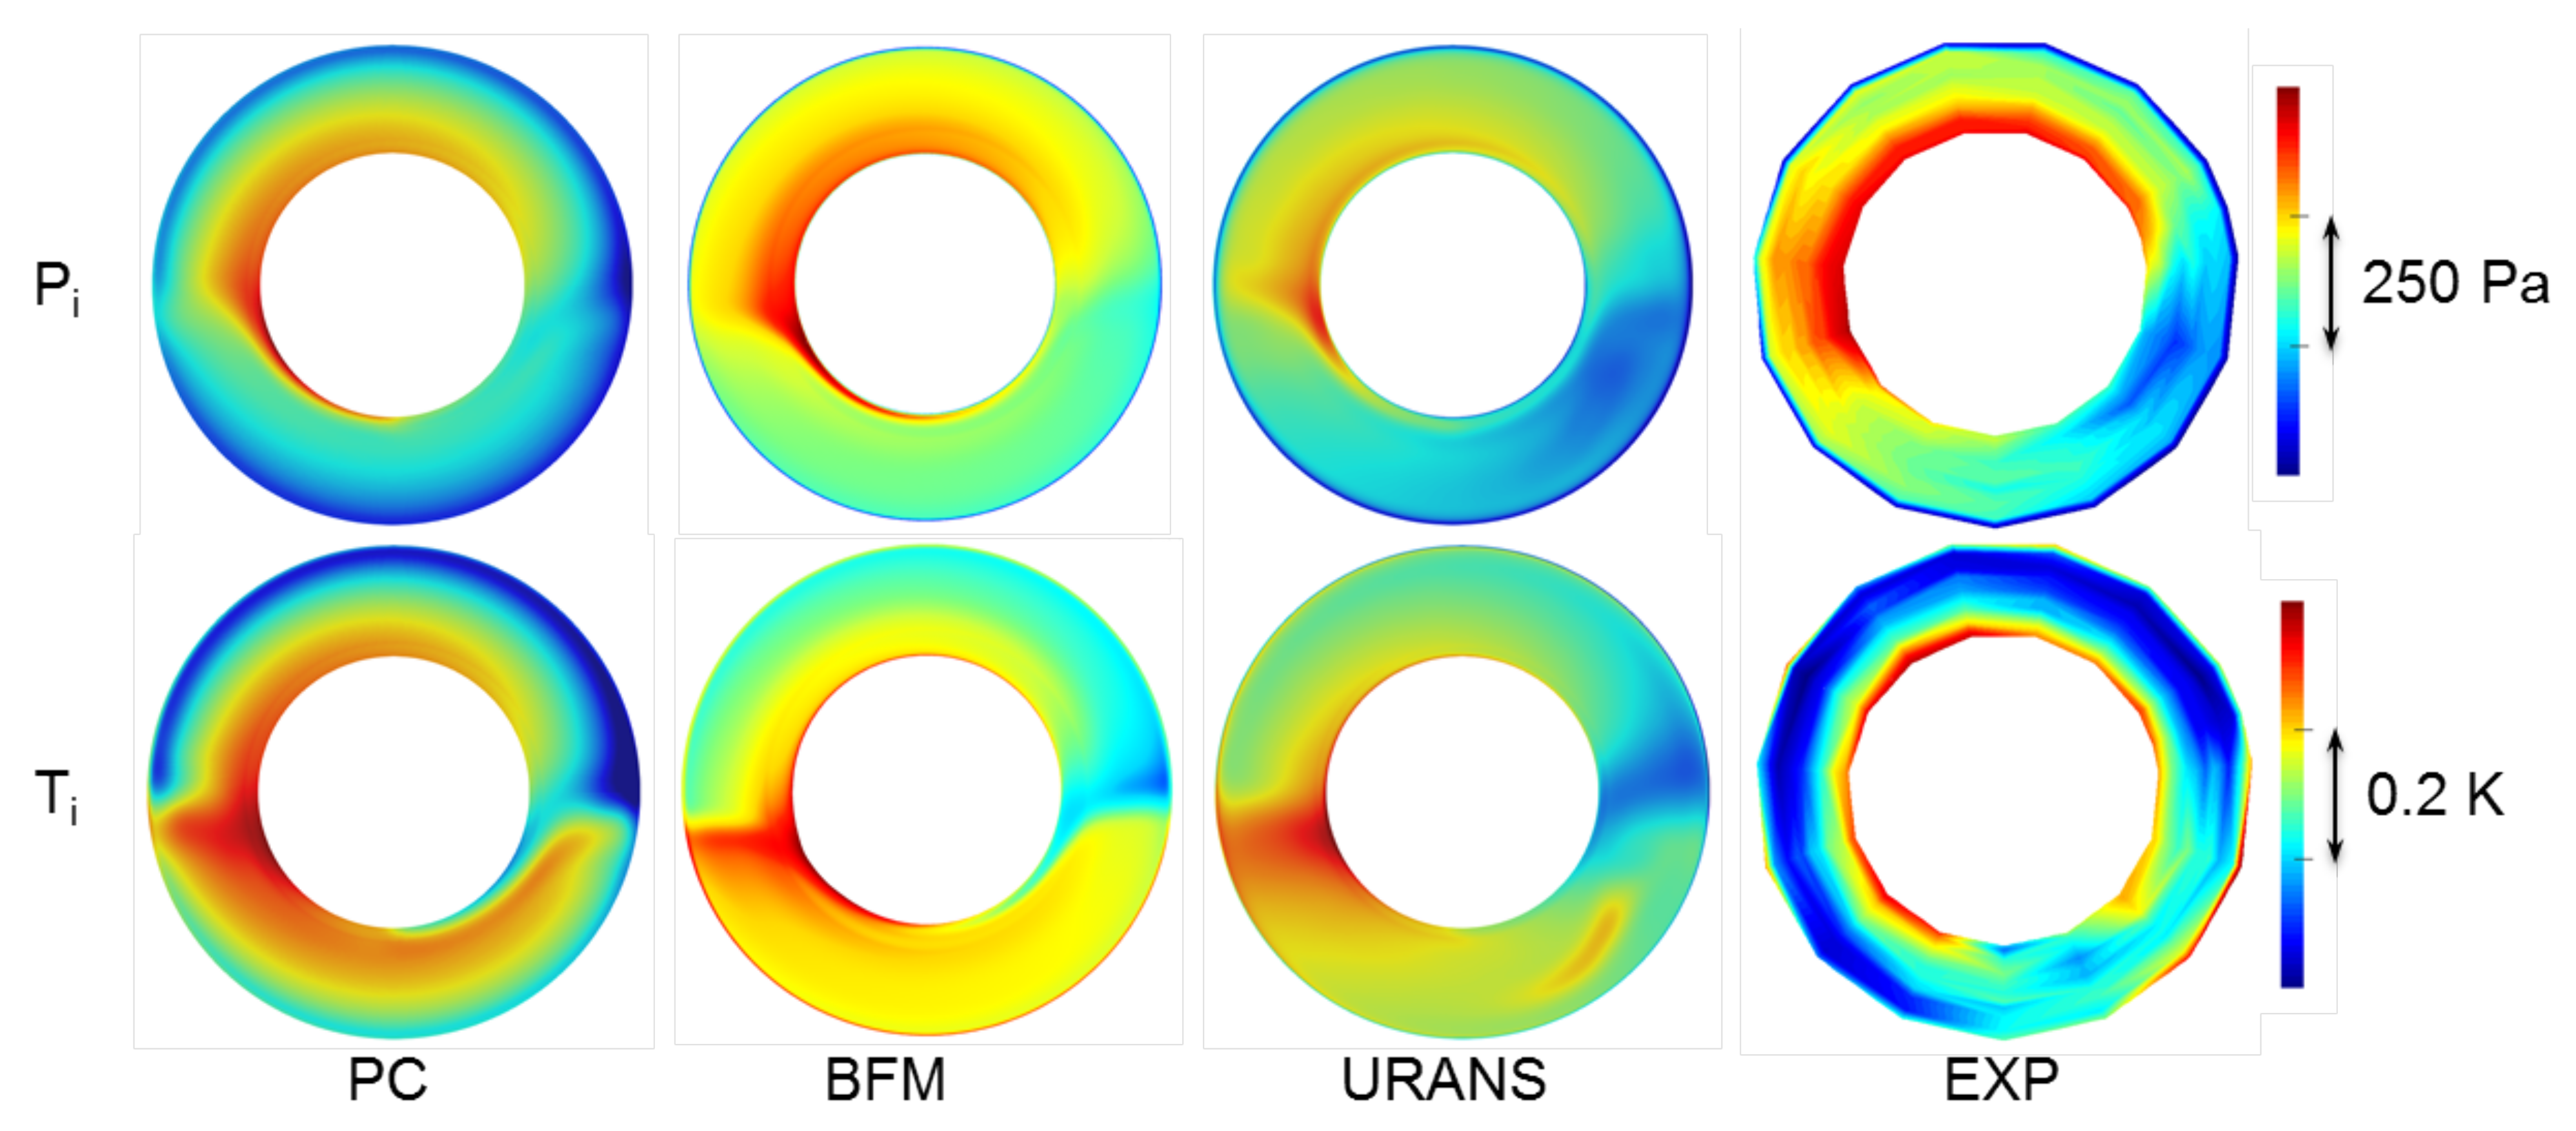
In order to create simple patterns, two distortion grids with a uniform porosity were used (Figure 7), which results in a two-zone total pressure field for upstream conditions. The 1 mm grid was associated with a high mass-flow rate compressor-like operating point and led to a 1.7 % total pressure deficit, i.e., P i m i n P i m a x = 0.983 . The 2.5 mm grid was associated with free windmill and led to a 0.3 % total pressure deficit, i.e., P i m i n P i m a x = 0.997 . The combination of these operating conditions and these distortion grids was chosen in order not to operate too close to the fan stability limit and to not create too much aerodynamic blockage. The last situation actually corresponds to severe off-design flow conditions, possibly representative of a hybrid-electric aircraft configuration if a battery was to be reloaded during a descent flight phase—for example, the rotor operating as a turbine in that case. Such a combination of both windmilling regime and non-uniform upstream flow is currently not documented in the literature.
Figure 8 and Figure 9 show the distortion maps extracted from the URANS results at the rotor LE. They are used as inputs to apply the local parallel compressor model as previously described. Although the targeted distortion aims at creating a total pressure deficit, a non-negligible swirl also exists near the hub in this section (Figure 10), attributed to the combination of the high radial curvature (see the front bulb in Figure 6) and the azimuthal pressure gradients at the 180 grid extremities. This point is discussed in the last paragraph.

6. Results

BFM simulations are parallelized with 64 cores and URANS simulations with 512 cores, both using up-to-date CPU performance. Table 2 gives typical user times corresponding to the three approaches. The next paragraphs compare the results for the two sets of operating conditions.

6.1. Compressor-Like Operating Point

Table 3 compares the prediction of global performance for the fan stage operating as a compressor: total-to-total pressure ratio π , isentropic efficiency η , total and static pressure rises across the stage Δ P i , Δ P . These figures are not available from experimental results, as well as local values are not available downstream of the stator row. For a preliminary design phase, the accuracy of the results and the physics captured are quite satisfactory, both with parallel compressors and body force simulations. The main weakness of PC is the absence of downstream velocity redistribution; hence, the error in the static pressure rise.
Figure 11 and Figure 12 show the stagnation pressure and temperature maps downstream of the rotor and the stator, respectively. What is shown as total temperature from the experiments is actually not directly measured but evaluated thanks to Euler’s theorem from the flow turning, the main uncertainty coming in that case from the flow angle values.

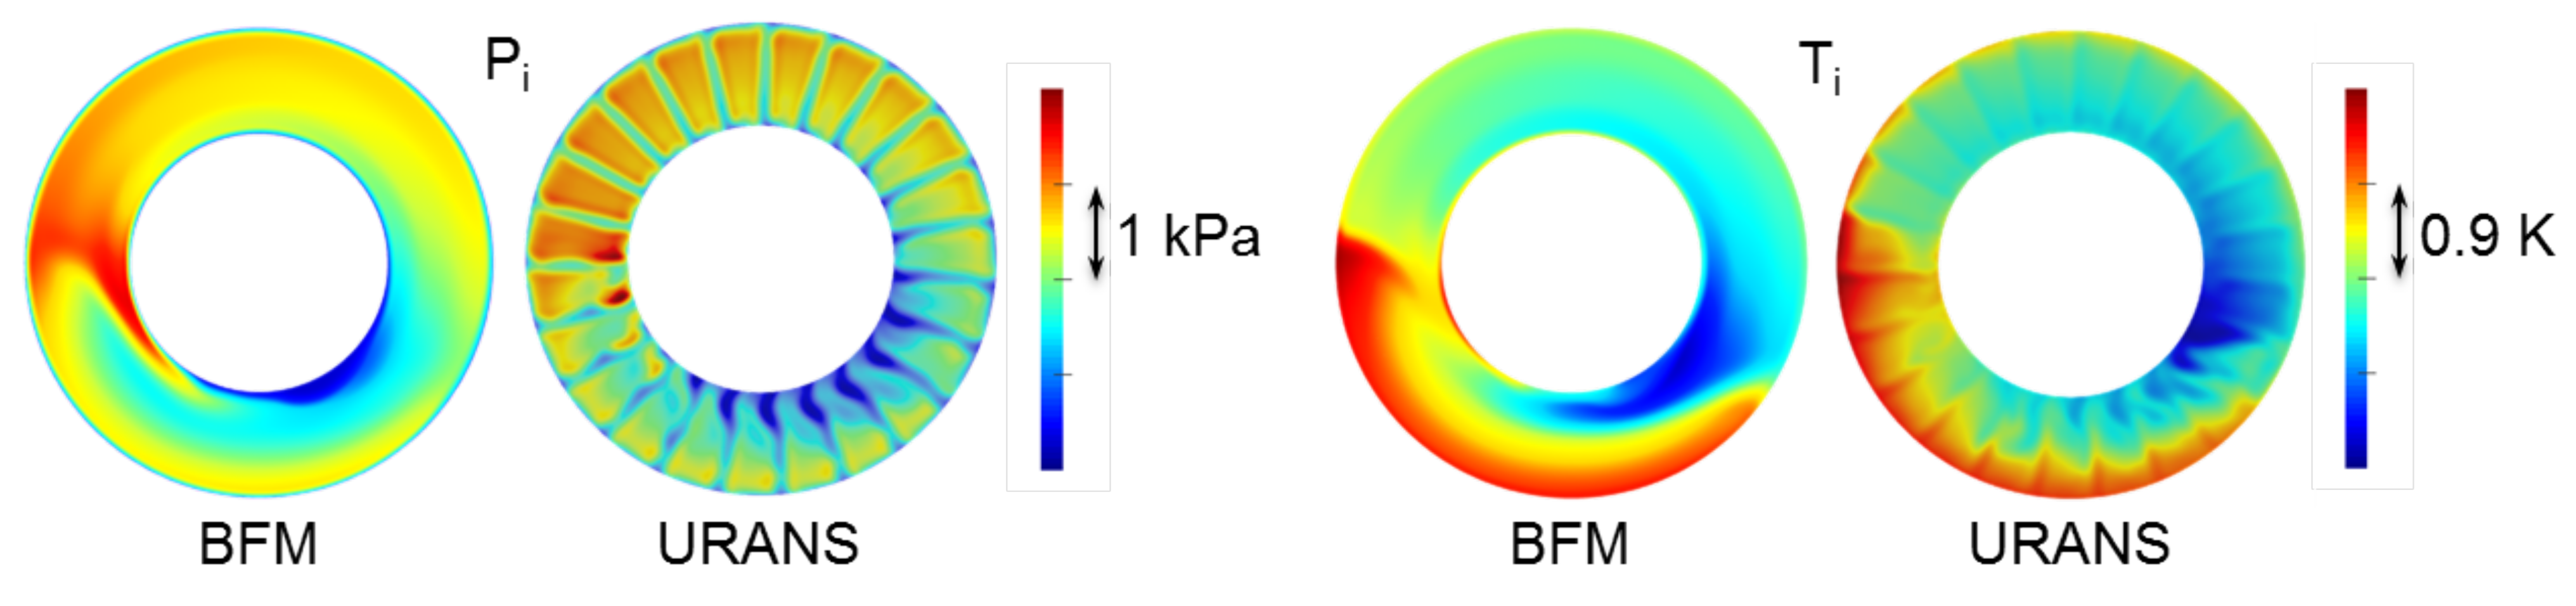
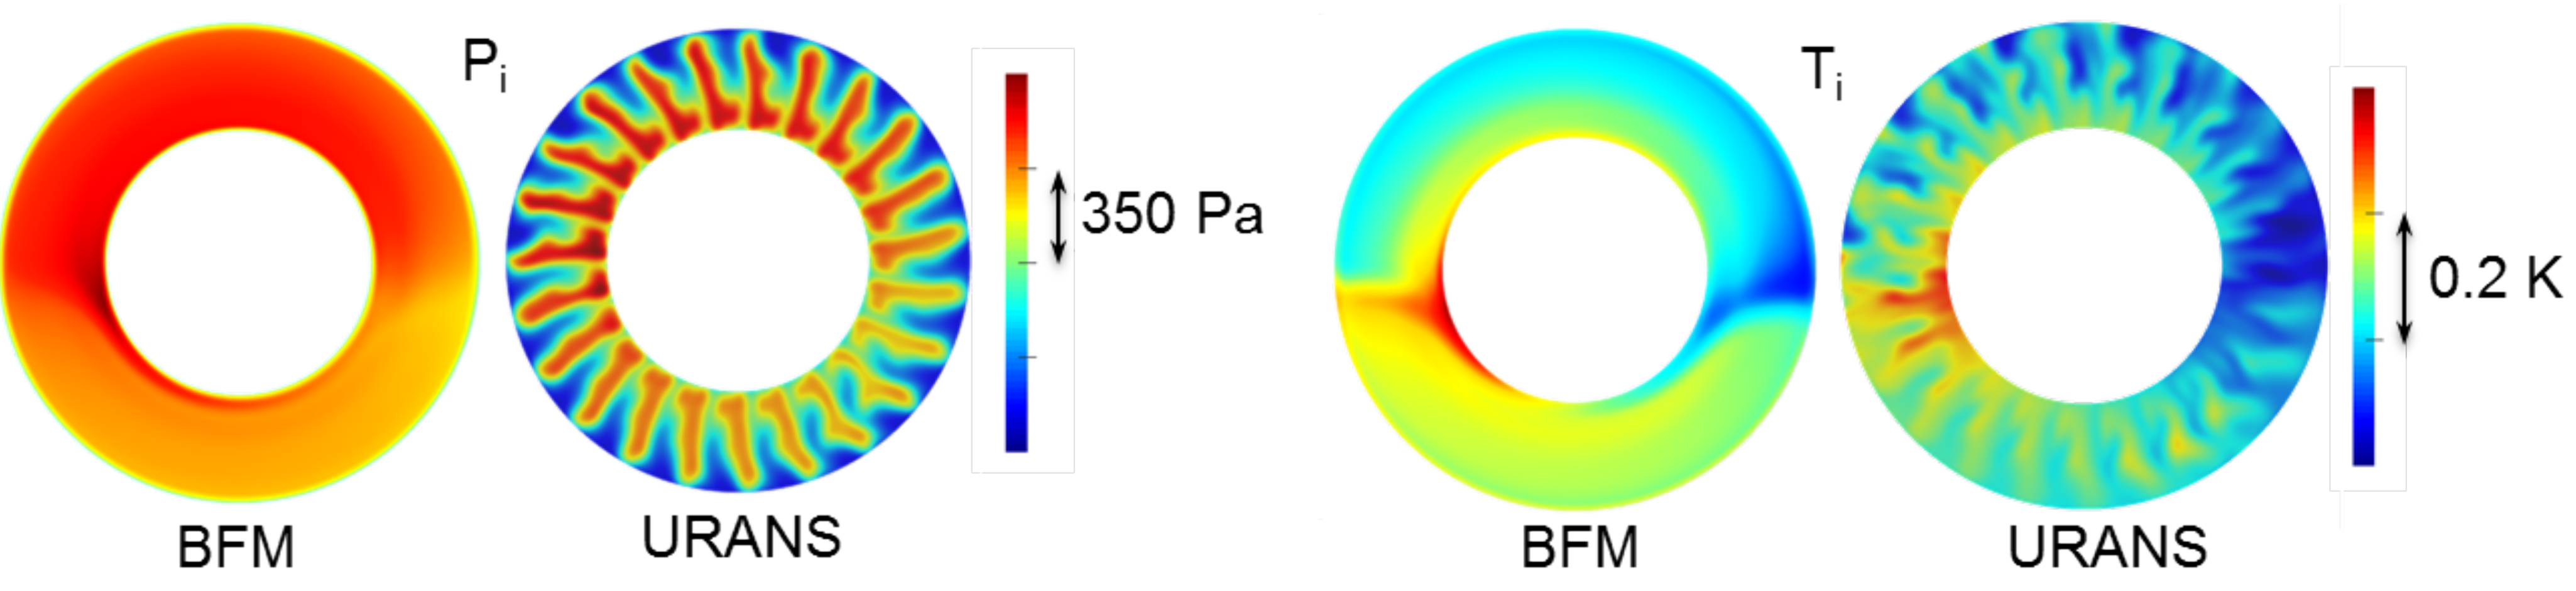
6.2. Free Windmilling Operating Point

Table 4 compares the prediction of global performance for the fan stage operating under free windmill conditions: since the global work input is close to zero, the pressure ratio is close to 1 and calculating efficiency would not make sense, either as a compressor or as a turbine.
Qualitatively, the numerical results downstream of the rotor match fairly well with the experiments for total pressure (Figure 13). The local variations of total temperature are around 1K or below, which falls in the measurement uncertainty range. Experimental results are also affected by the higher level of flow unsteadiness which naturally appears for these operating conditions, which makes the flow angle values more difficult to accurately measure.
Concerning the stator (Figure 14), a notable discrepancy can be seen between the URANS and BFM results, despite the loss calibration. Indeed, the off-design term added in the parallel force globally increases the loss level, but not enough to account for 3D effects here. In the URANS results, each stator vane is massively separated at the LE, due to severe flow under-incidence, and the wakes are much thicker than for the compressor-like operating point. A detailed description of the flow topology at free windmill is given by Courty-Audren et al. [38]. An interesting update of loss correlations at high negative incidence has recently been published [39,40] and could be useful in future work to improve this point. However, it should be underlined that the hypotheses behind the body force approach are particularly challenged, since the flow structures observed from URANS exhibit high gradients in the blade-to-blade direction, involving smaller length scales than for the compressor-like operating point. Figure 15 shows the axial velocity component downstream of the stator (the white line is an iso-line for the medium value of each case), revealing very different spatial distributions.

6.3. Point of Attention

The previous two paragraphs show that the local parallel compressor model satisfactorily captures first order effects, provided that it is fed with correct upstream conditions. Particular attention should be paid to the upstream swirl angle, which is often neglected. In the present case, the model has been tested with uniform zero swirl and led to very different outputs (Figure 16, to be compared to Figure 11 and Figure 13). It is in fact the main difficulty in a design context: this method is efficient for what concerns the propagation of the distortion across the fan stage but requires relevant inputs to accurately characterize the upstream distortion maps.

7. Conclusions

This work introduces a low-fidelity method to tackle the prediction of fan performance under distorted inflow. It is compared with higher-fidelity simulations and experimental measurements. The main take-aways are the following:
  • The idea of the present modeling is very simple since it relies only on the fan blade geometry and on Euler’s theorem;
  • Concerning the fan behavior, this tool can be used without additional inputs. However, a finer customization is possible, extracting loss or deviation calibrations from measurements or higher-fidelity CFD, for example. If this approach is to be used during an early design phase, the explored design space must be previously delimited, so that these inputs are reliable enough.
  • Although the parallel compressor model can be considered as rather basic, it proves to be sufficient to provide relevant physical insight and to correctly quantify the impact of distortion on the performance near the design operating conditions;
  • As could be expected, the most challenging point comes with off-design conditions and this part of the modeling can be improved;
  • The use of the new formulation itself comes with a negligible CPU cost, provided that the upstream distortion maps are available.
This method provides an interesting alternative to avoid long and expensive simulations, which makes it compatible with a preliminary design phase. It can be combined with extra data and enriched in many ways. However, in addition to improving the modeling of individual components, a major perspective to increase the level of accuracy in global performance prediction remains the coupling of such an aerodynamic method with a performance tool at the system level, as recently illustrated by Pokhrel et al. [41], Lopez de Vega et al. [42] or Kolias et al. [43], so that aircraft design can beneficiate from an improved modeling of the propulsive subsystem, even for complex innovative configurations.

Author Contributions

Analytical investigation, N.B. and E.B.; numerical investigation, Y.B.; experimental validation, N.B.; supervision, X.C. All authors have read and agreed to the published version of the manuscript.

Funding

This research was funded by Safran Group.

Institutional Review Board Statement

Not applicable.

Informed Consent Statement

Not applicable.

Data Availability Statement

Not applicable.

Acknowledgments

This work was granted access to the HPC resources of CINES under the allocation 2019-A0072A06879 made by GENCI and to the HPC resources of CALMIP Supercomputing Center under the allocation 2019-P18021. The authors are grateful to Safran Ventilation Systems for the successful collaboration in the low-speed fan domain and to Safran Group for funding this study, which is part of the joint research initiative AEGIS engaged with ISAE-SUPAERO. Francesco Salvatori’s contribution during his research project about parallel compressors at ISAE-SUPAERO is also acknowledged.

Conflicts of Interest

The authors declare no conflict of interest.

Abbreviations

The following abbreviations are used in this manuscript:
BLIBoundary Layer Ingestion
CFDComputational Fluid Dynamics
LELeading Edge
TETrailing Edge
PCParallel Compressors
BFMBody Force Modeling
RANSReynolds-Averaged Navier–Stokes
URANSUnsteady Reynolds-Averaged Navier–Stokes
Ppressure
Ttemperature
Wrelative velocity
Vabsolute velocity
Urotational speed
ρ density
ϕ flow coefficient
ψ loading coefficient
δ local deviation angle
π pressure ratio
η isentropic efficiency
m ˙ massflow rate
Ssection surface
α absolute flow angle
β relative flow angle
c z axial chord length
θ c blade camber
σ blade solidity
γ blade metal angle
Vabsolute velocity
h / H relative span height
x, y, zcartesian coordinates
z, r, θ      cylindrical coordinates
istagnation quantity
1, 2relative to the rotor LE, TE sections

References

  1. Bijewitz, J.; Seitz, A.; Hornung, M. A review of recent aircraft concepts employing synergistic propulsion-airframe integration. In Proceedings of the 30th Congress of the International Council of the Aeronautical Sciences, Daejeon, Korea, 25–30 September 2016. [Google Scholar]
  2. Welstead, J.; Felder, J.L. Conceptual design of a single-aisle turboelectric commercial transport with fuselage boundary layer ingestion. In Proceedings of the 54th AIAA Aerospace Sciences Meeting, San Diego, CA, USA, 4–8 January 2016; p. 1027. [Google Scholar]
  3. Bowman, C.L.; Felder, J.L.; Marien, T.V. Turbo-and Hybrid-electrified aircraft propulsion concepts for commercial transport. In Proceedings of the 2018 AIAA/IEEE Electric Aircraft Technologies Symposium (EATS), Virtual, 10–12 August 2018; pp. 1–8. [Google Scholar]
  4. Hall, D.K.; Dowdle, A.; Gonzalez, J.; Trollinger, L.; Thalheimer, W. Assessment of a boundary layer ingesting turboelectric aircraft configuration using signomial programming. In Proceedings of the 2018 Aviation Technology, Integration, and Operations Conference, Atlanta, GA, USA, 25–29 June 2018; p. 3973. [Google Scholar]
  5. Giannakakis, P.; Maldonado, Y.B.; Tantot, N.; Frantz, C.; Belleville, M. Fuel burn evaluation of a turbo-electric propulsive fuselage aircraft. In Proceedings of the AIAA Propulsion and Energy 2019 Forum, Virtual, 19–22 August 2019; p. 4181. [Google Scholar]
  6. Fernández, A.M.; Smith, H. Effect of a fuselage boundary layer ingesting propulsor on airframe forces and moments. Aerosp. Sci. Technol. 2020, 100, 105808. [Google Scholar] [CrossRef]
  7. Schmollgruber, P.; Donjat, D.; Ridel, M.; Cafarelli, I.; Atinault, O.; François, C.; Paluch, B. Multidisciplinary design and performance of the ONERA Hybrid Electric Distributed Propulsion concept (DRAGON). In Proceedings of the AIAA Scitech 2020 Forum, Virtual, 11–21 January 2020; p. 0501. [Google Scholar]
  8. Habermann, A.L.; Gokhale, A.; Hornung, M. Numerical investigation of the effects of fuselage upsweep in a propulsive fuselage concept. CEAS Aeronaut. J. 2021, 12, 173–189. [Google Scholar] [CrossRef]
  9. Pearson, H.; McKenzie, A. Wakes in axial compressors. Aeronaut. J. 1959, 63, 415–416. [Google Scholar] [CrossRef]
  10. Reid, C. The Response of Axial Flow Compressors to Intake Flow Distortion; American Society of Mechanical Engineers: New York, NY, USA, 1969; Volume 79832. [Google Scholar]
  11. Goethert, B.; Reddy, K. Unsteady Aerodynamics of Rotor Blades of a Compressor under Distorted Flow Conditions (Interference Effect between Oscillating and Distorted Inlet Flow on Compressor Stall); Cranfield University: Bedford, UK, 1971. [Google Scholar]
  12. Melick, H., Jr. Analysis of Inlet Flow Distortion and Turbulence Effects on Compressor Stability; Ames Research Center: Moffett Field, CA, USA, 1973.
  13. Kimzey, W. An Analysis of the Influence of Some External Disturbances on the Aerodynamic Stability of Turbine Engine Axial Flow Fans and Compressors; Technical Report; Arnold Engineering Development Center: Murfreesboro, TN, USA, 1977. [Google Scholar]
  14. Mazzawy, R.S. Multiple Segment Parallel Compressor Model for Circumferential Flow Distortion. J. Eng. Power 1977, 99, 288–296. [Google Scholar] [CrossRef]
  15. Hynes, M. Improvement of the parallel compressor model by consideration of unsteady blade aerodynamics. In Proceedings of the Propulsion and Energetics 68th (A) Specialists’ Meeting, AGARD, Munich, Germany, 10–12 September 1987; Volume 400. [Google Scholar]
  16. Hynes, T.; Chue, R.; Greitzer, E.; Tan, C. Calculations of inlet distortion induced compressor flowfield instability. In Proceedings of the Propulsion and Energetics 68th (A) Specialists’ Meeting, AGARD, Munich, Germany, 10–12 September 1987; Volume 400. [Google Scholar]
  17. Hale, A.; Davis, M. DYNamic turbine engine compressor code (DYNTECC)-theory and capabilities. In Proceedings of the 28th Joint Propulsion Conference and Exhibit, Nashville, TN, USA, 6–8 July 1992; p. 3190. [Google Scholar]
  18. Shahrokhi, K.; Davis, J.M. Application of a modified dynamic compression system model to a low aspect ratio fan-effects of inlet distortion. In Proceedings of the 33rd Aerospace Sciences Meeting and Exhibit, Reno, NV, USA, 9–12 January 1995; p. 301. [Google Scholar]
  19. Davis, R.L.; Yao, J. Computational approach for predicting stall inception in multistage axial compressors. J. Propuls. Power 2007, 23, 257–265. [Google Scholar] [CrossRef]
  20. Fredrick, N.; Davis, M., Jr. Investigation of the Effects of Inlet Swirl on Compressor Performance and Operability Using a Modified Parallel Compressor Model. In Proceedings of the ASME 2011 Turbo Expo: Turbine Technical Conference and Exposition, Vancouver, BC, Canada, 6–10 June 2011; Volume 54617. [Google Scholar]
  21. Davis, M.W., Jr.; Cousins, W.T. Evaluating complex inlet distortion with a parallel compressor model: Part 2—Applications to complex patterns. In Turbo Expo: Power for Land, Sea, and Air; American Society of Mechanical Engineers: New York, NY, USA, 2011; Volume 54617, pp. 13–23. [Google Scholar]
  22. Floyd, R.S., Jr.; Davis, M.W., Jr. Validation of a modified parallel compressor model for prediction of the effects of inlet swirl on compressor performance and operability. In Turbo Expo: Power for Land, Sea, and Air; American Society of Mechanical Engineers: New York, NY, USA, 2015; Volume 56628, p. V001T01A024. [Google Scholar]
  23. Escudero Saiz, A. Investigation of Analytical Models for Evaluating the Impact of Distortion on Compressor Performance and Stability [BR]-Internship. Master’s Thesis, Université de Liège, Liège, Belgium, 2020. [Google Scholar]
  24. Doulgeris, G.; Khaleghi, H.; Kalfas, A.; Pilidis, P. Development of a method for enhanced fan representation in gas turbine modeling. Int. J. Rotating Mach. 2011, 2011. [Google Scholar] [CrossRef] [Green Version]
  25. Miller, D.; Wasdell, D. Off-Design Prediction of Compressor Blade Losses; C279/87; Japan Science and Technology Agency: Tokyo, Japan, 1987; pp. 249–258.
  26. Valencia, E.; Hidalgo, V.; Nalianda, D.; Laskaridis, P.; Singh, R. Discretized Miller approach to assess effects on boundary layer ingestion induced distortion. Chin. J. Aeronaut. 2017, 30, 235–248. [Google Scholar] [CrossRef] [Green Version]
  27. Menegozzo, L.; Benini, E. Meanline calculation of surge margin loss due to inlet flow distortion. In Turbo Expo: Power for Land, Sea, and Air; American Society of Mechanical Engineers: New York, NY, USA, 2020. [Google Scholar]
  28. Budziszewski, N.; Friedrichs, J. Modelling of a boundary layer ingesting propulsor. Energies 2018, 11, 708. [Google Scholar] [CrossRef] [Green Version]
  29. McKenzie, A.B. Axial flow fans and compressors. In Aerodynamic Design and Performance; Gower Technical: Tokyo, Japan, 1997. [Google Scholar]
  30. Cousins, W.T.; Davis, M.W., Jr. Evaluating complex inlet distortion with a parallel compressor model: Part 1–Concepts, theory, extensions, and limitations. In Turbo Expo: Power for Land, Sea, and Air; American Society of Mechanical Engineers: New York, NY, USA, 2011; Volume 54617, pp. 1–12. [Google Scholar]
  31. Binder, N. Aéro-Thermodynamique des Turbomachines en Fonctionnement Hors-Adaptation; Université de Toulouse: Toulouse, France, 2016. [Google Scholar]
  32. Valencia, E.; Nalianda, D.; Laskaridis, P.; Singh, R. Propulsion system analysis using a parametric and the parallel compressor approach to model distortion in Boundary Layer Ingestion systems. Part G J. Aerosp. Eng. 2014. [Google Scholar] [CrossRef]
  33. Benichou, E.; Dufour, G.; Bousquet, Y.; Binder, N.; Ortolan, A.; Carbonneau, X. Body Force Modeling of the Aerodynamics of a Low-Speed Fan under Distorted Inflow. Int. J. Turbomach. Propuls. Power 2019, 4, 29. [Google Scholar] [CrossRef] [Green Version]
  34. Hall, D.; Greitzer, E.; Tan, C. Analysis of fan stage conceptual design attributes for boundary layer ingestion. J. Turbomach. 2017, 139, 071012. [Google Scholar] [CrossRef] [Green Version]
  35. Thollet, W. Body Force Modeling of Fan—Airframe Interactions. Ph.D. Thesis, ISAE-SUPAERO, Toulouse, France, 2017. [Google Scholar]
  36. Dufour, G.; Thollet, W. Body Force Modeling of the Aerodynamics of the Fan of a Turbofan at Windmill. In Turbo Expo: Power for Land, Sea, and Air; American Society of Mechanical Engineers: New York, NY, USA, 2016; Volume 49712, p. V02CT39A045. [Google Scholar]
  37. Ortolan, A. Aerodynamic Study of Reversible Axial Fans with High Compressor/Turbine Dual Performance. Ph.D. Thesis, ISAE-SUPAERO, Toulouse, France, 2017. [Google Scholar]
  38. Courty-Audren, S.K.; Ortolan, A.; Carbonneau, X.; Binder, N.; Challas, F. Numerical analysis of secondary flow topologies of low-speed axial fans from compressor to load-controlled windmill. In Proceedings of the 12th European Conference on Turbomachinery Fluid dynamics & Thermodynamics ETC12, Stockholm, Sweden, 3–7 April 2017. [Google Scholar]
  39. Ferrer-Vidal, L.E.; Schneider, M.; Allegretti, A.; Pachidis, V. A Loss and Deflection Model for Compressor Blading at High Negative Incidence. J. Turbomach. 2019, 141, 121001. [Google Scholar] [CrossRef] [Green Version]
  40. Righi, M.; Ferrer-Vidal, L.; Pachidis, V. Body-force and mean-line models for the generation of axial compressor sub-idle characteristics. Aeronaut. J. 2020, 124, 1–19. [Google Scholar] [CrossRef]
  41. Pokhrel, M.; Shi, M.; Ahuja, J.; Gladin, J.; Mavris, D.N. Conceptual Design of a BLI Propulsor Capturing Aero-Propulsive Coupling and Distortion Impacts. In Proceedings of the AIAA SciTech 2019 Forum, San Diego, CA, USA, 7–11 January 2019; p. 1588. [Google Scholar]
  42. López de Vega, L.; Dufour, G.; García Rosa, N. Fully Coupled Body Force–Engine Performance Methodology for Boundary Layer Ingestion. J. Propuls. Power 2021, 37, 192–201. [Google Scholar] [CrossRef]
  43. Kolias, I.; Alexiou, A.; Aretakis, N.; Mathioudakis, K. Axial Compressor Mean-Line Analysis: Choking Modelling and Fully-Coupled Integration in Engine Performance Simulations. Int. J. Turbomach. Propuls. Power 2021, 6, 4. [Google Scholar] [CrossRef]
Figure 1. Performance curve plotted in the ϕ ψ framework.
Ijtpp 06 00034 g001
Figure 2. Loss correlation (left) and modified MacKenzie’s law at rotor TE (right).
Ijtpp 06 00034 g002
Figure 3. Velocity triangles upstream and downstream of the rotor row.
Ijtpp 06 00034 g003
Figure 4. Example of coarsened mesh used for PC calculation.
Ijtpp 06 00034 g004
Figure 5. Local parallel compressor workflow.
Ijtpp 06 00034 g005
Figure 6. 3D view of the fan stage.
Ijtpp 06 00034 g006
Figure 7. Distortion grids and example of measured total pressure pattern.
Ijtpp 06 00034 g007
Figure 8. (ac) Boundary conditions used in PC model for the compressor operating point ( T i is uniform).
Ijtpp 06 00034 g008
Figure 9. (ac) Boundary conditions used in PC model at free windmill ( T i is uniform).
Ijtpp 06 00034 g009
Figure 10. Swirl angle measured at rotor LE: compressor (a) and free windmill (b).
Ijtpp 06 00034 g010
Figure 11. Total pressure (top) and total temperature (bottom) downstream of the rotor.
Ijtpp 06 00034 g011
Figure 12. Total pressure (left) and total temperature (right) downstream of the stator.
Ijtpp 06 00034 g012
Figure 13. Total pressure (top) and total temperature (bottom) downstream of the rotor.
Ijtpp 06 00034 g013
Figure 14. Total pressure (left) and total temperature (right) downstream of the stator.
Ijtpp 06 00034 g014
Figure 15. Axial velocity downstream of the stator: compressor (a) and free windmill (b).
Ijtpp 06 00034 g015
Figure 16. Total pressure and total temperature downstream of the rotor, assuming the same V z , P i , T i conditions from URANS and uniform zero swirl angle: compressor (a) and free windmill (b).
Ijtpp 06 00034 g016
Table 1. Fan stage characteristics, from [37].
Diameter D < 200 mm
Rotor blade count N R = 17
Stator blade count N S = 23
Design rotational speed Ω 12.000 rpm
Axial Mach number0.1–0.2
Table 2. Typical user time for 1 operating point with distortion.
PCBFMURANS
<10 s12 h1 week
Table 3. Relative discrepancy between URANS and lower-fidelity approaches.
m ˙ π η Δ P i Δ P
BFM—URANS + 0.6 % <0.1% + 3.2 % + 3.1 % + 1.5 %
PC—URANS 0 % + 0.1 % + 2.4 % + 6.3 % 25.9 %
Table 4. Relative discrepancy between URANS and lower-fidelity approaches.
m ˙ Δ P i Δ P
BFM—URANS 0.1 % + 51.7 % + 47.2 %
PC—URANS 0 % + 63.2 % + 50.1 %
Publisher’s Note: MDPI stays neutral with regard to jurisdictional claims in published maps and institutional affiliations.

