Article

Turbine Broadband Noise Predictions Using Linearised Frequency Domain Navier-Stokes Solvers †

by
Ricardo Blázquez-Navarro
* and
Roque Corral
Department of Fluid Mechanics and Aerospace Propulsion, School of Aeronautics and Space, Universidad Politécnica de Madrid, 28040 Madrid, Spain
*
Author to whom correspondence should be addressed.
This paper is an extended version of our contribution to the 14th European Turbomachinery Conference, Gdansk, Poland, 12–16 April 2021.
Int. J. Turbomach. Propuls. Power 2021, 6(4), 42; https://doi.org/10.3390/ijtpp6040042
Submission received: 3 August 2021 / Revised: 24 August 2021 / Accepted: 10 November 2021 / Published: 12 November 2021

Abstract

:
A linear frequency domain Navier-Stokes solver is used to retain the influence of turning, thickness, and main geometric parameters on turbine broadband noise. The methodology has been applied to predict the broadband interaction noise produced by a representative low-speed low-pressure turbine section. The differences in the spectra with respect to those yielded by state-of-the-art flat plate based methodologies are up to 6 dB. The differences are caused by multiple effects that semi-analytical methodologies do not account for. The most important are blade thickness and turning, which have been studied separately to quantify their impact on the broadband noise footprint. The influence of changing the turbine operating conditions has been discussed as well. The outlet sound pressure level scales with the third and second power of the inlet and outlet Mach number, respectively, for constant turbulence intensity, within most of the frequency range considered.

1. Introduction

Since the last decade, there has been an increasing concern regarding the impact of turbine-generated broadband noise in the context of civil aviation. Nesbitt [1] described what he considered a ’turbine noise storm’ caused by the confluence of several design choices. Namely, their reduced blade-count and solidity, the removal of acoustic liner treatments to reduce engine weight, and the reduction of noise emissions by other engine components. Nesbitt claimed that it is necessary to develop tools that can predict turbine noise with sufficient accuracy to understand its sources and reduce them in the future. Regarding turbine noise sources break-down, Serrano et al. [2] quantified experimentally the relative importance of turbine broadband noise, which can result in being dominant in many operating points and designs and hence, there is a need of industrial methods to predict it accurately. Turbulent wakes generated by a turbine row (see Figure 1) impinge on the downstream one, giving rise to acoustic waves with a broadband energy content.
While industrial predictions of fan broadband noise have been based traditionally on the flat plate response to incoming vortical disturbances, this is much less justified for turbines. This approach can be valid for plate-like shapes such as fans, but it is unclear how to define an equivalent flat plate for a turbine, and more importantly, what the accuracy of such predictions would be. Several physical effects are not modelled by flat-plate methodologies. Among them, the influence of blade thickness and blade turning stands out, which entails a relevant flow acceleration.
The effect of blade thickness on broadband noise has been studied analytically by Gershfeld [3] and Evers and Peake [4], numerically by Gill et al. [5] and Gea-Aguilera et al. [6], and experimentally by Devenport et al. [7] within the past years, to cite some examples. The most extended conclusions are that thick airfoils lead to weaker broadband noise footprints, especially at high frequencies and in the downstream arc, as numerically shown by Gea-Aguilera et al. [6].
On the other hand, the impact of blade turning has been analysed analytically by Myers and Kerschen [8] and Evers and Peake [4], numerically by Gea-Aguilera et al. [6] and Paruchuri et al. [9], and experimentally by Devenport et al. [7], among other authors. There is a general agreement that camber has a very limited impact on the broadband noise footprint, impacting only the azimuthal modal decompositions, i.e., directivity, as shown by Myers and Kerschen [8] and Paruchuri et al. [9].
All these works, and some others not mentioned here, are either asymptotic studies or are applied to geometries with moderate thickness and low camber as those found in Fan/OGV interaction. However, for turbine geometries, thickness and camber can be very important, and the conclusions extracted from the past may not be applicable.
To shed light on the influence of the turning, thickness, and main geometric parameters on turbine broadband noise, the use of a computationally efficient linear frequency domain Navier-Stokes solver [10] is proposed. The solver runs on commodity GPUs [11], enabling the computation of the broadband noise spectra within an industrial design loop. The method has been validated previously for Fan/OGV interaction against experimental data and in a numerical benchmark in the context of the TurboNoiseBB EU project [12,13].
The objective of the present work is to assess quantitatively and qualitatively the effect of the airfoil geometry on turbine broadband noise, compare the results to the flat plate simplifications, and finally, investigate the impact of the operating point. The comparison of the present methodology to experimental data is postponed for the future since it requires other building blocks such as accurate turbulence modelling, and transmission effects through the turbine stages.

2. Methodology

The methodology has been thoroughly described for multi-stage applications [13] however, for completeness, it will be briefly described herein. Synthetic turbulence methods aim at reproducing a given turbulent spectrum by explicitly introducing vortical content into the simulation domain. They consist of three well-differentiated steps, namely incoming turbulence modelling, computation of the blade’s acoustic response to the synthetic turbulence, and post-processing of the radiated acoustic power. The original methodology can retain certain 3D effects by using several strips at different radial positions. However, the analyses will be restricted here to a single strip for simplicity. For more information about three-dimensional effects, please refer to Blázquez-Navarro and Corral [13].

2.1. Turbulence Modelling

When turbulent wakes impact a turbine row, they give rise to broadband sound generation. These wakes can be characterised by their velocity power spectral density (PSD). Synthetic turbulence methods aim at reproducing the turbulence spectral characteristics through the summation of individual vortical gusts [14]. Their interaction with the turbine cascade is modelled under the Rapid Distortion Theory (RDT) hypothesis [15], which allows linearising their propagation through the airfoil if the fluctuations are small compared to the mean flow and the eddies remain coherent through the blade passage.
Since usually experimental data or results from scale-resolved simulations are not available, certain assumptions shall be made to build the turbulent spectrum. In the present work, the synthetic turbulent spectrum is built using the Liepmann isotropic model Liepmann [16]. Its upwash component ( x 2 direction in Figure 1), which is the most relevant one for noise generated by thin bodies [17], results:
Φ ˜ 22 ( k ˜ ) = 2 π 2 ( k ˜ 1 2 + k ˜ 3 2 ) ( 1 + k ˜ 2 ) 3
where Φ ˜ 22 = Φ 22 / ( u rms 2 Λ f 3 ) = Φ ˜ 22 ( k ˜ ) is the dimensionless velocity wave-number spectrum, which is a function of the wave-vector, k , non-dimensionalised by the turbulence longitudinal integral length-scale, Λ f : k ˜ = k Λ f = ( k ˜ 1 , k ˜ 2 , k ˜ 3 ) and k ˜ 2 = k ˜ 1 2 + k ˜ 2 2 + k ˜ 3 2 . The turbulence integral length-scale, Λ f , and the velocity root mean square value, u rms , are usually characterised by the RANS simulation of the previous row [18]. Since the purpose of this paper is not to compare numerical predictions against empirical data, reference data from the literature will be used.
The non-dimensional wave-vector k ˜ = ( k ˜ 1 , k ˜ 2 , k ˜ 3 ) of the perturbation is not a degree of freedom that can be chosen when performing a numerical simulation. Instead, the excitation frequency, ω , and the azimuthal, β , and spanwise, γ , wave-numbers have to be explicitly imposed. The former is related to the streamwise wave-number using the hypothesis of Frozen Turbulence, i.e., the turbulent waves are assumed to be convected at the mean flow speed. The rest are computed using trigonometric relationships:
k ˜ 1 = ω Λ f V 0 ; k ˜ 2 = ω Λ f V 0 tan θ + β ˜ cos θ ; k ˜ 3 = γ ˜
where V 0 is the mean flow velocity and θ is the velocity mean flow angle, depicted in Figure 1. The spectrum is discretised into upwash vortical gusts of prescribed frequency and wavelength, w = w ^ k e i ( k . x + ω t ) . Its amplitude, w ^ k , is a function of the wavenumber and the bandwidth used in the discretisation, ( Δ k ) 3 = Δ k 1 . Δ k 2 . Δ k 3 . We can define a dimensionless perturbation, w ˜ ^ , which is directly related to the turbulent spectrum:
w ˜ ^ k 2 = w ^ k ( Δ k ˜ ) 3 / 2 u r m s 2 = 1 ( Δ k ˜ ) 3 k 1 k 1 + Δ k 1 k 2 k 2 + Δ k 2 k 3 k 3 + Δ k 3 Φ ˜ 22 ( k ) d k ˜ 1 . d k ˜ 2 . d k ˜ 3 Φ ˜ 22 ( k ˜ )
To keep a simpler formulation than in a previous publication [13], and as previously done by Ju et al. [19], the vortical gusts, which are sub-critical, i.e., do not produce any cut-on response, are a priori filtered out. This is performed to avoid an over-prediction of the number of cut-on modes that would occur in a purely 2D case leading to large over-predictions of the resulting spectra. Thus:
w ˜ ^ k 2 | 2 D = 2 0 k 3 * Φ ˜ 22 ( k ) d k ˜ 3
with
k ˜ 3 * = M k ˜ 1 ( 1 M x 2 ) 1 / 2
After this pre-filtering process, the problem becomes fully bi-dimensional.

2.2. Response Computation

The modelling of the interaction of the turbulent spectrum with the turbine gives rise to the resolution of a large number of gusts with different ω , β which build-up the unsteady response of the OGV cascade, u ( x , t ) :
u ( x , t ) = n = ω m a x / Δ ω ω m a x / Δ ω [ μ = μ n μ n + u ^ ω ( n ) ( β ( μ ) , x ) e i ω ( n ) t ]
where ω ( n ) = n Δ ω , β ( μ ) = μ Δ β are a discrete set of frequencies and inlet wavenumbers. The summation limit μ n ± is chosen at each frequency to sample a certain fraction of the TKE, which in this work is 90% of the total. The explicit dependence of the wave-numbers on the summation indices will be omitted whenever possible to avoid unnecessary overloading of the nomenclature. The interaction of the airfoil cascade with each individual gust is solved in the frequency domain. Thus, thousands of linearised Navier-Stokes (LNS) simulations are required to compute the noise spectrum. A time instant solution can be reconstructed through the summation of all the simulations as shown in Equation (6) and displayed in Figure 2 for illustrative purposes.
As mentioned above, the acoustic response is computed using a frequency-domain linearised Navier-Stokes Solver [10]. The methodology is explained with the Linearised Euler Equations (LEE) for simplicity even though the problem actually solved retains viscous effects. The extension of the ideas presented here to the solution of high Reynolds number viscous flows is straight forward. The flow is decomposed into a mean base flow, U 0 ( x ) and a small perturbation u ( x , t ) U 0 , i.e., U ( x , t ) = U 0 ( x ) + u ( x , t ) . The base flow is obtained solving the nonlinear problem A ( U 0 / x ) + B ( U 0 / y ) = F , which in practice is done using a RANS code known as M u 2 s 2 T [20]. The perturbations are solved with the linear counter-part of the same code [10]. If the problem is assumed harmonic in time, i.e., f = f ^ ω e i ω t and u = u ^ ω e i ω t , the linearised Euler equations can be Fourier-transformed, leading to:
i ω I + A 0 x + B 0 y u ^ ω = L ( U 0 , ω ) u ^ ω = f ^ ω
where A 0 ( U 0 ) and B 0 ( U 0 ) are the Jacobian matrices particularised at U = U 0 = ( ρ 0 u 0 v 0 p 0 ) T , u ^ ω = ( ρ ^ ω u ^ ω v ^ ω p ^ ω ) T is the vector of perturbed variables, and f ^ ω contains just the small unsteady perturbations injected through the inlet. I is the identity matrix and L a linear operator which depends on the base flow and the frequency. The latter is actually discretised using a second-order accurate scheme to obtain the discrete operator L D , but the super-index is omitted for clarity. The harmonic solution can be formally solved as u ^ ω = L 1 f ^ ω , though in practice the inverse of L is never computed. The forcing term associated with the synthetic turbulent spectrum, f ^ ω , in practice also depends on β and is expressed as:
f ^ ω ( x S , β ) = v ^ ω , β e w R e i ( ω t + β y S ) = v ^ ω , β 0 β / k x 1 0 T e i ( ω t + β y S )
where e w R is the right eigenvector associated with a vortical wave and v ^ ω , β is the Fourier component of the perturbed velocity along the inlet, which is proportional to the upwash velocity component, w ^ ω , β . The readers are referred to Corral et al. [10], Burgos et al. [20] and Blázquez-Navarro and Corral [13], respectively, for detailed information about the solver numerics and the mesh criteria established to perform broadband noise predictions.

2.3. Post-Processing

The incoming vortical perturbation with azimuthal wavenumber β is scattered by the airfoils, giving rise to acoustic modes that conform the solution u ^ ω ( β ) . In order to post-process u ^ ω ( β ) , the solution at the inlet and the outlet ( x = x S and x = x S + in Figure 1, respectively) is Fourier transformed in the azimuthal direction:
u ^ ω ( β , x S ± ) = ϵ = u ^ ω , φ ( ϵ ) ± e i φ ( ϵ ) y = r = u ^ ω , β ˘ ( r ) ± e i β ˘ ( r ) y .
where φ ( ϵ ) = ϵ Δ φ is an azimuthal wave-number used to compute the Fourier Transform. Nonetheless, the only non-null azimuthal modes that result from the Fourier Transform are the Tyler and Sofrin Modes, β ˘ ( r ) = β + r V / R . u ^ ω , β ˇ ( r ) ± is the r t h Tyler-Sofrin mode of the solution u ^ ω ( β ) at x S ± , obtained applying the spatial Fourier operator in the circumferential direction, i.e., u ^ ω , β ˘ ± = F θ u ^ ω ( β , x S ± ) . Next, the pressure associated with the outgoing waves, p ^ ω , β ˘ ( a ) ( x S ± ) , is obtained assuming a uniform flow-field in these regions.
p ^ ω , β ˘ ( a ) ( x S ± ) = e p ± L u ^ ω , β ˘
where e p ± L is the left eigenvector of the 2D LEEs of either the downstream (+) or upstream (−) running pressure waves. Within the same wave-splitting process, the cut-off acoustic waves are filtered out and do not contribute to the pressure spectrum. Thus, the acoustic perturbations upstream and downstream of the turbine row, p ^ ω , β ˘ ( x S ± ) , are the result of applying a concatenation of different linear operators over each harmonic of the turbulent spectrum. These can be more conveniently expressed in non-dimensional form, thus obtaining:
p ˜ ^ ω , β ˘ ( a ) = p ^ ω , β ˘ ( a ) ( Δ k ˜ 1 Δ k ˜ 2 ) 1 / 2 ρ 0 ( x S ) V 0 ( x S ) u rms = e ˜ p ± L F θ L ˜ S 1 e w R v ˜ ^ ω , β
where L ˜ 1 is the dimensionless linearised Navier-Stokes operator. It is readily seen that the acoustic response is proportional to the incoming gust strength, v ˜ ^ ω , β . The pressure PSD can be then computed as:
S ω , β p p ( x S ± ) = 1 Δ ω Δ β r = μ = | p ^ ω , β ˇ ( μ , r ) | 2 δ ( β β ˘ ( μ , r ) )
where S ω , β p p contains the squared summation of all the vortical waves with impinging azimuthal wave-number β ( μ ) = μ Δ β that produce an acoustic response with wave-number β ˘ ( μ , r ) = β ( μ ) + r V / R . This actually means that sources with different β are assumed to be uncorrelated. This result can be expressed more generally by using the non-dimensional variable p ˜ ^ , as defined in Equation (11), leading to a non-dimensional pressure PSD:
S ω , β p p = 1 Δ ω Δ β r = μ = | p ˜ ^ ω , β ˇ | ( Δ k ˜ 1 Δ k ˜ 2 ) 1 / 2 ρ 0 ( x S ) V 0 u rms 2 δ ( β β ˘ )
where the subindices have been omitted for clarity. Hence:
S ˜ ω , β p p = S ω , β p p Λ f 2 ρ 0 2 V 0 u rms 2 cos θ 1 = r = μ = | | p ˜ ^ ω , β ˇ | 2 δ ( β β ˘ )
where the identities Δ k 2 cos θ = Δ β and Δ k ˜ = Δ k Λ f have been used. Finally, upon integration along the azimuthal wave number and expressing S ω p p in non-dimensional form it is readily obtained:
S ˜ ω p p ( x S ± ) = S ω p p Λ f ρ 0 2 V 0 u rms 2 1 = ϵ = ϵ = S ˜ ω , β ( ϵ ) p p ( x S ± ) Δ k 2 ˜
where β ( ϵ ) = ϵ Δ β and Δ β = Δ k 2 cos θ is the bandwidth employed to discretise the azimuthal wave-numbers.
The cross contribution to the acoustic power of pairs of waves with either different, ω , or β is as well null since they are considered uncorrelated sources with random phases between them. As usually in aeroacoustics applications, the sound loudness is represented in logarithmic scale, by means of a Normalised Sound Pressure Level, NSPL = 10 log ( S ˜ ω p p / 10 11 ) , where no reference pressure is needed as S ˜ ω p p is already non-dimensional, but an arbitrary factor is introduced to obtain a positive spectrum.

3. Results

The presented methodology has been applied to a representative section of a modern aeronautical low-pressure turbine. The geometry selected corresponds to a section that has been analysed numerically [21] and tested [22] for aeroelastic purposes. The total turning is slightly higher than 100 , and its maximum relative thickness is about 12%. Several Operating Points (OP) have been considered however, as they all share the following parameters:
Re 5 · 10 5    Λ ˜ f = 0.075    s / c = 0.855    V = 70    θ 1 = 44    θ 2 = 59
where V represents the number of blades of the cascade, s / c is the pitch to chord ratio and Re is the Reynolds number. Note that the sub-indices 1 and 2 indicate respectively properties at the inlet and outlet axial stations, i.e., θ ( x S ) = θ 1 . A baseline operating point, OP1, which can be considered as the On-Design conditions, has been run. Several modifications have been performed to the boundary conditions, leading to the rest of the OPs described in Table 1.

3.1. Comparison with Flat Plate Based Methods

The first part of the analysis assesses the suitability of industry state-of-the-art flat plate methodologies to predict broadband noise of low-pressure turbine airfoils. The impact of the airfoil geometry on broadband noise predictions has been studied thoroughly in the literature with a focus on the fan outlet-guide-vanes. For these configurations, there is an extended agreement that the airfoil geometry impact on broadband noise is small, up to the highest frequencies of interest [4,6,23], since the airfoils are thin and feature a low camber. Recently, the present methodology has been applied to a modern Fan, concluding that the effect of the OGV detailed geometry on sound generation is, in general, small [12,13]. This section compares the results obtained accounting for the airfoil geometry with those obtained by replacing it with a flat plate cascade. Since which one is the best-suited equivalent flat plate is not apparent, several approaches are compared herein.
A broadband noise prediction has been performed at OP1, for reduced frequencies between f red = 2 π f c / V 0 = 0.75 and 25. The maximum reduced frequency corresponds approximately to 10 4 Hz. Figure 3 compares the NSPL obtained accounting for the actual airfoil geometry and substituting it by two different flat plates. The flat plate A has been constructed using the turbine inlet mean flow properties, whereas the flat plate B is defined by the outlet conditions (see Table 2 for their definition and flow conditions).
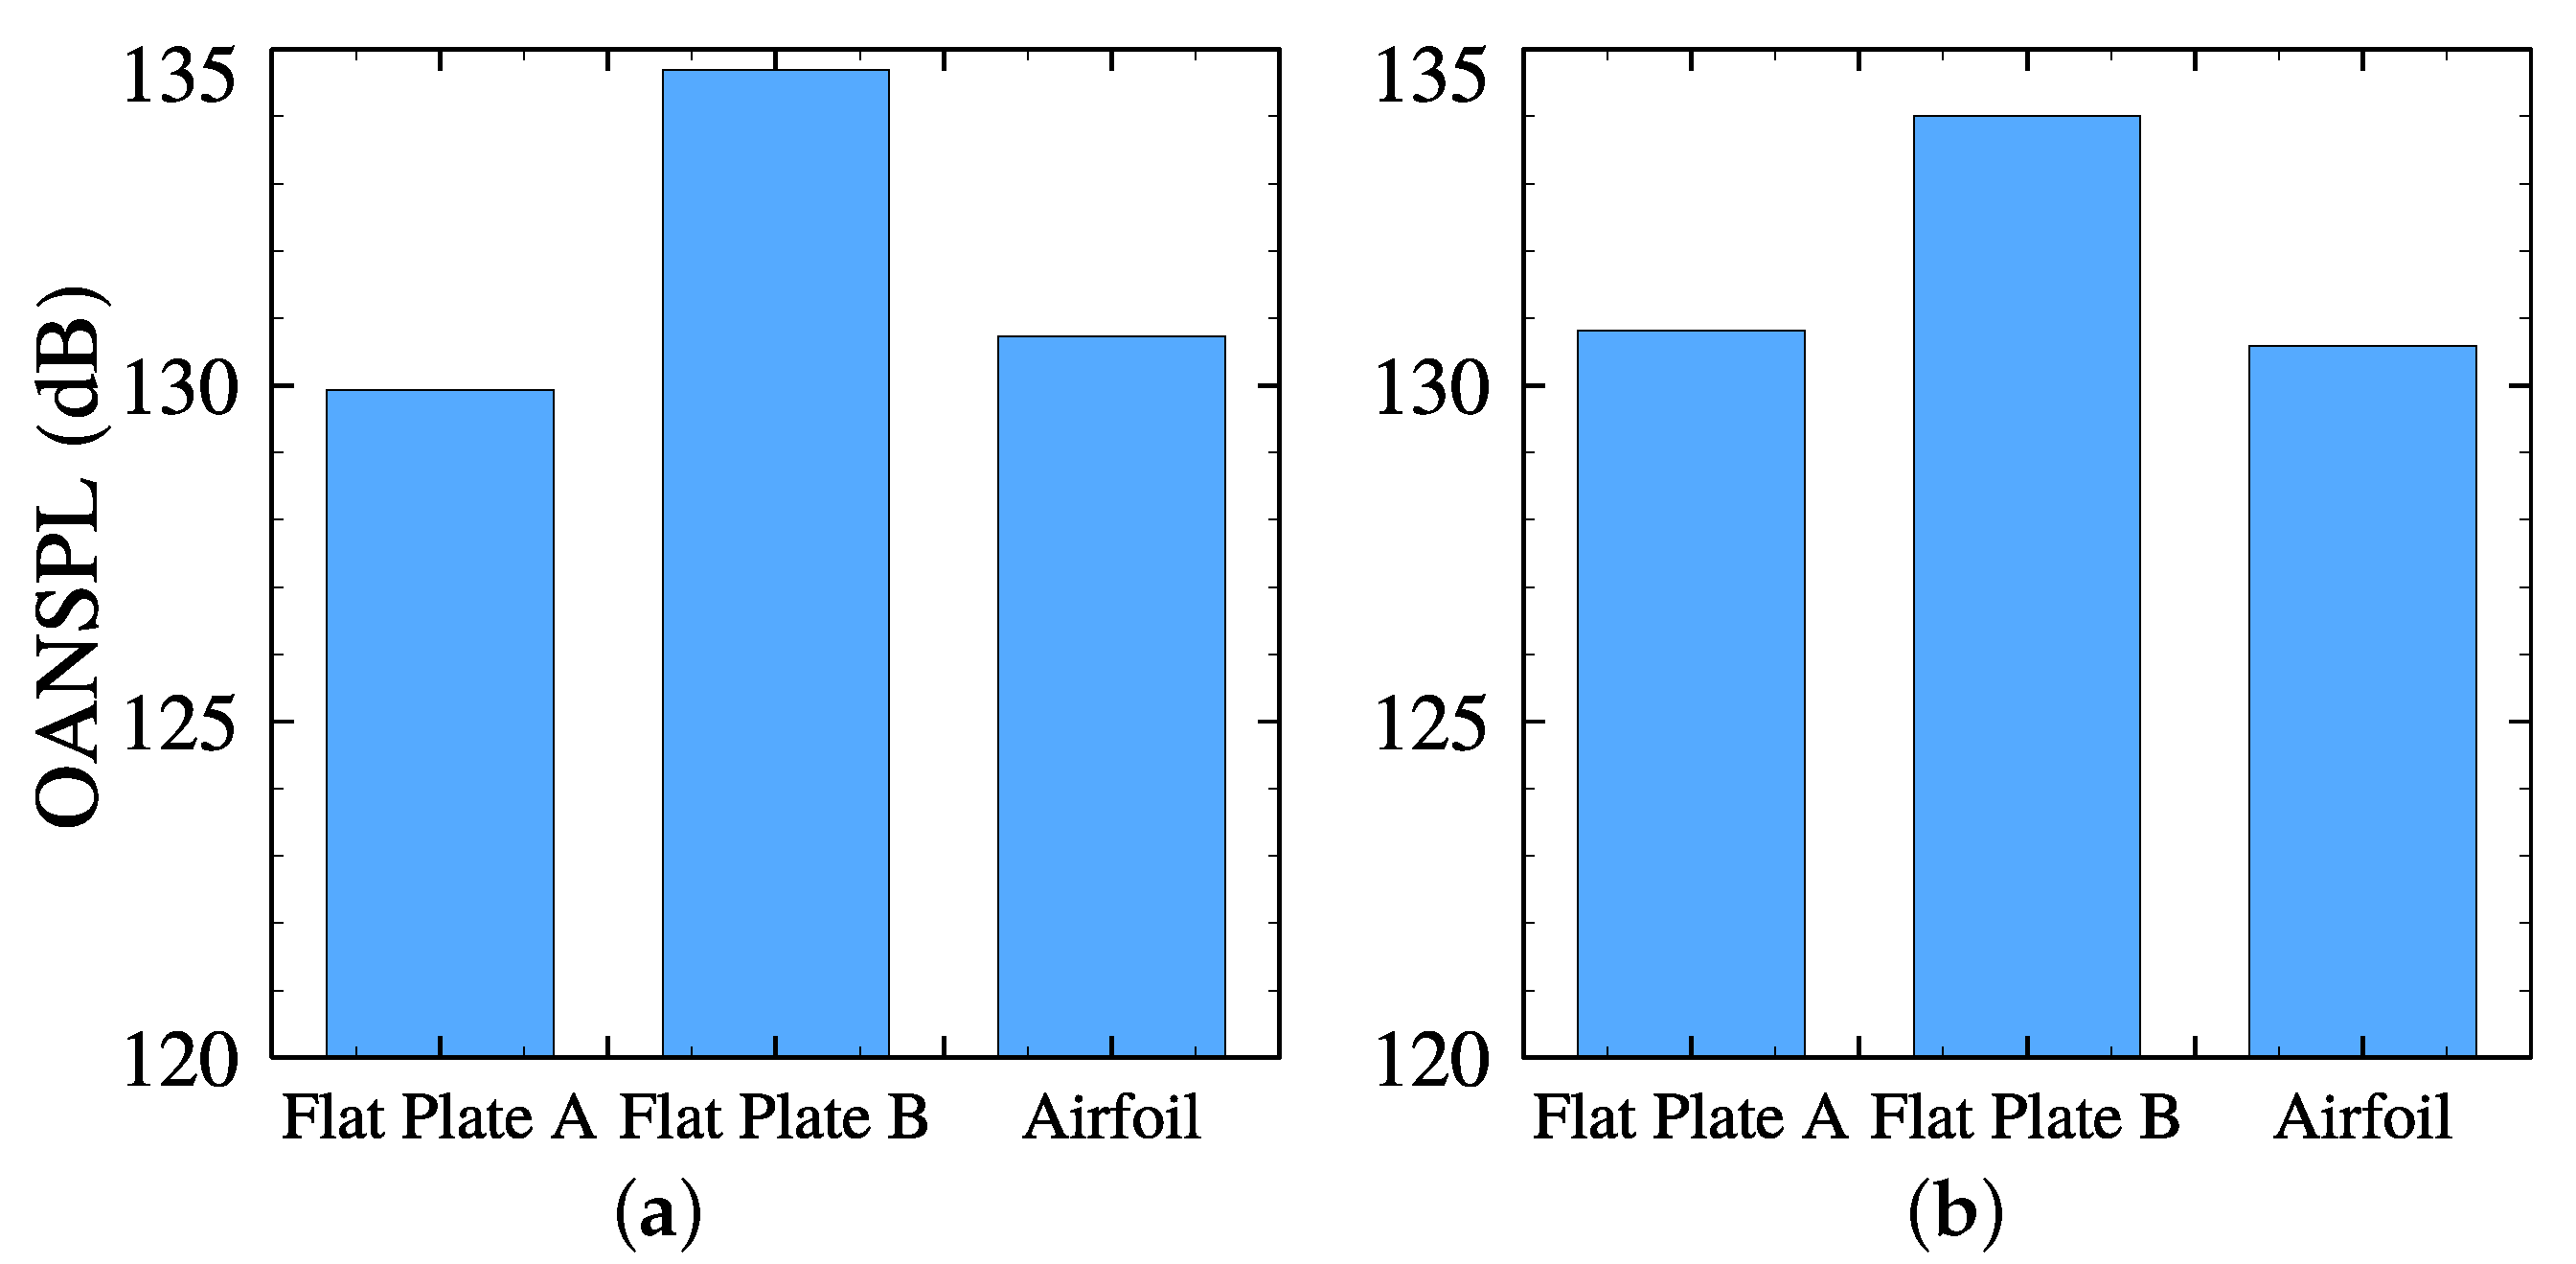
The comparison of the flat plate A with the LPT airfoil yields the following conclusions. The pressure spectra obtained with the actual geometry in the inlet and outlet are up to 6 dB higher, at reduced frequencies lower than 12. At higher frequencies, the predictions using a flat plate cascade result in higher noise levels (about 4 dB), especially in the outlet. If the spectra are integrated along the frequency range, both effects are somehow compensated, as shown in Figure 4. The inlet prediction accounting for the airfoil geometry is overall 0.75 dB higher than the corresponding flat plate approximation while the outlet is 0.25 dB lower. Despite this similarity, the spectral distributions are very different, which can also lead to different perceived noisiness because the low-mid frequency octave bands are penalised by noise regulations.
Alternatively, the spectra retrieved by the flat plate B overestimate the Airfoil results by up to 10 dB. At low frequencies, i.e., f red < 10 , there is a reasonable agreement between the airfoil’s results and flat plate B. Nonetheless, at higher frequencies, the differences between both approaches become large. Consequently, flat plate A yields a better agreement with the airfoil’s result than flat plate B, as shown in Figure 4. This highlights the role of the leading edge as the major contributor to sound generation, especially at f red > 10 . The following analyses will therefore focus on further comparing the flat plate A results with the airfoil.
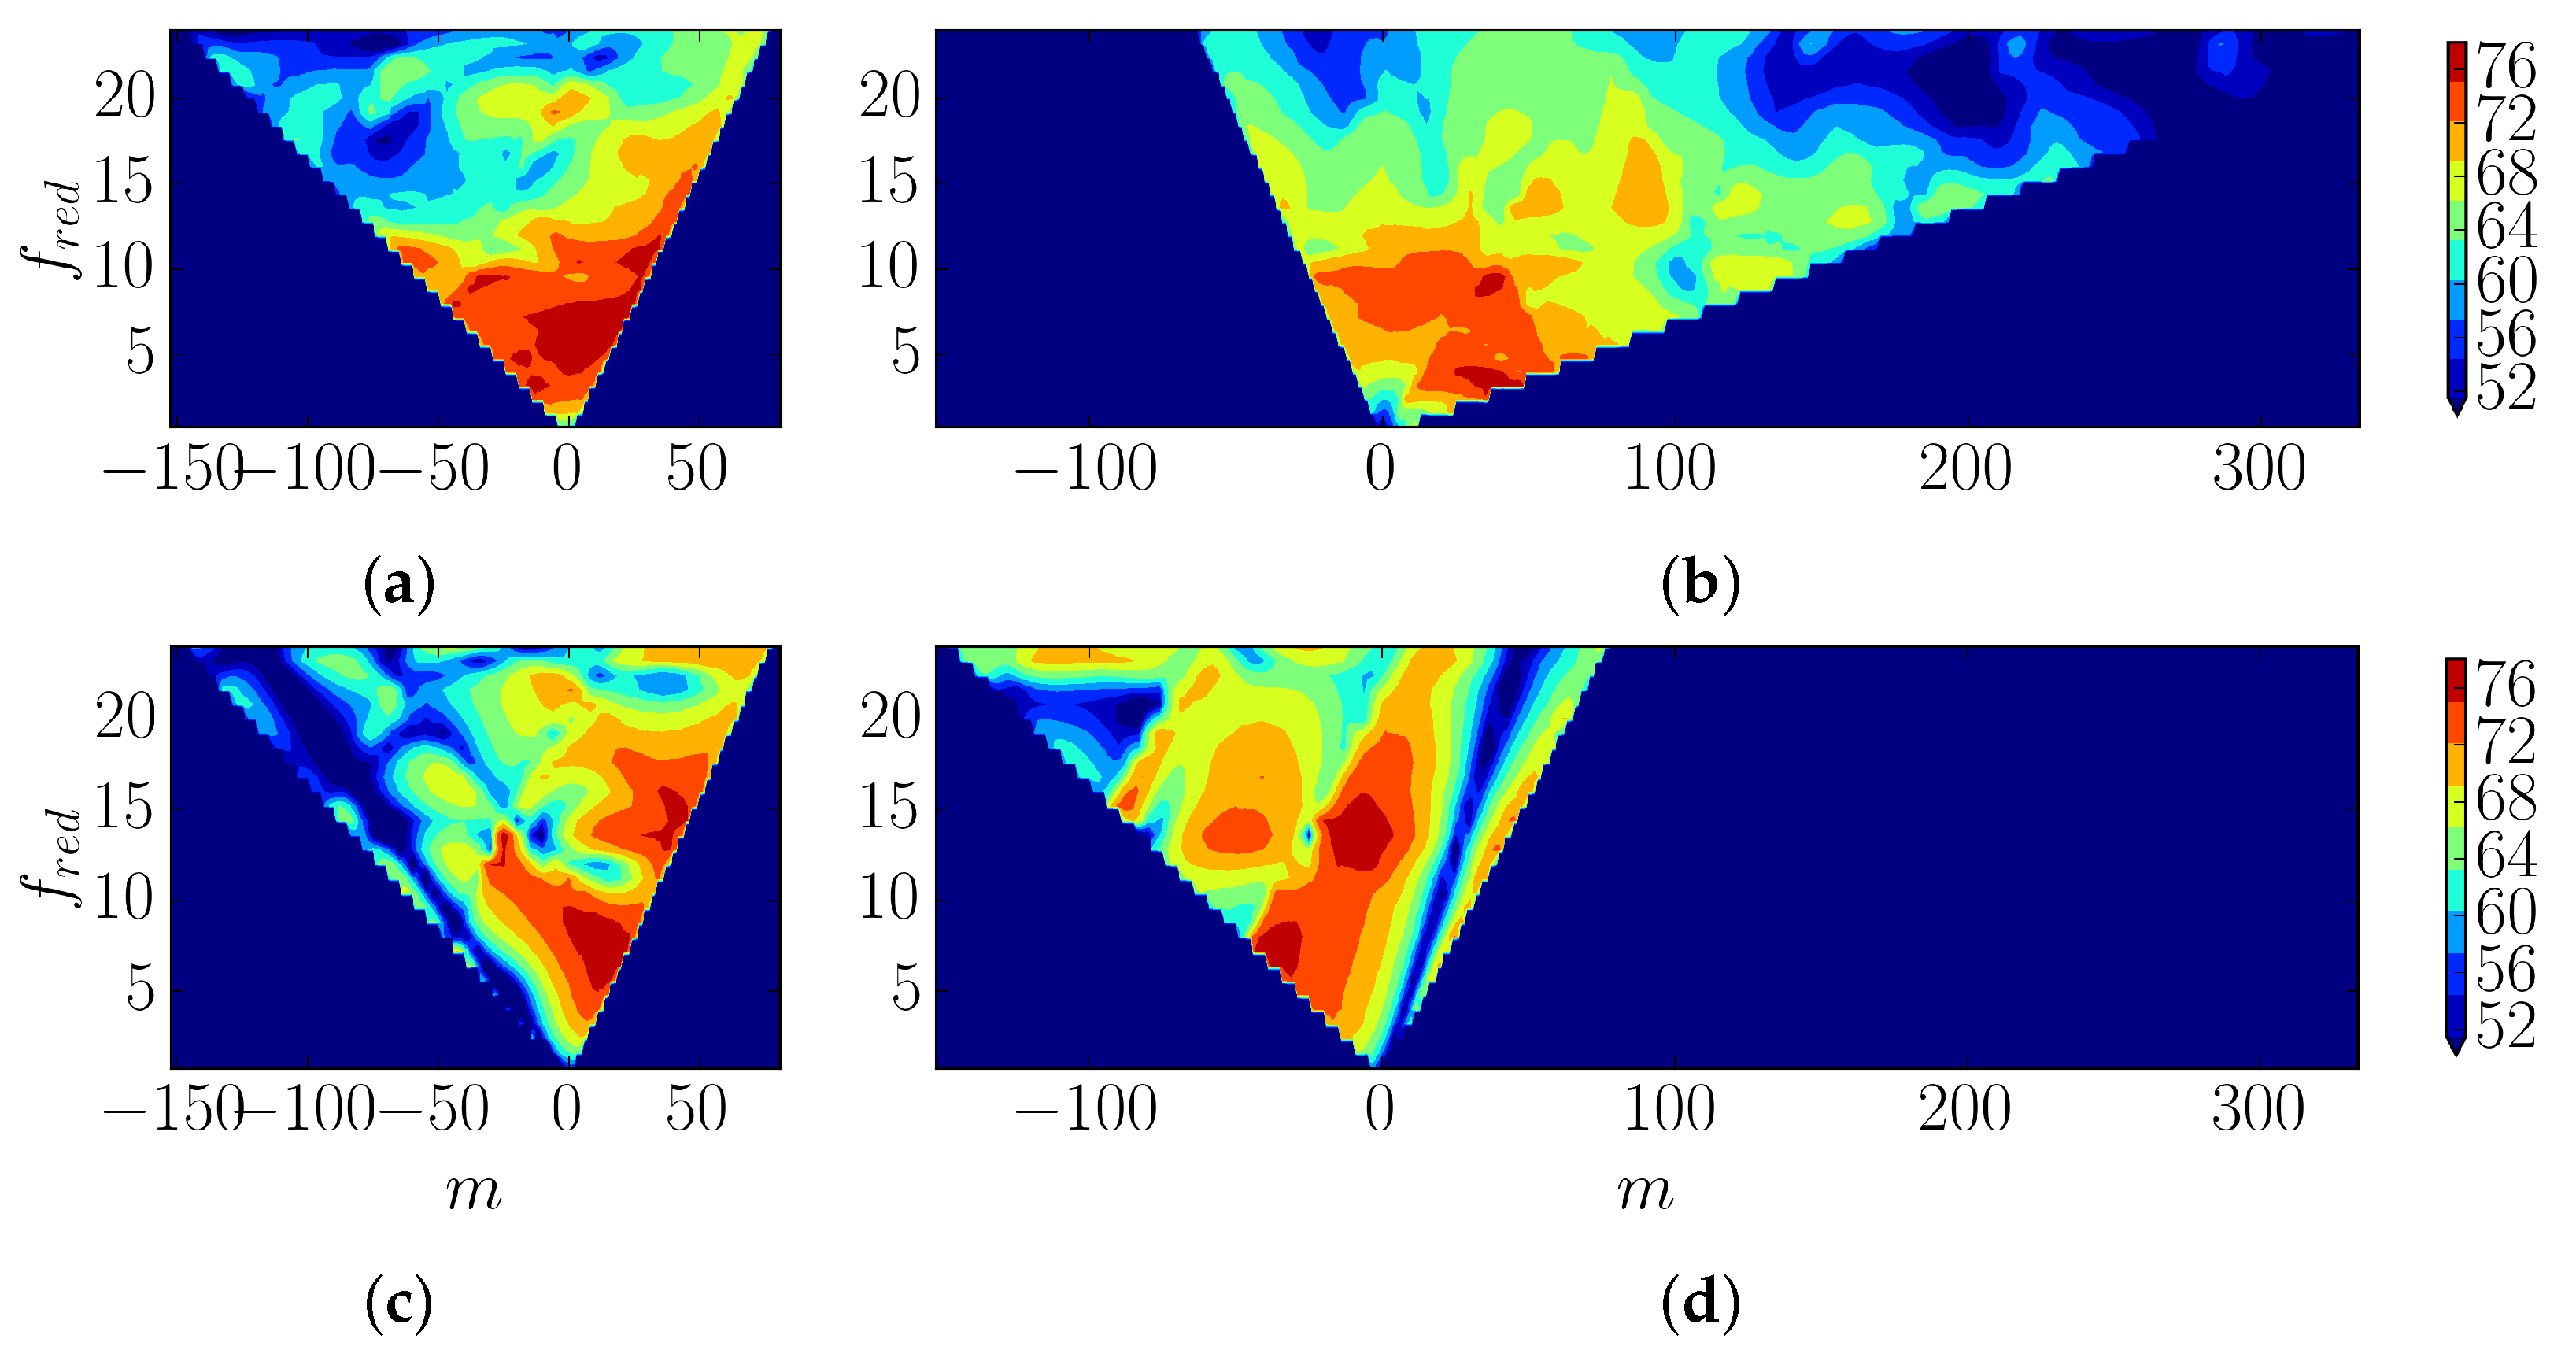
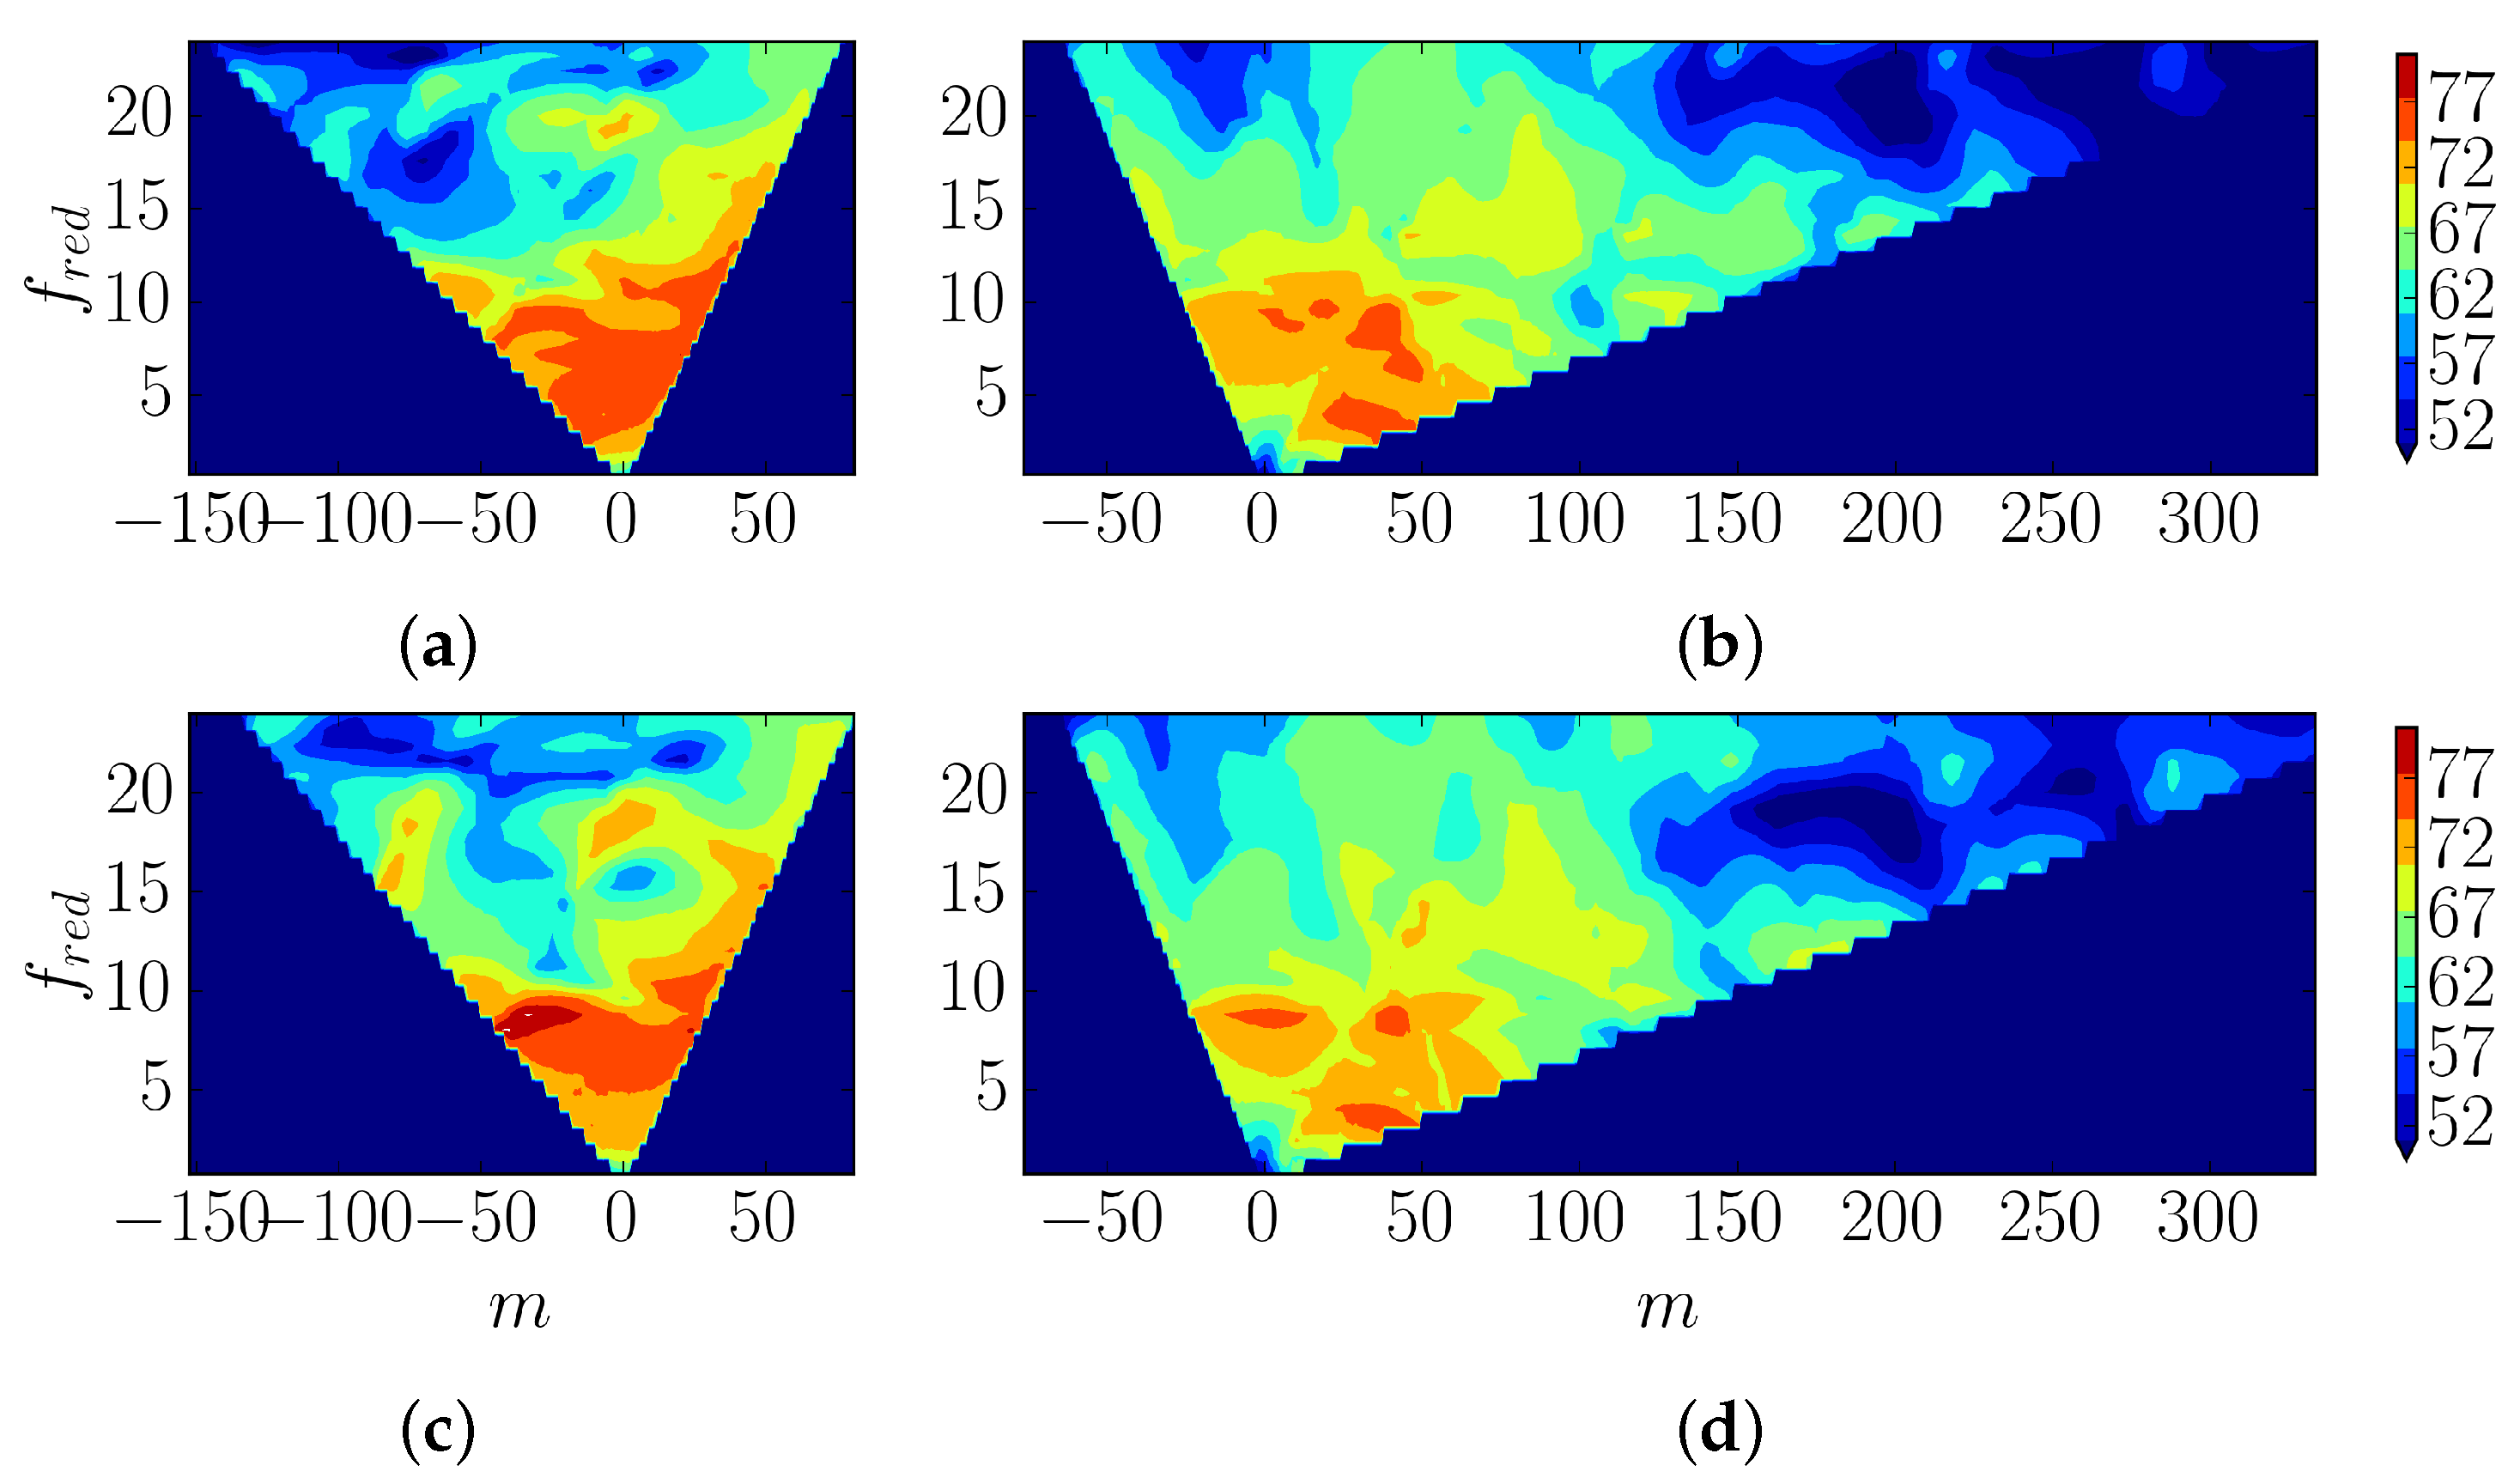
To provide a more detailed broadband noise footprint, the NSPL modal decomposition is depicted in Figure 5. The y axis corresponds to the reduced frequency, while the x-axis represents the azimuthal mode index: m = β V s / ( 2 π ) . Figure 5a,c show the results obtained at the inlet with the actual and flat plate geometry. The latter exhibits a straight line of extremely low pressure, caused by the dipole behaviour of the flat plate, corresponding to a directivity θ , because the plate’s dipole cannot radiate in directions parallel to itself. The highest noise levels arise close to the cut-off condition for positive m because the regions of maximum radiation are normal to the plate. On the other hand, the simulations accounting for the actual geometry do not show such preferred directions. At low frequency, f red < 10 , noise is radiated fairly homogeneously along the whole cut-on region. This is likely to be produced by the presence of additional noise sources that do not arise in flat plates and also by the reflection of acoustic waves between neighbouring blades.
Regarding the downstream noise (Figure 5b,d), the differences are even greater. The results obtained with the equivalent flat plate, (d), have the same cut-on region as in the inlet since the flow properties are uniform. The observed behaviour is analogue to that in the inlet, but with opposite directivities. Contrarily, the cut-on region exhibited by the actual geometry is broader and tilted towards positive directivities due to the effect of the swirl. At low frequencies, f red < 10 , the directivity pattern is quite uniform while at higher frequencies there are very low-pressure levels close to the cut-on line, for positive m. It turns out that the cut-off transition of upstream-travelling waves has an effect on the downstream radiated noise because the pattern of the inlet cut-on line at positive m is seen also in Figure 5b. At f r e d 5 , the pressure level clearly increases through the cut-on-cut-off transition of the inlet ( m 20 ) . This is, upstream travelling modes are reflected towards the outlet, analogously as trapped modes [24], leading to an increase of downstream noise.
The information depicted in Figure 5 certainly shows that the resemblance of the integrated noise spectra is caused by statistical averaging and not by the accurate modelling of the physics. The reasons underlying the aforementioned qualitative differences will be explored next.
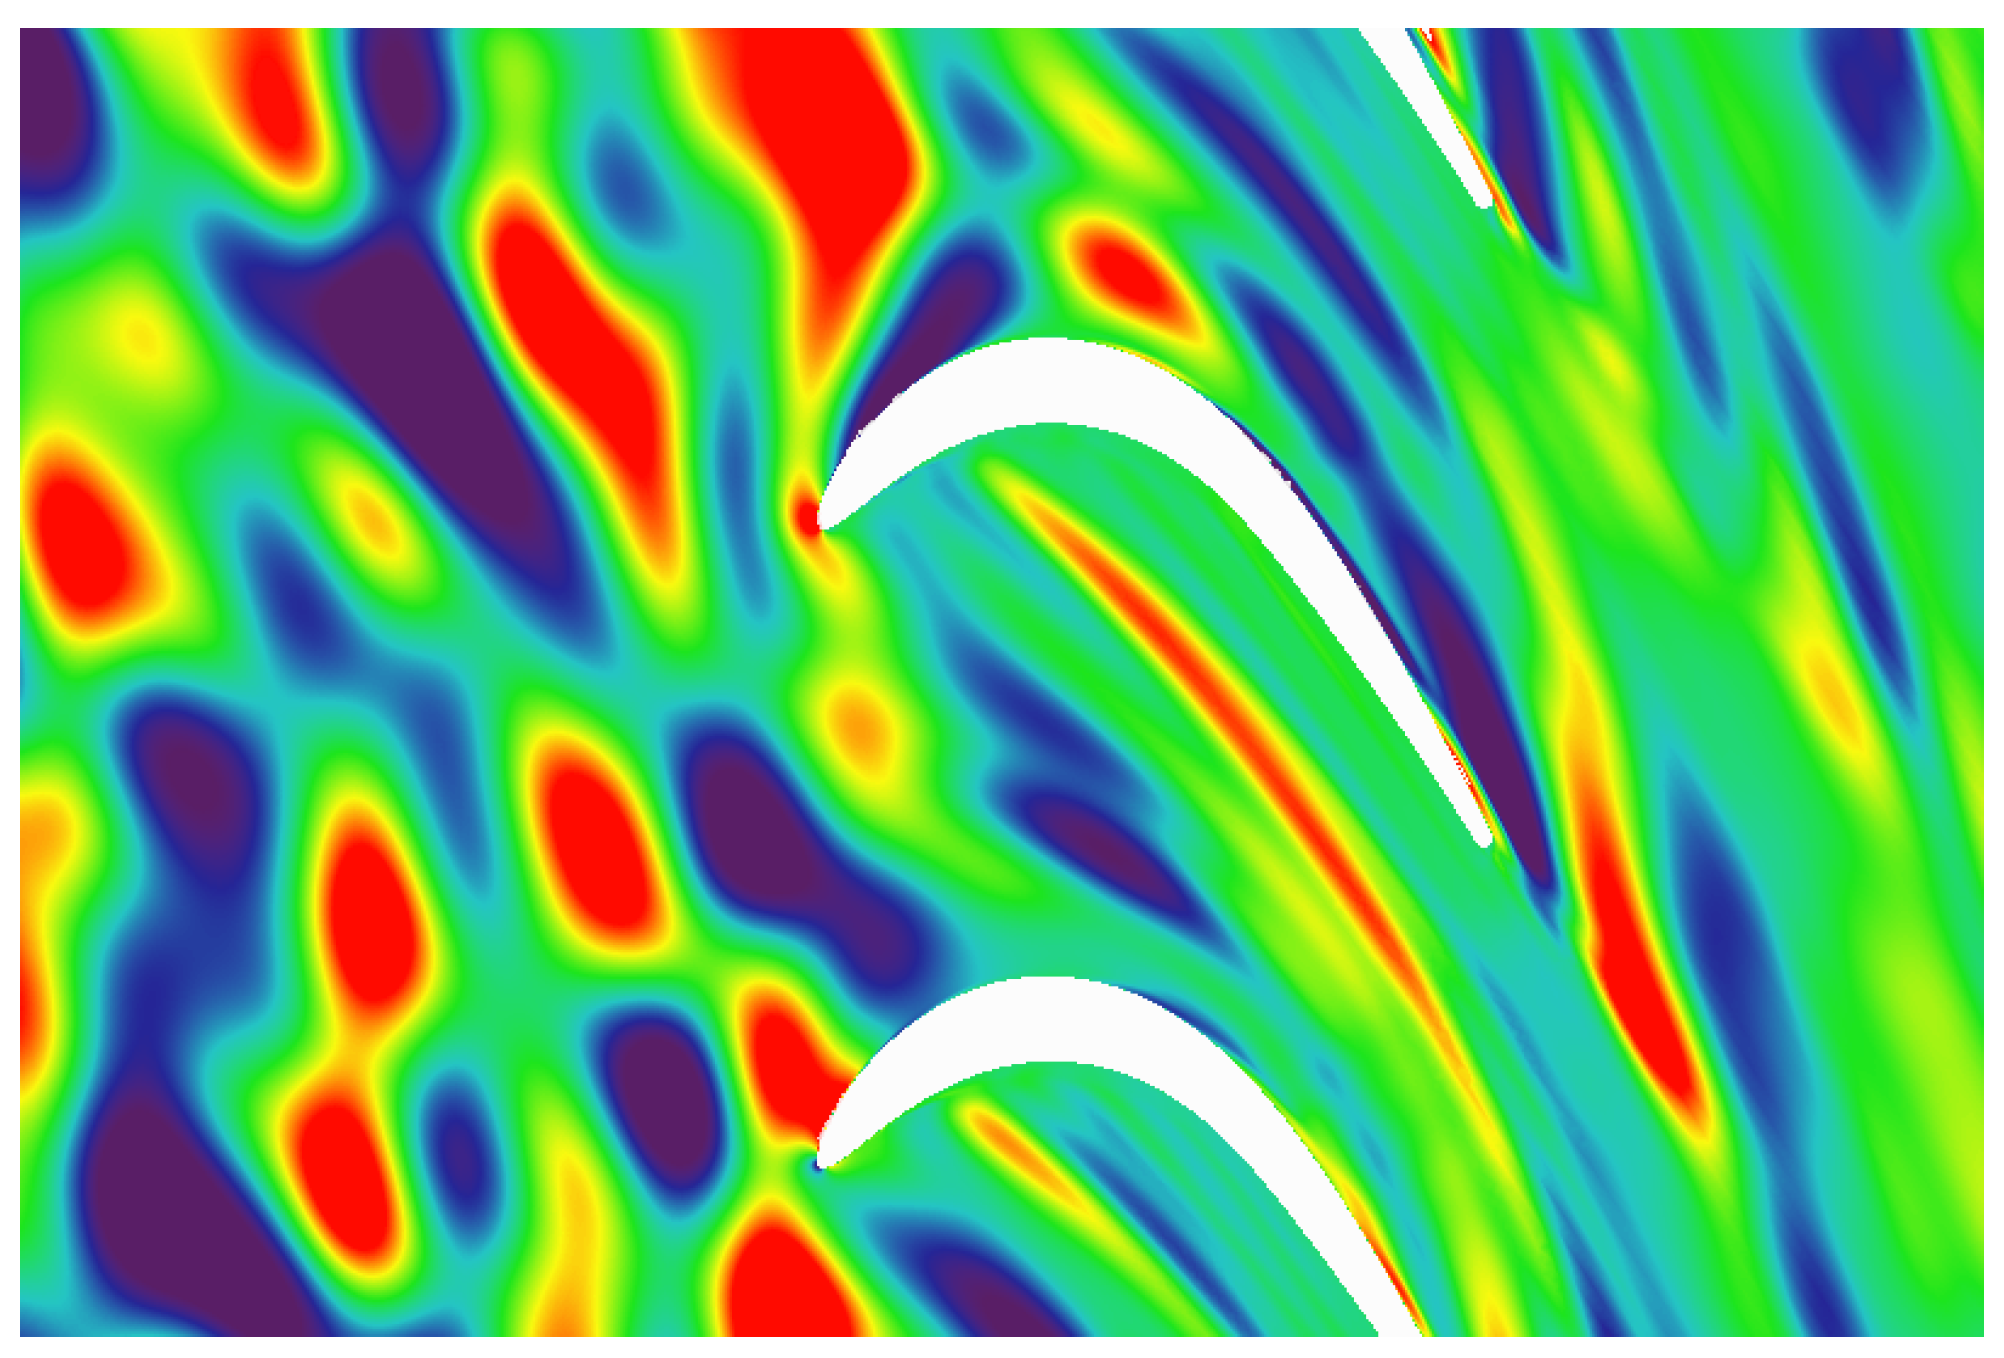
Figure 6 shows the pressure root mean square value (RMS) at three different frequencies for both the airfoil and flat plate geometries, where a different colour scale is used in each column for enhanced visualisation. This figure highlights the different acoustic sources present in both geometries. However, a note of caution is sounded as a high pressure RMS region is not directly equivalent to a sound source because the hydrodynamic pressure does not lead to sound generation. Anyhow, the pressure RMS can provide valuable information to understand the effect of the airfoil on noise generation, compared to flat plate geometries. At low reduced frequency, f red = 3 , the flat plate clearly presents a dipole pattern in the leading-edge, justifying the observations performed in Figure 5c,d. The regions with high-pressure RMS are located in the leading-edge, as predicted by quasi-steady aerodynamic theories. On the other hand, the turbine airfoil presents several regions of high levels of unsteady pressure, namely the leading-edge, the suction side peak Mach number region, and the pressure side where the flow starts to accelerate. These may correspond to volumetric noise sources, associated with the stretching of vorticity, which are known to produce sound [4]. Moreover, as the acoustic wave-length normalised with the chord λ ˜ a c = a 0 / ( f · c ) is about 0.2, the case can be considered acoustically compact and we may relate the pressure directly with the radiated noise, as deduced from Curle’s analogy [25]. This explains the larger noise levels exhibited by the airfoil at low frequencies, compared with the flat plate case (see Figure 3). This noise mechanism is analogue to that described by Marble and Candel [26] for entropy waves, which lead to sound generation when they propagate through a non-uniform mean flow.
At higher frequencies, f red = 15 and f red = 21 , the behaviour observed on the airfoil is rather similar to the previous one, although the large pressure regions on the suction side shift slightly forward. On the other hand, the flat plate cascade exhibits new pressure lobes which are not present in the low frequency case. The plates do not behave any more as compact acoustic sources and the interference of multiple leading and trailing edge scatterings lead to the more complex pressure pattern observed in Figure 6e,f. It is also seen that the high pressure regions at the plate’s leading-edge are more prominent than those of the airfoil. The reason for that is the finite blade thickness and leading edge radius of the airfoil, which according to Gill et al. [5] at high frequencies ( f red . t / c ) > 1.5 reduces the radiated noise compared to the flat plate case. This limit corresponds in this case to approximately f red = 15 . The effect of blade thickness and leading-edge radius on broadband noise have been studied by several authors previously and there is a general agreement that it diminishes the radiated noise, especially the downstream component, which is in agreement with Figure 3 where the NSPL roll-off increases at f red > 10 . This point will be further explored in the next section.

3.2. Separation of Geometrical Features

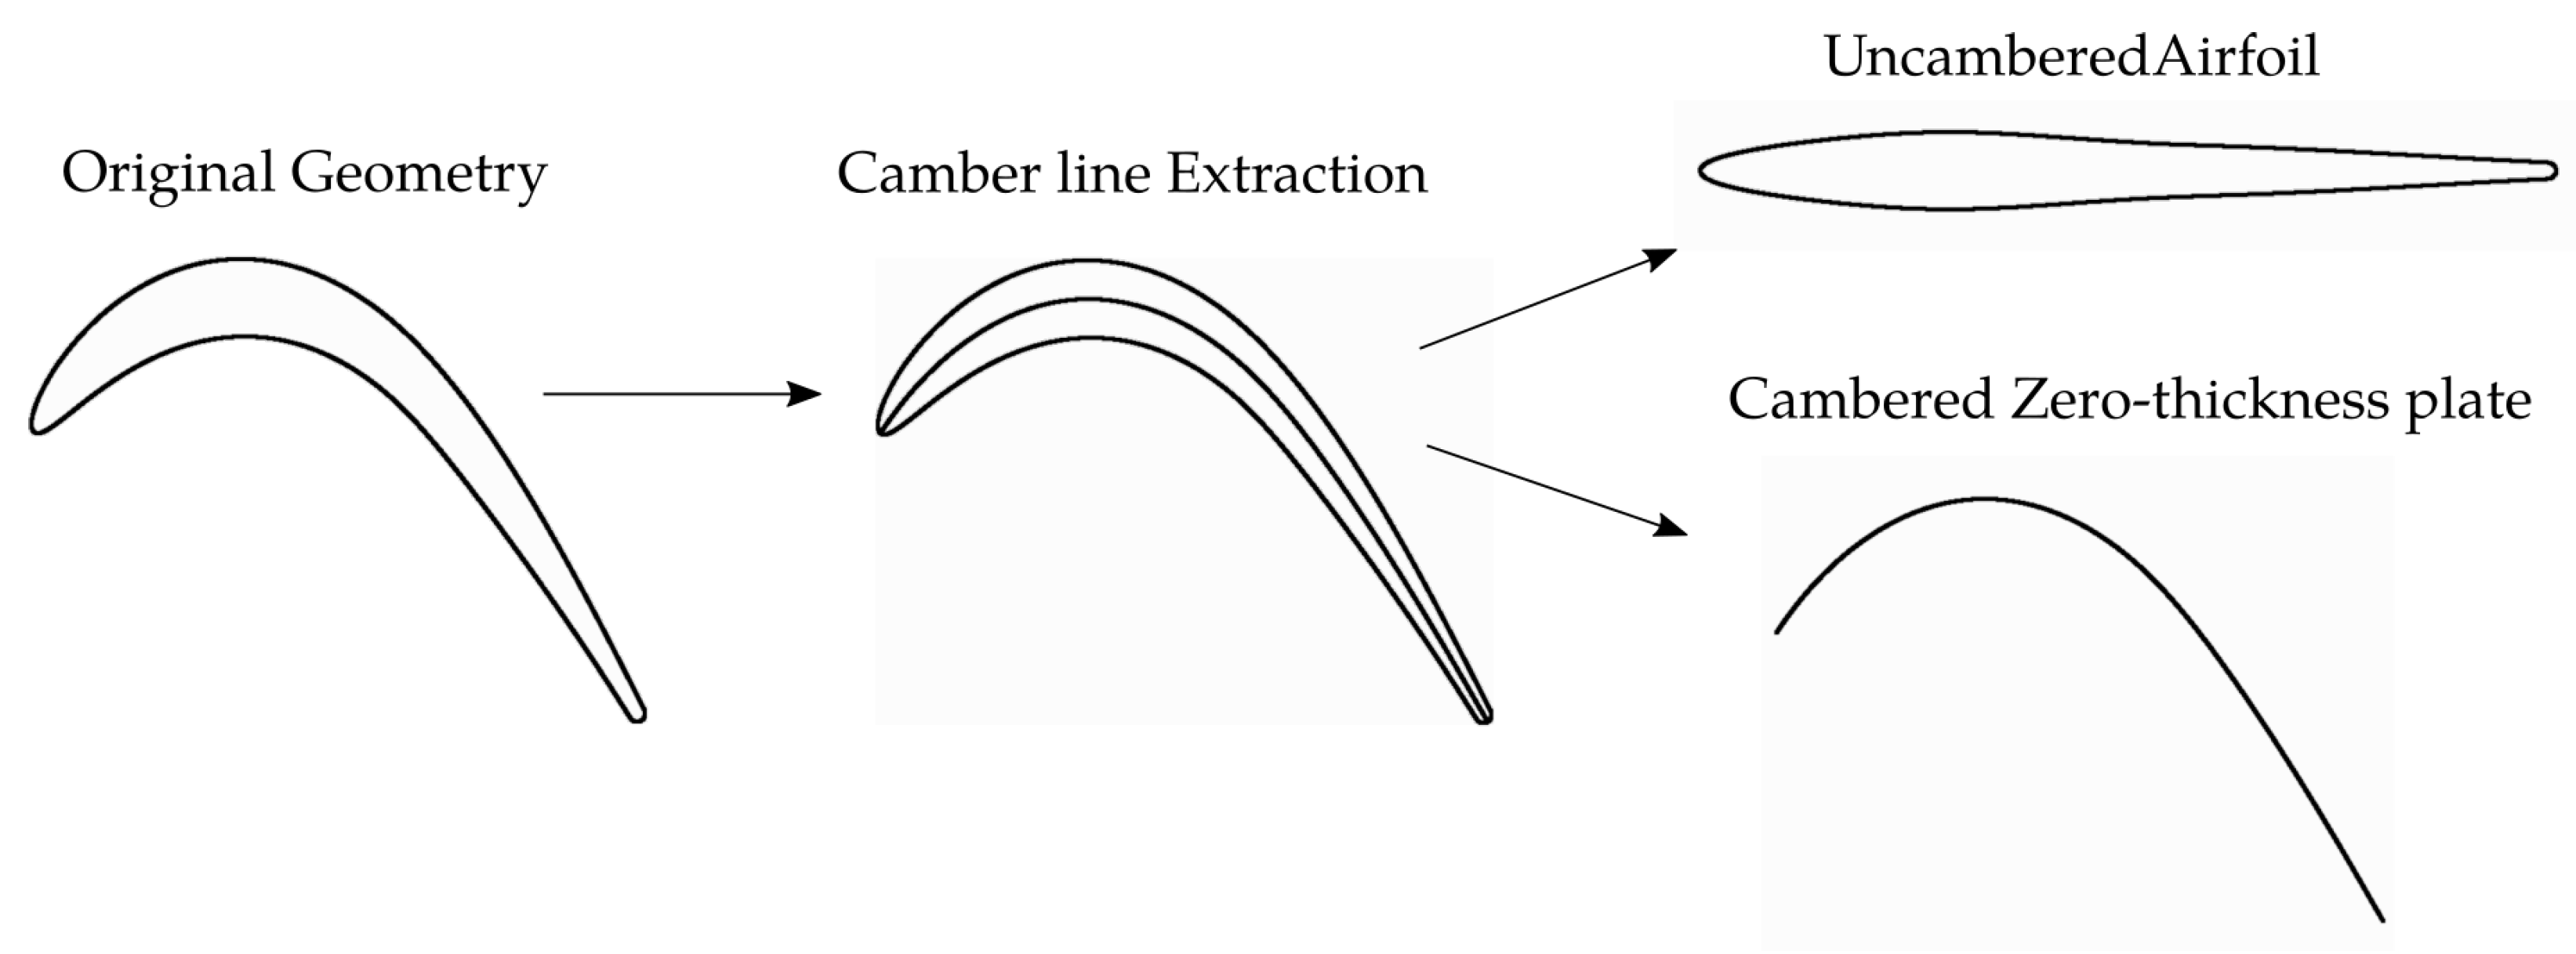
The objective of this section is to highlight the origin of the discrepancies between the results produced by the flat plate approximation and the actual geometry. For that aim, the effect of blade turning and thickness will be separated as follows. The blade camber line and thickness profile are computed, so that a new uncambered airfoil with the same thickness profile as the original turbine is built. This process is sketched in Figure 7. The base flow around the cambered plate is computed using the same boundary conditions as those used with the original geometry. Alternatively, the base flow around the uncambered airfoil is computed so that the inlet Mach number is the same as in the airfoil.
The selected approach to separate the thickness and turning effects relies on the assumption that the impact of the geometry on the flow is linear. Therefore the results obtained with the uncambered airfoil with a flat plate cascade will be compared first to derive a thickness correction. Next, we will compare the results obtained with the cambered plate with those of the original airfoil. We will apply the thickness correction to the cambered plate results to assess if the combined effect explains the results seen in the previous section.
Figure 8 compares the spectra retrieved by the uncambered airfoil cascade to the equivalent flat plate. In agreement with other authors, it is observed that the thickness decreases the radiated noise at high frequencies. As proposed by Gershfeld [3], the thickness-based reduced frequency ( f t max / V ) is displayed, so the results may be compared with others in the literature. Figure 8a,b compare the absolute spectra obtained with the airfoil and flat plate geometries at the inlet and outlet, respectively. Clearly, the airfoil thickness has a stronger effect on the downstream radiated noise. This point can be better observed in Figure 8c, which displays the difference between the flat plate and the airfoil. In spite of some large oscillations, most likely attributed to the effect of resonances and the 2D simplification, a clear trend can be observed.
A least-squares fit has been computed, which highlights that at very low frequencies, thickness appears to increase the noise, especially in the upstream direction. On the other hand, the slope of the outlet least-squares fitting is larger than that of the inlet, denoting a stronger effect of thickness on the downstream arc. These conclusions are well in agreement with the literature; Gea-Aguilera et al. [6] show remarkably similar trend lines for NACA0012 profiles for Mach Numbers between 0.3 and 0.5. The present analysis has also been performed with a cascade with a stagger angle of 44 , similarly as the inlet flow angle at OP1, yielding remarkably similar results.
The impact of flow turning is assessed by comparing the results obtained with the original airfoil with those obtained by the cambered plate. The spectra retrieved are displayed in Figure 9. Figure 9a compares the spectra at the inlet. Three curves are displayed, namely, the spectrum produced by the original airfoil, that of the cambered plate, and the latter modified by the previously derived thickness correction law. The cambered plate features a significantly similar shape compared to the spectra obtained with the original airfoil, but the levels are up to 3 dB higher at some frequencies. The thickness correction improves the agreement with the airfoil results but is insufficient to obtain a good matching. Moreover, the cambered plate results exhibit a resonant behaviour at f red 9 , which is not seen when the actual airfoil geometry is included.
On the other hand, the outlet results, displayed in Figure 9b, show a better agreement between the two approaches. At the highest frequencies, the cambered plate results overpredict those of the airfoil by ∼3 dB. When the thickness correction law previously derived is applied, the matching between the curves improves. Overall, the outlet spectra are remarkably well reproduced by the cambered plate with a thickness correction.
To further explore the similarities and differences between the different spectra, their modal decomposition is analysed next. Figure 10 displays the NSPL modal decomposition for the original airfoil and the cambered plate. At first glance, their modal content exhibits a remarkable qualitative agreement. The inlet and outlet cut-on regions are very similar, as the OP1 boundary conditions were attempted to be matched. There are slight differences because a perfect agreement in the inlet cannot be achieved because the geometries are different. The same high-pressure structures appear in both geometries. At low reduced frequencies ( f red < 10 ) the modal content is fairly uniform, while at higher frequencies, the pressure decreases substantially and shifts closer to the cut-on lines, especially at the inlet.
At the inlet, higher pressure levels are observed close to the positive cut-on line, denoting an important contribution of positive modes to the overall footprint. This suggests strong leading-edge radiation at those frequencies, similarly as it occurred in the flat plate case (see Figure 5c). On the other hand, the inlet NSPL obtained with the cambered plate exhibits some high-pressure structures at 5 < f red < 10 and at 15 < f red < 20 , which are responsible for the mismatching of the spectra observed in Figure 9a. The origin of such a high-pressure structure is yet unknown.
At the outlet, the high-pressure structures occurring at f red < 10 seem peakier in the case of the cambered plate but are qualitatively similar. Moreover, for both geometries, there are very low-pressure levels at f red > 15 and m > 150 and at m 20 . Unlike at the inlet, there is not a clear preferred direction of radiation at high frequency. The reason for that resides most likely in the multiple reflections suffered by the acoustic waves when they propagate from the leading edge through the inter-blade channel.
As shown by this analysis, the similarity among the spectra shown in Figure 9 is due to a similar noise generation mechanism and not to an averaging process. Turbine broadband noise generation, in comparison with flat plates, can be better understood through the separation of the two main geometrical features: thickness and camber. At the highest frequencies considered, tthe hickness reduces the radiated noise in low-speed low-pressure turbines by up to 1 and 4 dB, in the upstream and downstream direction, respectively. On the other hand, highly cambered lines, similar to those featured by turbine airfoils, increase the noise levels at low and middle frequencies ( f red 12 ) strongly.

3.3. Effect of the Operating Conditions

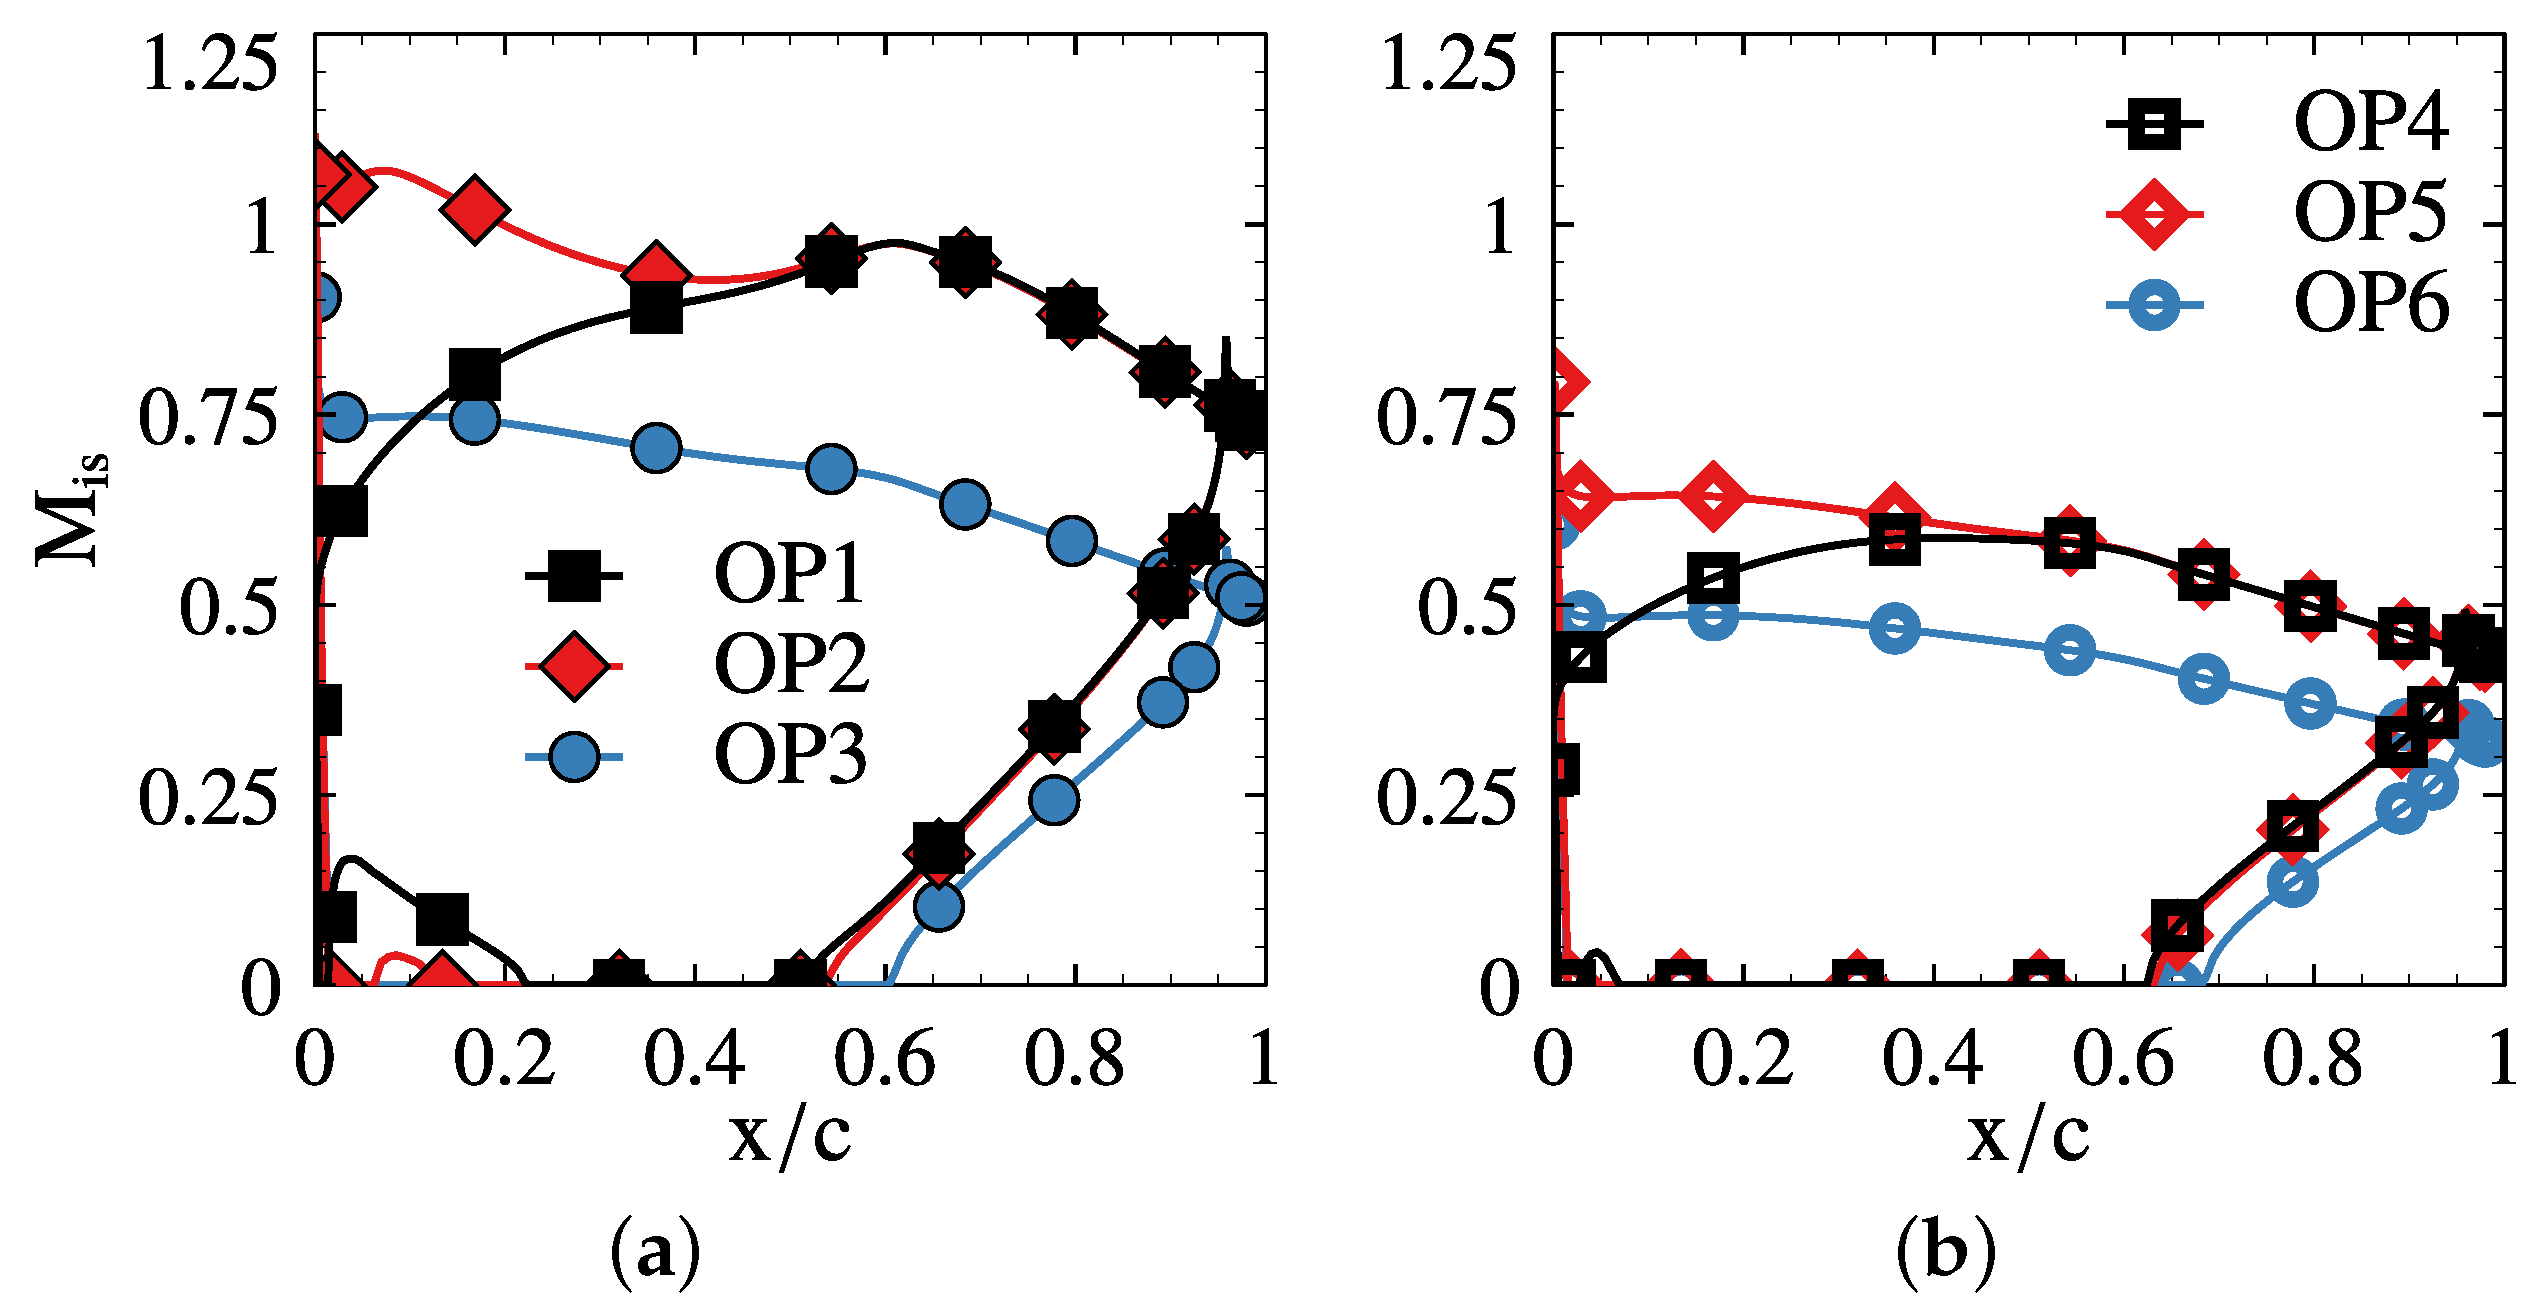
Six different Operating Points (OPs) have been run to unravel the effect of varying the Mach number on the spectra (see Table 1). Their isentropic Mach number distributions over the airfoil are shown in Figure 11. The fundamental changes between the different OPs have been the incidence and Mach number. Some changes can be adressed using the flat plate theory, but others require a detailed simulation of the flow. There are two different groups, the high Mach number cases, i.e., OPs 1-3 (see Figure 11a), and the low Mach number ones, i.e., OPs 4-6 (see Figure 11b). Among them, OP2 and OP5 increase the incidence, i, by 10 , which leads to an increase of the inlet Mach number and the airfoil loading. On the other hand, OP3 and OP6 keep the higher incidence but reduces the pressure ratio to retrieve the same inlet Mach number as OP1 and OP4, respectively with a significant decrease in the exit Mach number.
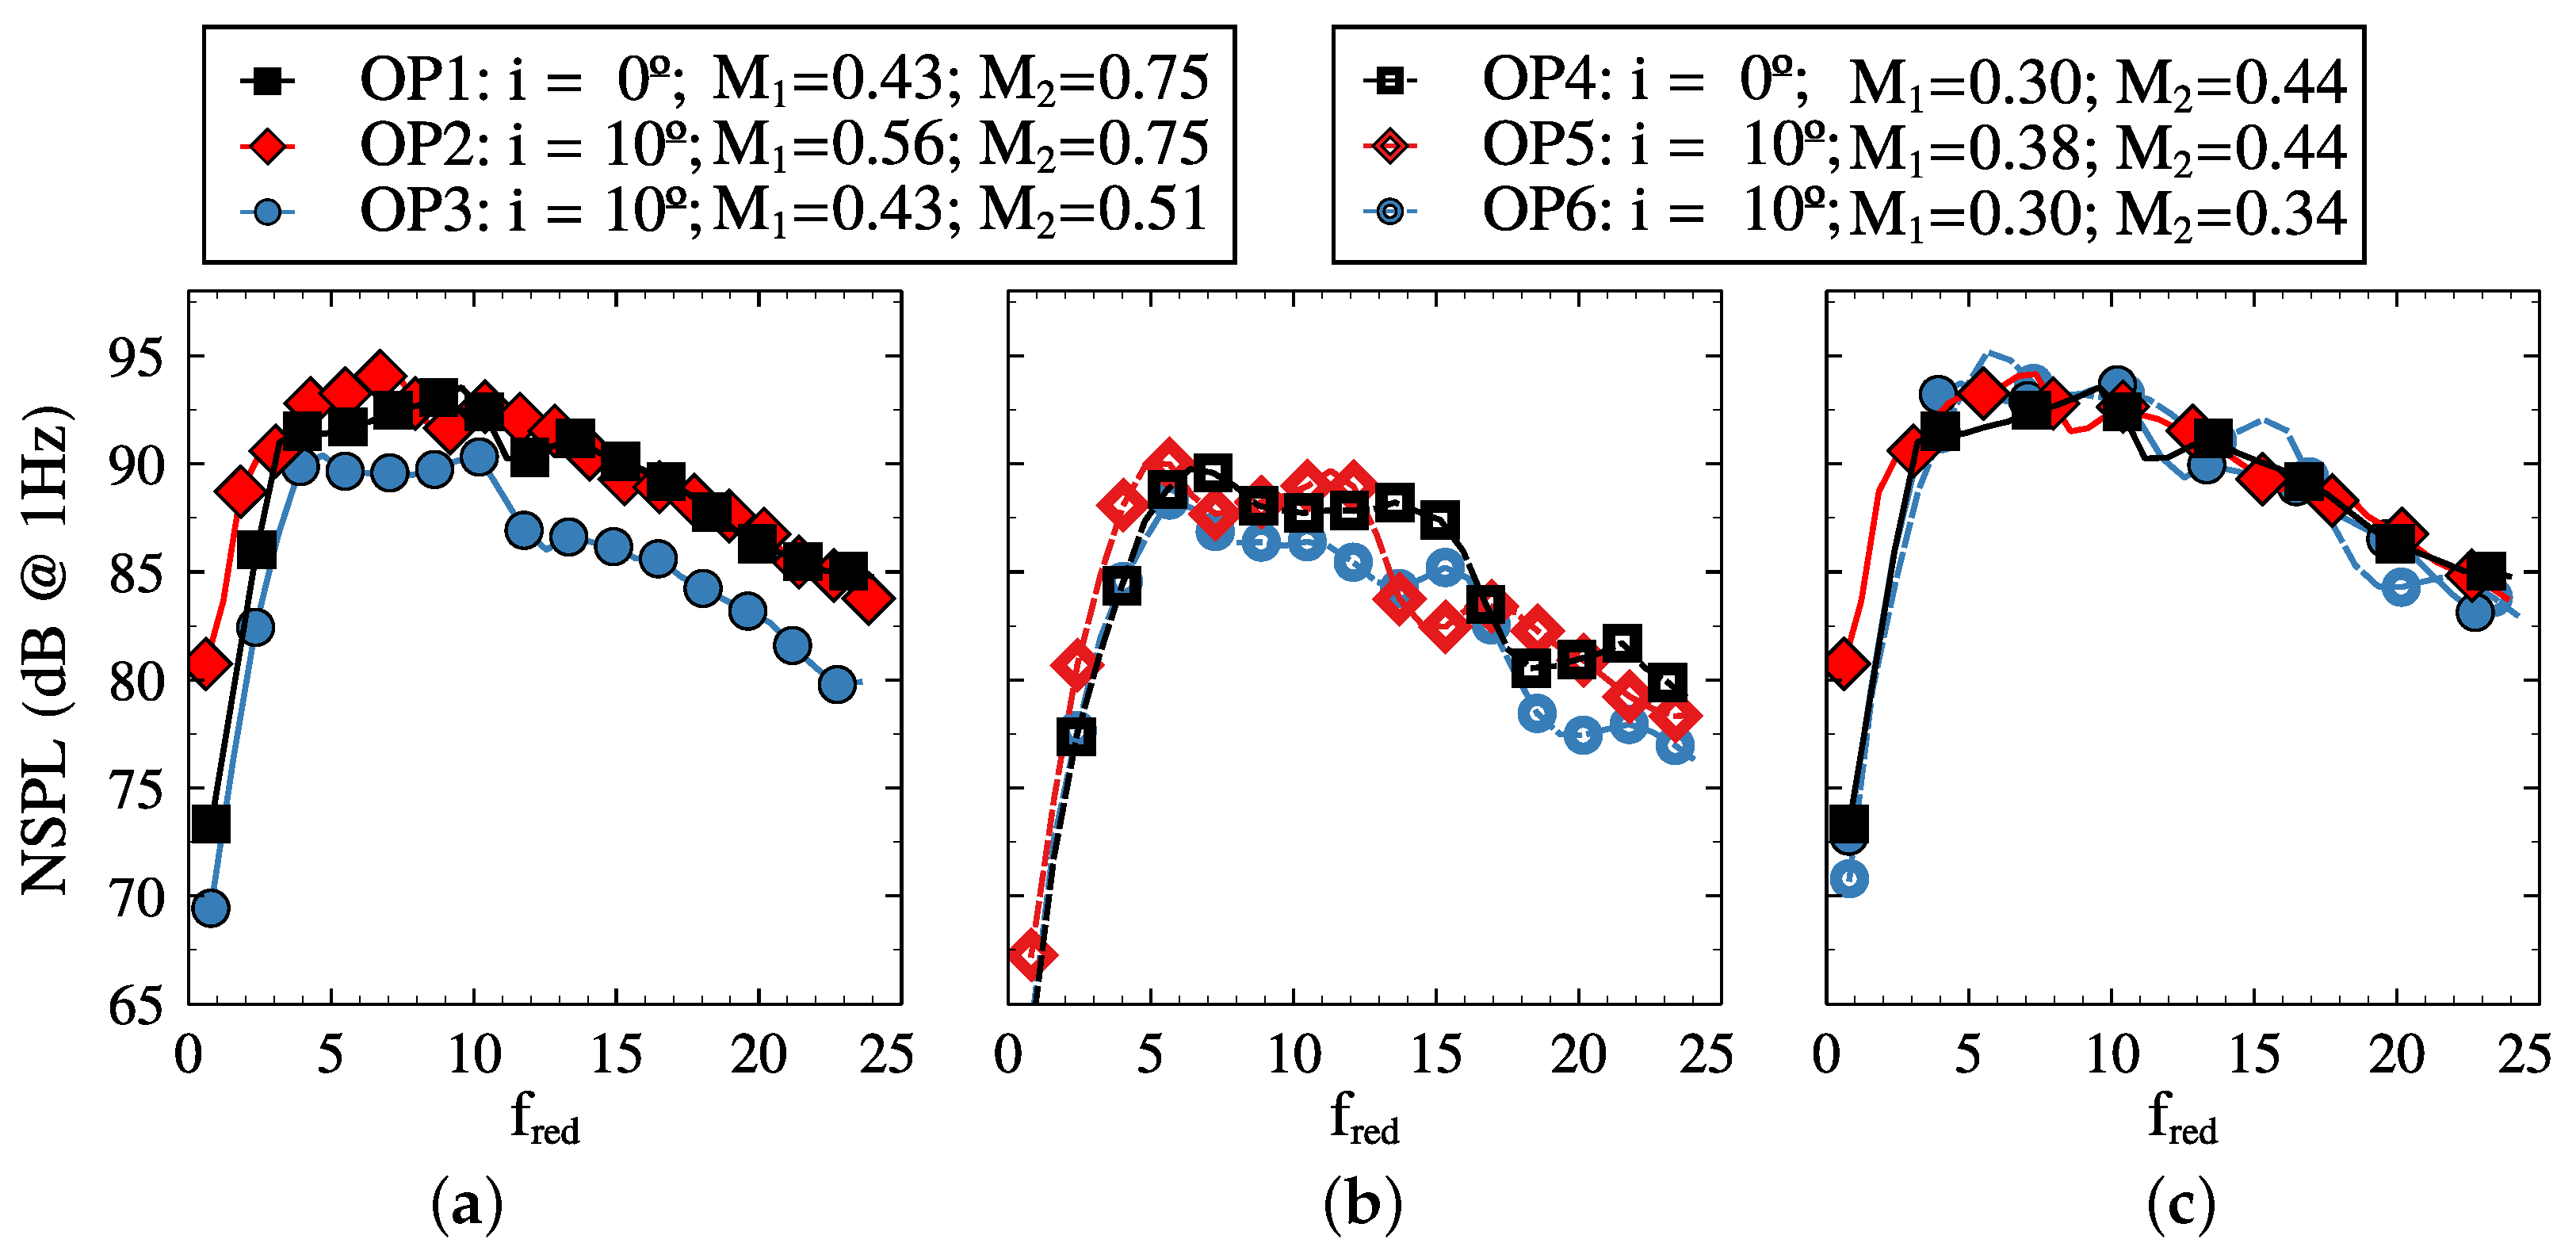
Figure 12 and Figure 13 show, respectively, the inlet and outlet NSPL at all the OPs considered obtained. Figure 12a,b show respectively the results of OPs 1–3 and 4–6, which have been segregated into two sub-figures for clarity. Figure 12c shows the spectra of OP1-3 and OP6 scaled as explained in the lines below; the spectra of OP4-5 are not included for readability purposes. The information depicted in these Figures is complemented by Figure 14, where the spectra modal decompositions are shown, and the cut-on regions at all the OP are seen.
The inlet NSPL is weakly affected by changes in the outlet Mach number, as long as the inlet Mach number remains constant. Figure 12a shows differences between OP1 and OP3 smaller than 2.5 dB, while Figure 12b depicts an even better agreement between OP4 and OP6. Their modal decomposition exhibits significant similarities as well (See Figure 14a,e,g,k), denoting very similar physics and not just an artifact of statistical averaging.
Interestingly, the inlet NSPL scales as NSPL M 1 2 due to the increase of the cut-on region, which has the same scaling. The cut-on regions displayed in Figure 14 scale as M, but there is an additional M factor whose origin is the spanwise wavenumber integration limit of Equation (4). In other words, the total number of modes is a combination of circumferential and span-wise modes whose cut-on regions scale with M. The consistency of this scaling is demonstrated by the rather good collapse of the curves shown in Figure 12c.
On the other hand, the outlet noise levels do not vary significantly with the inlet Mach number, except at low frequency ( f red < 5 ) . OP1 and OP2 (see Figure 13a) and OP4 and OP5 (see Figure 13b) exhibit a close agreement. Figure 14b,d,h,j respectively show as well similar NSPL modal decompositions. The outlet Mach number widens or shortens the downstream cut-on region, as seen in Figure 14, and therefore controls the noise radiated in that direction through the number of modes that are cut-on or cut-off. Changes in the inlet Mach number seem to have a small impact on the outlet NSPL. However, it must be kept in mind that the physical noise is changed as it is scaled with the inlet speed, as clearly reflected by Equation (15). At low reduced frequency, it appears that loading increases by about 3 dB the outlet spectra, which may be related to a stronger stretching of the vortical waves by the flow field.
Following the same argument as for the inlet NSPL, the Outlet noise scales as NSPL M 2 2 due to the increase of cut-on modes. The OP1 and OP3 curves in Figure 13a and the OP4 and OP6 curves in Figure 13b can be fairly well collapsed when these are scaled with M 2 2 , which supposes, respectively a +3.3 and +6.9 dB shift on OP3 and OP6 outlet spectra. The collapsed curves are shown in Figure 13c. The agreement between the OP3 and OP1 is remarkable. The scaled OP6 slightly over-estimates the NSPL up to f red < 17 . However, the matching is still quite good considering the high difference in mean flow properties.
The inlet Mach number is the key parameter for noise generation as it modifies the spectral shapes. The outlet Mach number merely acts as a scaling factor on the noise due to the cut-on region variation. This is justified by the fact that noise is generated mainly at the leading-edge, within most of the frequency range. Therefore, the outlet physical noise, i.e., not normalised with the inlet conditions, scales as SPL M 1 3 M 2 2 . The first factor arises from assuming constant turbulence intensity and the response scaling with the inlet velocity (see Equation (15)). The second arises from the effect of the Mach number on the cut-on condition, as previously discussed. Only at low reduced frequencies does the loading seem to produce relevant changes in the radiated noise. The conclusions obtained herein are not a by-product of statistical averaging as they are also sustained by the NSPL modal decompositions. The trends found in the non-dimensional noise spectra and modal decompositions are consistent in the OP noise analysed, which explore changes in loading at low and medium Mach number levels.

4. Conclusions

A methodology to include the effect of real geometry on the prediction of turbine broadband noise has been presented. The methodology has been applied to a representative low-speed low-pressure turbine airfoil and compared to state-of-the-art industrial techniques, based on the flat plate cascade theory response. Unlike in Fan/OGV noise, the airfoil geometry becomes relevant. The differences in the spectra between the actual airfoil and the equivalent flat plate analysis are up to 6 dB. At low reduced frequency ( f r e d < 12 ) , the turbine airfoil produces substantially higher noise levels than the flat plate, while at higher frequencies, the flat plate becomes louder. Furthermore, the spectrum modal decomposition using both approaches has been shown as well, exhibiting big discrepancies resulting from different physics. On the other hand, when the spectra are integrated in frequency, the differences become much smaller, of the order of 1dB, due to the compensation of the aforementioned effects. The reason for such a small discrepancy is the statistical averaging of the response, which could become much larger under anisotropic turbulence, as pointed out by Devenport et al. [7].
The geometrical effects, namely blade camber, and thickness have been studied separately to understand their impact on the broadband noise footprint. For a typical low-pressure turbine airfoil, the thickness decreases the downstream radiated noise by up to 4 dB at the highest frequencies considered. The blade camber produces a large change of the mean flow properties through the turbine. As described by Evers and Peake [4], amongst other authors, the stretching of vortical waves by a non-uniform flow gives rise to sound generation. This noise generation mechanism seems to appear in highly cambered airfoils up to f red < 12 , giving rise to the aforementioned 6 dB extra noise compared to flat plate methodologies.
The effect of the operating conditions of the turbine airfoil has been assessed by running six different operating points with different Mach numbers and incidences. The inlet Mach number does not significantly affect the outlet NSPL within the OP considered. Conversely, the outlet Mach number acts as a scaling factor of M 2 2 on the outlet noise through the cut-on condition. The loading increase due to the incidence increases the downstream dimensionless noise at low reduced frequencies ( f r e d < 5 ) but seems to have little effect at higher frequencies. Since the results are non-dimensionalised with the inlet properties, the outlet physical noise scales with M 1 3 M 2 2 , assuming constant turbulence intensity, within most of the frequency range considered. On the other hand, the inlet noise remains relatively unaffected by changes in the incidence that lead only to a change in the outlet Mach number if the pressure ratio is kept. These conclusions are also supported by the NSPL modal decomposition, which shows that the rather good collapse of the spectra is not just a product of the statistical averaging. This is the first time that the impact of the turbine airfoil geometry has been included in a broadband noise prediction and compared against state-of-the-art methodologies.

Author Contributions

Conceptualization, R.B.-N. and R.C.; methodology, R.B.-N.; investigation, R.B.-N.; writing—original draft, R.B.-N.; software, R.B.-N.; visualization, R.B.-N.; writing—review & editing R.C.; supervision, R.C.; resources, R.C.; funding acquisition, R.C.; project administration, R.C. All authors have read and agreed to the published version of the manuscript.

Funding

This research was funded by the European Commission through the 2020 Horizon Project TurboNoiseBB under grant number 690714.

Institutional Review Board Statement

Not applicable.

Informed Consent Statement

Not applicable.

Data Availability Statement

Not applicable.

Acknowledgments

The financial support of the European Commission through the European 2020 Horizon project TurboNoiseBB under grant agreement number 690714 is greatly acknowledged. We would like to thank A. Serrano and P. Carrasco (ITP Aero) for all the fruitful discussions during these past years, which have helped to the development of this work. Moreover, we would like to thank ITP Aero for its support during the project.

Conflicts of Interest

The authors declare no conflict of interest.

Abbreviations

The following abbreviations are used in this manuscript:
aSpeed of sound
cBlade chord
f r e d Reduced Frequency
k Wave vector
iIncidence Angle | imaginary unit
mAzimuthal Mode Index
MMach number
rStator Tyler and Sofrin scatter index
RRadius
p, p t Pressure, total pressure
sBlade spacing
S p p Pressure Power Spectral Density
tAirfoil thickness
VNumber of stator vanes
V 0 Streamwise Base flow velocity
U 0 Base flow primitive variables
u r m s Velocity root mean square value
wUpwash velocity
u Primitive perturbed variables
β Acoustic azimuthal wavenumber
γ Acoustic spanwise wavenumber
Φ Velocity power spectral density
F θ Fourier Transform Operator
Λ f Turbulence length scale
L Linearised Navier-Stokes Operator
ρ Density
θ Mean flow angle
ω Angular frequency
Ω Rotor angular speed
NSPLNormalised Sound Pressure Level
OANSPLOverall Normalised Sound Pressure Level
PSDPower Spectral Density
0Flow average variable
˜ Dimensionless Variable
^ Fourier Transform
1, 2Inlet and Outlet Axial Stations

References

  1. Nesbitt, E. Towards a quieter low pressure turbine: Design characteristics and prediction needs. Int. J. Aeroacoustics 2010, 10, 1–15. [Google Scholar] [CrossRef]
  2. Serrano, A.; Aparicio, J.; Vázquez, R. On the estimation and relevance of internally generated turbine broadband noise. Int. J. Aeroacoustics 2010, 10, 51–74. [Google Scholar] [CrossRef]
  3. Gershfeld, J. Leading edge noise from thick foils in turbulent flows. J. Acoust. Soc. Am. 2004, 116, 1416–1426. [Google Scholar] [CrossRef]
  4. Evers, I.; Peake, N. On sound generation by the interaction between turbulence and a cascade of airfoils with non-uniform mean flow. J. Fluid Mech. 2002, 463, 25–52. [Google Scholar] [CrossRef]
  5. Gill, J.; Zhang, X.; Joseph, P. Symmetric airfoil geometry effects on leading edge noise. J. Acoust. Soc. Am. 2013, 134, 2669–2680. [Google Scholar] [CrossRef] [Green Version]
  6. Gea-Aguilera, F.; Gill, J.; Zhang, X. On the effects of fan wake modelling and vane design on cascade noise. J. Sound Vib. 2019, 459, 114859. [Google Scholar] [CrossRef]
  7. Devenport, W.J.; Staubs, J.K.; Glegg, S.A. Sound radiation from real airfoils in turbulence. J. Sound Vib. 2010, 329, 3470–3483. [Google Scholar] [CrossRef]
  8. Myers, M.R.; Kerschen, E.J. Influence of camber on sound generation by airfoils interacting with high-frequency gusts. J. Fluid Mech. 1997, 353, 221–259. [Google Scholar] [CrossRef]
  9. Paruchuri, C.C.; Coupland, J.; Joseph, P. Airfoil geometry effects on turbulence interaction noise in cascades. In Proceedings of the 22nd AIAA/CEAS Aeroacoustics Conference, Lyon, France, 30 May–1 June 2016; p. 2738. [Google Scholar] [CrossRef] [Green Version]
  10. Corral, R.; Escribano, A.; Gisbert, F.; Serrano, A.; Vasco, C. Validation of a linear multigrid accelerated unstructured Navier-Stokes solver for the computation of turbine blades on hybrid grids. In Proceedings of the 9 th AIAA/CEAS Aeroacoustics Conference, Hilton Head, SC, USA, 12–14 May 2003; p. 3326. [Google Scholar] [CrossRef]
  11. Corral, R.; Gisbert, F.; Pueblas, J. Execution of a parallel edge-based Navier–Stokes solver on commodity graphics processor units. Int. J. Comput. Fluid. Dyn. 2017, 31, 93–108. [Google Scholar] [CrossRef]
  12. Guérin, S.; Kissner, C.; Seeler, P.; Blázquez, R.; Carrasco, P.; de Laborderie, H.; Lewis, D.; Chaitanya, P.; Polacsek, C.; Thisse, J. ACAT1 Benchmark of RANS-informed Analytical Methods for Fan Broadband Noise Prediction: Part II—Influence of the Acoustic Models. Acoustics 2020, 2, 617–649. [Google Scholar] [CrossRef]
  13. Blázquez-Navarro, R.; Corral, R. Prediction of fan acoustic blockage on fan/outlet guide vane broadband interaction noise using frequency domain linearised Navier–Stokes solvers. J. Sound Vib. 2021, 500, 116033. [Google Scholar] [CrossRef]
  14. Bechara, W.; Bailly, C.; Lafon, P.; Candel, S.M. Stochastic approach to noise modeling for free turbulent flows. AIAA J. 1994, 32, 455–463. [Google Scholar] [CrossRef] [Green Version]
  15. Batchelor, G.; Proudman, I. The effect of rapid distortion of a fluid in turbulent motion. Q. J. Mech. Appl. Math. 1954, 7, 83–103. [Google Scholar] [CrossRef]
  16. Liepmann, H. Extension of the statistical approach to buffeting and gust response of wings of finite span. J. Aeronaut. Sci. 1955, 22, 197–200. [Google Scholar] [CrossRef]
  17. Goldstein, M.E. Aeroacoustics; McGraw-Hill International Book Co.: New York, NY, USA, 1976; p. 130. [Google Scholar]
  18. Jaron, R.; Herthum, H.; Franke, M.; Moreau, A.; Guérin, S. Impact of Turbulence Models on RANS-Informed Prediction of Fan Broadband Interaction Noise. In Proceedings of the 12th European Turbomachinery Conference (ETC), Stockholm, Sweden, 3–7 April 2017; pp. 3–7. [Google Scholar] [CrossRef] [Green Version]
  19. Ju, H.; Mani, R.; Vysohlid, M.; Sharma, A. Investigation of fan-wake/outlet-guide-vane interaction broadband noise. AIAA J. 2015, 53, 3534–3550. [Google Scholar] [CrossRef] [Green Version]
  20. Burgos, M.A.; Contreras, J.; Corral, R. Efficient edge-based rotor/stator interaction method. AIAA J. 2011, 49, 19–31. [Google Scholar] [CrossRef]
  21. Corral, R.; Vega, A. Physics of vibrating turbine airfoils at low reduced frequency. J. Propuls. Power 2016, 32, 325–336. [Google Scholar] [CrossRef]
  22. Corral, R.; Beloki, J.; Calza, P.; Elliott, R. Flutter generation and control using mistuning in a turbine rotating rig. AIAA J. 2019, 57, 782–795. [Google Scholar] [CrossRef]
  23. Paruchuri, C.; Gill, J.R.; Subramanian, N.; Joseph, P.; Vanderwel, C.; Zhang, X.; Ganapathisubramani, B. Aerofoil geometry effects on turbulence interaction noise. In Proceedings of the 21st AIAA/CEAS Aeroacoustics Conference, Dallas, TX, USA, 22–26 June 2015; p. 2830. [Google Scholar]
  24. Cooper, A.; Peake, N. Trapped acoustic modes in aeroengine intakes with swirling flow. J. Fluid Mech. 2000, 419, 151–175. [Google Scholar] [CrossRef]
  25. Curle, N. The influence of solid boundaries upon aerodynamic sound. Proc. R. Soc. Lond. Ser. A Math. Phys. Sci. 1955, 231, 505–514. [Google Scholar]
  26. Marble, F.; Candel, S. Acoustic disturbance from gas non-uniformities convected through a nozzle. J. Sound Vib. 1977, 55, 225–243. [Google Scholar] [CrossRef]
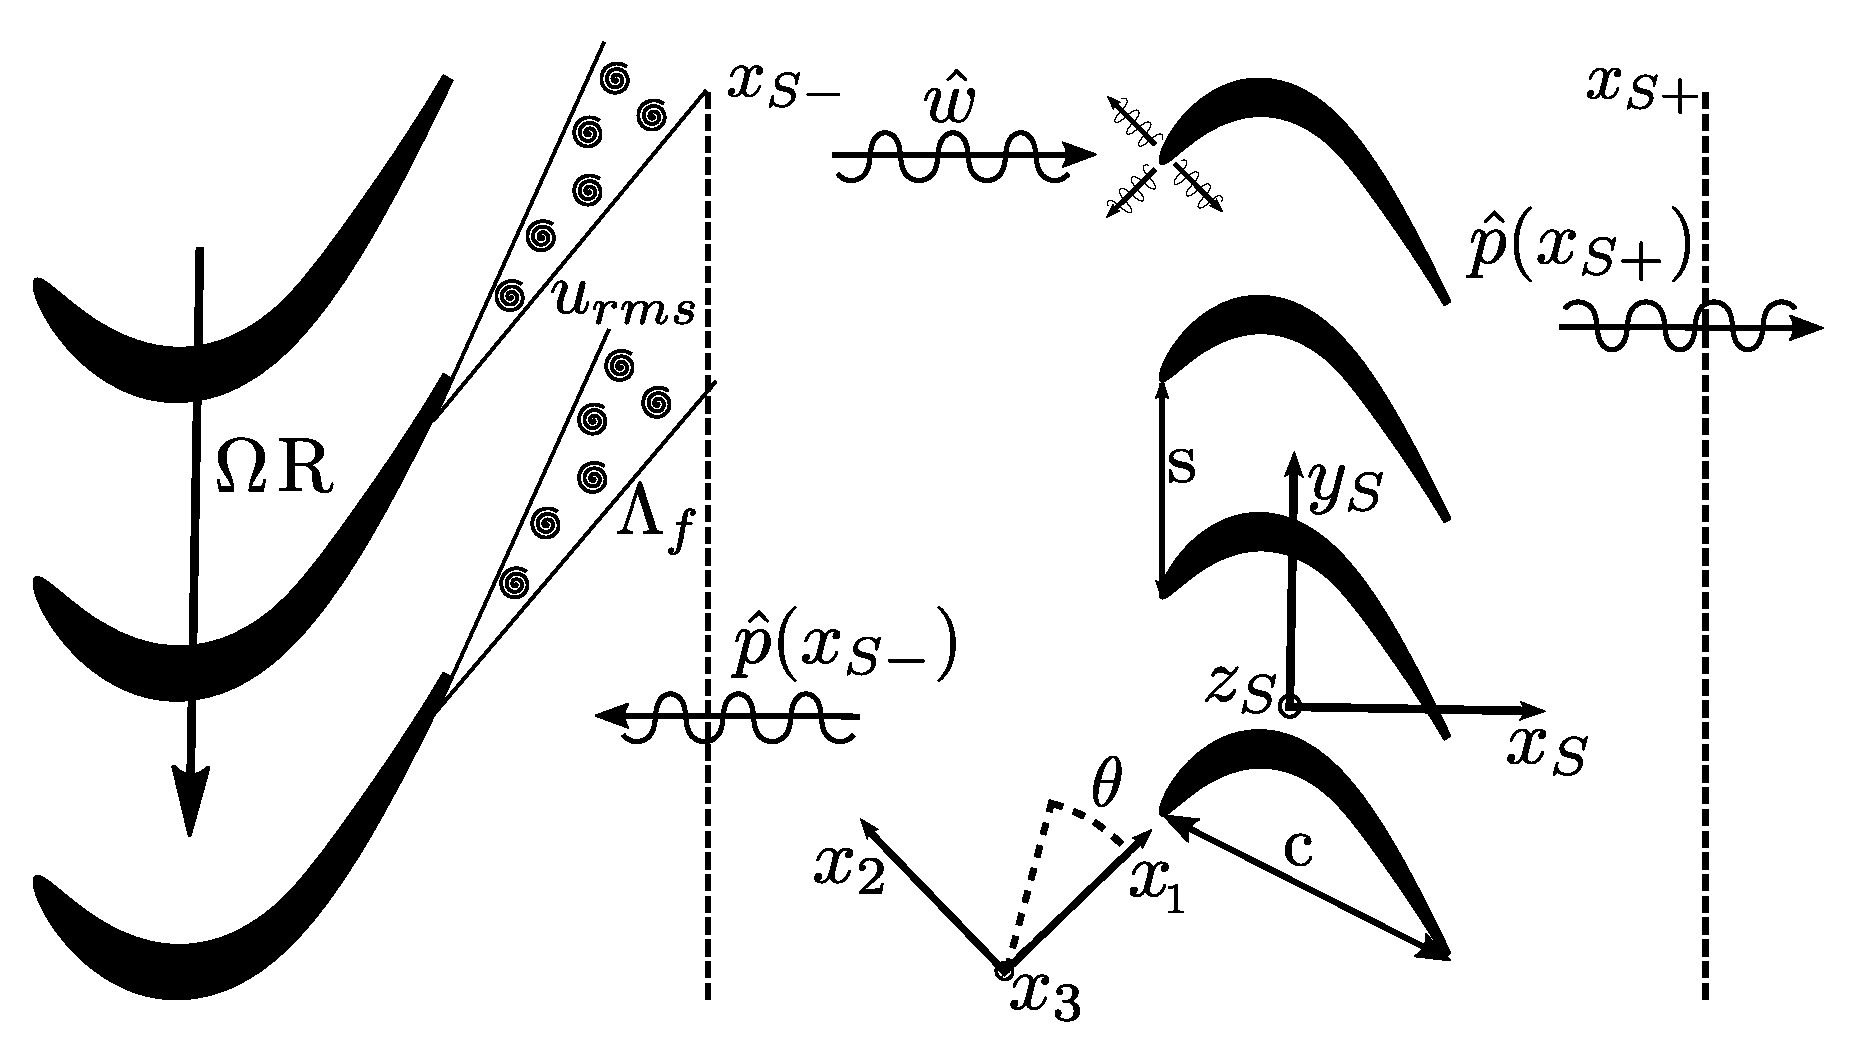
Figure 1. General Scheme of rotor-stator interaction broadband noise.
Ijtpp 06 00042 g001
Figure 2. Time-instant reconstruction of vertical velocity, v , associated with the synthetic turbulent spectrum.
Ijtpp 06 00042 g002
Figure 3. Non dimensional sound pressure level (NSPL) comparison between actual airfoil and equivalent flat plates, A and B. (a): inlet; (b): outlet. Note that the dimensionless pressure and reduced frequency of the flat plate B have been computed using the inlet properties for consistency.
Ijtpp 06 00042 g003
Figure 4. Overall NSPL at the inlet, (a) and outlet, (b), for the three modelling approaches considered.
Ijtpp 06 00042 g004
Figure 5. NSPL modal decomposition accounting for the actual geometry and for the equivalent flat plate cascade as a function of the azimuthal mode index. (a): Airfoil Geometry-Inlet; (b): Airfoil Geometry-Outlet; (c): Flat Plate Geometry-Inlet; (d): Flat Plate Geometry-Outlet.The scale is saturated below the lower limit for enhanced visualisation.
Ijtpp 06 00042 g005
Figure 6. Pressure RMS at different reduced frequencies, with M 1 = 0.42 . (ac): Actual airfoil. (df): Flat Plate. (a,d): f r e d = 3 ; (b,e): f r e d = 15 ; (c,f): f r e d = 21 . A different colour scale is used in each column.
Ijtpp 06 00042 g006
Figure 7. Extraction of the camber line from turbine airfoil and construction of cambered plate and uncambered airfoil with original thickness profile.
Ijtpp 06 00042 g007
Figure 8. Assessment of the impact of zero-camber airfoil thickness on the broadband noise footprint at OP1. Subfigures (a,b) compare, respectively, the results with the airfoil and flat plate approximation at the inlet and outlet. Subfigure (c) shows the difference between both approaches at the inlet and outlet. The least-squares linear fittings are shown, given by equation: Δ PWL = 1.30 + 5.79 f . t max / V (inlet) and Δ PWL = 0.50 + 10.15 f . t max / V (outlet).
Ijtpp 06 00042 g008
Figure 9. Assessment of the impact of blade turning on the broadband noise footprint at OP1. Subfigures (a,b) compare, respectively, the results with the airfoil and the cambered plate approximation at the inlet and outlet.
Ijtpp 06 00042 g009
Figure 10. NSPL modal decomposition accounting for the actual geometry and for the cambered plate cascade as a function of the azimuthal mode index. (a): Airfoil Geometry-Inlet; (b): Airfoil Geometry-Outlet; (c): Cambered Plate Geometry-Inlet; (d): Cambered Plate Geometry-Outlet. The scale is saturated below the lower limit for enhanced visualisation.
Ijtpp 06 00042 g010
Figure 11. Isentropic Mach number distribution on the airfoil at the different OP considered. (a): OP1-3, (b): OP4-6.
Ijtpp 06 00042 g011
Figure 12. Inlet NSPL for different between operating points. (a,b) compare respectively the results of OP1-3 and OP4-6. (c) shows the NSPL of OP1-3 and 6 scaled with the inlet Mach number squared, M 1 2 .
Ijtpp 06 00042 g012
Figure 13. Outlet NSPL for operating points 1–6. (a,b) compare, respectively, the results of OP1-3 and OP4-6. (c) shows the NSPL of OP1-3 and 6 scaled with the outlet Mach number squared, M 2 2 .
Ijtpp 06 00042 g013
Figure 14. NSPL modal decomposition at all the OP considered. Left column: inlet. Right column: outlet. (a,b): OP1; (c,d): OP2; (e,f): OP3; (g,h): OP4; (i,j): OP5; (k,l): OP6.The scale is saturated below the lower limit for enhanced visualisation.
Ijtpp 06 00042 g014
Table 1. Definition of the operating points.
OP p 2 / p t , 1 i M 1 M 2
OP10.680 0.430.75
OP20.6810 0.560.75
OP30.8310 0.430.51
OP40.860 0.300.44
OP50.8610 0.380.44
OP60.91910 0.300.34
Table 2. Geometrical and flow parameter definitions of the airfoil and its equivalent flat plates.
OP M 1 M 2 s/c θ 1 θ 2 Λ ˜ f
Airfoil0.430.750.85544 −59 0.075
Flat Plate A0.430.430.85544 44 0.075
Flat Plate B0.750.750.855−59 −59 0.075
Publisher’s Note: MDPI stays neutral with regard to jurisdictional claims in published maps and institutional affiliations.