1. Introduction
The problem of stall and surge instabilities developing in axial compressors is nearly as old as the first gas turbine [
1,
2], and the loss of stability of axial compressors at a high-pressure ratio is still nowadays an important limitation of the global performance of modern aero engines, as the occurrence of these phenomena can cause dramatic events. It thus leads engine manufacturers to apply a consequent security margin (the so-called stall margin (
SM)) to keep the compressor far from its stability limit. This deprives the machines of their higher-pressure ratio and higher-efficiency operating ranges, which penalises the global performance of the engine. Stall margin improvements (
SMI) can be achieved by various methods: a large number of works in the literature are devoted to passive control techniques, such as casing treatments [
3]. These methods involve permanent modifications of the casing that cannot cope with changes in flow conditions. Using active flow control systems, which can easily be turned off and on, is thus an attractive alternative, and many research works have been carried out concerning this kind of techniques and were summarised recently by Li et al. [
4]. One should keep in mind, however, that such methods come with some technical drawbacks in terms of complexity, added weight and, potentially, reliability issues. According to Day’s review [
2], the most common stall inception in the modern engines is the spike, which originates from phenomena occurring at the blade tip [
5,
6]. The most efficient way to control these phenomena is, thus, to blow a high-momentum jet at the blade tip, as demonstrated by several authors [
7,
8,
9], to decrease the loading and/or act on the dynamic of the tip gap vortex. Among all the literature dedicated to this subject, there is a consensus about some specific characteristics of the control system that must be used to obtain a significant effect in terms of
SMI:
The jet has to be as close as possible to the casing wall; consequently, many authors have successfully used the Coandă effect to get a wall-attached jet [
10,
11].
A high momentum (or high velocity) and good angular coverage [
9] are needed.
Nevertheless, some points remain unclear. As stated by Li et al. [
4], there is no consensus about the effect of the yaw angle (positive angle values are given by the rotor rotation direction). Whereas the first paper [
12] originally claimed that a positive yaw angle is better, other authors have demonstrated the opposite [
13,
14]. In addition, to the best of the authors’ knowledge, the balance between the energy cost of blowing and the positive effect on machine performance has never been clearly established. It is therefore difficult to answer the question of whether such a system “pays its place” in a real engine. Finally, the potential interest of pulsed blowing has barely been addressed [
7], whereas it has shown its efficiency in some other flow control applications, such as separation control [
15].
In previous studies conducted in the laboratory by the same research team, the flow mechanisms involved during the onset of stall with and without active flow control have notably been analysed. The control system effectively succeeded in increasing the operating range of the compressor by neutralising the spike mechanisms and by moving the last stability point close to the maximum of the performance curve. For some control configurations, a low-frequency phenomenon appears in pressure measurements, suggesting a transition from spike-type stall to modal-type stall inception. In addition, some important effects, such as the injected momentum, have been investigated [
16,
17].
This paper aims to complete this previous study by addressing the above-mentioned questions concerning the yaw angle and energy balance of the system using pulsed actuation. This study relies on an experimental parametric study conducted on the same single-stage axial compressor test bench equipped with a modular flow injection system [
17]. After a description of the experimental set-up, the paper focuses on the effect of the blowing angle at several rotation speeds to clearly point out the effect of blowing on the rotating frame. The paper is then dedicated to an estimation of the energy costs and savings of the control system to try to evidence the most interesting blowing strategies in pulsed or continuous blowing. This work is the first part of the EU-funded Horizon 2020 research project ACONIT [
18], which aims at designing, manufacturing and testing actuators for flow control for implantation in an aircraft engine.
2. Experimental Set-Up
The support of the experiments performed in this research work is the low-speed, single-stage axial compressor CME2 located at the Arts et Métiers Institute of Technology in Lille (France). This compressor is a subsonic machine comparable to a stage of a high-pressure component of an aero engine [
2]. Initially designed as a convenient tool to study rotating stall [
19,
20], this specific test bench has been equipped in the recent years with an active flow control (AFC) system relying on magnetic valves to produce pulsed jets [
16].
The compressor itself, depicted in
Figure 1a and whose characteristics are listed in
Table 1, is operated at rotational speeds ranging from 3200 rpm to 4500 rpm. A typical performance curve is provided in
Figure 1b, plotting the total-to-static pressure rise coefficient
as a function of the flow coefficient
. During the tests, the mass flow is varied using a throttling valve located downstream of the compressor stage (see
Figure 1a). In this paper, stall is triggered by continuously closing the throttling valve up to the unstable part of the performance curve.
The performance of the compressor is evaluated using two differential pressure sensors located on the test rig. The first sensor measures the difference between the total pressure recorded in the plenum chamber and a mean static pressure measured at the end of the converging pipe located just downstream of the plenum chamber. This value allows capturing the dynamic pressure at the compressor inlet, and then the flow rate. The second sensor is used to evaluate the stage performance by measuring the static pressure in front of the rotor and downward of the stator. The precision of these measurements has been evaluated to ±0.012 kg·s
−1 and ±1.5 Pa for the flow rate and the total-to-static pressure rise, respectively [
16].
The control system [
17] (see the overall description in
Figure 2) consists of 20 injection blocks, each one counting two injectors. This configuration was selected because of the space constraint caused by the curvature of the casing. A solenoid valve (Matrix MX821), whose driving frequency can be set between 0 (continuous) and 500 Hz, with a supply pressure of up to 8 bar, feeds each injector. Each injector can be then operated independently and can produce a jet speed of up to 200 m·s
−1 through a 10 × 0.5 mm
2 slot. Accordingly, the injected mass flow can be set from 0 to approximately 2.5% of the main flow rate of the stage either by changing the supply pressure or by changing the duty cycle (DC) of the solenoid valves when pulsed injection is used. The duty cycle is defined as the blowing time duration divided by the total period duration (i.e., the sum of blowing and no blowing time). All solenoid valves are driven by the same command signal, and manufacturer data indicate a response time lower than 1 ms. As stated in the literature, blowing is most effective in front of the rotor leading edge [
14], and the critical area is located at the tip, close to the casing [
4]. Consequently, actuators are located 10 mm upstream of the rotor (
x = −20% ∙
Cx), and injectors are shaped using the Coandă effect to blow along the casing right in the tip gap [
11]. Injectors can also be rotated along their axis to vary the yaw angle of injection with an angular step of 15°.
The experimental protocol is extensively described in a previous paper [
17], but key information is reported here for the sake of completeness. In a typical stall test, the working point of the compressor is moved along the performance curve using the controlled closing of a throttling valve. Stall is easily perceptible through an abrupt drop in the mass flow and pressure ratio. The baseline curve is compared with a controlled curve, which is obtained with control activated for the entire working range of the compressor. There is thus no issue with activation delay of the active flow control system.
A typical example of results of the flow control system is proposed in
Figure 3, where the total-to-static pressure rise coefficient is plotted as a function of the flow coefficient. For each control case, the actual value of the global mass flow rate injected is specified along with the duty cycle (in pulsed blowing). Here and subsequently, the baseline results correspond to the performance of the compressor without control and the injected mass flow rate
is expressed in scaled form,
, as a percentage of the compressor flow rate at the last stable operating point before stall without control,
. It is obvious from these results that the blowing acts positively on the stable operating range of the compressor.
To evaluate the effect of the control system on the performance curve of the machine, the definition of the stall margin improvement given by Weigl et al. [
21] is used and calculated using the following equations:
with
and
, respectively, being the flow rate and the pressure ratio. Please note that in Equations (1) and (2), along with
Figure 4, the subscripts
N and
S refer to quantities at the nominal operating point and at the last stable operating point, respectively, before stall (i.e., the operating point with the lowest flow rate before stall onset). Similarly, subscript
B refers to the baseline case, without control, and
C to the controlled case.
3. Effect of the Injection Yaw Angle
To highlight the effect of the injection yaw angle, a first series of experiments were conducted at 3200 rpm. The absolute blowing flow angle α
jet, the velocity (or the injected mass flow rate) and the number of injectors activated were varied. Absolute and relative blowing flow angles are defined in
Figure 5. Positive absolute blowing angle values are given by the rotor rotation direction in the study; therefore, the absolute blowing angle is considered negative when the blowing direction is opposite to the rotor rotation direction.
Several basic test results of the active flow control in continuous blowing at 3200 rpm with 40 injectors activated and various absolute blowing flow angle and injected mass flow rate values are detailed and presented in
Figure 6. The total-to-static pressure rise coefficient is plotted as a function of the flow coefficient for the six absolute blowing flow angles investigated: 30°, 15°, 0°, −15°, −30° and −45°. It can be seen that as already observed in
Figure 3, for each absolute injection angle, the blowing extends the operating range of the compressor and simultaneously increases the compressor performance. It is also rather obvious that higher benefits are obtained for negative absolute blowing flow angles.
To investigate the effect of the blowing flow angle, the stall margin improvement was calculated for each experiment reported in
Figure 6, and the results are reported in
Figure 7. To make the comparison of the different sets of parameters easier, the absolute blowing velocity
was scaled by the rotor tip speed. The velocity of the jet,
, was obtained by hot-wire measurements conducted on the injectors in a dedicated fluidic actuator test bench [
16]. In addition, the results are presented as a function of the relative blowing flow angle
βjet, i.e., the jet flow angle seen by the blade, which was derived from the absolute velocity and angle of the jet, and the rotor tip speed using the velocity triangle (see
Figure 5).
For the majority of the tested jet velocities, the stall margin improvement presents a clear and monotonic increase as the relative blowing angle decreases and reaches in most cases a maximum value for relative flow angles in the range between −60° and −70°. It then appears to remain relatively constant or to decrease slightly at lower relative flow angles.
The effect of the rotation velocity was investigated and is presented in
Figure 8. The stall margin improvement is plotted as a function of the relative blowing angle for two main rotor rotational velocities: 3200 and 4500 rpm. After scaling the absolute blowing velocity by the appropriate rotor tip speed, results were fairly close for the two different rotational speeds. The monotonic increase in the stall margin improvement with the decreasing of the relative blowing angle and the plateau reached around −60° and −70° is once again clearly apparent. It has to be pointed out that the inlet blade angle at the tip (depicted in
Figure 8 by the vertical blue dashed line) of this compressor is −65°. It thus appears that the highest effect of the stall margin improvement is obtained for relative blowing angles close to the inlet blade angle, which is consistent with some previous experimental observations [
7].
This can also be easily explained as this blowing angle is certainly most suitable for decreasing the blade loading at the tip and thus preventing the mechanism occurring at the tip and leading to rotating stall.
4. Energy Balance
The main goal of the control system is to improve the compressor stall margin. An additional benefit is the improvement in the pressure rise provided by the compressor stage (and thus a gain in the energy provided by the compressor to the flow). Nevertheless, the generation of jets involves an energy cost. The power balance, introduced next, can be seen as the net benefit (energy gain – energy cost) of the control system. So, if it is negative, then the use of the control system costs more than it brings in.
The power balance (
PB) of the control system is thus evaluated by subtracting the power cost (
PC) of the blowing to the associated power gain (
PG), as defined below:
Regarding the cost, it is the power consumed by the blowing system. In this case, we use a screw compressor to pressurise the air and solenoid valves to carry out the pulsed blowing. It is therefore possible to estimate the cost of the injection through the electrical power consumed by all these elements. However, this includes many other factors that are not of direct interest, such as the choice of the solenoid valve or the way in which compressed air is generated, which can be subsequently improved and which will undoubtedly be different from the final solution embedded in an engine. Consequently, the power consumed by the injection system at the last level is estimated by evaluating the aeraulic power added by the jets. Please note that in this study, the temperature of the injected air was close to the ambient one, as several buffer tanks (a large 500 L tank followed by two smaller 15 L ones) are present in the pressured air supply system.
The power cost (
PC) of the blowing is defined as the kinetic power added to the flow by the jets:
where
is the global injected mass flow rate and
the mean jet velocity at the actuator nozzle.
The power gain (
PG) is evaluated by comparing the performance of the compressor with and without control at the flow rate corresponding to the last stable operating point without control (see the representation given in
Figure 9). More precisely, it is defined as the difference between the net power available in the fluid downstream of the compressor with and without control;
where
is the flow rate at the last stable operating point before stall without control;
the static pressure;
the velocity;
the density; and the indexes
2,
C and
B, respectively, the stage outlet, the controlled configuration and the baseline (configuration without control).
4.1. Continuous Mode
Figure 10 presents the results of a series of tests performed on the compressor operating at 3200 rpm. All the experiments reported on the graph correspond to continuous blowing, with an absolute blowing angle
αjet = −30°. This absolute blowing angle was retained for the rest of the study as it allowed achieving the best
SMI, according to the reasons developed, due to the results in
Figure 7. The effect of the number of injectors used (
N) and the global blowing flow rate was examined. The figure shows, for each tested configuration, the
SMI achieved compared to the power balance (
PB) of the considered control strategy. On this graph, the most interesting points are on the top and the right of the figure, as they correspond to control parameters achieving significant
SMI with a positive power balance.
Some remarkable points in the graph are highlighted with letters, from A to F. Points A, B and C correspond to strategies that allow reaching the greatest SMI. Nevertheless, these configurations correspond to the maximum number of injectors with the maximum flow rate (and velocity) per injector. Consequently, the energy cost is high, and the energy balance for this specific case is unfavourable. Points D, E and F correspond to interesting applicative configurations as they allow to obtain a fairly good SMI (from 55% for point F to 80% for point D) with a positive power balance, which can reach 1.8% of the compressor nominal power.
These most interesting points are all obtained for configurations with 30 to 40 injectors activated, which means that good angular coverage is necessary to reach a good compromise between the
SMI and the positive power balance. This need for a sufficient angular coverage was also highlighted by Suder et al. [
8] and more recently by Margalida et al. [
16,
17]. This parameter is determining for the increase in the
SMI. It seems that this is also the case for the energy balance.
The second observation coming from
Figure 10 is that whatever the number of injectors used, when the flow rate starts to increase, both the
SMI and the power balance increase, leading to the best configurations, such as points D, E or F. When the blowing flow rate continues to increase, the
SMI continues to increase [
14], whereas the power balance deteriorates rapidly.
Figure 11 shows the evolutions of the power gain (a), the power cost (b) and the power balance (c) as a function of the injected flow rate. What can be clearly observed is that the power gain is low for a low injected flow rate (less than 1%) and that the power gain grows almost linearly and more rapidly than the power cost, which evolves approximatively as the jet speed cubed (or the injected flow rate cubed). This evolution leads to a rapid growth of the cost for values higher than 1–1.5%, leading to rapid degradation of the power balance (
Figure 11c). What can also be noticed in
Figure 11b is that for a given injected flow rate, the power cost is lower for the configuration with more injectors activated: in this case, the flow rate is distributed between more injectors, which leads to a lower velocity per injector and a lower cost, according to Equation (4).
The fact that the power balance is positive for a large range of
indicates that the blowing leads also to an increase in the blade work at the tip and/or a decrease in the losses (the profile losses close to the tip, as the flow is realigned with the blade inlet angle and certainly also to the losses associated with the secondary gap flows, as demonstrated in the case of an isolated blade, for some blowing configurations [
22]).
4.2. Pulsed Mode
Figure 12 presents a typical evolution of the stall margin improvement with the actuation frequency, in pulsed mode. Note that in
Figure 12, no result is presented for frequencies above 200 Hz, as beyond this value, the response time of the valve becomes significant compared with the blowing duration. In this case, 40 injectors are activated, and the global injected mass flow rate is kept constant (here 0.03 kg/s) at different actuation frequencies with the same duty cycle (
DC = 0.7). The absolute pulsed blowing angle is −30°, and the rotor rotation speed is set at 3200 rpm. It can be seen that there is a strong dependency between the
SMI and the actuation frequency. The stall margin improvement grows almost monotonically with the frequency and reaches its maximum for a value close to the maximum frequency allowed by the system. However, this maximum value is almost already reached around an actuation frequency of 200 Hz. Consequently, the results in pulsed actuation that are presented correspond to the best results in terms of the
SMI. Please note that in this study, all injectors pulsated simultaneously but that a variating actuation in the circumferential direction was also possible with this set-up (as previously performed a few times in the literature [
2]).
Figure 13 reports the comparison of the stall margin improvement and power balance for several pulsed actuation tests compared to the points obtained in continuous mode for 30 and 40 injectors activated. The absolute injection angle and the rotation speed are kept constant and equal, respectively, to −30° and 3200 rpm. It is clear that the benefit of pulsed actuation is not obvious in terms of the
SMI, as it allows reaching values up to 50% maximum, sensibly lower than the higher ones obtained in continuous blowing.
Nevertheless, if the power balance is considered, pulsed actuation presents a real interest. Point H is able to reach, in pulsed actuation, an SMI performance close to the one obtained by point F (in continuous blowing) with a lower flow rate taken from the external system and a better power balance.
5. Conclusions
This study reports the results of flow control application for stall margin improvement (SMI) using an experimental parametric study conducted on a single-stage axial compressor test bench. The machine is equipped with fluidic actuators installed on the casing, upstream of the rotor. A series of experiments with various blowing conditions in pulsed and continuous modes were conducted. In particular, the aim of the study was, firstly, to shed some light on the controversial influence of the blowing yaw angle. Secondly, it was also an opportunity to carry out a never-seen investigation of the energy budget of such control methods applied to an axial compressor.
Concerning the blowing yaw angle effect, it appears that blowing angles, in the relative frame, close to the blade angle at the tip produce the best results in terms of the
SMI, as, at this blowing angle, the jet directly acts on the blade loading at the tip and thus prevents the phenomena at the origin of stall. It is then not a matter of positive or negative absolute values, as stated often in the literature, and this confirms some findings of Kefalakis et al. [
7]. For real applications, the relative blowing angle is not the easiest parameter to adjust, as it depends on the blowing velocity, the absolute blowing angle and the rotor speed. Fortunately, a high
SMI value appears to be achieved for a quite large range of relative blowing angles. It means that a single absolute blowing angle can cover several operating points.
Concerning the energy budget, this study has shown that some of the blowing configurations present a positive net gain on the energy balance for an SMI up to 110% and up to nearly 140% with a net energy consumption. Former configurations imply sufficient angle coverage and are obtained when an advantageous balance is achieved between the positive effect of the blowing (increase in the SMI, decrease in the losses) and the energy cost necessary to produce high-speed jets. The benefit of using pulsed blowing is not obvious in terms of the SMI but is clearly interesting for the power balance as some configurations allow a positive power balance of 2% with a still interesting SMI of 50%.
The analysis of the efficiency of any flow control system devoted to reducing the energy consumption is always an interesting step, as it allows to state whether such a system “pays its place” in a complex industrial machine, such as an aircraft, where every gram counts. This study is in that sense enlightening, as it allows imagining various uses of the different tested configurations. Firstly, the highest SMI points, despite their net energy cost, could be devoted to critical situations where the safety and level of engine performance need to be maintained. One thinks of take-off and landing cases and of combat situations at high angles of attack to cope with inlet distortion effects. On the contrary, even with a lesser SMI, a configuration exhibiting a net positive energy gain could be continuously used to improve the overall efficiency of the engines and thus reduce their environmental impact.
This study constitutes an encouraging proof-of-concept that active flow control is viable from an energy point of view at the laboratory scale, that is, on a simplified, low-speed and single-stage test rig using low-TRL actuators. The next step is now to reproduce and validate the concept on a real engine using industrial-grade actuators. This constitutes the next step of the current project and will be published in the near future.

 and
and 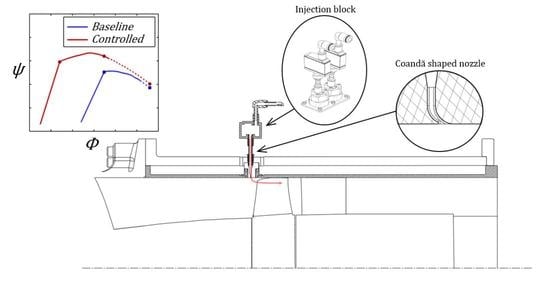


