Article

Impact of Methane and Hydrogen-Enriched Methane Pilot Injection on the Surface Temperature of a Scaled-Down Burner Nozzle Measured Using Phosphor Thermometry

1
Division of Combustion Physics, Department of Physics, Lund University, 22100 Lund, Sweden
2
Division of Fluid Mechanics, Department of Energy Sciences, Lund University, 22100 Lund, Sweden
3
Siemens Energy AB, 61231 Finspång, Sweden
*
Author to whom correspondence should be addressed.
Int. J. Turbomach. Propuls. Power 2022, 7(4), 29; https://doi.org/10.3390/ijtpp7040029
Submission received: 7 September 2022 / Revised: 25 October 2022 / Accepted: 28 October 2022 / Published: 1 November 2022

Abstract

:
The surface temperature of a burner nozzle using three different pilot hardware configurations was measured using lifetime phosphor thermometry with the ZnS:Ag phosphor in a gas turbine model combustor designed to mimic the Siemens DLE (Dry Low Emission) burner. The three pilot hardware configurations included a non-premixed pilot injection setup and two partially premixed pilot injections where one had a relatively higher degree of premixing. For each pilot hardware configuration, the combustor was operated with either methane or hydrogen-enriched methane (H2/CH4: 50/50 in volume %). The local heating from pilot flames was much more significant for hydrogen-enriched methane compared with pure methane due to the pilot flames being in general more closely attached to the pilot nozzles with hydrogen-enriched methane. For the methane fuel, the average surface temperature of the burner nozzle was approximately 40 K higher for the partially premixed pilot injection configuration with a lower degree of mixing as compared to the non-premixed pilot injection configuration. In contrast, with the hydrogen-enriched methane fuel, the differences in surface temperature between the different pilot injection hardware configurations were much smaller due to the close-to-nozzle frame structure.

Graphical Abstract

1. Introduction

Modern combustion devices, e.g., gas turbines, must achieve high efficiency with low emissions to be competitive in the future. One widely used strategy to achieve this is to use renewable and less carbon intensive fuels. Hydrogen can potentially play a significant role as a carbon-free renewable and sustainable energy carrier. Several studies [1,2,3] showed that hydrogen-enrichment has the potential to significantly reduce CO and NOx emissions and to extend the lean operation limit.
A significant challenge for gas turbines is flame stabilization in the combustion chamber. A common technique to improve the stabilization of the flame is to use swirling flames which generate a vortex breakdown forming inner and outer recirculation zones [4] (IRZ and ORZ, respectively) which enhance the ignition of fresh reactants. Such flows confine the flame in a relatively small volume enhancing the mixing between recirculated hot combustion products and the fresh fuel/air mixture [5,6,7,8,9].
Lean premixed combustion is a recognized approach in the field of stationary gas turbines to lower the flame temperature and limit thermal NOx formation pathways [10,11,12]. However, lean premixed combustion close to the lean blowout (LBO) limit, may lead towards local extinction, poor combustion efficiency, and thermoacoustic instabilities [4,9,13,14]. Enrichment of more reactive species, such as hydrogen, in the fuel, and inclusion of pilot flames can improve flame stabilities at near LBO conditions and extend the operability range. H2 can be burnt at ultra-lean premixed conditions due to its strong reactivity and diffusivity [15,16], while the hot radicals and the heating from the pilot flames enhances the main flame stability [17,18,19].
The burner nozzle’s surface temperature in a gas turbine, altered by the pilot flames or the enrichment in the fuel mixture, can influence the flame stagnation and stabilization. Higher nozzle temperature leads to higher gas temperature which in turn results in higher bulk velocity. Higher bulk velocity shifts the flame anchoring position downstream which leads to shorter post-flame residence time. Additionally, during the development of the burner, knowledge of the components’ surface temperature in the combustion chamber can be used to achieve appropriate balance between the material lifetime and thermal efficiency. Therefore, it is highly important to understand the impact of non-premixed and premixed pilot flames on the main flame stability and on the heating load to the burner nozzle surface.
Surface phosphor thermometry is a remote sensing and relatively non-intrusive technique where a phosphor coating on the surface of interest is needed [20,21]. The phosphor is excited, often with pulsed laser light, and the characteristics of the luminescence are used for temperature determination [22]. The lifetime method is used in the current study, where one uses the lifetime of the phosphor luminescence to measure temperature. Although the uncertainty of the intensity ratio measurements has reduced in recent studies [23,24], the lifetime method is employed here due to its high precision at high temperatures [25,26].
Phosphor thermometry has been previously used for wall temperature measurements in a gas turbine combustor [27,28] and surface temperature of stator vanes placed in an afterburner flame [29]. The technique has also been used in atmospheric conditions in model combustors to determine the surface temperature of a bluff body used to stabilize the combustion [30] and the wall temperature of a model combustor [31]. In the current study, phosphor thermometry is used to investigate how the surface temperature of a pilot flame nozzle is impacted by different pilot hardware configurations which has not previously been studied with this measurement technique.
In a previous work, the impact of pilot flames on flame stabilization and emissions for the lab-scale gas turbine model combustor (GTMC), based on the Centre for Combustion Science and Technology (CECOST) burner [32,33] was investigated [34]. This work is continued in the current study with the primary objective of investigating the effects of pilot hardware configurations, including non-premixed and partially premixed pilot flames on the surface temperature of the pilot flame nozzles using methane and hydrogen-enriched methane as fuels. Furthermore, the thermographic phosphor measurements were combined with OH Planar Laser Induced Fluorescence (PLIF) and time-averaged flame luminescence images to characterize the surface temperatures and the structures of the main flame and the pilot flames.

2. Materials and Methods

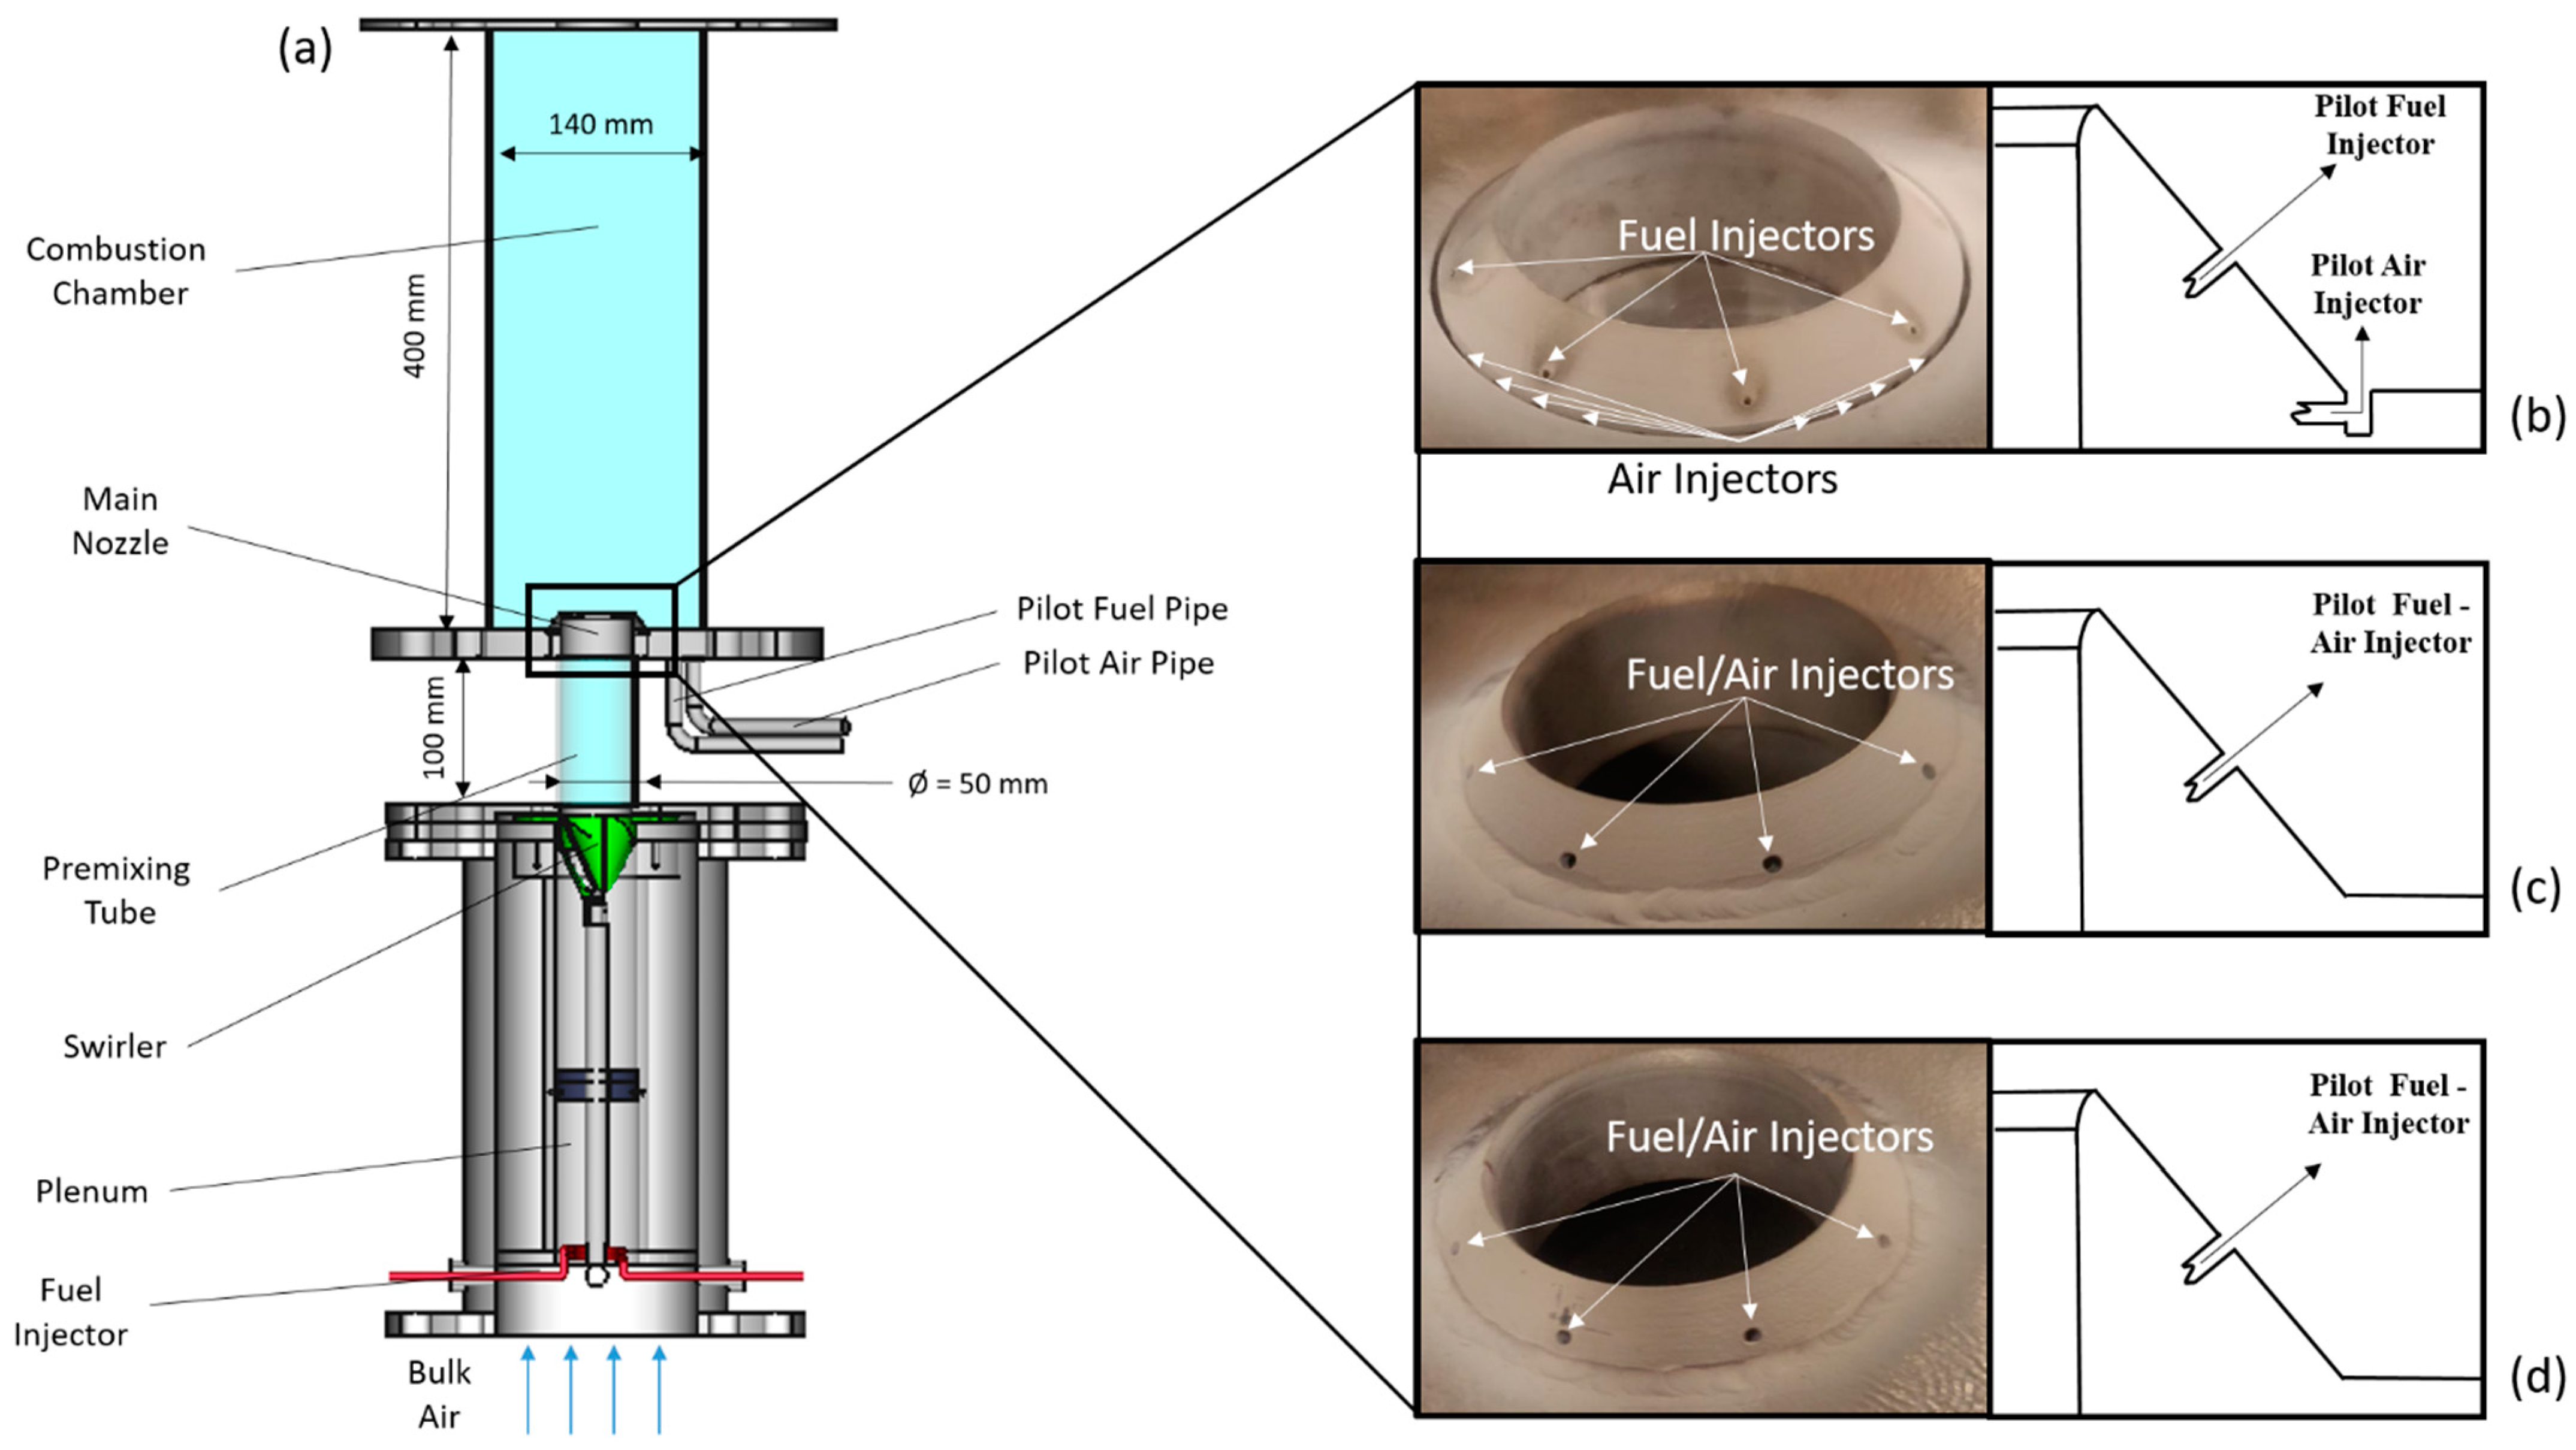
2.1. Burner and Mixture Properties

The experiments presented here represent the latest investigation of a lab-scale model combustor, based on the CECOST burner designed to mimic the Siemens DLE (Dry Low Emission) burner [32,33,34]. Since detailed description can be found in literature both regarding the design process [32,35] as well as its latest developments [34,36], only a concise description focusing on the implementation of the pilot fuel injector is provided here. The burner sketch is shown in Figure 1. Once the air is fed into the plenum, it starts mixing with the fuel injected through a spiral injection system. Fuel/air mixing is further enhanced when the mixture is passed through a swirler (consisting of four 2 mm thick quarter-cones with a half angle of the cones of ~25°) and, later, a cylindrical quartz premixing tube (100 mm in length and 50 mm in diameter). The combustion chamber (squared section of 140 × 140 mm) is mounted over a metal base plate at the center of which a truncated cone-shaped pilot injector is located. The combustion chamber liner is made of quartz to allow UV light through the liner. A non-premixed pilot flame (DP1) and two partially premixed pilot flames with lower (PP2) and higher (PP3) degrees of mixing are investigated in this work. The non-premixed pilot injector consists of 8 holes (1 mm in diameter) for fuel injection, and 36 holes (1 mm in diameter) for the pilot air injection. The two partially premixed pilot hardware configurations are equipped with 8 holes (2.5 mm in diameter) through which the fuel/air mixture is injected. Two separate fuel and air pipes at the bottom of the metal base plate are used to feed the pilot fuel/air mixtures.
The investigation presented here involved H2/CH4/air mixtures with two hydrogen fractions of 0 and 50 volume %, supplied through the premixing tube and the main nozzle to the combustion chamber at a Reynolds number (Re) of 20,000. The hydrogen fraction is defined as X H 2 / X H 2 + X CH 4 100 % , where X H 2 and X CH 4 are the mole fractions of hydrogen and methane, respectively. The Re was determined based on the bulk axial flow speed of the mixture at the main nozzle exit, viscosity of the bulk air, and the diameter of the premixing tube. The experimental conditions were decided by selecting a stable condition for each of the two mixtures without pilot flame, according to the results previously presented in [34]. As shown by Pignatelli et al. [34] in the same burner, the stability limits for hydrogen-enriched methane are shifted toward leaner mixtures which do not allow the comparison of stable conditions at the same equivalence ratio (Φ). Therefore, the comparison of stable conditions for these two fuels was conducted with the pure methane flame at Φ = 0.72 and the H2-enriched case at Φ = 0.52. These equivalence ratios were selected since they are approximately located at the same position in the stability map presented in [34]. The experiments for each fuel were performed while keeping the total amount of fuel and air injected into the combustion chamber constant and routing different percentages of air and fuel from the main into the pilot. The percentage of air and fuel taken from the main flow to the pilot injection for the five strategies investigated are shown in Table 1. The pilot injection strategies without pilot fuel are investigated as reference cases. The burner running with the H2-enriched methane fuel had the total air and fuel mass flows of 13.4 and 0.365 g/s, respectively, and a thermal power of around 23 kW. For the pure methane case, the total air and fuel flows were 13.5 and 0.567 g/s, respectively, while the thermal power was around 30 kW.

2.2. OH-PLIF Method

It is well established that OH radicals are mainly produced in the reaction zone and that their concentrations slowly decrease in the hot post-flame zone [37,38]. Since the OH-PILF experiment has been presented in detail in previous papers [34,36], only a brief description of the setup is provided. The Q1(8) transition at A2Σ+ ← X2Π(1,0) OH band was excited for OH-LIF using a dye laser and a frequency doubling crystal tuned at a wavelength of 283.55 nm. An approximately 50 mm wide laser sheet was formed and passed crossed the burner centerline. The OH fluorescence was imaged with an ICCD camera equipped with a UV-grade lens (UV-Nikkor, f/4.5, f = 105 mm) at an acquisition frequency of 10 Hz. The average laser pulse energy was 15 mJ during the measurements. For each pilot injection strategy, two sets of 1000 single-shot images were collected. The acquired single-shot images were binarized assigning the value 1 to regions having a signal intensity higher than a threshold value set equal to 10% of the peak signal intensity. The resulting binary maps were ensemble averaged and normalized to obtain the probability maps (PMs).

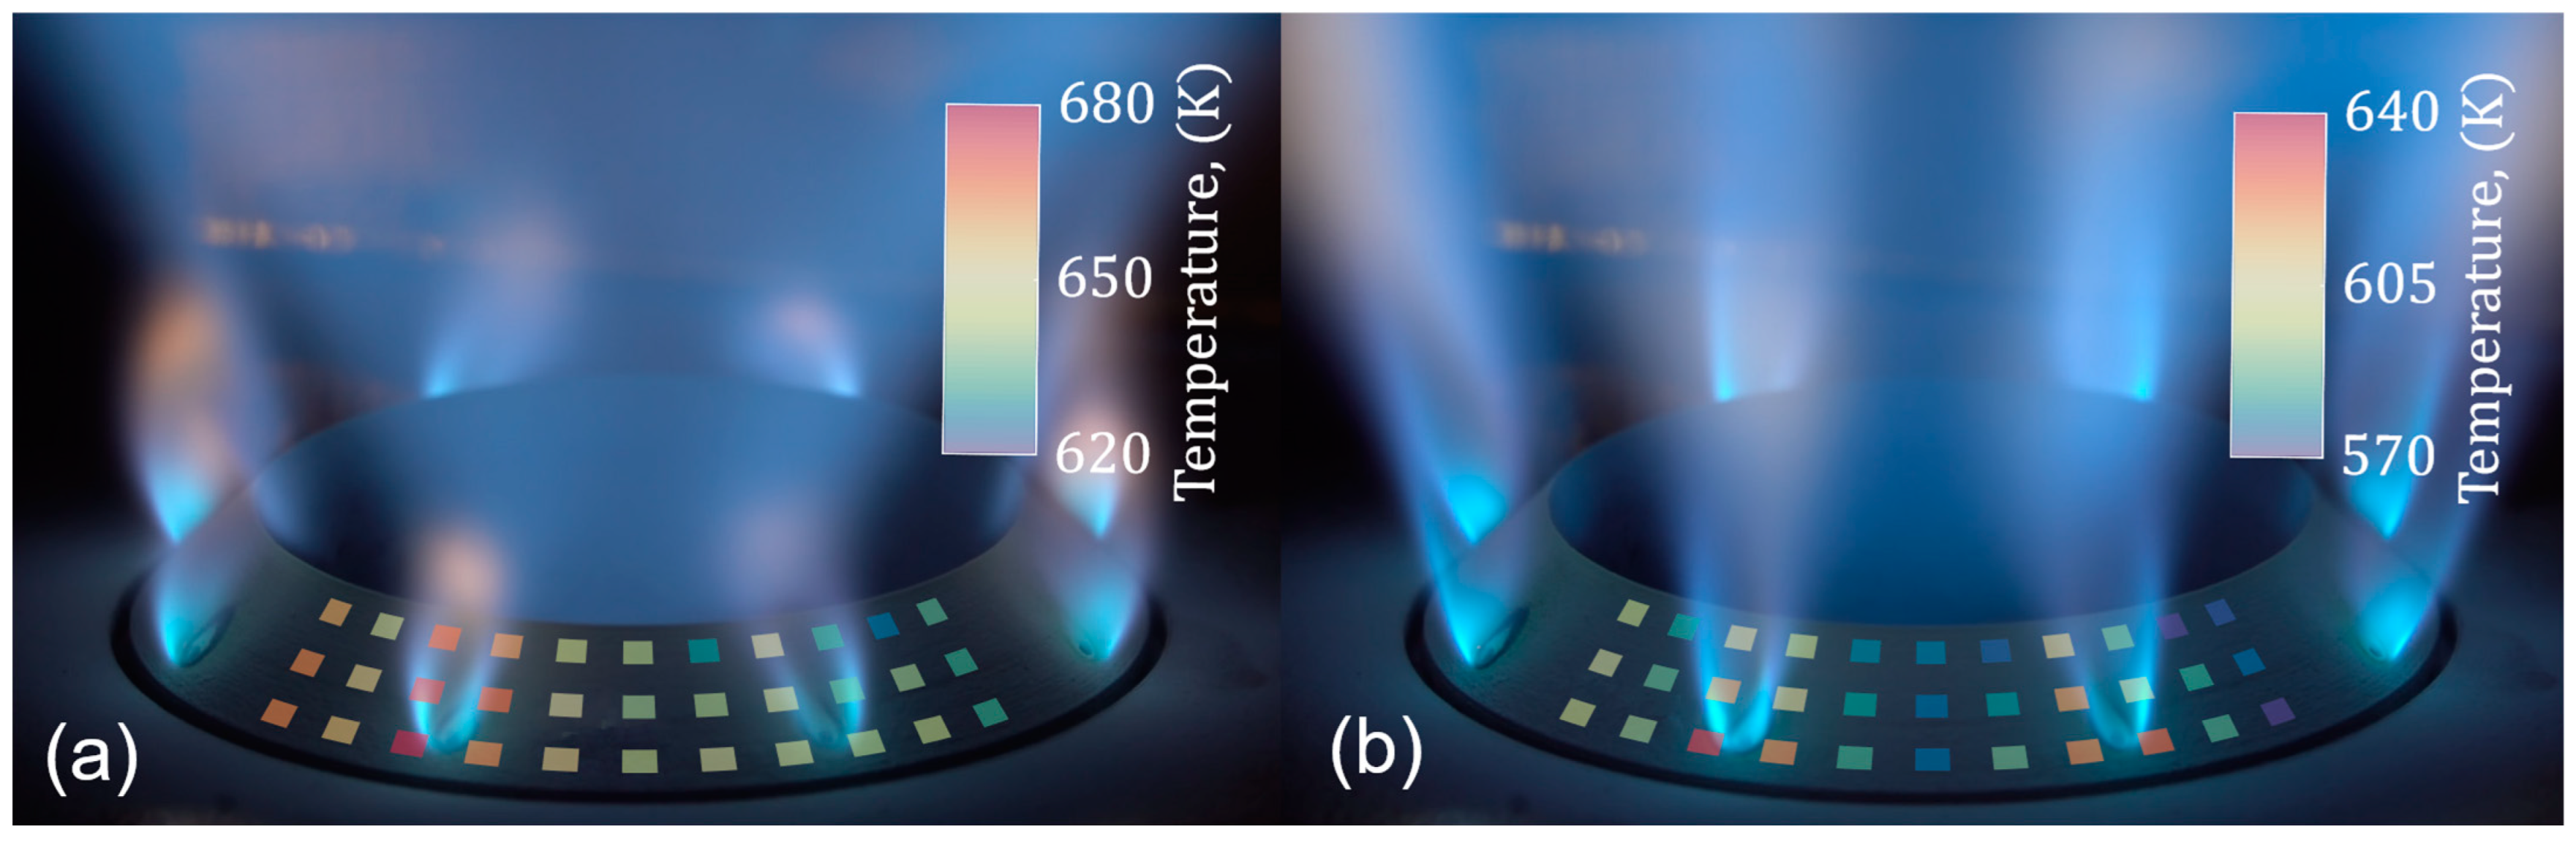
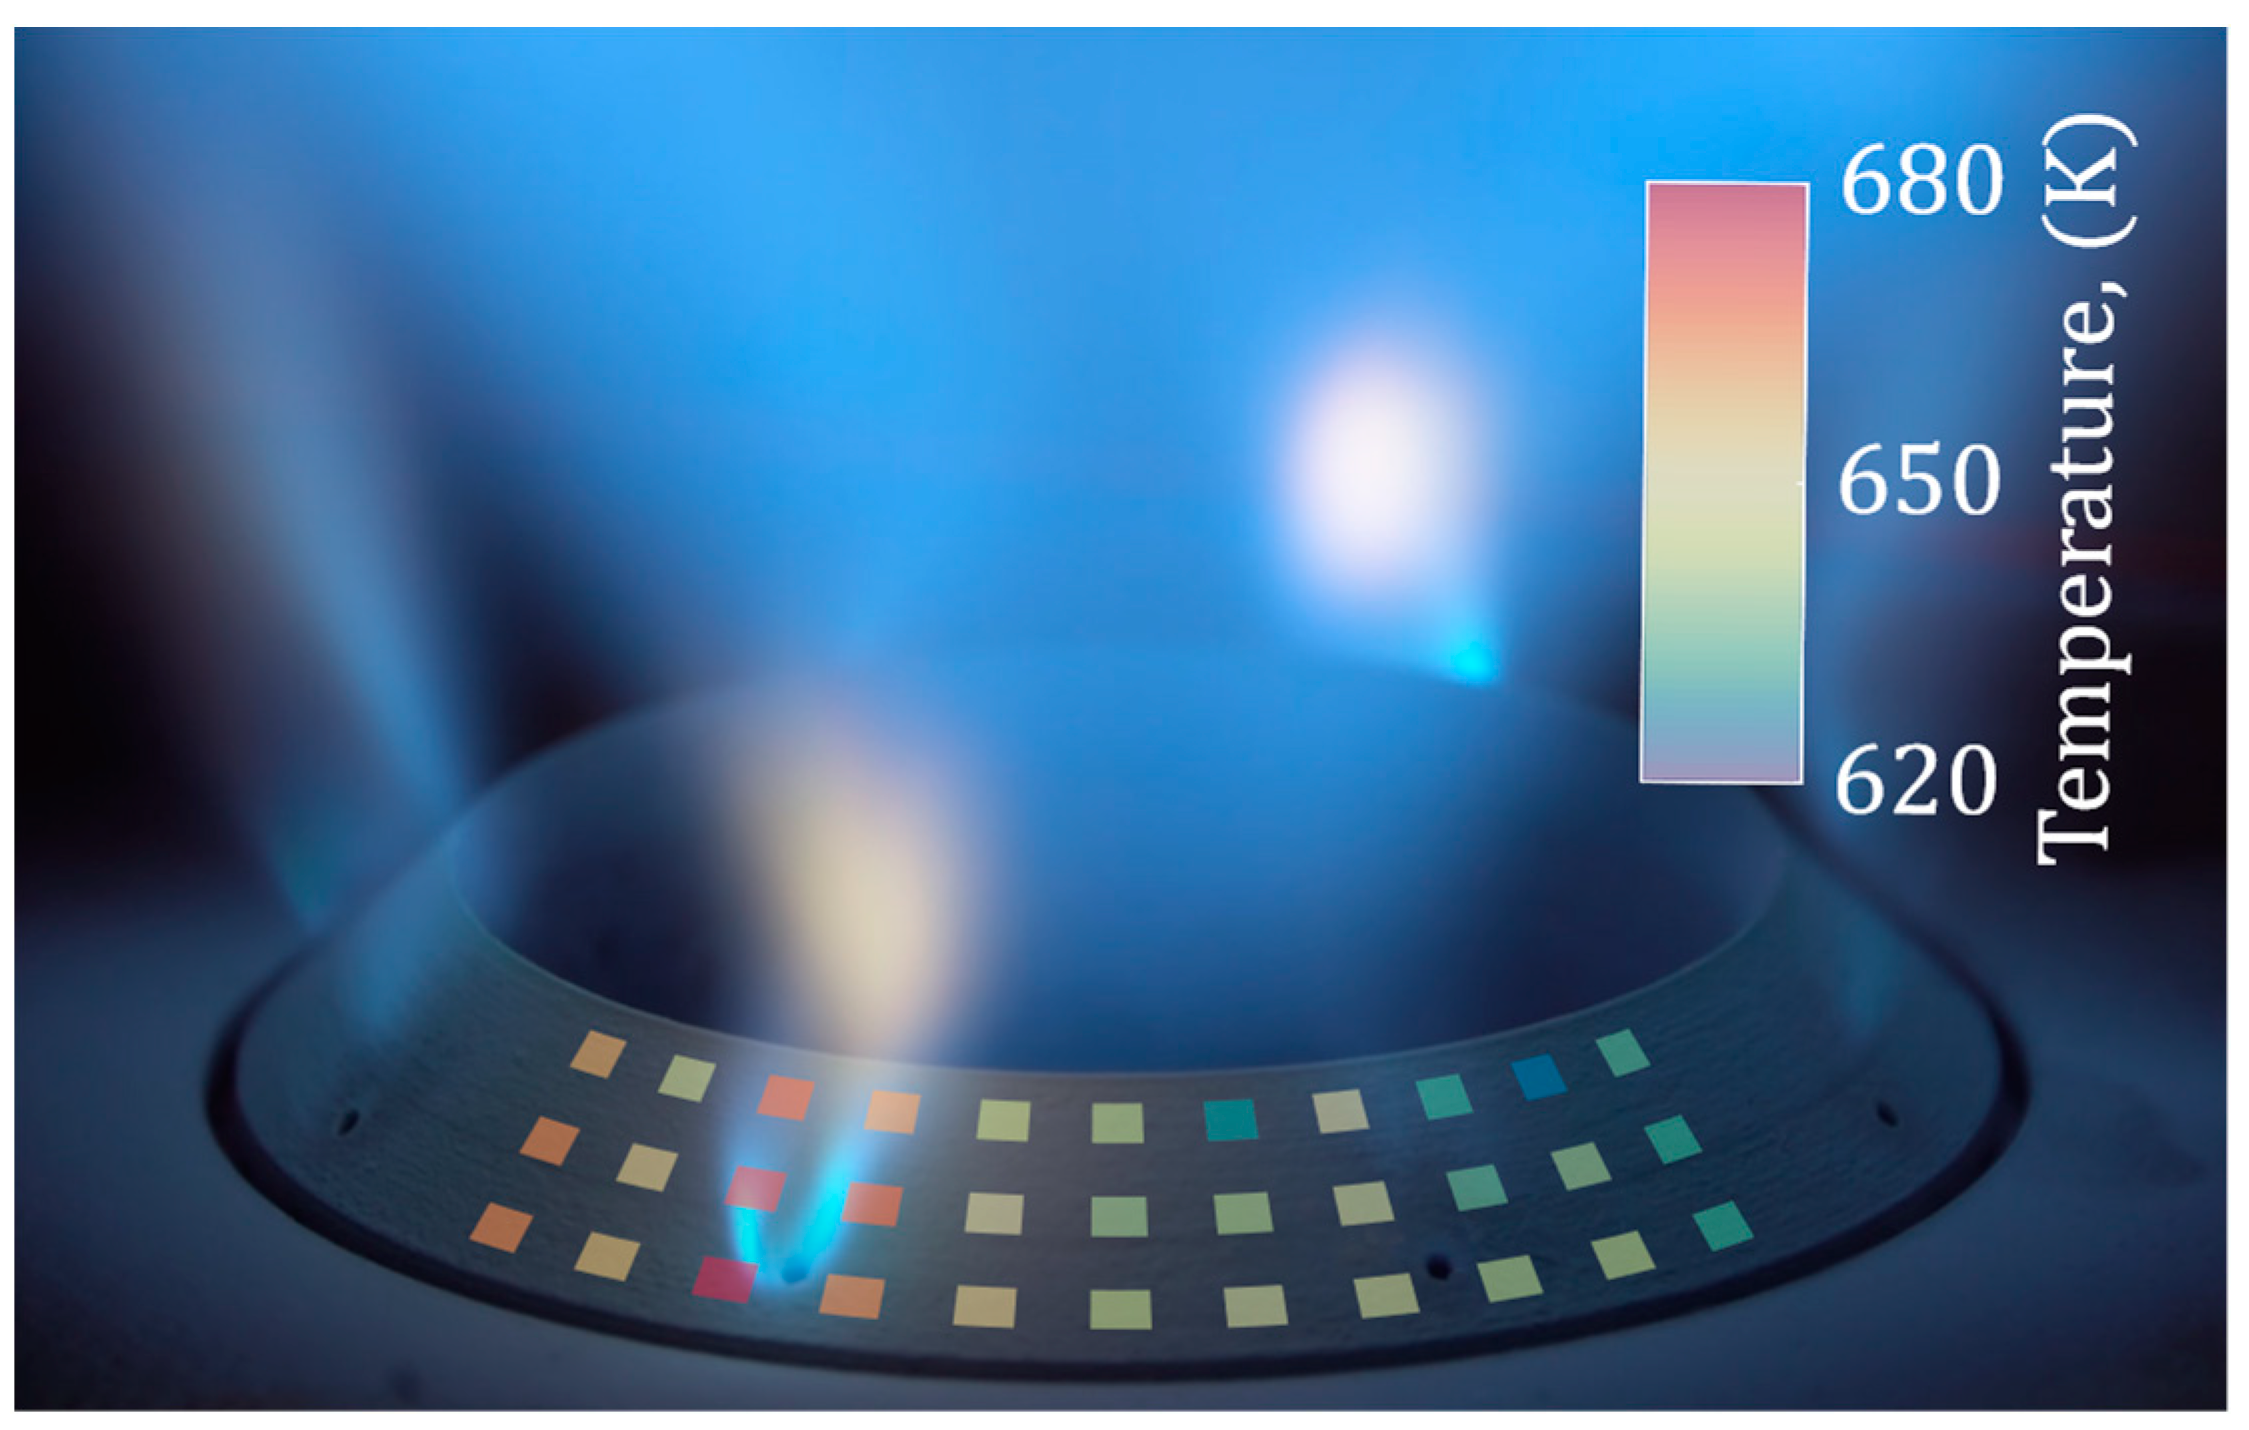
2.3. Phosphor Thermometry Measurement

Typically, 2D lifetime phosphor thermometry measurements are performed using high-speed cameras [39,40], but they put stricter limits on the shortest measurable decay time than a Photomultiplier tube (PMT) based detection system [39,40]. In this study, surface resolved temperatures were achieved using a galvo system to target the excitation laser on different parts of the burner nozzle surface and measuring the luminescence of the phosphor with a PMT. With the galvo system, the temperature measurement positions could be rapidly and reproducibly scanned across the burner’s surface. This enabled testing of many different burner and pilot nozzle operating conditions without inconvenient manual point wise adjustment for temperature measurements.
In total, the temperature was measured at 33 points on the nozzle surface and was distributed at three different heights of the nozzle and over a quarter of the nozzles circular sector, as seen in Figure 2. This results in the data points at the same height being separated angularly by 9°. The signal collecting system was carefully configured so that all the measurement points on the nozzle could be imaged on the photocathode of the PMT.
Often, very high temperature phosphors are desirable for gas turbine applications at elevated pressure [41,42], but the atmospheric pressure of the CECOST burner leads to lower surface temperature. Therefore, the ZnS:Ag phosphor [43], which is temperature sensitive at the relatively low temperatures relevant for the CECOST burner, is used in this study for temperature measurement on the burner nozzle. The phosphor was mixed with an HPC binder (ZYP Coatings) and ethanol with a ratio of 1 g phosphor to 16 mL binder and 8ml ethanol. The phosphor coating was applied to the surface using an airbrush. The surface coating thickness was measured with a thickness gauge (Elcometer 456) to be approximately 15 μm. ZnS:Ag was excited by the third harmonic from an Nd:YAG laser at 10 Hz with a pulse energy of 16 μJ and laser spot size of 1.5 mm which resulted in a fluence of 0.9 mJ/cm2. Low pulse energies were used due to the phosphor’s very strong luminescence. The phosphor is temperature sensitive from ambient temperatures (300 K with a lifetime of 450 ns) to 800 K with a lifetime of 5 ns. The maximum temperature sensitivity is achieved around 600 K with a lifetime sensitivity of 1.7 %/K. The ZnS:Ag luminesce was filtered using a bandpass filter at 450 nm (FWHM 40 nm) together with a 355 nm notch filter and 385 nm long pass filter in front of the Hamamatsu H11526-20-NF PMT.
At each measurement point 50 decay curves were accumulated. These decay curves were analyzed as single shot measurements, and the error bars in the results are indicating the standard deviation of the single shot measurements. The phosphor calibrations were performed using similar procedures as in [44]. The phosphor luminescence decay time was measured by fitting mono-exponential decay curves as described by Equation (1) to the decay curves.
I t = I 0 e x p t / τ + I o f f s e t
The fitting was performed with a trust-region-reflective least-squares algorithm in MATLAB. A fixed percentage of the maximum peak signal level of the decay curve was used for the start and end of the fitting window. With 70% being the start and 5% being the end of the fitting window.
To assure that the temperature of the burner assembly, seen in Figure 1, reached steady state levels, the burner ran for approximately 1 h and 15 min for the pure methane fuel and approximately 1 h for hydrogen enriched methane fuel before the first measurement. As an example, the measurement procedure for the PP2 pilot hardware configuration and methane as fuel is shown in Figure 3. When the temperature of a thermocouple attached to the same plate as the nozzle changed by less than 0.5 K/min, the steady state criterion was satisfied, and a measurement could be performed. When the pilot injection strategy changed, a new surface temperature measurement was not performed until the steady state criterion was fulfilled again. Every surface temperature measurement configuration was accompanied by a video of the combustion around the nozzle to allow the correlation between the visual appearance of the combustion and the measured surface temperature. These videos were average over 10 s to create images which visualize the mean pilot flame behavior.

3. Results

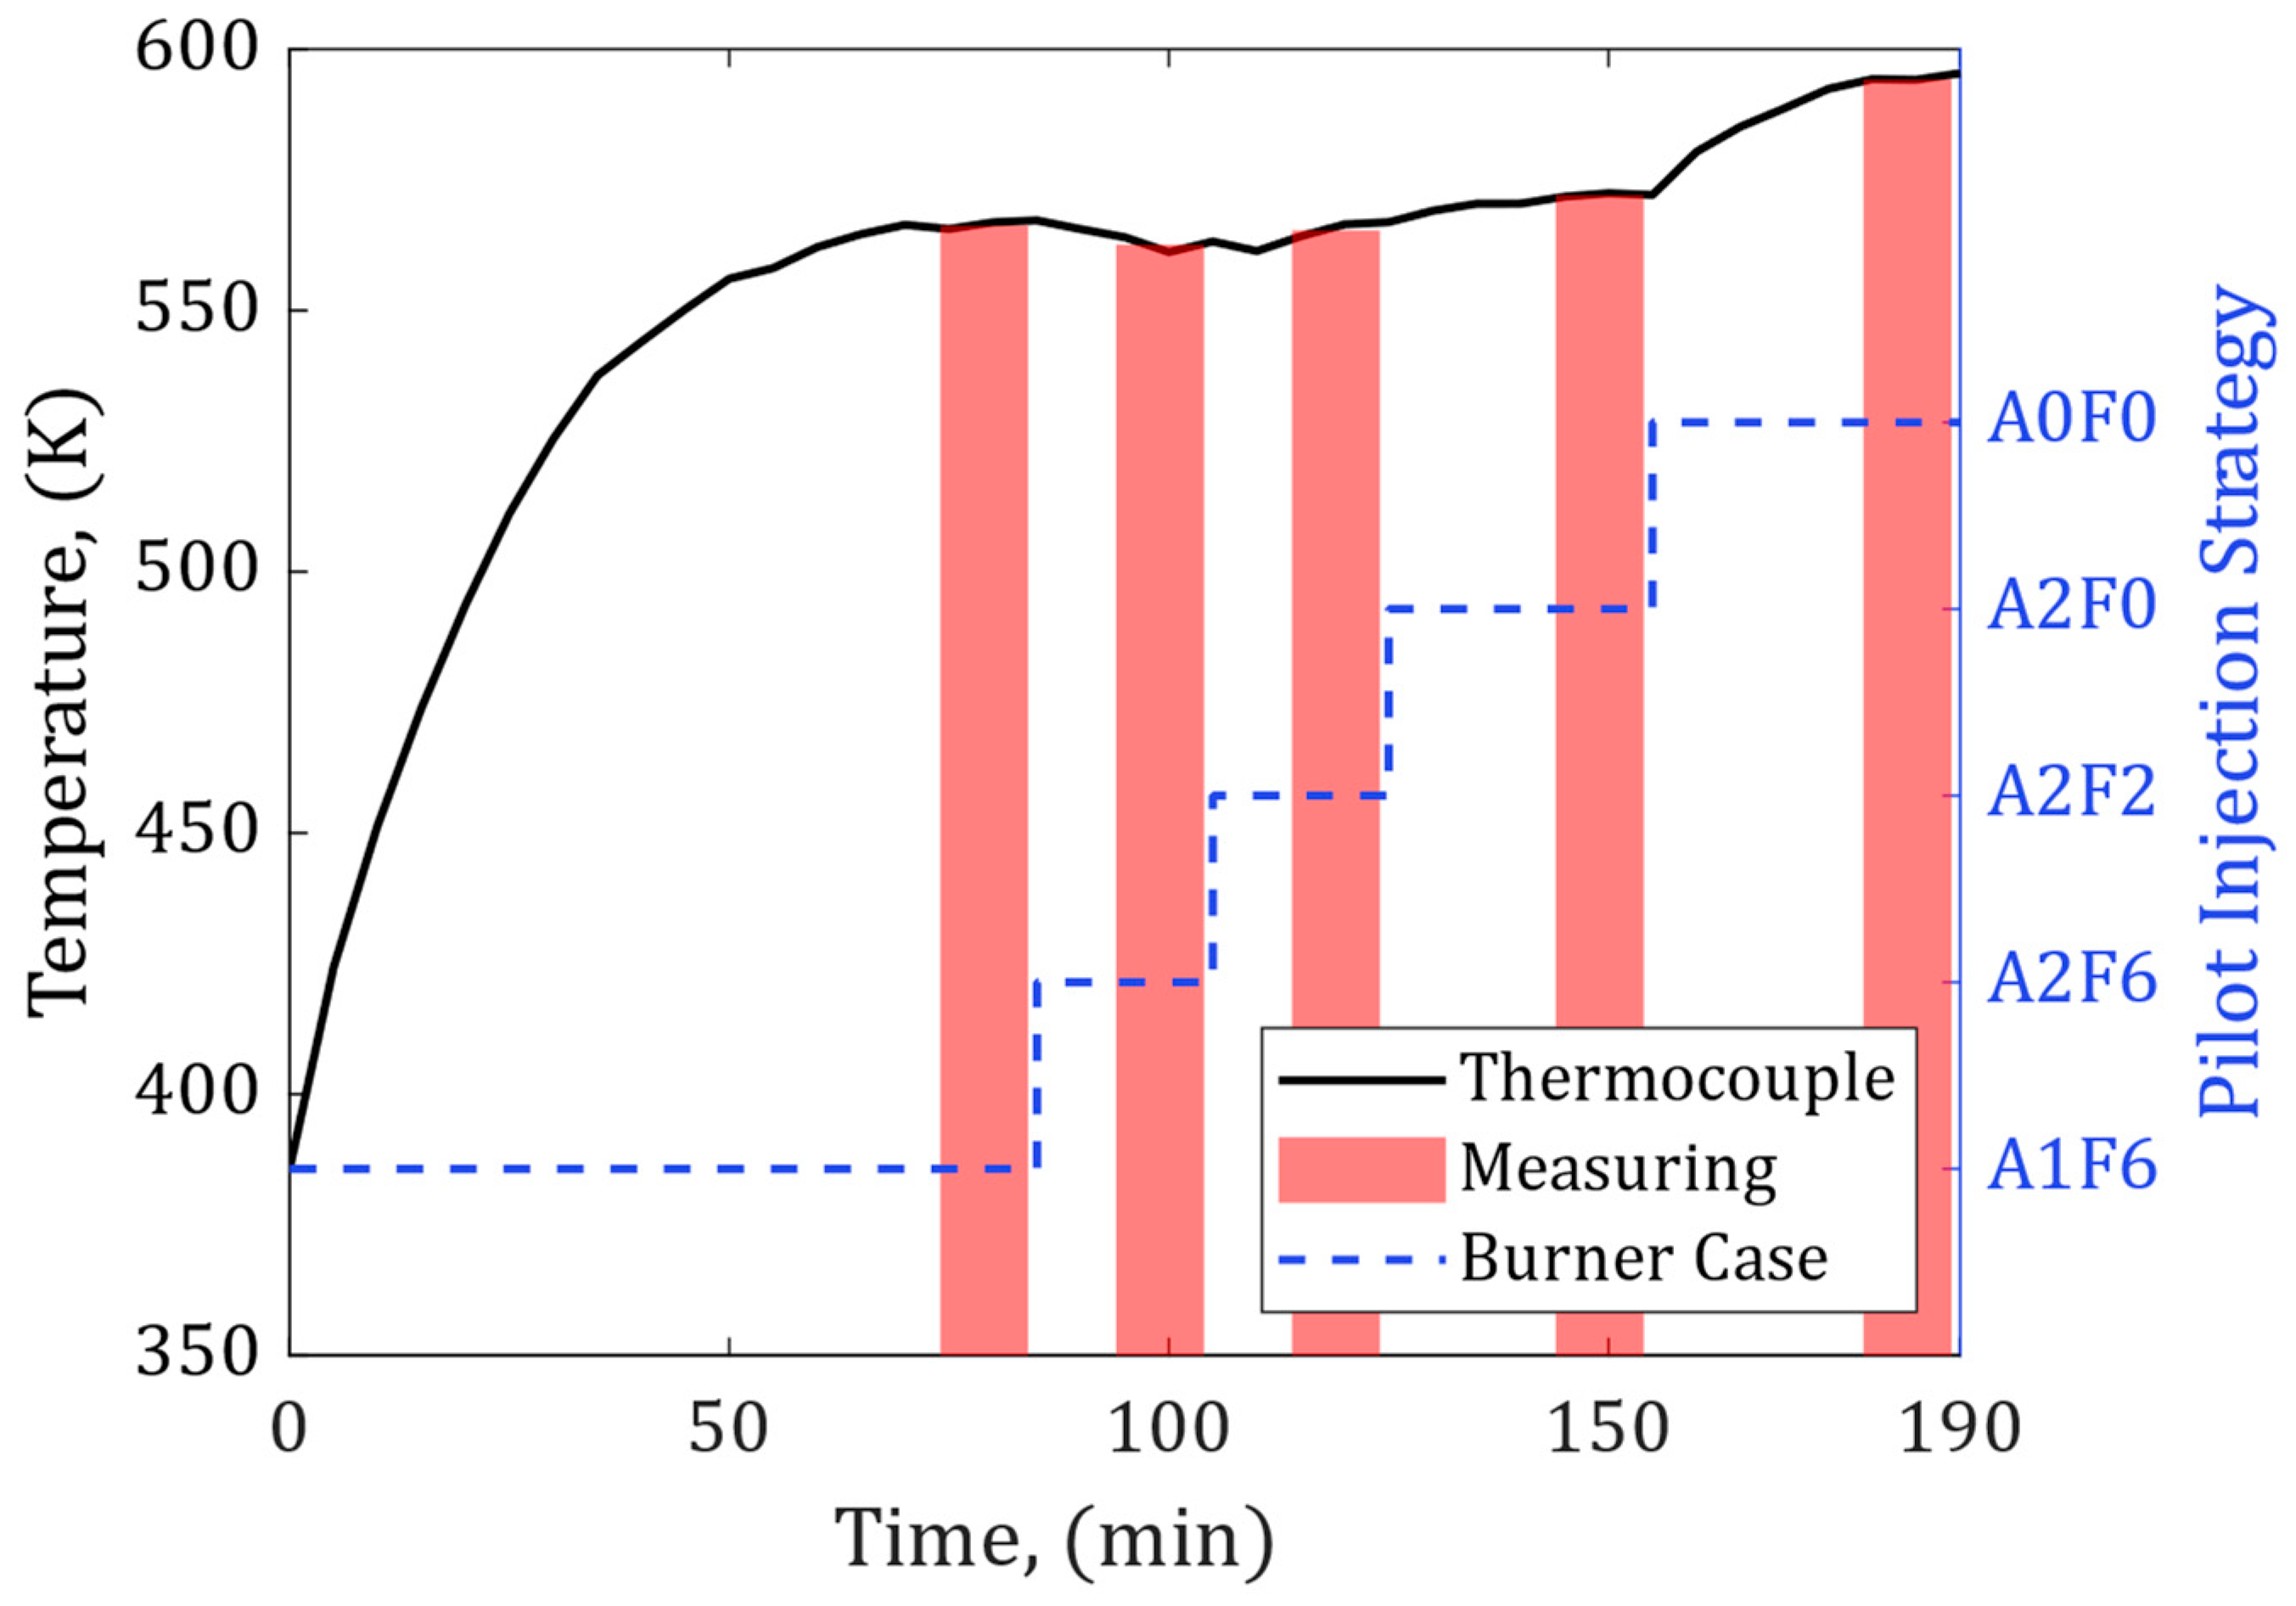
3.1. Overview of the Results

Figure 4 shows the surface temperatures measured with phosphor thermometry for the three pilot hardware configurations, two different fuels, and the five pilot injection strategies. For the data in Figure 4, each temperature represents the average of all three vertical positions at the same azimuthal angle of the nozzle as seen in Figure 2. The surface temperatures were averaged vertically because the surface temperature showed, in general, no significant difference due to the vertical position. For example, the −45° degree point is the average of the temperature of measurement points 1, 12, and 23 in Figure 2. There were two pilot nozzles included in the field of view of the temperature measurement. The left nozzle was at −22.5° and the right nozzle at 22.5°.
There are fewer data points in Figure 4 for the cases with the H2/CH4 fuel and the PP2 and PP3 pilot hardware configurations due to three measurement points that were systematic outliers for all cases. These three measurement points are therefore not shown in the results.

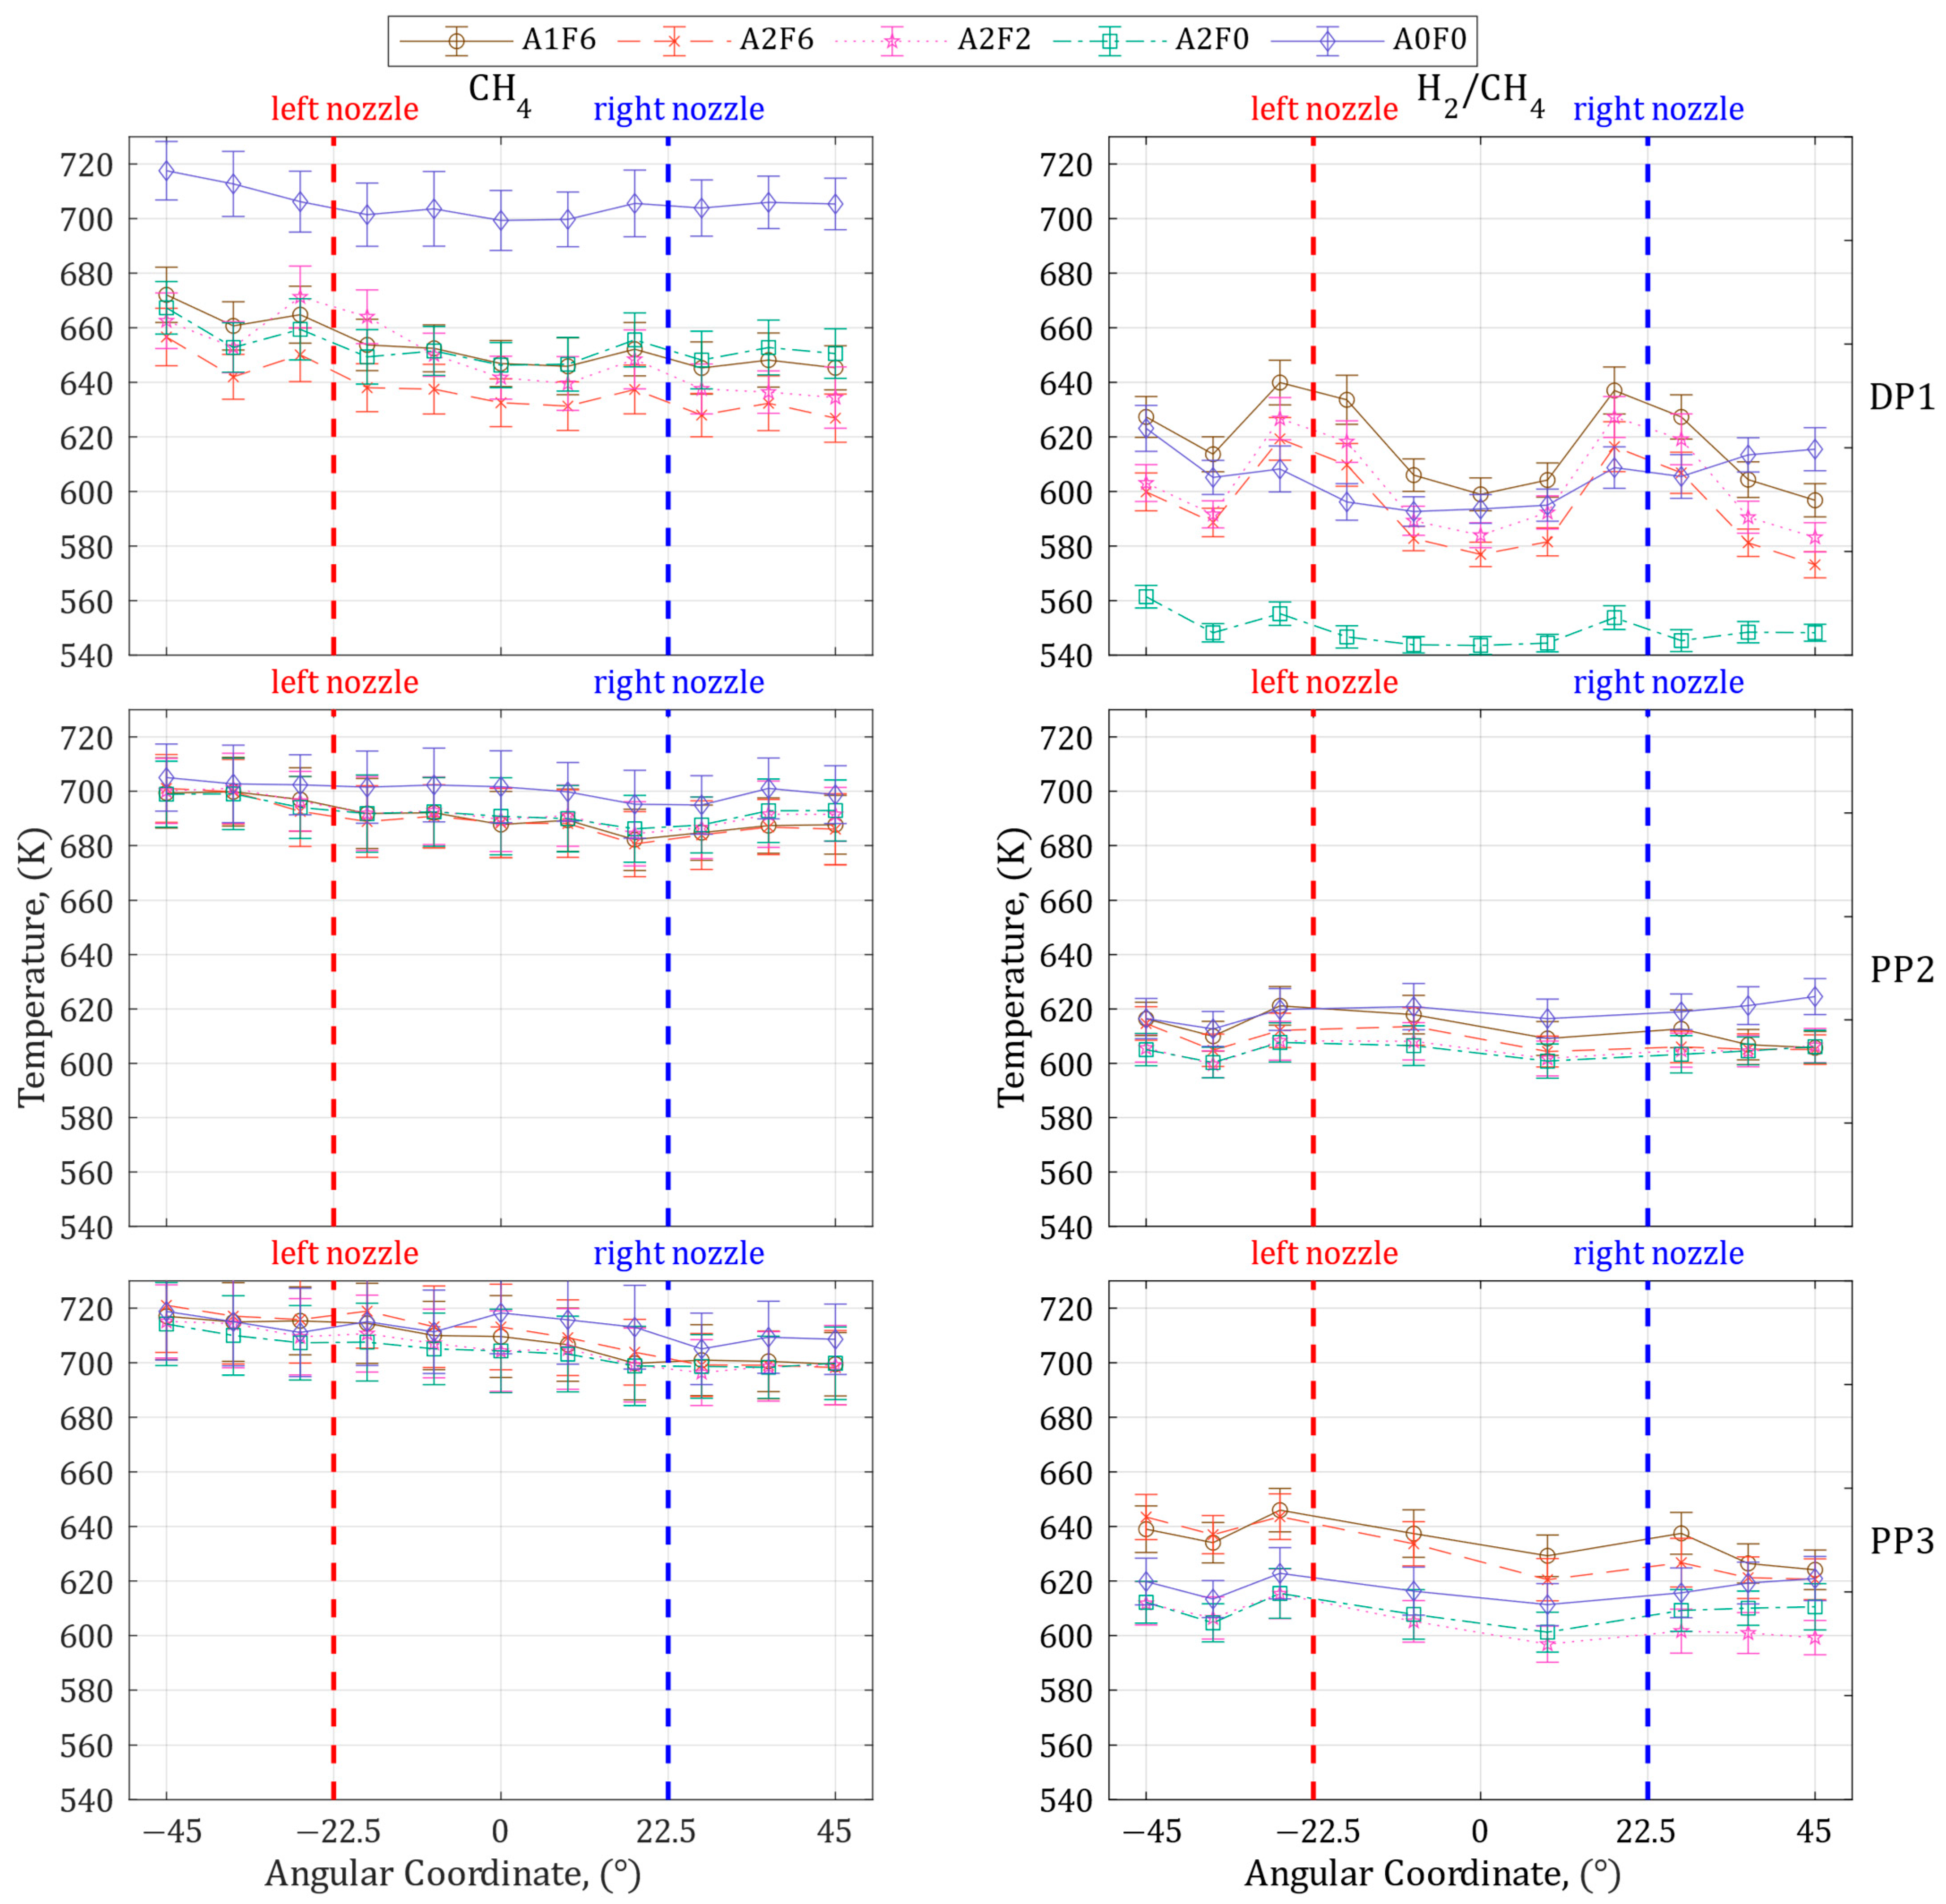
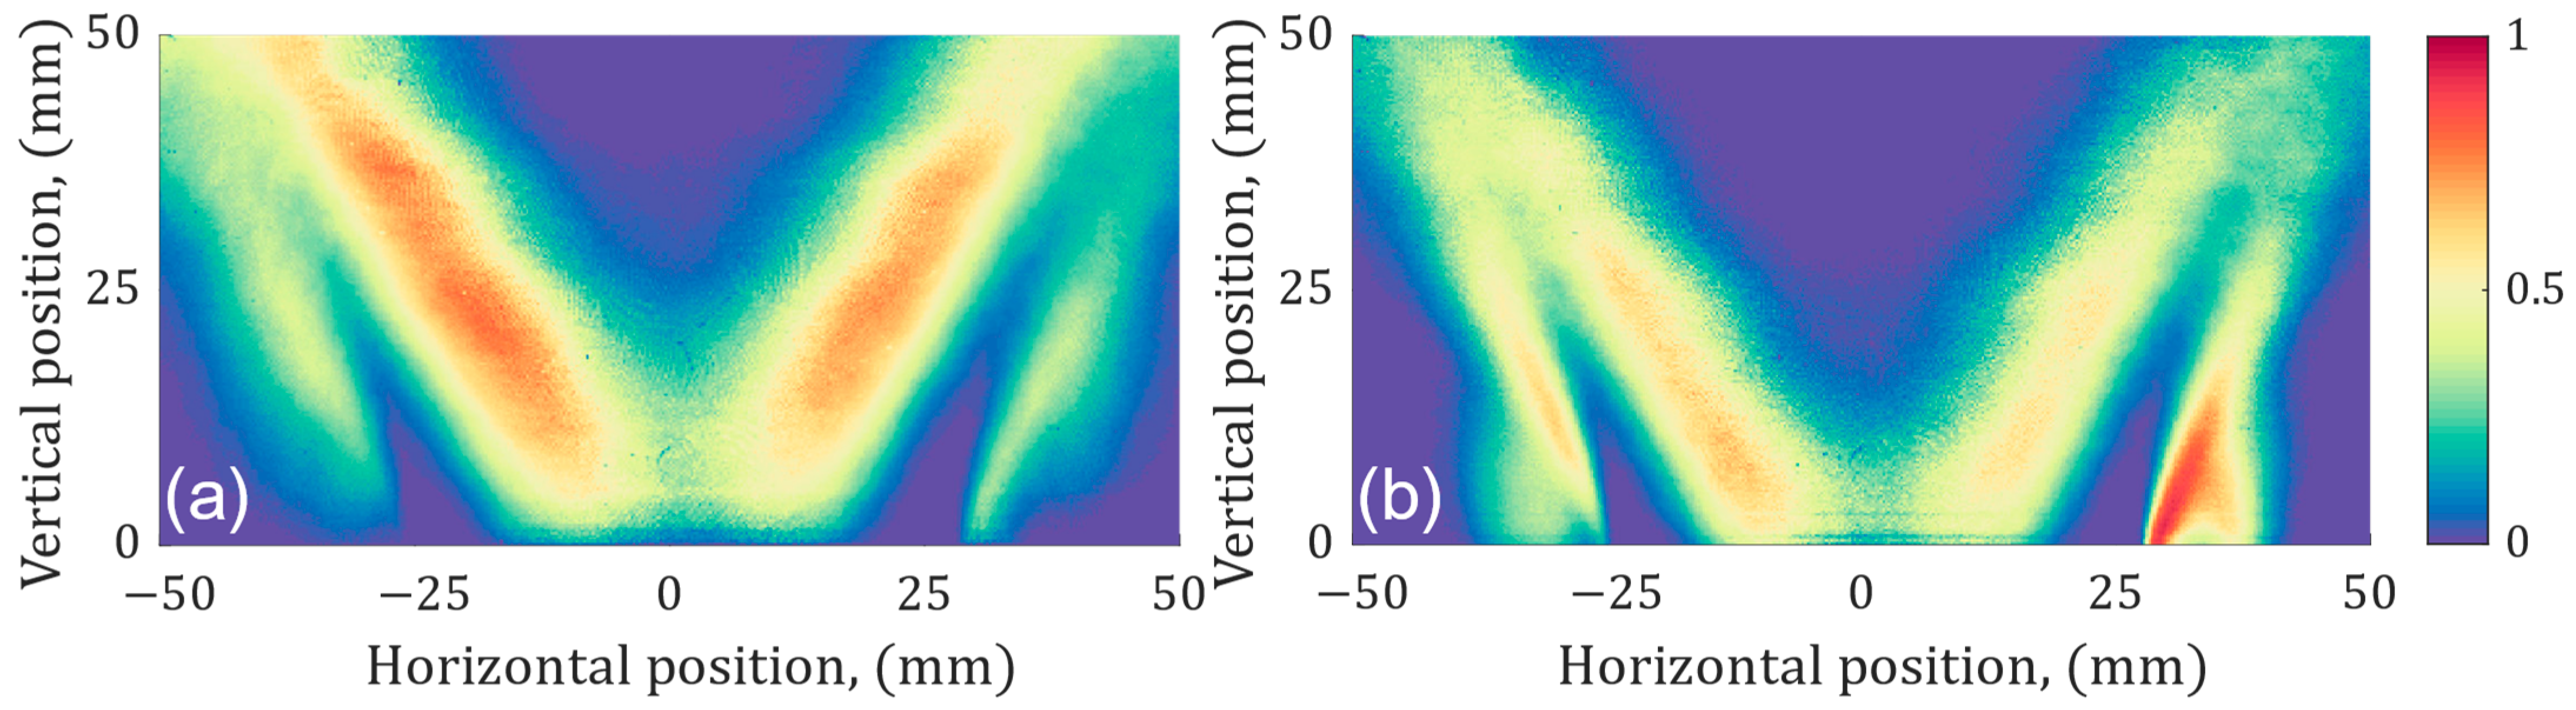
3.2. DP1 Pilot Hardware Configuration

For the DP1 pilot hardware configuration, the highest temperature was A0F0 and A1F6 (seen in Figure 4) for the pure methane and hydrogen-enriched methane fuels, respectively. The differences can be attributed to the heat output of the pure CH4 burner being dominated by the heating of the main flame whereas for the H2/CH4 fuel the heating from the pilot flames is significant. This can be seen in the time averaged images in Figure 5 where the pilot flames are better attached to the nozzle for the H2/CH4 fuel, cf. Figure 5b, than for pure methane, cf. Figure 5a. The wide flammability range of the hydrogen enriched methane, high flame velocity, and high diffusivity of hydrogen, leads to the pilot flames in general being better attached than with methane as fuel.
The local heating of the DP1 pilot flame for the H2/CH4 fuel is also evident in Figure 4 where the temperatures around the fuel injectors are higher than the measurement points further from the injectors. In contrast, the local heating with the pure CH4 flame is minor in comparison, especially for the pilot fuel injection on the right side of the measurement region. The low impact of the pilot flames for the CH4 fuel can also be seen because all conditions for DP1 with pilot air are approximately at the same temperature and not dependent on the pilot fuel amount. Since the pilot flames are in general lifted off the nozzle, the air and fuel flows cool the nozzle walls.
The fuel flow rate is much lower than the air flow rate, which explains the minor cooling effect of the fuel flow. Furthermore, when there is no air flow (in pilot injection strategy A0F0), there is no such cooling effect, the nozzle surface has the highest temperature among all pilot injection strategies. On the contrary, for the H2/CH4 fuel, the temperature drops significantly when there is no injected fuel. This shows that the nozzle is significantly heated by the pilot flames (which are closer to the nozzle) for the hydrogen-enriched methane fuel.
In general, the surface temperature of the DP1 pilot hardware configuration decreases from left to right in Figure 5 by more than 20 K for all pilot injection strategies involving the injection of pilot air for both fuel types. This can be due to cooling by the pilot air flowing through the air channels inside the burner nozzle plate. Room temperature pilot air and fuel enter the burner nozzle plate from the right in separate pipes as seen in Figure 1a. In the internal channels of the burner nozzle plate the air cools the plate and the pilot air is heated up as it travels to the left and is distributed to the pilot holes (from the perspective of Figure 1a and Figure 5). The cooling by the air is more effective on the right side of the burner plates due to the lower temperature of the pilot air in the channels there, leading to lower temperatures on that side of the burner nozzle.
According to Figure 4, the lowest temperature CH4/air flame for DP1 is A2F6. This is attributed to the high pilot air flow which cools the nozzle, and the high pilot fuel which reduces the heat load from the main combustion leading to lower overall heating of the nozzle. For the hydrogen-enriched fuel, the lowest temperature was with the A2F0 pilot injection strategy. This is because the pilot air cools the nozzle and there is no pilot fuel injected resulting in no pilot flames which can heat the nozzle. The generally lower temperature of the H2/CH4 fuel is due to the lower heat output of the burner than with the CH4 fuel. The lower heat output is due to the lower equivalence ratio of the H2/CH4/air mixtures (0.52) than that of the CH4/air mixtures (0.72).
The surface temperature for the A2F2 pilot Injection strategy is higher than the A2F6 pilot injection strategy for the H2/CH4 fuel because the higher fuel flow-rate leads to longer mixing time requirements with the surrounding air, resulting in longer pilot flames. The long pilot flame length results in less efficient heating of the nozzle surface and lower surface temperatures visible in Figure 4 and Figure 6.
The pilot fuel injection hole to the left of the center in Figure 5a and Figure 7 had a more attached pilot flame than the injection hole to its right. This resulted in the generally higher local temperature around the left pilot injection hole than the right one for the pure CH4 flame. These pilot flame differences are attributed to minor variations in the pilot fuel injection channels caused by the 3D printing manufacturing process.
The OH-PLIF probability maps shown in Figure 8 for the DP1 pilot hardware configuration agree with the flame luminescence results presented above, as the pilot flames have a higher probability of being attached to the nozzle for the H2/CH4 fuel (Figure 8b) than pure methane fuel (Figure 8a). This leads to more significant local heating by the pilot flames for the H2/CH4 fuel pilot injection strategies.

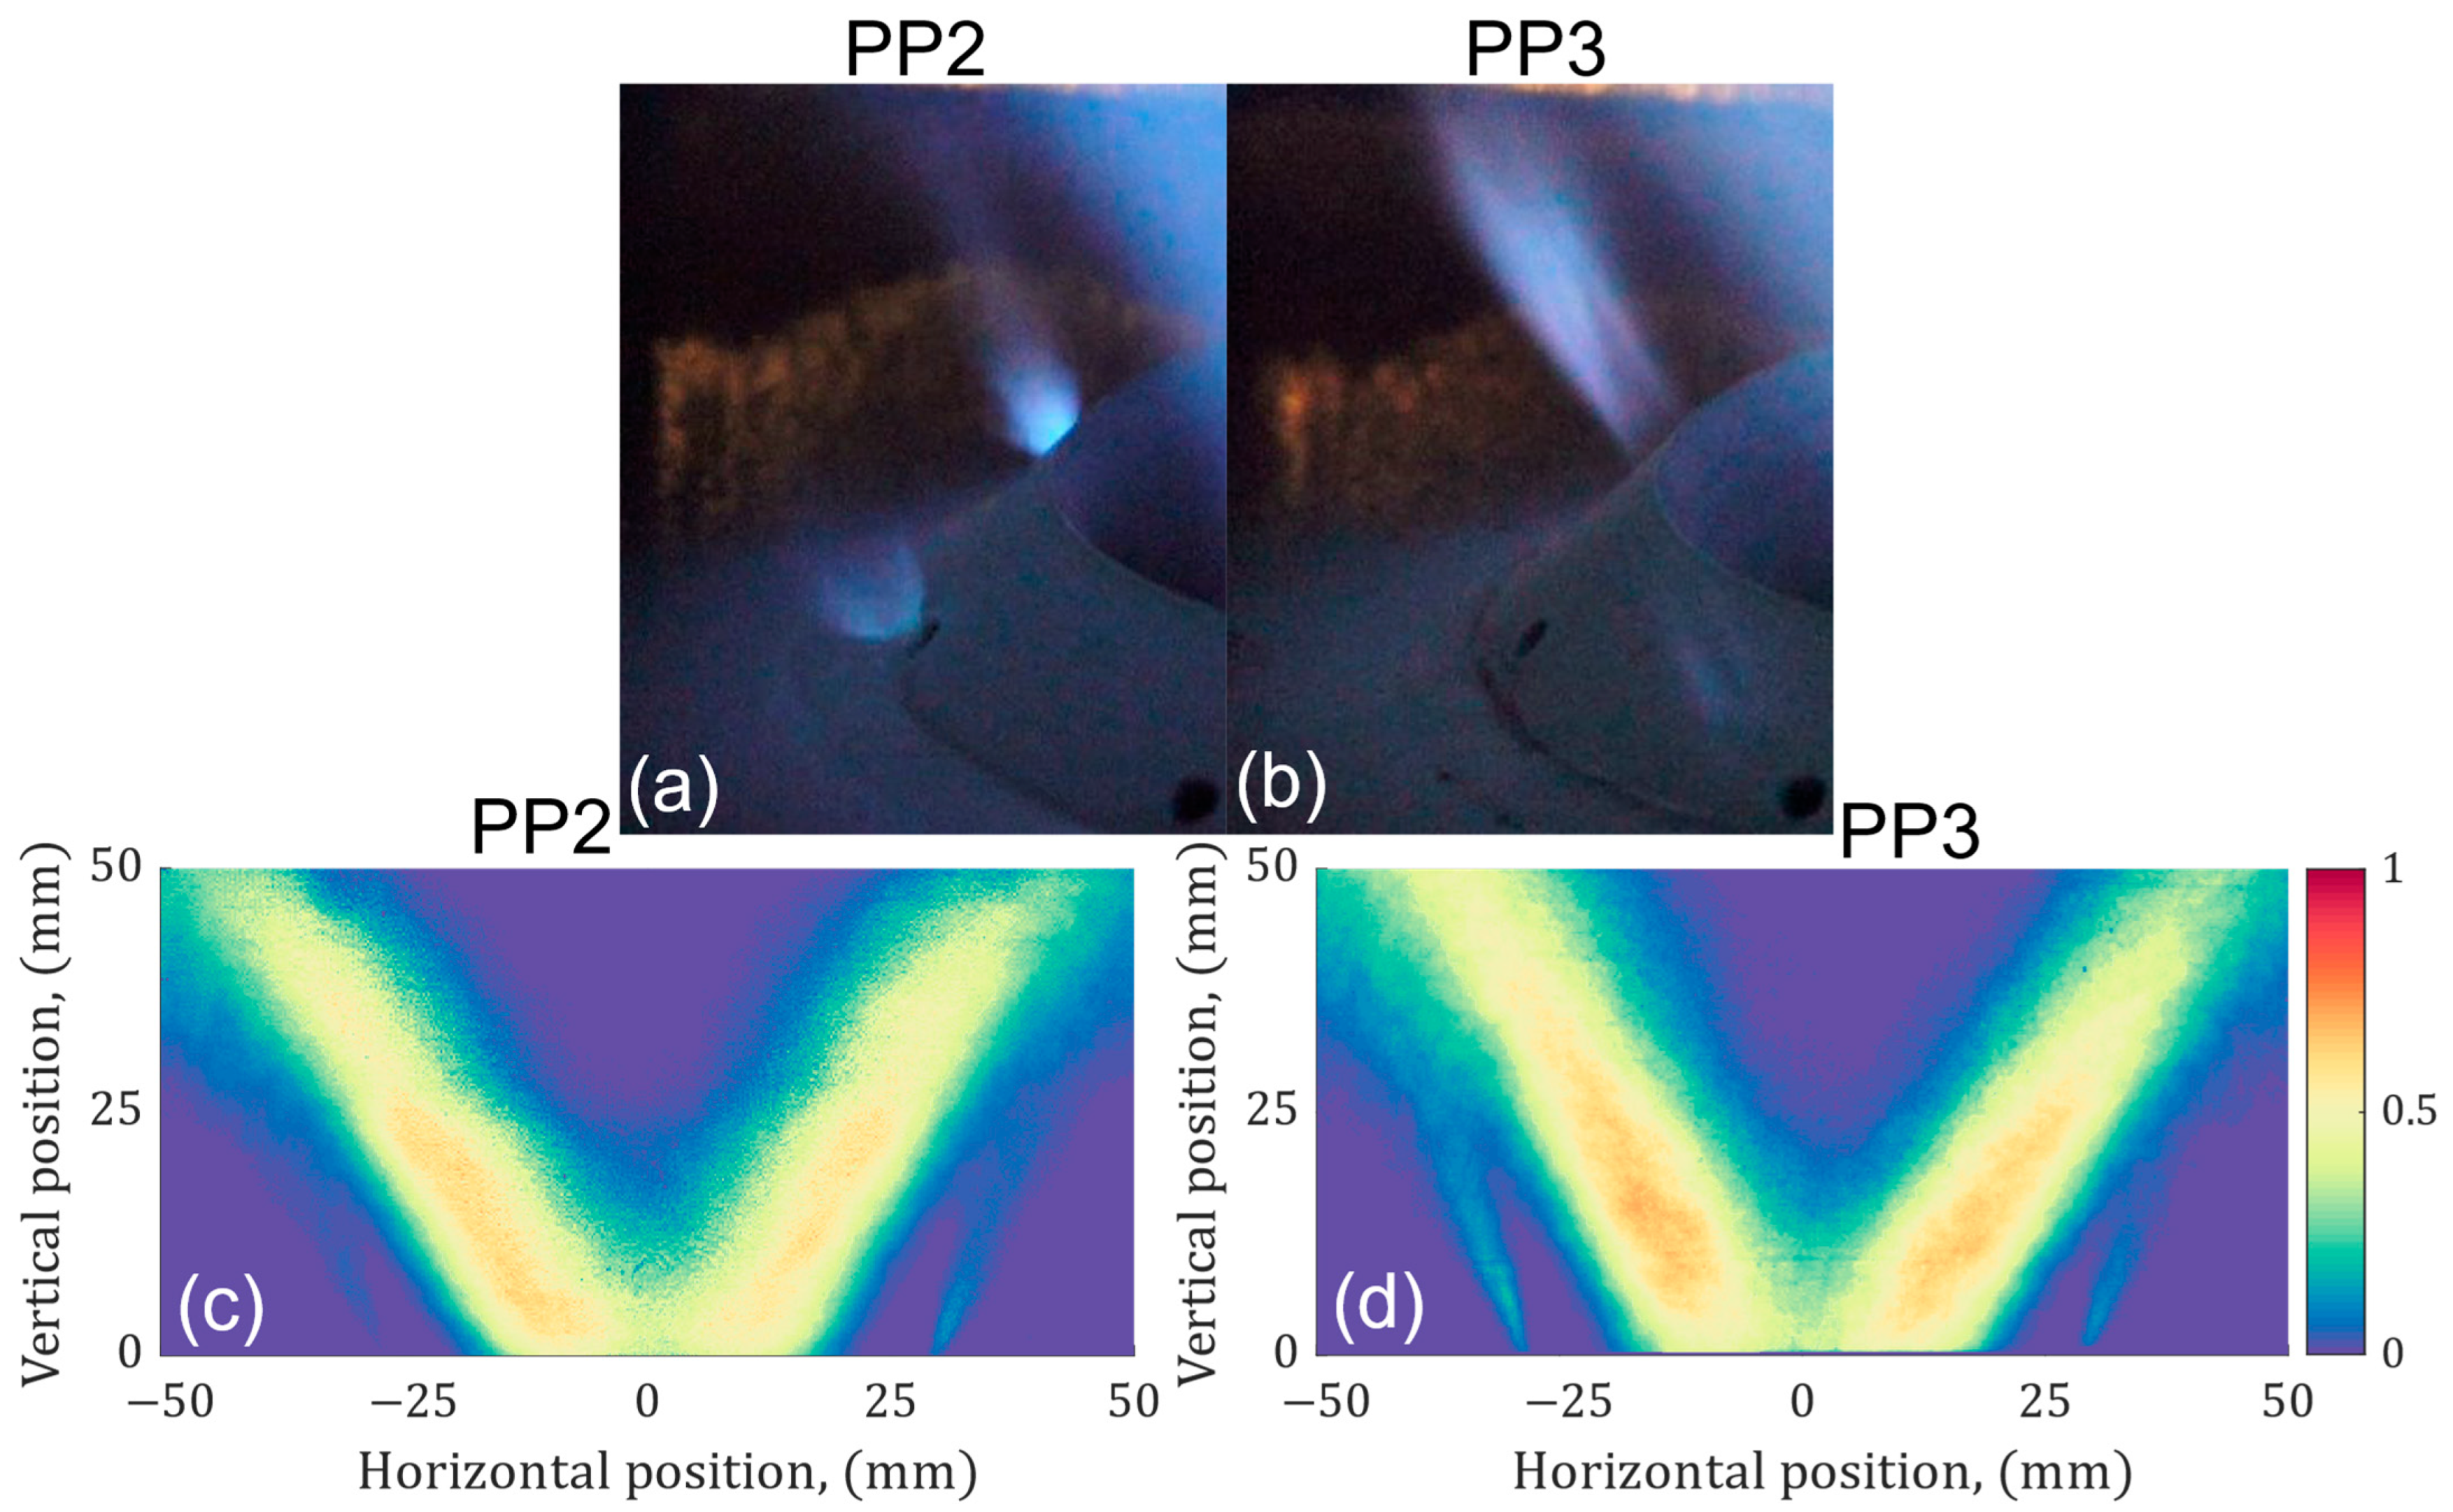
3.3. PP2 and PP3 Pilot Hardware Configurations

Figure 4 shows that the spread in surface temperature for different pilot injection strategies is much smaller for the PP2 and PP3 pilot hardware configurations than the DP1 pilot hardware configuration. This is primarily due to the reduced cooling effect of the pilot air for PP2 and PP3 compared to the DP1 pilot hardware configuration because the pilot air injection is more uniform and is injected from a lower position for the DP1 pilot hardware configuration as visible in Figure 1b. The lower point of air injection and the uniformity of the air injection creates an air film over the DP1 nozzle which is not created for the PP2 and PP3 pilot hardware configurations resulting in reduced pilot air cooling.
The pilot flames do not attach to the nozzle surface with the CH4 fuel for the PP2 and PP3 pilot hardware configurations as seen in Figure 9a and 9b for the same reasons as the DP1 pilot hardware configuration. As a result, the main flame in the combustion chamber is dominating the surface heating for the CH4 fuel, and the surface temperature is relatively insensitive to the amount of pilot air and fuel for PP2 and PP3. For the H2/CH4 fuel, the surface temperature of the PP3 is more affected by the pilot injection strategy than PP2, as seen by the surface temperature increase of the PP3 nozzle for the A1F6 and A2F6 conditions in Figure 4. This is because the pilot flames are relatively close to the surface of the PP3 nozzle as seen in Figure 9d, leading to increased heating by the pilot flames compared to the PP2 pilot hardware configuration in Figure 9c. The fact that PP3 is more closely attached to the nozzle surface is expected due to the higher level of premixing for the PP3 pilot hardware configuration compared to the PP2 pilot hardware configuration.
Figure 4 shows that the highest temperature pilot injection strategy with the CH4 fuel for both PP2 and PP3 is A0F0. This result is in line with the results from the DP1 pilot hardware configuration as the local surface heating of the pilot flames is minor in comparison to the heating from the main combustion for this fuel. Due to the low pilot flame heating of PP2, the hottest condition with H2/CH4 fuel is found for the no pilot (A0F0) injection strategy which has no pilot air or fuel flow. For PP3 the higher pilot flame heating leads to A1F6 being the hottest. This leads to the surface temperature of PP3 being approximately 20 K higher than PP2 with the H2/CH4 fuel for the A1F6 and A2F6 pilot injection strategies. This is due to the higher degree of fuel/air mixing of PP3. With pure methane fuel, the PP3 pilot hardware configuration was approximately 20 K hotter than the PP2 pilot hardware configuration for the same reason. With the CH4 fuel, the DP1 pilot hardware configuration was approximately 40 K cooler than the PP2 pilot hardware configuration for all pilot injection strategies except A0F0. This lower temperature of the DP1 nozzle is caused by the nozzle wall cooling by the pilot air flow as discussed previously. This protective air stream is not as effective in the partially premixed pilot hardware configurations. For the H2/CH4 fuel, the temperature difference between the DP1 and PP2 pilot hardware configurations was less than 20 K in situations with pilot flame due to the increased heating by the pilot flame with this fuel for DP1 counteracting the cooling from the pilot air injections.
There is a much smaller difference in the temperature between the PP2 and PP3 configurations for the A2F2 pilot injection strategy when using H2/CH4 as fuel than the A1F6 and A2F6 pilot injection strategies (Figure 4). For both partially premixed pilot hardware configurations, the pilot flames are significantly weaker than in the non-premixed (DP1) configuration (see Figure 6a and Figure 10c,d), leading to almost no difference between the PP2 and PP3 pilot hardware configurations. The H2/CH4 A2F2 pilot injection condition is lean for PP2 and PP3, whereas A2F6 and A1F6 are fuel rich (Table 1); this leads to the lower heat load to the surface. The low intensity of the pilot flames in the OH-PLIF PM for PP2 and PP3 with the A2F2 pilot injection strategy in Figure 10c,d also confirms that the contribution of the pilot flames is less significant. As a result, the temperatures for the A2F2 pilot injection strategy are much more similar for the two partially premixed pilot hardware configurations.

4. Conclusions

The surface temperature of a burner nozzle was measured using scanning point-wise lifetime phosphor thermometry. This was used to investigate the impact of different pilot hardware configuration designs, fuels, and pilot injection strategies on the combustion nozzle surface temperature. Flame luminosity and OH PLIF imaging were carried out to characterize flame structures. The results indicate the following:
  • The nozzle surface temperatures are governed by the balance between the cooling effect of the pilot air and fuel streams and the heating from the main and the pilot flames. With pure methane fuel, the pilot flames provided quite low local heating to the burner nozzle due to the pilot flames not being closely attached to the surface of the nozzle. With the H2/CH4 fuel, the local heating from the pilot flame was more significant due to the pilot flames being in general more closely attached to the pilot nozzle.
  • H2-enrichment of the methane fuel impacts the surface temperatures in two counteracting ways. First, the lower equivalence ratio decreases flame temperature and the heating from the main flame thereby decreasing the surface temperatures. Second, the higher reactivity and diffusivity of H2 help the pilot flames attach to the pilot nozzles, thus promoting an increase in the nozzle surface temperature in the non-premixed pilot injection strategies.
  • The mixing of the pilot air and fuel streams has significant impact on the surface temperatures. The non-premixed pilot (DP1) results differ significantly from the partially premixed ones due to the different pilot flame structures. The non-premixed pilot flames with methane as fuel are in general lifted off the nozzle; thus, air flow cooling plays a dominant role. The pilot injection strategy without pilot fuel and air injection (A0F0) has the highest surface temperature due to absence of air flow cooling.
  • The surface temperature of the PP3 nozzle is overall 20 K higher than PP2 for both the CH4 and H2/CH4 fuels. This is due to the higher degree of fuel/air mixing of PP3 nozzle than PP2 leading to more closely anchored pilot flames. Both premixed pilot configurations showed, in general, minor surface temperature dependence on the pilot injection strategies with CH4 due to the lifted pilot flame structures. For PP3 with the H2/CH4 fuel, the surface temperature increased significantly for the A1F6 and A2F6 cases due to the increased heat load to the surface, while the temperature for PP2 remained very similar to the other pilot injection strategies.
  • The azimuthal variation of the surface temperature indicated that the structure of the inner channels used to transport the pilot fuel and air streams do have a measurable impact on the surface temperatures.

Author Contributions

Conceptualization, A.S. and D.L.; methodology, H.F., F.P. and A.S.; formal analysis, H.F.; investigation, H.F., A.S., F.P. and R.B.; writing—original draft preparation, H.F. and F.P.; writing—review and editing, M.R., X.-S.B., R.-Z.S., A.S., R.B. and H.F.; visualization, H.F.; supervision, M.R. and X.-S.B.; project administration A.S. and D.L.; funding acquisition, M.R., X.-S.B. and A.S. All authors have read and agreed to the published version of the manuscript.

Funding

The authors would like to acknowledge funding from the Swedish Research Council/Swedish Energy Agency through project numbers 45400-01 and 44120-1, Siemens Energy AB, and the Centre for Combustion Science and Technology (CECOST, 22538).

Institutional Review Board Statement

Not applicable.

Informed Consent Statement

Not applicable.

Data Availability Statement

The data presented in this study are available on request from the corresponding author.

Conflicts of Interest

The authors declare no conflict of interest.

References

  1. Schefer, R. Reduced Turbine Emissions Using Hydrogen-Enriched Fuels. In Proceedings of the 2002 US DOE Hydrogen Program Review, Golden, CO, USA, 6–10 May 2002; pp. 1–16. [Google Scholar]
  2. Schefer, R.W.; Wicksall, D.M.; Agrawal, A.K. Combustion of hydrogen-enriched methane in a lean premixed swirl-stabilized burner. Proc. Combust. Inst. 2002, 29, 843–851. [Google Scholar] [CrossRef]
  3. Wicksall, D.M.; Agrawal, A.K.; Schefer, R.W.; Keller, J.O. Fuel Composition Effects on the Velocity Field in a Lean Premixed Swirl-Stabilized Combustor. Turbo Expo: Power Land Sea Air 2003, 36851, 539–548. [Google Scholar]
  4. Candel, S.; Durox, D.; Schuller, T.; Bourgouin, J.F.; Moeck, J.P. Dynamics of swirling flames. Annu. Rev. Fluid Mech. 2014, 46, 147–173. [Google Scholar] [CrossRef]
  5. Gupta, A.K.; Syred, N.; Lilley, D.G. Swirl Flows; Taylor & Francis: Oxfordshire, UK, 1984. [Google Scholar]
  6. Syred, N.; Chigier, N.A.; Beér, J.M. Flame stabilization in recirculation zones of jets with swirl. Symp. Combust. 1971, 13, 617–624. [Google Scholar] [CrossRef]
  7. Syred, N.; Beér, J.M. Combustion in swirling flows: A review. Combust. Flame 1974, 23, 143–201. [Google Scholar]
  8. Weber, R.; Dugué, J. Combustion accelerated swirling flows in high confinements. Prog. Energy Combust. Sci. 1992, 18, 349–367. [Google Scholar] [CrossRef]
  9. Weigand, P.; Meier, W.; Duan, X.R.; Stricker, W.; Aigner, M. Investigations of swirl flames in a gas turbine model combustor: I. Flow field, structures, temperature, and species distributions. Combust. Flame 2006, 144, 205–224. [Google Scholar] [CrossRef]
  10. Formation of Nitric Oxides. In Combustion: Physical and Chemical Fundamentals, Modeling and Simulation, Experiments, Pollutant Formation; Springer: Berlin/Heidelberg, Germany, 2006; pp. 259–276.
  11. Michaud, M.G.; Westmoreland, P.R.; Feitelberg, A.S. Chemical mechanisms of NOx formation for gas turbine conditions. Symp. Combust. 1992, 24, 879–887. [Google Scholar] [CrossRef]
  12. Zeldovich, Y.B. The Oxidation of Nitrogen in Combustion and Explosions. In Selected Works of Yakov Borisovich Zeldovich, Volume I: Chemical Physics and Hydrodynanics; Sunyaev, R.A., Ed.; Princeton University Press: Princeton, NJ, USA, 2014; pp. 364–403. [Google Scholar]
  13. Kim, W.-W.; Lienau, J.J.; van Slooten, P.R.; Colket, M.B., III; Malecki, R.E.; Syed, S. Towards Modeling Lean Blow Out in Gas Turbine Flameholder Applications. In Proceedings of the Turbo Expo: Power for Land, Sea, and Air, Vienna, Austria, 14–17 June 2004; pp. 623–633. [Google Scholar]
  14. Matalon, M. Intrinsic flame instabilities in premixed and nonpremixed combustion. Annu. Rev. Fluid Mech. 2007, 39, 163–191. [Google Scholar] [CrossRef] [Green Version]
  15. Sankaran, R.; Im, H.G. Effects of hydrogen addition on the markstein length and flammability limit of stretched methane/air premixed flames. Combust. Sci. Technol. 2006, 178, 1585–1611. [Google Scholar] [CrossRef]
  16. Mandilas, C.; Ormsby, M.P.; Sheppard, C.G.W.; Woolley, R. Effects of hydrogen addition on laminar and turbulent premixed methane and iso-octane-air flames. Proc. Combust. Inst. 2007, 31, 1443–1450. [Google Scholar] [CrossRef]
  17. Subash, A.A.; Collin, R.; Aldén, M.; Kundu, A.; Klingmann, J. Experimental Investigation of the Influence of Burner Geometry on Flame Characteristics at a Dry Low Emission Industrial Prototype Burner at Atmospheric Pressure Conditions. In Proceedings of the ASME Turbo Expo 2017: Turbomachinery Technical Conference and Exposition. Volume 4A: Combustion, Fuels and Emissions, Charlotte, NC, USA, 26–30 June 2017. V04AT04A058. ASME. [Google Scholar]
  18. Albrecht, P.; Speck, S.; Schimek, S.; Bauermeister, F.; Paschereit, C.O.; Gutmark, E. Lean blowout control using an auxiliary premixed flame in a swirl-stabilized combustor. In Proceedings of the Collection of Technical Papers—43rd AIAA/ASME/SAE/ASEE Joint Propulsion Conference, Cincinnati, OH, USA, 8–11 July 2007; Volume 6. [Google Scholar]
  19. Subash, A.A.; Collin, R.; Aldén, M.; Kundu, A.; Klingmann, J. Investigation of Hydrogen Enriched Methane Flame in a Dry Low Emission Industrial Prototype Burner at Atmospheric Pressure Conditions. In Proceedings of the ASME Turbo Expo 2017: Turbomachinery Technical Conference and Exposition. Volume 4A: Combustion, Fuels and Emissions, Charlotte, NC, USA, 26–30 June 2017. V04AT04A056. ASME. [Google Scholar]
  20. Brübach, J.; Pflitsch, C.; Dreizler, A.; Atakan, B. On surface temperature measurements with thermographic phosphors: A review. Prog. Energy Combust. Sci. 2013, 39, 37–60. [Google Scholar] [CrossRef]
  21. Aldén, M.; Omrane, A.; Richter, M.; Särner, G. Thermographic phosphors for thermometry: A survey of combustion applications. Prog. Energy Combust. Sci. 2011, 37, 422–461. [Google Scholar] [CrossRef]
  22. Heyes, A.L.; Seefeldt, S.; Feist, J.P. Two-colour phosphor thermometry for surface temperature measurement. Opt. Laser Technol. 2006, 38, 257–265. [Google Scholar] [CrossRef]
  23. Petit, S.; Xavier, P.; Godard, G.; Grisch, F. Improving the temperature uncertainty of Mg4FGeO6:Mn4+ ratio-based phosphor thermometry by using a multi-objective optimization procedure. Appl. Phys. B 2022, 128, 57. [Google Scholar] [CrossRef]
  24. Jones, E.M.C.; Jones, A.R.; Hoffmeister, K.N.G.; Winters, C. Advances in phosphor two-color ratio method thermography for full-field surface temperature measurements. Meas. Sci. Technol. 2022, 33, 85201. [Google Scholar] [CrossRef]
  25. Fuhrmann, N.; Brübach, J.; Dreizler, A. Phosphor thermometry: A comparison of the luminescence lifetime and the intensity ratio approach. Proc. Combust. Inst. 2013, 34, 3611–3618. [Google Scholar] [CrossRef]
  26. Brites, C.D.S.; Balabhadra, S.; Carlos, L.D. Lanthanide-Based Thermometers: At the Cutting-Edge of Luminescence Thermometry. Adv. Opt. Mater. 2019, 7, 1801239. [Google Scholar] [CrossRef] [Green Version]
  27. Nau, P.; Yin, Z.; Lammel, O.; Meier, W. Wall Temperature Measurements in Gas Turbine Combustors with Thermographic Phosphors. J. Eng. Gas Turbines Power 2019, 141, 041021. [Google Scholar] [CrossRef] [Green Version]
  28. Nau, P.; Görs, S.; Arndt, C.; Witzel, B.; Endres, T. Wall temperature measurements in a full-scale gas turbine combustor test rig with fiber coupled phosphor thermometry. J. Turbomach. 2021, 143, 011007. [Google Scholar] [CrossRef]
  29. Eldridge, J.I.; Allison, S.W.; Jenkins, T.P.; Gollub, S.L.; Hall, C.A.; Walker, D.G. Surface temperature measurements from a stator vane doublet in a turbine afterburner flame using a YAG:Tm thermographic phosphor. Meas. Sci. Technol. 2016, 27, 125205. [Google Scholar] [CrossRef]
  30. Euler, M.; Zhou, R.; Hochgreb, S.; Dreizler, A. Temperature measurements of the bluff body surface of a swirl burner using phosphor thermometry. Combust. Flame 2014, 161, 2842–2848. [Google Scholar] [CrossRef]
  31. Arndt, C.M.; Nau, P.; Meier, W. Characterization of wall temperature distributions in a gas turbine model combustor measured by 2D phosphor thermometry. Proc. Combust. Inst. 2021, 38, 1867–1875. [Google Scholar] [CrossRef]
  32. Hodzic, E.; Yu, S.; Subash, A.A.; Liu, X.; Szasz, R.; Li, Z.; Aldén, M. Numerical and Experimental Investigation of the CeCOST Swirl Burner. In Proceedings of the ASME Turbo Expo 2018: Turbomachinery Technical Conference and Exposition. Volume 4A: Combustion, Fuels, and Emissions, Oslo, Norway, 11–15 June 2018. V04AT04A056. ASME. [Google Scholar]
  33. Subash, A.A.; Yu, S.; Liu, X.; Bertsch, M.; Szasz, R.; Li, Z.; Bai, X.; Aldén, M.; Lörstad, D. Flame investigations of a laboratory-scale CECOST swirl burner at atmospheric pressure conditions. Fuel 2020, 279, 118421. [Google Scholar] [CrossRef]
  34. Pignatelli, F.; Kim, H.; Subash, A.A.; Liu, X.; Szasz, R.Z.; Bai, X.S.; Brackmann, C.; Aldén, M.; Lörstad, D. Pilot Impact on Turbulent Premixed Methane/Air and Hydrogen-Enriched Methane/Air Flames in a Laboratory-Scale Gas Turbine Model Combustor. Int. J. Hydrog. Energy 2022, 47, 25404–25417. [Google Scholar] [CrossRef]
  35. Hodzic, E. Analysis of Flow Dynamics and Flame Stabilization in Gas Turbine Related Combustors. Ph.D. Thesis, Lund University, Lund, Sweden, 2016. [Google Scholar]
  36. Liu, X.; Bertsch, M.; Subash, A.A.; Yu, S.; Szasz, R.-Z.; Li, Z.; Petersson, P.; Bai, X.-S.; Aldén, M.; Lörstad, D. Investigation of turbulent premixed methane/air and hydrogen-enriched methane/air flames in a laboratory-scale gas turbine model combustor. Int. J. Hydrog. Energy 2021, 46, 13377–13388. [Google Scholar] [CrossRef]
  37. Li, Z.S.; Li, B.; Sun, Z.W.; Bai, X.S.; Aldén, M. Turbulence and combustion interaction: High resolution local flame front structure visualization using simultaneous single-shot PLIF imaging of CH, OH, and CH2O in a piloted premixed jet flame. Combust. Flame 2010, 157, 1087–1096. [Google Scholar] [CrossRef]
  38. Bechtel, J.H.; Teets, R.E. Hydroxyl and its concentration profile in methane-air flames. Appl. Opt. 1979, 18, 4138. [Google Scholar] [CrossRef]
  39. Someya, S.; Uchida, M.; Tominaga, K.; Terunuma, H.; Li, Y.; Okamoto, K. Lifetime-based phosphor thermometry of an optical engine using a high-speed CMOS camera. Int. J. Heat Mass Transf. 2011, 54, 3927–3932. [Google Scholar] [CrossRef]
  40. Kissel, T.; Baum, E.; Dreizler, A.; Brübach, J. Two-dimensional thermographic phosphor thermometry using a CMOS high speed camera system. Appl. Phys. B Lasers Opt. 2009, 96, 731–734. [Google Scholar] [CrossRef]
  41. Heyes, A.L. On the design of phosphors for high-temperature thermometry. J. Lumin. 2009, 129, 2004–2009. [Google Scholar] [CrossRef]
  42. Allison, S.W.; Beshears, D.L.; Cates, M.R.; Scudiere, M.B.; Shaw, D.W.; Ellis, A.D. Luminescence of YAG:Dy and YAG:Dy, Er crystals to 1700 °C. Meas. Sci. Technol. 2020, 31, 044001. [Google Scholar] [CrossRef]
  43. Särner, G.; Richter, M.; Aldén, M. Investigations of blue emitting phosphors for thermometry. Meas. Sci. Technol. 2008, 19, 125304. [Google Scholar] [CrossRef]
  44. Nada, F.A.; Knappe, C.; Xu, X.; Richter, M.; Aldén, M. Development of an automatic routine for calibration of thermographic phosphors. Meas. Sci. Technol. 2014, 25, 025201. [Google Scholar] [CrossRef]
Figure 1. Setup of gas turbine model combustor: (a) Cross section of the CECOST burner. Images and cross section illustrations of the (b) non-premixed pilot (DP1), (c) low degree partially premixed pilot (PP2), and (d) higher degree partially premixed pilot (PP3) pilot injectors.
Ijtpp 07 00029 g001
Figure 2. Phosphor thermometry setup. EM—Energy Meter, DM—Dichroic Mirror, BD -Beam Dump. The zoomed view shows the location of the temperature measurement points. The measurement point number increases to the right.
Ijtpp 07 00029 g002
Figure 3. Example of thermocouple temperature during one measurement session for the PP2 nozzle with methane as fuel. The red shaded bars mark time intervals when measurements were performed, and the height of the bars indicate the mean thermocouple temperatures for the measurement. The dashed blue line shows the burner pilot injection strategy used.
Ijtpp 07 00029 g003
Figure 4. Surface temperatures for DP1, PP2, and PP3 pilot hardware configurations for methane and hydrogen-enriched methane. The red-dashed vertical line represents the position of the left nozzle in the field of view of the temperature measurement. The blue vertical line is the right nozzle. The pilot injection strategy is shown by the legend.
Ijtpp 07 00029 g004
Figure 5. Time averaged images of the DP1 nozzle and measured surface temperature: Pilot injection strategy A1F6 for CH4 (a) and H2/CH4 (b).
Ijtpp 07 00029 g005
Figure 6. Time averaged images of the DP1 nozzle and measured surface temperature: Pilot injection strategy A2F2 (a) and A2F6 (b) for H2/CH4 fuel.
Ijtpp 07 00029 g006
Figure 7. Time averaged image of the DP1 nozzle, A2F2 pilot injection strategy with pure CH4 flame showing the more significant pilot flame from the left pilot fuel injection. The measured surface temperature is indicated on the surface of the nozzle.
Ijtpp 07 00029 g007
Figure 8. OH-PLIF PMs using the DP1 nozzle: Pilot injection strategy A2F2 for CH4 (a) and H2/CH4 (b).
Ijtpp 07 00029 g008
Figure 9. Time averaged images of the pilot flames for pilot injection strategy A1F6: CH4 fuel for PP2 (a) and PP3 (b). H2/CH4 fuel for PP2 (c) and PP3 (d).
Ijtpp 07 00029 g009
Figure 10. Time averaged images and OH-LIF PMs of pilot injection strategy A2F2: Images of pilot flames for pilot configuration PP2 (a) and PP3 (b) with H2/CH4 fuel. OH-PLIF PM with H2/CH4 fuel for A2F2 with PP2 (c) and PP3 (d) pilot hardware configurations.
Ijtpp 07 00029 g010
Table 1. Investigated pilot injection strategies. The ϕ (fuel-air equivalence ratio) of the main and pilot flames for all pilot injection strategies is included.
Injection
Strategy
Pilot Air (%)Pilot Fuel (%) ϕ M a i n C H 4 ϕ P i l o t C H 4 ϕ M a i n C H 4 / H 2 ϕ P i l o t C H 4 / H 2
A1F6160.684.320.493.12
A2F6260.692.160.501.56
A2F2220.720.720.520.52
A2F0200.7400.530
A0F0000.7200.520
Publisher’s Note: MDPI stays neutral with regard to jurisdictional claims in published maps and institutional affiliations.

