Article

Effect of Tip Gap Size on the Performance of an Axial Compressor Stage with and without Active Flow Control †

1
Département Aérodynamique, Aéroélasticité, Acoustique, Office National d’Études et de Recherches Aérospatiales (ONERA), Université Paris Saclay, F-92190 Meudon, France
2
Université Lille, Centre National de la Recherche Scientifique (CNRS), ONERA, Arts et Metiers Institute of Technology, Centrale Lille Institut, LMFL, Laboratoire de Mécanique des Fluides de Lille—Kampé de Fériet, F-59000 Lille, France
*
Author to whom correspondence should be addressed.
This manuscript is an extended version of the ETC2023-207 meeting paper published in the Proceedings of the 15th European Turbomachinery Conference, Budapest, Hungary, 24–28 April 2023.
Int. J. Turbomach. Propuls. Power 2023, 8(3), 30; https://doi.org/10.3390/ijtpp8030030
Submission received: 12 June 2023 / Revised: 25 June 2023 / Accepted: 7 August 2023 / Published: 1 September 2023

Abstract

:
The tip gap region of an axial compressor rotor is a source of complex flows, inducing losses and stability issues. Recent works have proven the ability of blowing high-speed jets in the tip region to improve the surge margin of an axial compressor stage with a narrow tip gap configuration. However, the tip gap size can evolve during the compressor lifetime, possibly affecting its performance and operability. The objective is to evaluate the performance of an active flow control system on a compressor with different tip gap sizes. The present work is based on the single-stage compressor CME2 located at the Laboratory of Fluid Mechanics of Lille and equipped with actuators blowing at the rotor tip leading edge. Configurations with two different values of the tip gap to chord ratio (0.6% and 2.4%) are experimentally tested. RANS simulations are also performed. The effect of tip gap sizes and tip blowing on the flow topology and compressor performance is evaluated (surge margin improvement of the order of 200% for the larger tip gap size).

1. Introduction

The Air Transport Action Group has set a target of achieving net-zero carbon emissions by 2050 [1]. Among other solutions, this means improving the performance of aero-engines. Improving the pressure ratio of axial compressor stages is a significant challenge due to operating range limitations caused by flow instabilities like rotating stall and surge. Rotating stall typically occurs in the clearance region between the blades and casing when the tip leakage flow interacts with the main flow. To overcome these limitations, control systems that manipulate the flow near the casing have proven to be effective in increasing the safety margin against stall and, thus, in expanding the compressor’s operational range. These control systems can be passive (modifying the geometry without external energy) or active (requiring an external energy source). Recent research has demonstrated that active control, specifically injecting air upstream of the leading edge of the rotor tip, can delay the onset of stall. Indeed, active control provides a more versatile option in comparison to passive control, as it can be adapted to the machine operating point and can accommodate engine cycling and wear issues. Previous works have experimentally investigated the influence of the main geometric and fluidic parameters that have an influence on the injection performance [2,3]. CFD calculations have also been used to evaluate the ability of such systems to reduce losses and increase the compressor surge margin. Marty et al. [4] analyzed the benefit of blowing and the effect of blade tip suction. Neuhaus et al. [5] focused on continuous blowing to reduce the tip clearance noise with various configurations.
Nevertheless, all the above-cited works focused on a fixed compressor geometry, whereas the tip clearance of a compressor evolves with the machine age and depends on the rotor location and speed variations, and whereas it is well established that a modification of the tip gap size has a strong impact on compressor performance [6,7].
As an example, isentropic efficiency is significantly reduced as the ratio, R ( = τ c ), defined by the tip gap size, τ , over the axial chord, c, is increased from 0.9% to 3.4% [6]. The operating zone is also minimized due to a reduction of almost 10% in the stall safety margin [6]. According to the work of [7], the tip gap size is inversely proportional to the peak pressure rise of a blade: for every percent of increase in the tip gap size, 4% additional pressure losses are observed.
The main goal of the present paper is to evaluate the performance of an active flow control system on a compressor with different tip gap sizes and to investigate the fluid behavior at the blade tip with continuous air injection. The CME2, a single-stage compressor located at the Lille Fluid Mechanics Laboratory (LMFL), is used for this study. Previous works have experimentally and numerically investigated the tip gap size ratio, R, at R = 0.6% [8,9] for the CME2. This paper presents the effect of control on a larger tip clearance defined as R = 2.4%. The paper is organized as follows: first, the test bench and the CFD methodology are described. Then, a reference case is presented. Finally, the impact of the active flow control parameters is discussed. This manuscript corresponds to our paper published in the Proceedings of the 15th European Turbomachinery Conference [10].

2. Materials and Methods

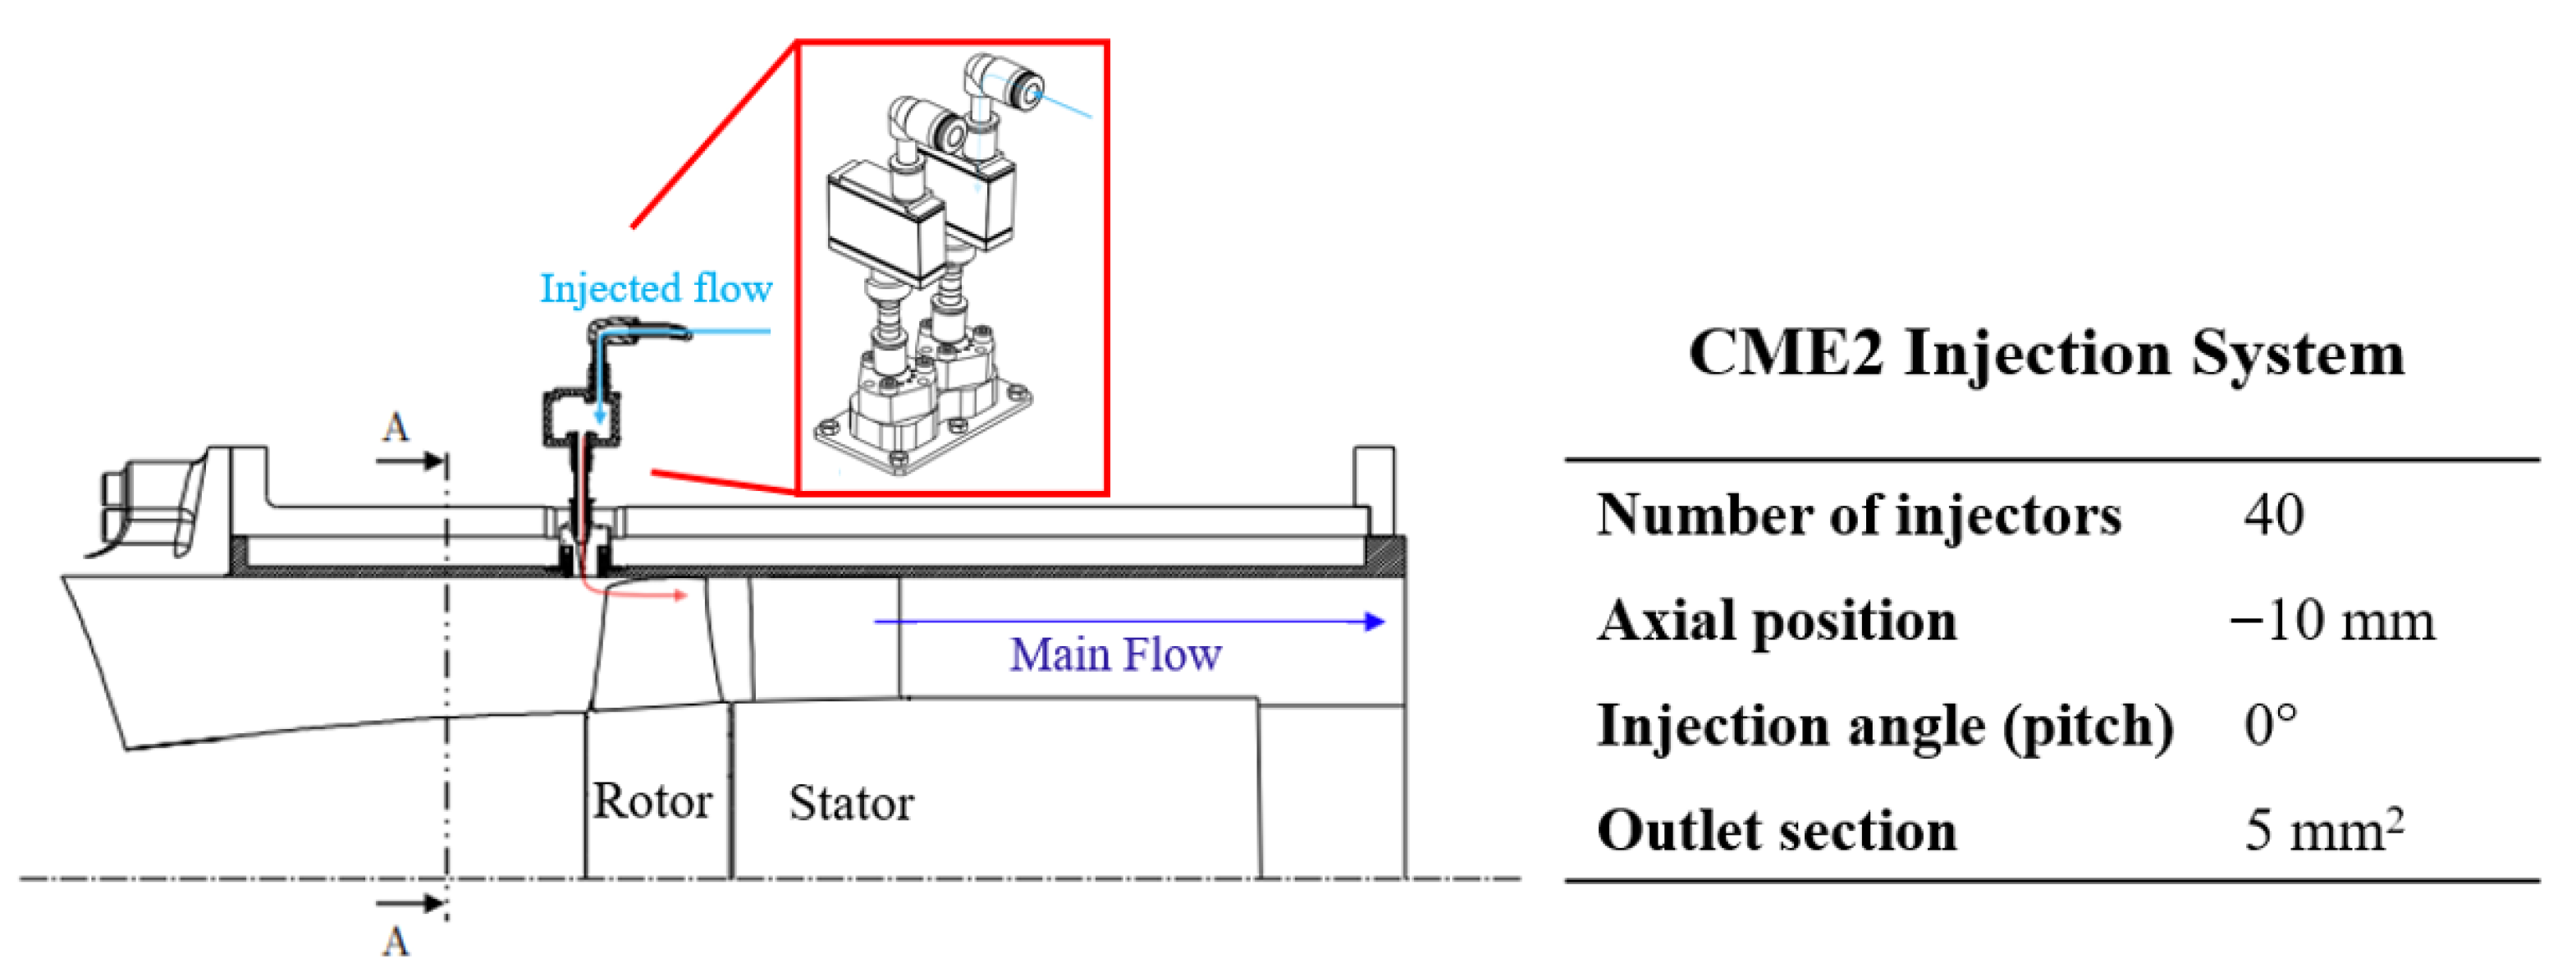
2.1. Experimental Facility and Active Flow Control System

The experimental set-up under consideration is the CME2, a single-stage axial compressor operated at the Lille Fluid Mechanics Laboratory [11]. All the tests presented were performed at the rotational velocity Ω = 3200 rpm. The CME2 is 2 π / 10 periodic with 30 blades for the rotor and 40 blades for the stator. The stagnation pressure ratio is 1.03 at Ω , and the nominal mass flow rate is equal to 5.3 kg/s. The rotor tip velocity is 94 m/s. The design axial velocity at the leading edge is 43 m/s.
More details about the geometrical configuration are given in [11]. As shown in Figure 1, the CME2 blowing system includes 20 pairs of actuators, located around the CME2 circumference. The center of the injector is upstream of the leading edge of the rotor, at −10 mm. The injectors were designed to benefit from the Coandă effect, and the jet is attached to the wall casing to interact efficiently with the rotor blade tip flow. The active control characteristics are summarized in Figure 1.
The injectors are fed with an external compression system that allows for adjusting the mass flow injected by the control system. The absolute injection angle is also adjustable and is defined as follows: the angle is positive when the jet tangential velocity component is in the same direction as the speed of rotation (Figure 2).

2.2. Numerical Set-Up
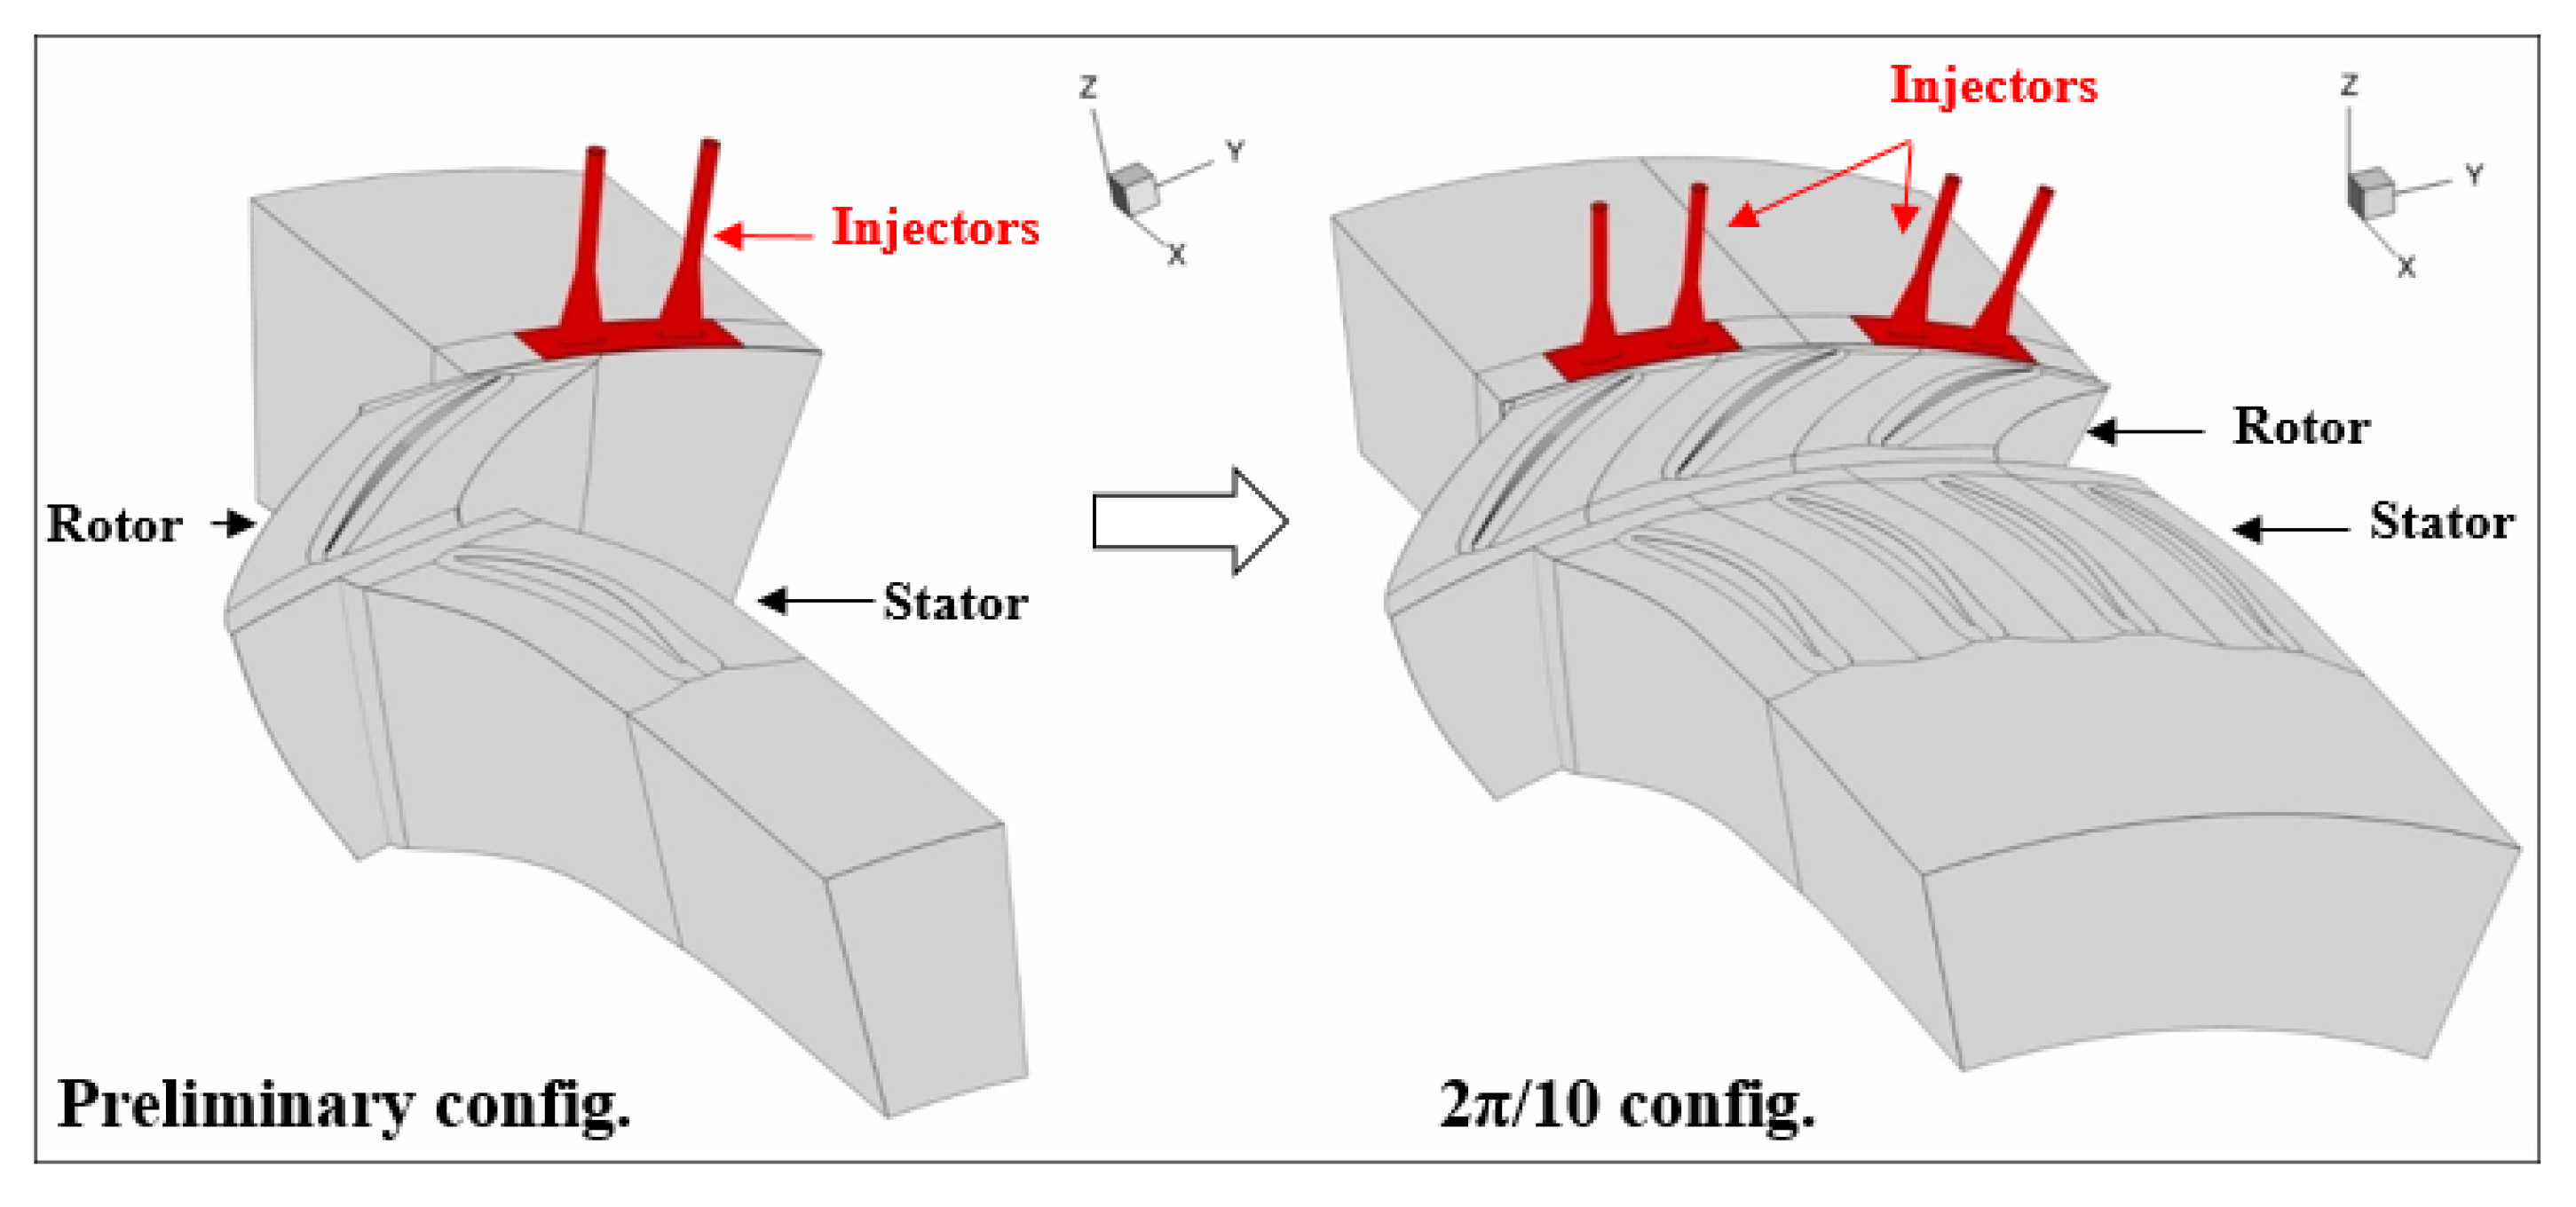
2.2.1. Presentation of the 2 π /10 Configurations

A preliminary computational domain was designed to obtain a 2 π /10 configuration using the natural periodicity of the machine (Figure 3). This consists of a single-blade channel composed of one rotor blade and one stator blade with one pair of fluidic actuators. The all mesh is composed of 7 × 10 6 nodes. The y + values at the blade wall are lower than 1 in the entire domain. When the tip gap size is changed, the number of points is adjusted to maintain the cells aspect ratio. It is presented in [12] that for the smaller tip gap (R = 0.6%), the single-blade channel (SBC) and 2 π /10 configurations give very similar results from nominal to stall conditions, which are very close to the experimental data. However, for the larger tip gap (R = 2.4%), the SBC simulations fail to predict the critical mass flow rate at stall conditions. Hence, in the present paper, the results from the RANS 2 π /10 configuration are presented.
Concerning the injectors, the elements of prisms, pyramids, and tetrahedra comprise the mesh for the interface between the injector and the channel (upstream, rotor and stator parts). The channel is meshed with structured blocks using an ’O-nH’ topology. Finally, the software Pointwise® allowed the conversion of the hexahedra mesh of the injectors into unstructured blocks.

2.2.2. General Parameters

The RANS 2 π /10 calculations are performed with the elsA solver, developed at ONERA and co-owned by ONERA and SAFRAN [13]. This code relies on a cell-centered finite-volume discretization on structured and unstructured multi block meshes. A convergence study based on two types of mesh for a single-blade channel configuration without injectors, one at 10 6 and the other at 3 × 10 6 nodes was performed in [14]. The last mesh was selected as it presented a good compromise between numerical cost and reliability.
Laws of ideal gas, of Sutherland (for fluid viscosity), and of Fourier (for heat fluxes) are used together with Reynolds-averaged Navier–Stokes (RANS) equations to simulate the compressible flow within the CME2 compressor. RANS equations are solved by using the second-order upwind scheme of Roe for convective fluxes, for both the transport equations of turbulence models and the Navier–Stokes equations, and a classical second-order-centered scheme for the diffusive fluxes. The Spalart–Allmaras model [15] is applied for turbulence modeling. A backward Euler scheme is used for time integration with local time stepping in order to improve the convergence rate in the steady flow state. For the implicit phase, this is associated with a lower–upper symmetric successive over-relaxation scheme (LU-SSOR).
Table 1 presents all the boundary conditions for the simulations. A mixing plane is used in order to solve the rotor–stator interface and connect these blade rows in RANS calculations. Additionally, a subsonic outlet condition is used downstream of the domain: a static pressure is imposed with a radial equilibrium law defined by a valve law ( P s = P r e f + α r e l a x ( m ˙ / m ˙ r e f ) 2 ) based on a valve coefficient, α r e l a x , allowing us to set new operating conditions with a specific mass flow rate ( P r e f = 101,325 Pa, m ˙ r e f = 10.0 kg/s).
Different meshes are undertaken in order to evaluate the influence of the absolute injection angle of the jets (0 ; −30 ) on performance at the defined rotation speed of 3200 rpm. The considered hybrid meshes are characterized in Figure 4, illustrating the injector mesh for each injection angle, α i n j : 0 , −30 .

3. Results and Discussion

3.1. Reference without Control: Baseline Performance Assessment

First, to assess agreement between the experimental data and numerical results, simulations were performed without control with 2 π /10 configurations for a narrow tip gap size at R = 0.6% and a larger one at R = 2.4%. The test campaign was conducted on both tip gap sizes without control on the CME2. A valve was throttled progressively from nominal to stall conditions. For R = 0.6%, the experimental data are provided by [9]. As a reference case, the simulations were compared at the same configuration of the experimental data, with the injectors oriented at α i n j = 0 without blowing (Figure 5).

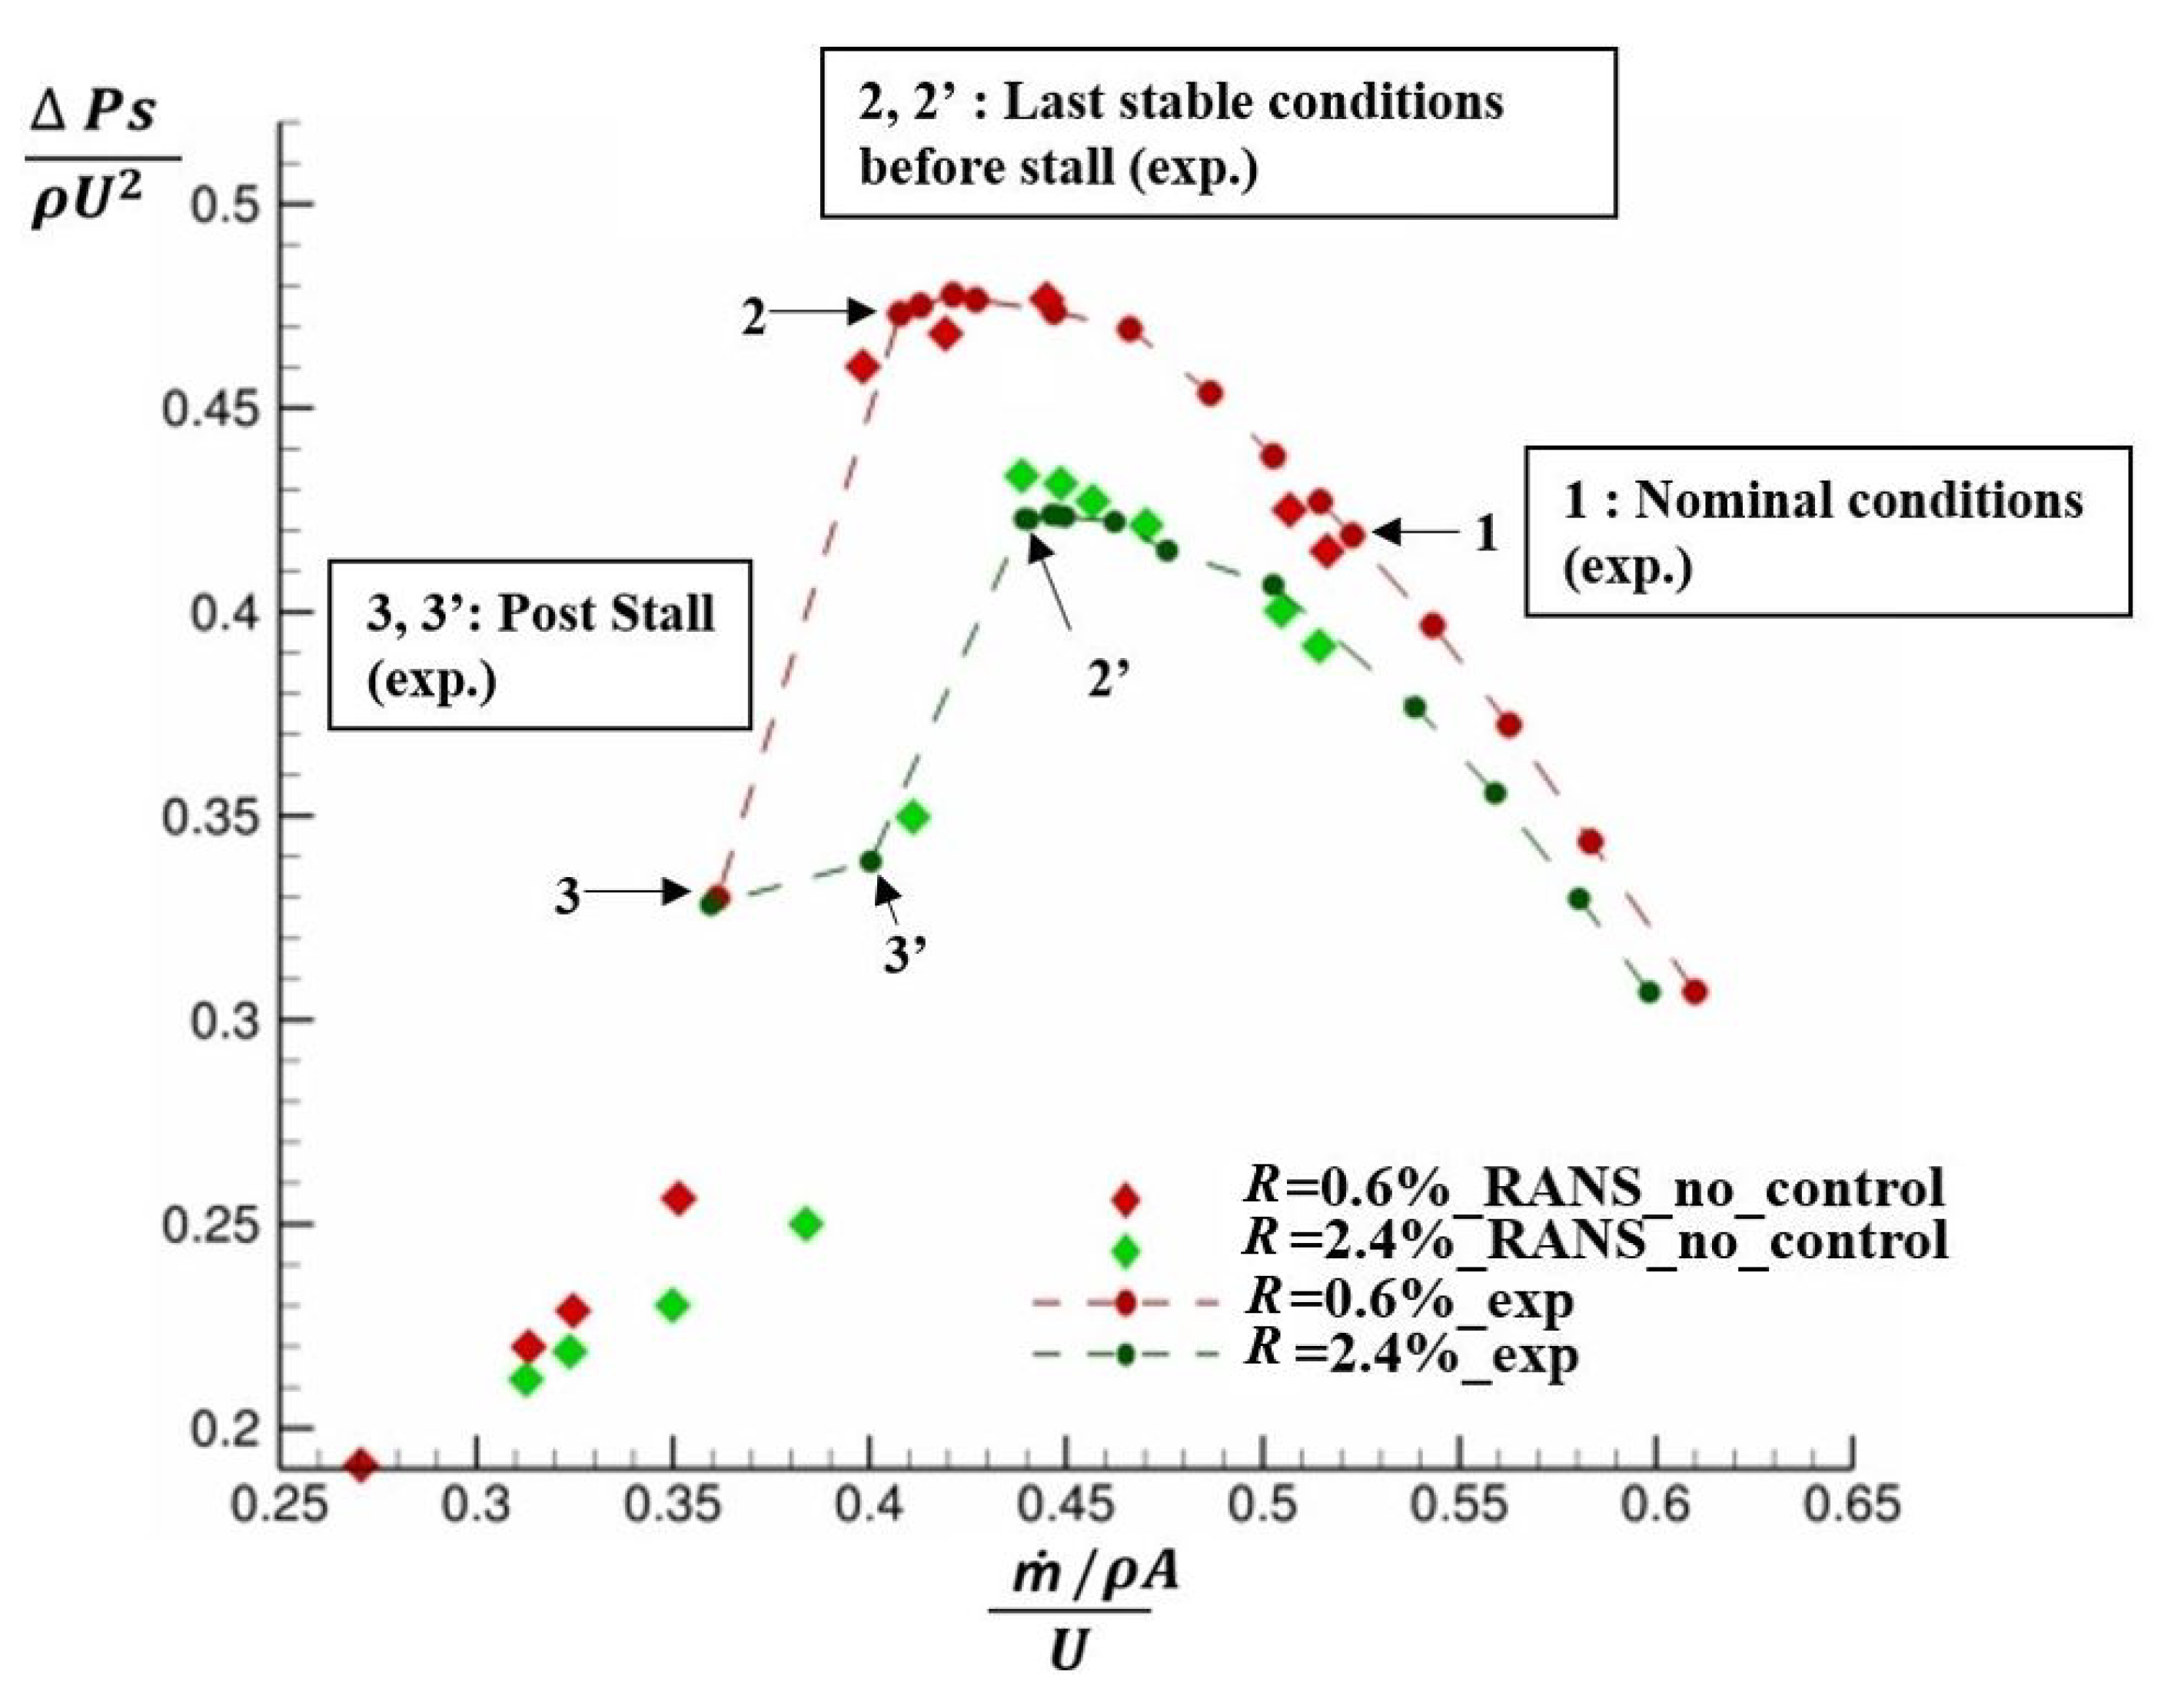
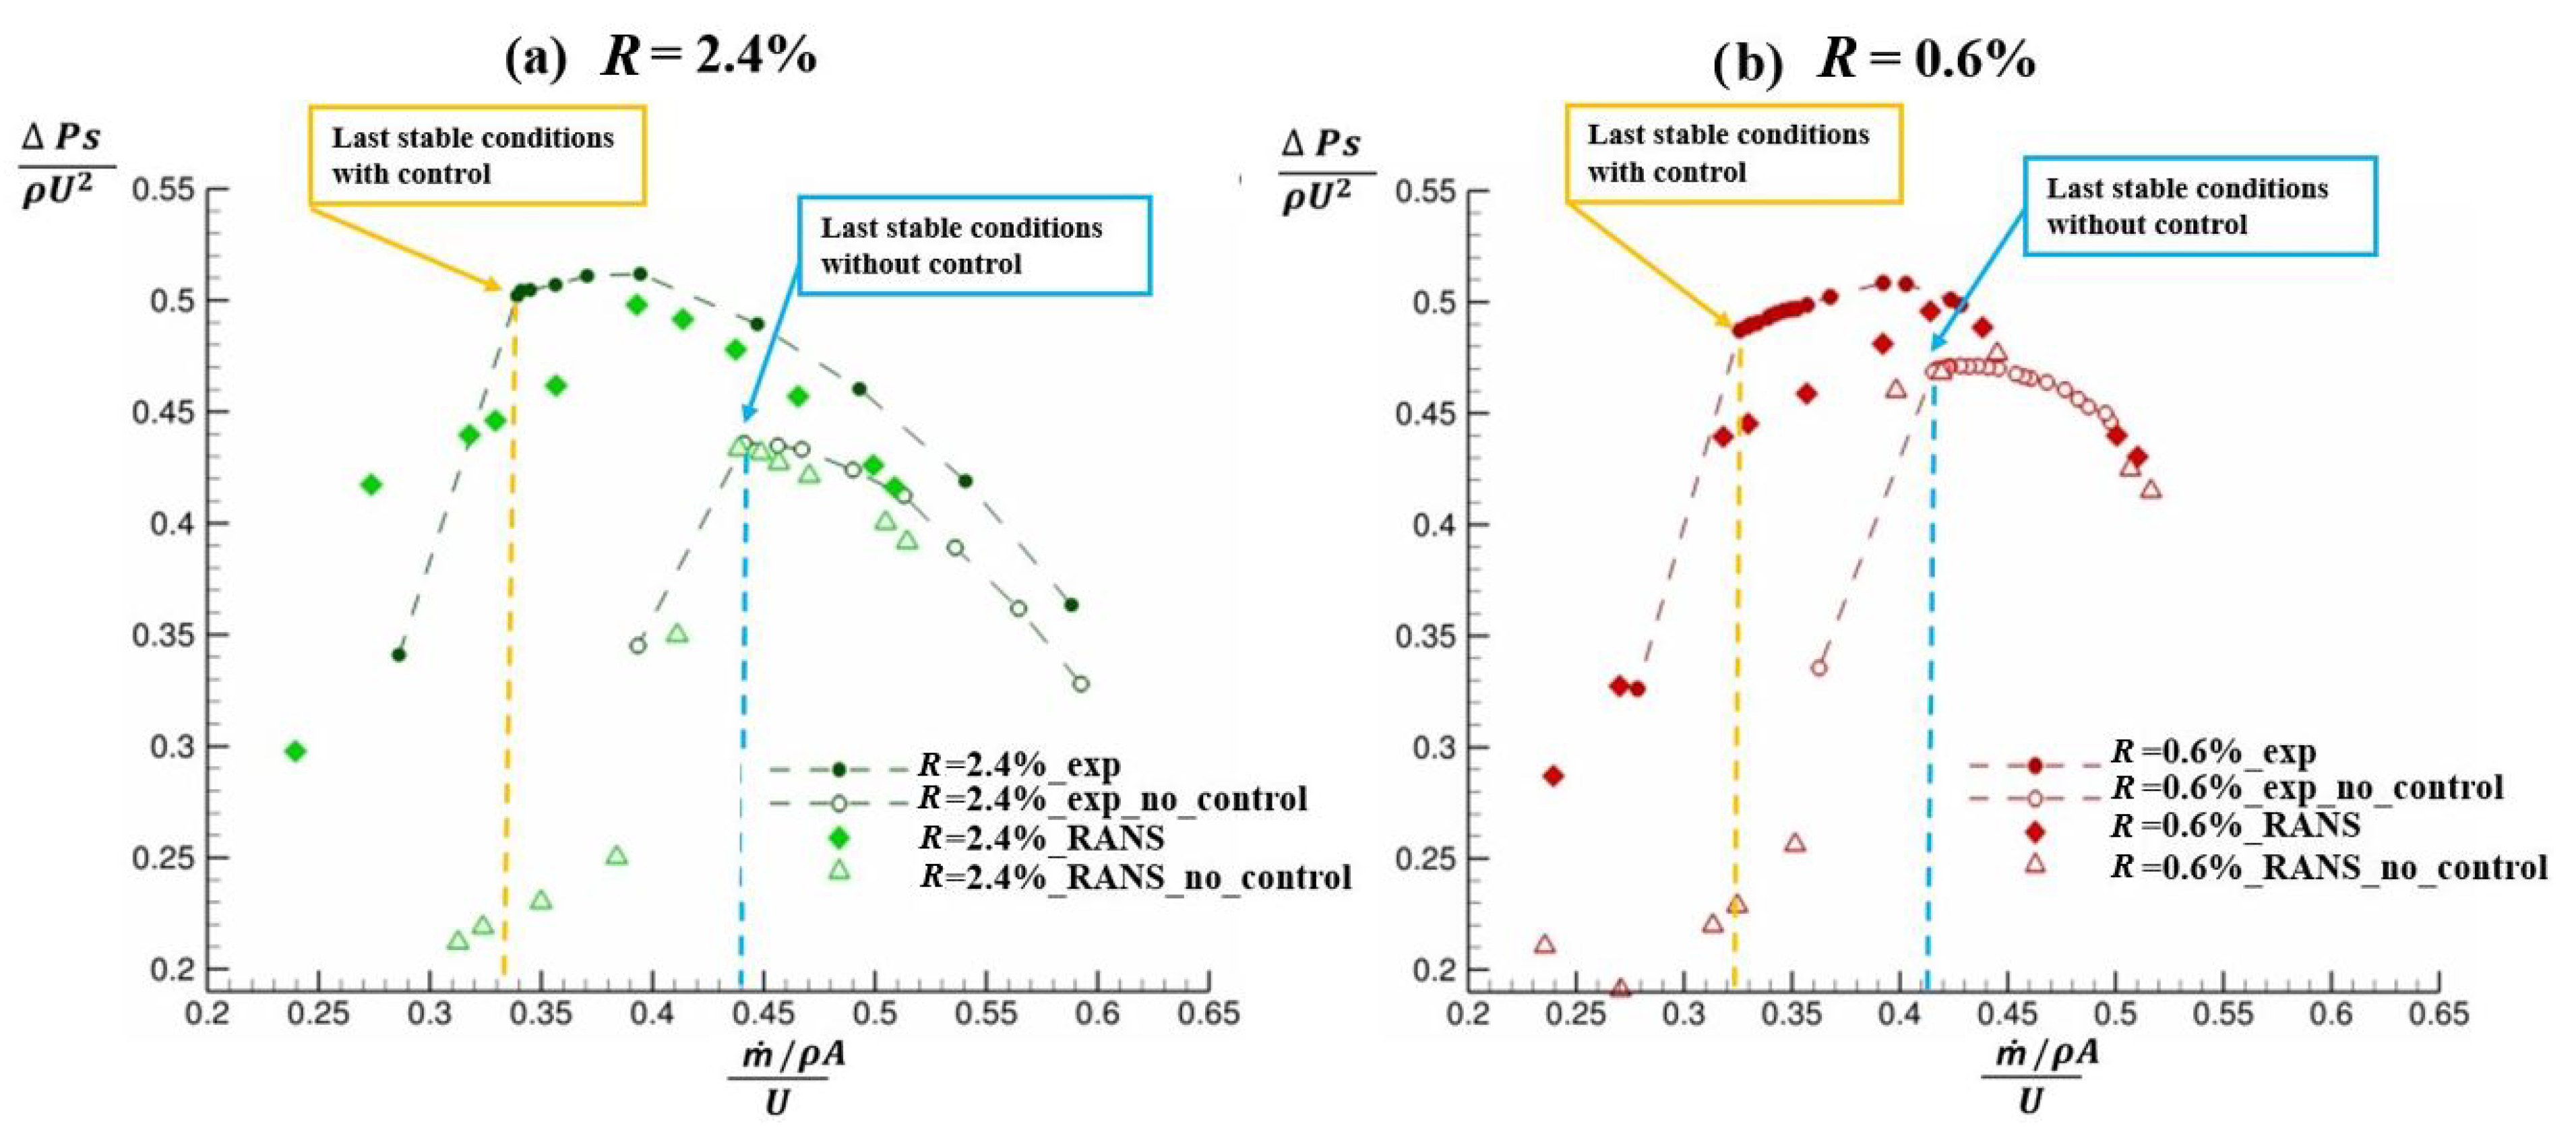
3.1.1. Specific Operating Conditions for Ratio R = 0.6% and R = 2.4%

The design compressor flow coefficient is 0.53. The critical flow rate for which the compressor encounters stall is 0.41 and 0.44 at R = 0.6% and R = 2.4%, respectively (Figure 5). A range of mass flow coefficients from 0.25 to 0.53 is investigated. Among the conditions considered, several operating points are identified as follows: (i) nominal conditions ( ϕ 1 = 0.53 ); (ii) last stable conditions before stall: the last experimental point (S) before a clear break in the slope of the performance curve (at ϕ S 2 and ϕ S 2 ); and (iii) post-stall conditions at a mass flow rate lower than ϕ S .

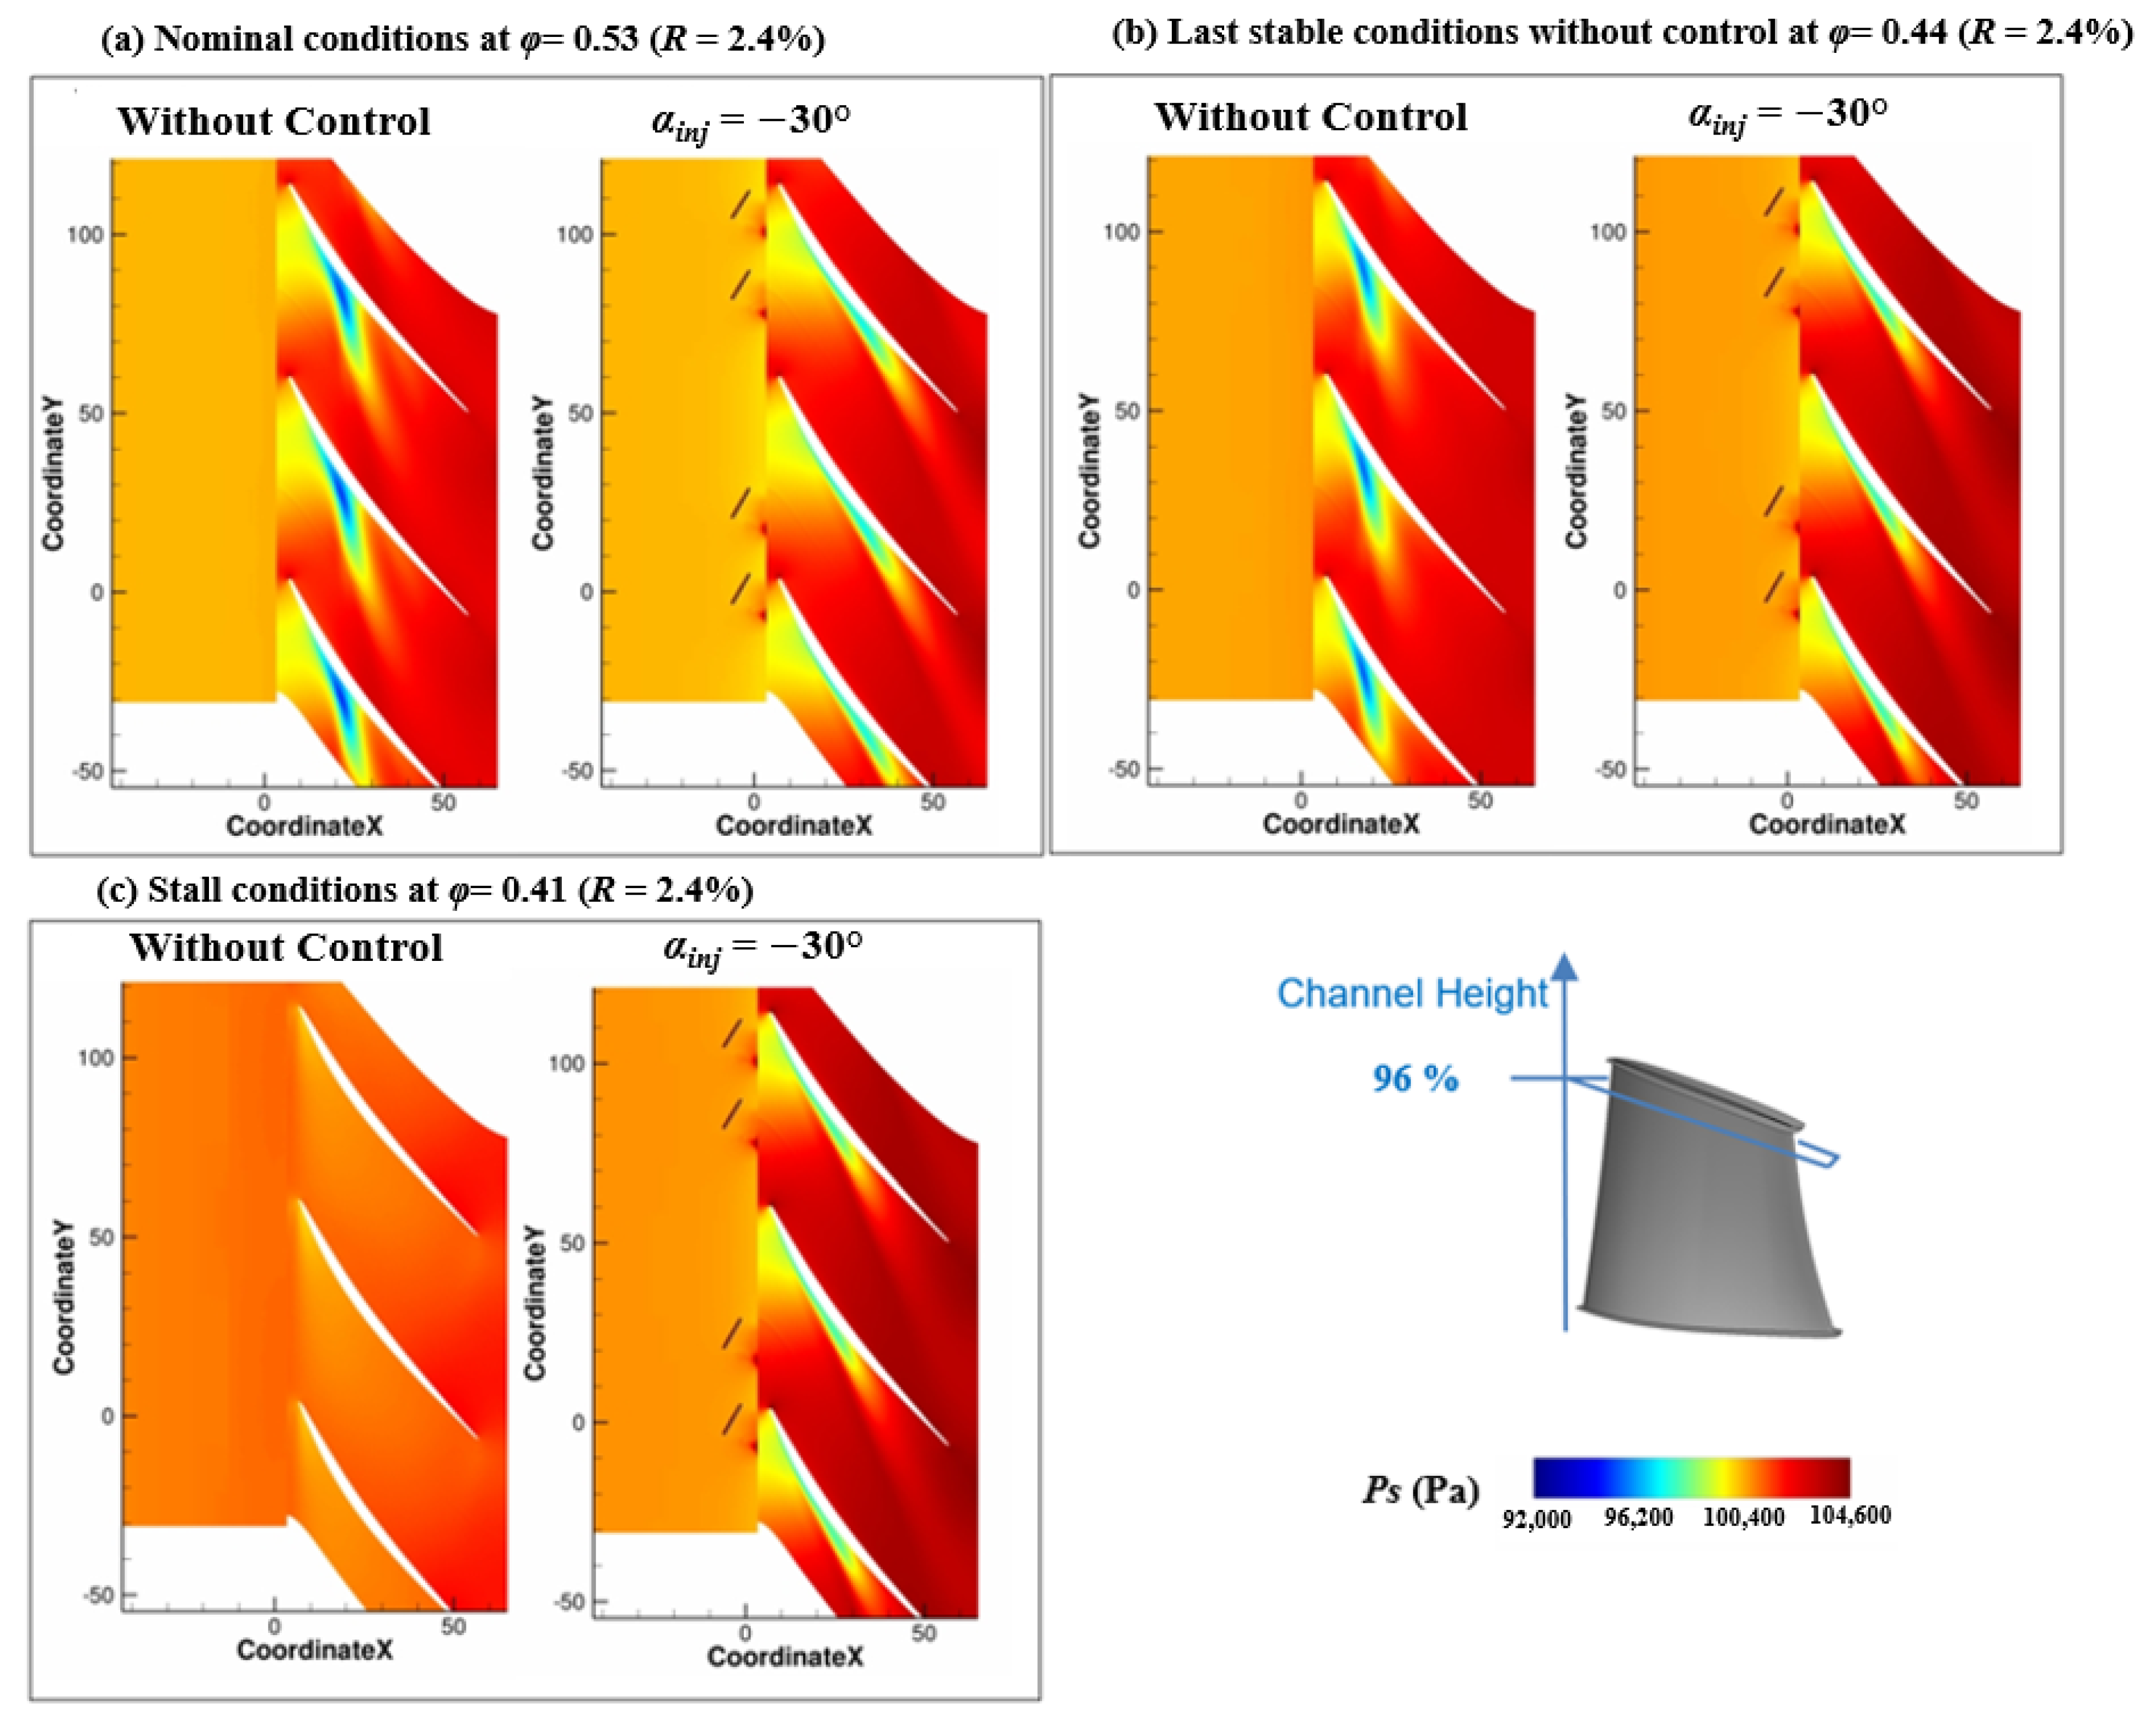
3.1.2. Results from Nominal to Last Stable Conditions at Ratio R = 0.6% and R = 2.4%

The performance chart is provided with the RANS numerical results for the two tip gap sizes (R = 0.6% and R = 2.4%) and with the experimental data (Figure 5). The 2 π /10 simulations provide excellent results when they are compared with the experimental data at R = 0.6%. In particular, it gives discrepancies less than 1% to the last stable conditions for R = 0.6%, even if the numerical results slightly underestimate Ψ = Δ P s ρ U 2 from ϕ = 0.53 to ϕ = 0.45. Similarly, for R = 2.4%, the numerical results give acceptable performance data at this larger tip clearance. Indeed, from ϕ = 0.53 to ϕ = 0.45, RANS 2 π /10 simulations produce discrepancies less than 1%. The largest deviation from the experimental data is related to the conditions close to stall. For R = 0.6%, the experimental critical mass flow rate is ϕ S 2 = 0.41, whereas the numerical simulations predict the slope discontinuity characteristics at ϕ S = 0.39. Moreover, the numerical results slightly underestimate Ψ compared to the experimental data at the top of the curve, but it captures well the same trend of performance just before stall. In the same way, for R = 2.4%, the RANS results seem to define a last stable point at a lower mass flow rate but close to ϕ S 2 = 0.44 . The compressor pressure rise just before stall is slightly over-evaluated.

3.2. Performance of Flow Control at Different Tip Gap Sizes

The impact of the active flow control is investigated in continuous blowing at 3200 RPM with 40 injectors activated at R = 0.6% and 2.4%, with the injection angle set to α i n j = −30 . The absolute injection angle was chosen as a reference for R = 0.6%, as this corresponds to the optimal performance of the compressor in terms of stall margin improvement according to [9].
The experimental and numerical compressor performance maps are presented in Figure 6. The blowing flow rate is set in the simulation to Q i n j = 2.0% to correspond with the experimental results. The injected mass flow rate, Q i n j , is defined as the percentage of the compressor mass flow rate at the last operating point without control for the nominal geometry, R = 0.6%. If the last operating point without control for R = 2.4% is chosen, a slight discrepancy of 0.025% is observed, which is why, to compare each case, R = 0.6% is taken as the reference. Moreover, according to [16], the injected mass flow rate in each pair of injector valves was observed as constant with a slight variation of 1%, regardless of the pair considered.
As already experimentally observed in [9,16], for R = 0.6%, the control system proves its capacity to push the stability limit to lower flow rates ( ϕ S is decreased from 0.41 to 0.32) and improves the static pressure rise in the compressor. At the largest gap size, R = 2.4%, the effect of blowing is even more efficient as the stall limit, with control being ϕ S = 0.335 , which is very close to the one observed for the narrow gap size. Moreover, compared with the baseline characteristic curves, the controlled cases present an increase in the static pressure ratio, with the slope of the curves becoming positive, especially for R = 2.4%.
Concerning the CFD predictions, the static pressure drop is also delayed due to the lower mass flow rates compared to cases with no control for both tip clearances. The 2 π /10 simulations provide a similar controlled performance trend, but they underestimate the pressure coefficient, Ψ , when the experimental data curves flatten toward the top from ϕ = 0.4 to ϕ S = 0.335 for R = 2.4% and from ϕ = 0.41 to ϕ S = 0.32 for R = 0.6%. This means that the 2 π /10 simulations are sufficient to predict the change in slope when stall occurs with blowing control but lack accuracy for the sudden static pressure drop captured in the experiments. The unsteady simulations of the compressor with a 360 configuration should capture the effect of blowing with further accuracy when the mass flow rate is close to stall.
To illustrate the effect of blowing on the flow near the casing, the slices of static pressure at 96% of the rotor blade height for the specific operating conditions are plotted (Figure 7). Some variation in the intensity of static pressure between the two configurations with and without control can be observed. For the configuration without control, a characteristic low relative pressure region at the leading edge can be observed (Figure 7a). This specific static pressure drop region is associated with tip leakage vortical flow. At the last stable point without control, Figure 7b highlights the modification of incidence of the tip leakage vortex with the nominal case as it moves toward the leading edge. At stall conditions (Figure 7c), there is a drop in static pressure variation shown in the performance map, and the tip leakage vortex is no longer visible longer as the flow is detached. When blowing is activated, at each operating condition (Figure 7a–c), this lower static pressure region seems to be confined along the suction side of the rotor, preventing compressor stall at ϕ = 0.44. This suggests that CFD is able to capture the main effect of blowing on leakage flow and its effect on stall delay.
To characterize the effect of the control system on the compressor performance, two parameters are introduced: the power balance (Equation (1)) [9] and SMI (Equation (4)) presented by [17]. The mass averaged power balance is defined as the additional total power provided to the flow by the compressor due to the control. The total pressure at the inlet includes the jet’s dynamic pressure. This can be simply defined by the net benefit (energy gain in terms of pressure rise in the compressor stage - energy cost due to the blowing system) of the control system.
P B ¯ = ( Q S , B + Q inj ) Δ p tt , C , int ρ C ( Q S , B ) Δ p tt , B ρ B P × 100
where P, Q, and Δ p t t are the compressor nominal power ( P = 23,000 W), the mass flow rate, and the total-to-total pressure rise, respectively. Within Equation (1), the subscripts refer to B for the baseline case without control, C for the controlled case, S for the last stable operating point with the lowest flow rate before stall, inj is the injection for the global injected mass flow rate, and int is the interpolation for the controlled total-to-total pressure.
With similar nomenclature, SMI is determined by the ratio of the surge margin with control, S M C , and without control, S M B (Figure 8a):
S M B = ( ( Δ p tt , B Q S , B ) ( Q nom p nom ) 1 ) × 100
S M C = ( ( Δ p tt , C Q S , C ) ( Q nom p nom ) 1 ) × 100
S M I = S M C S M B S M B × 100
Contrary to [9], the inlet total pressure, in the controlled case, contains the energy added by the jets. Figure 8b shows an SMI vs. power balance comparison between the two tip clearances at α i n j = 30 for configurations with the control at 20 injectors and 40 injectors. Different Q i n j are tested with a range from Q i n j = 0.5% to Q i n j = 2.5%. The interesting configurations are the ones that achieve significant SMI and positive power balance. Therefore, the points at the top and/or the right of the map are targeted. It appears that the configurations with 40 injectors offer the best results for each tip clearance size compared to 20 injectors. Consequently, it allows an acceptable angular coverage around the circumference of the compressor. The cases at Q i n j = 1% and 1.5% offer interesting applicative configurations, as they can obtain a satisfied SMI and a positive power balance, reaching 5.8% of the compressor nominal power. The cases at Q i n j = 2.5% correspond to the maximum energetic cost, as this represents the maximum number of injectors with the maximum flow rate per injector. Additionally, at R = 2.4%, the SMI provides excellent results compared with R = 0.6%: the SMI and power balance are up to nearly 200% and 6%, respectively. Nevertheless, it has to be kept in mind that the SMI is calculated by taking the last stable point from the baseline case without control, as shown in Figure 6: the baseline at R = 2.4% is lower than the one at R = 0.6%, which is due to the higher losses that happen between the carter and the rotor blade with a lower height.
Finally, it is shown that the active control with α i n j = 30 seems to be efficient as it postpones the stall limit with a stall mass flow rate decrease and a pressure ratio increase. This improves the SMI, offering a possible strategy to stabilize the tip gap region.

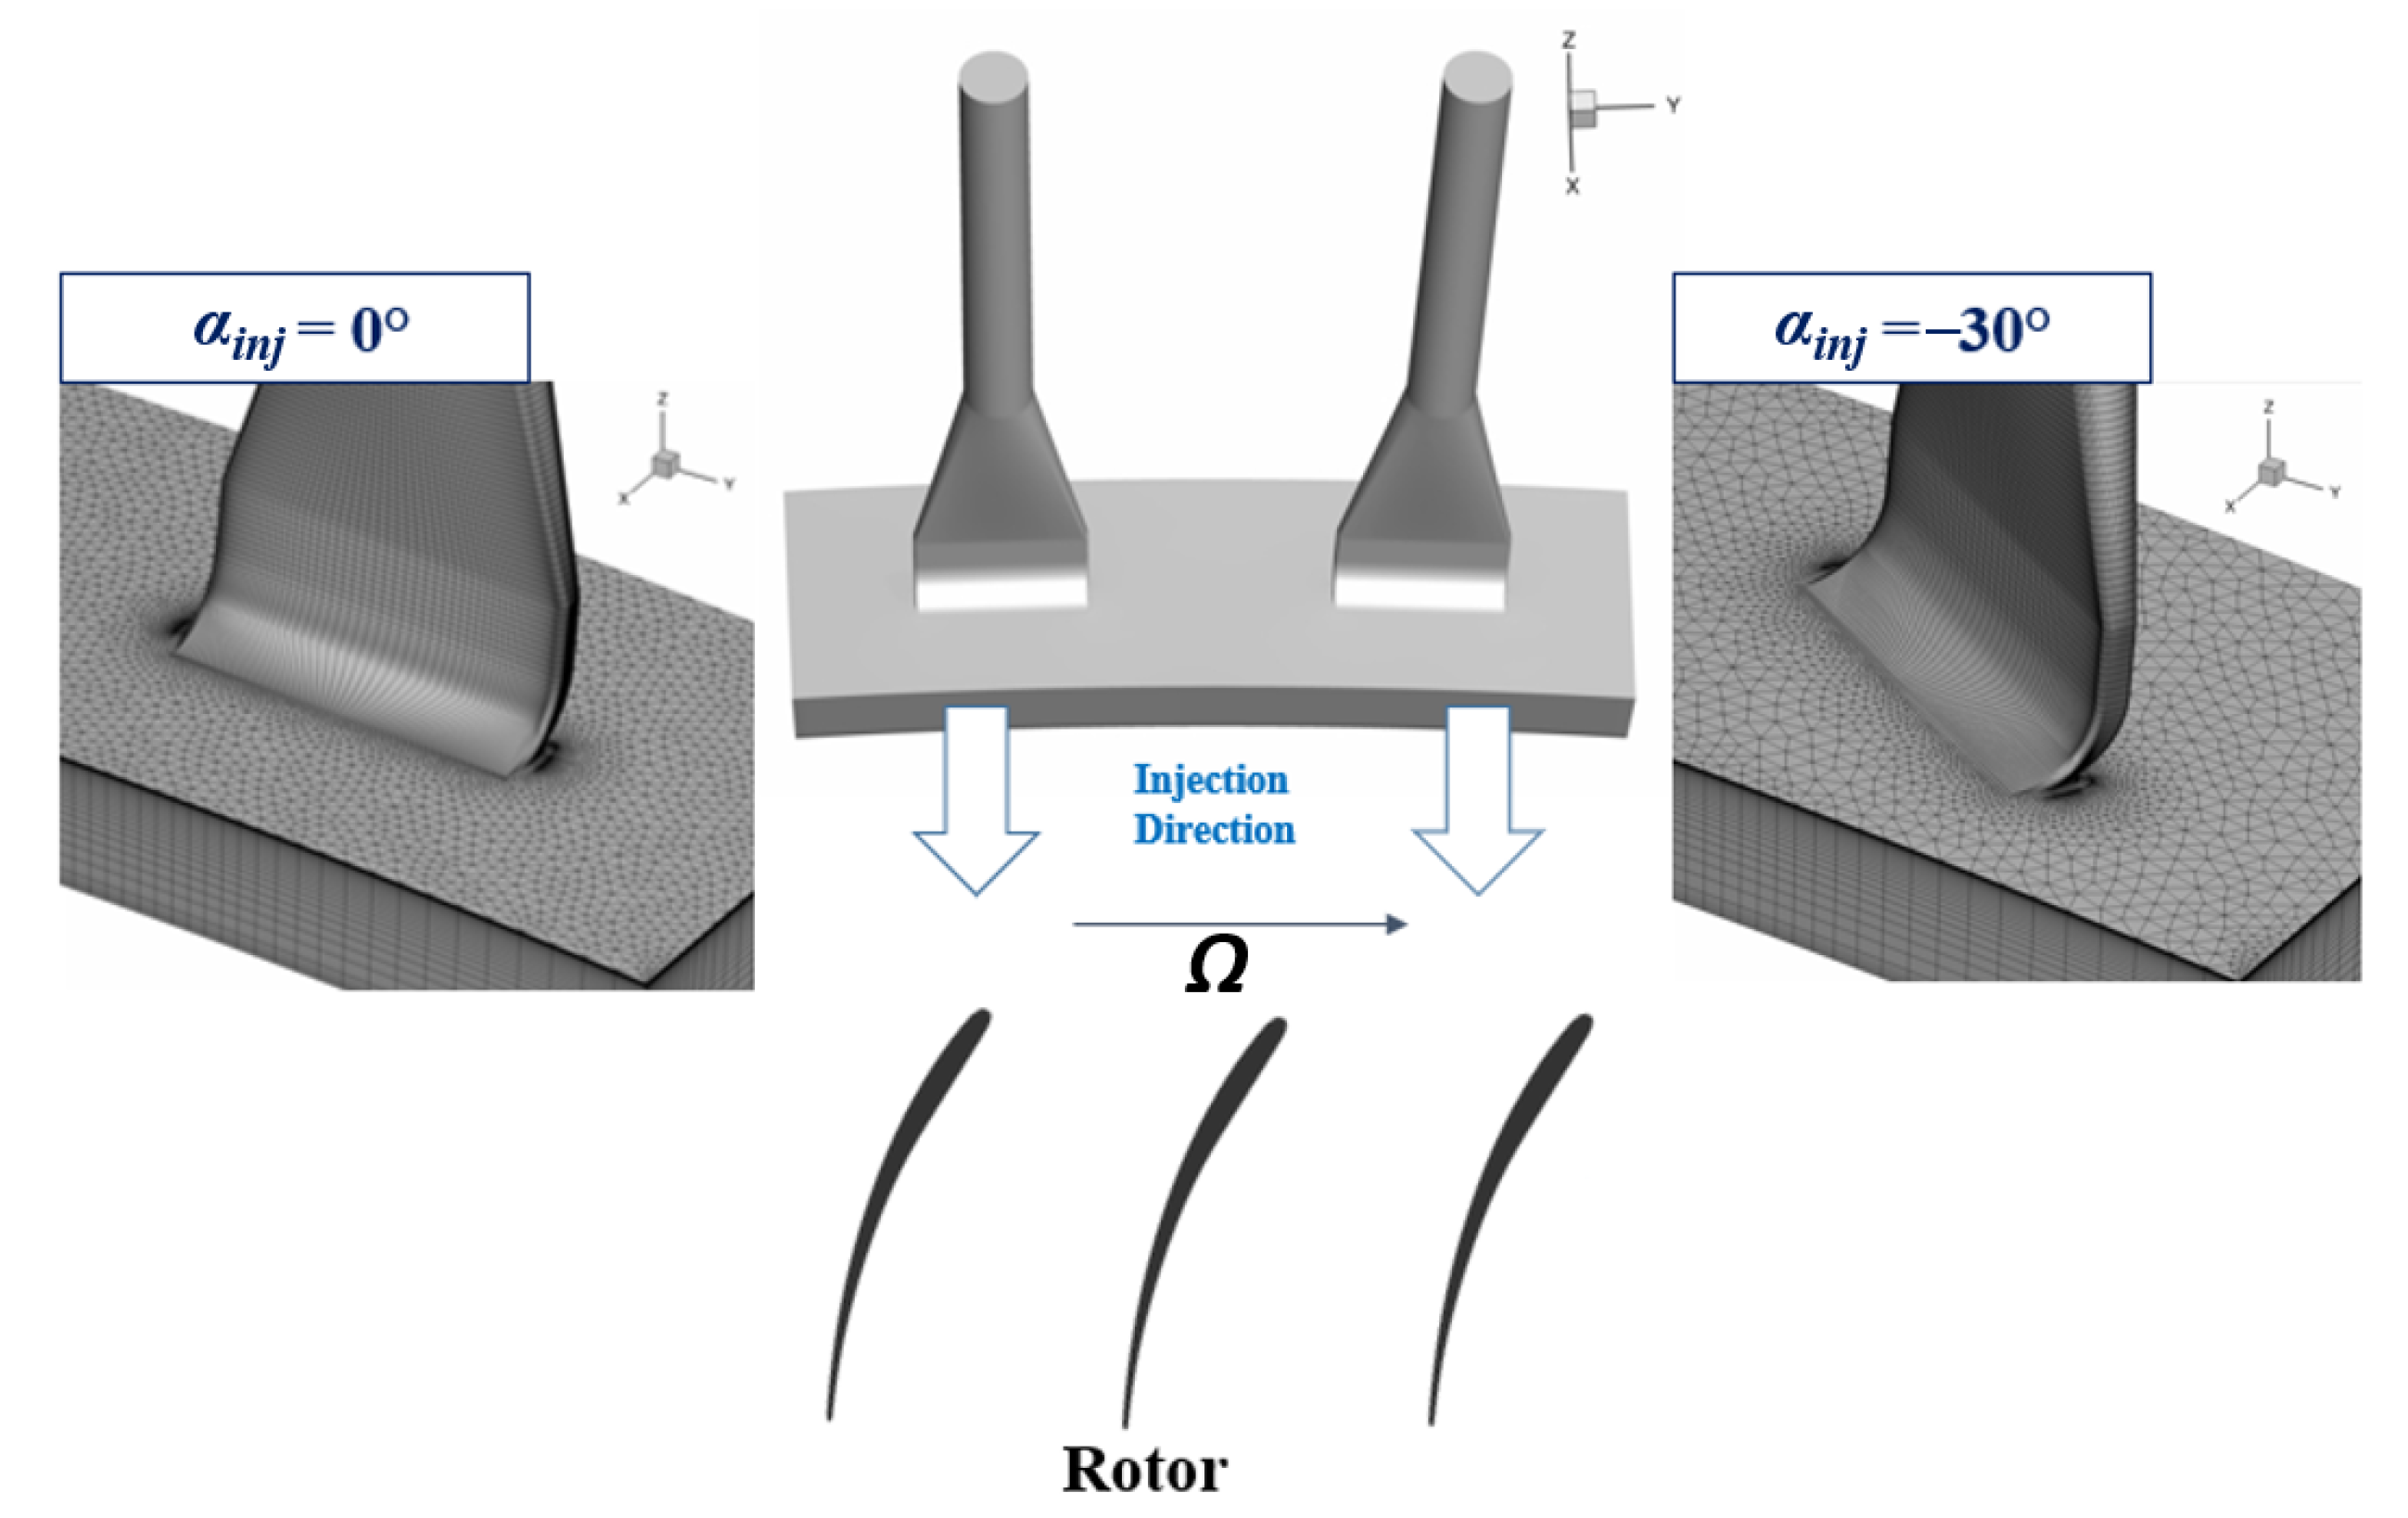
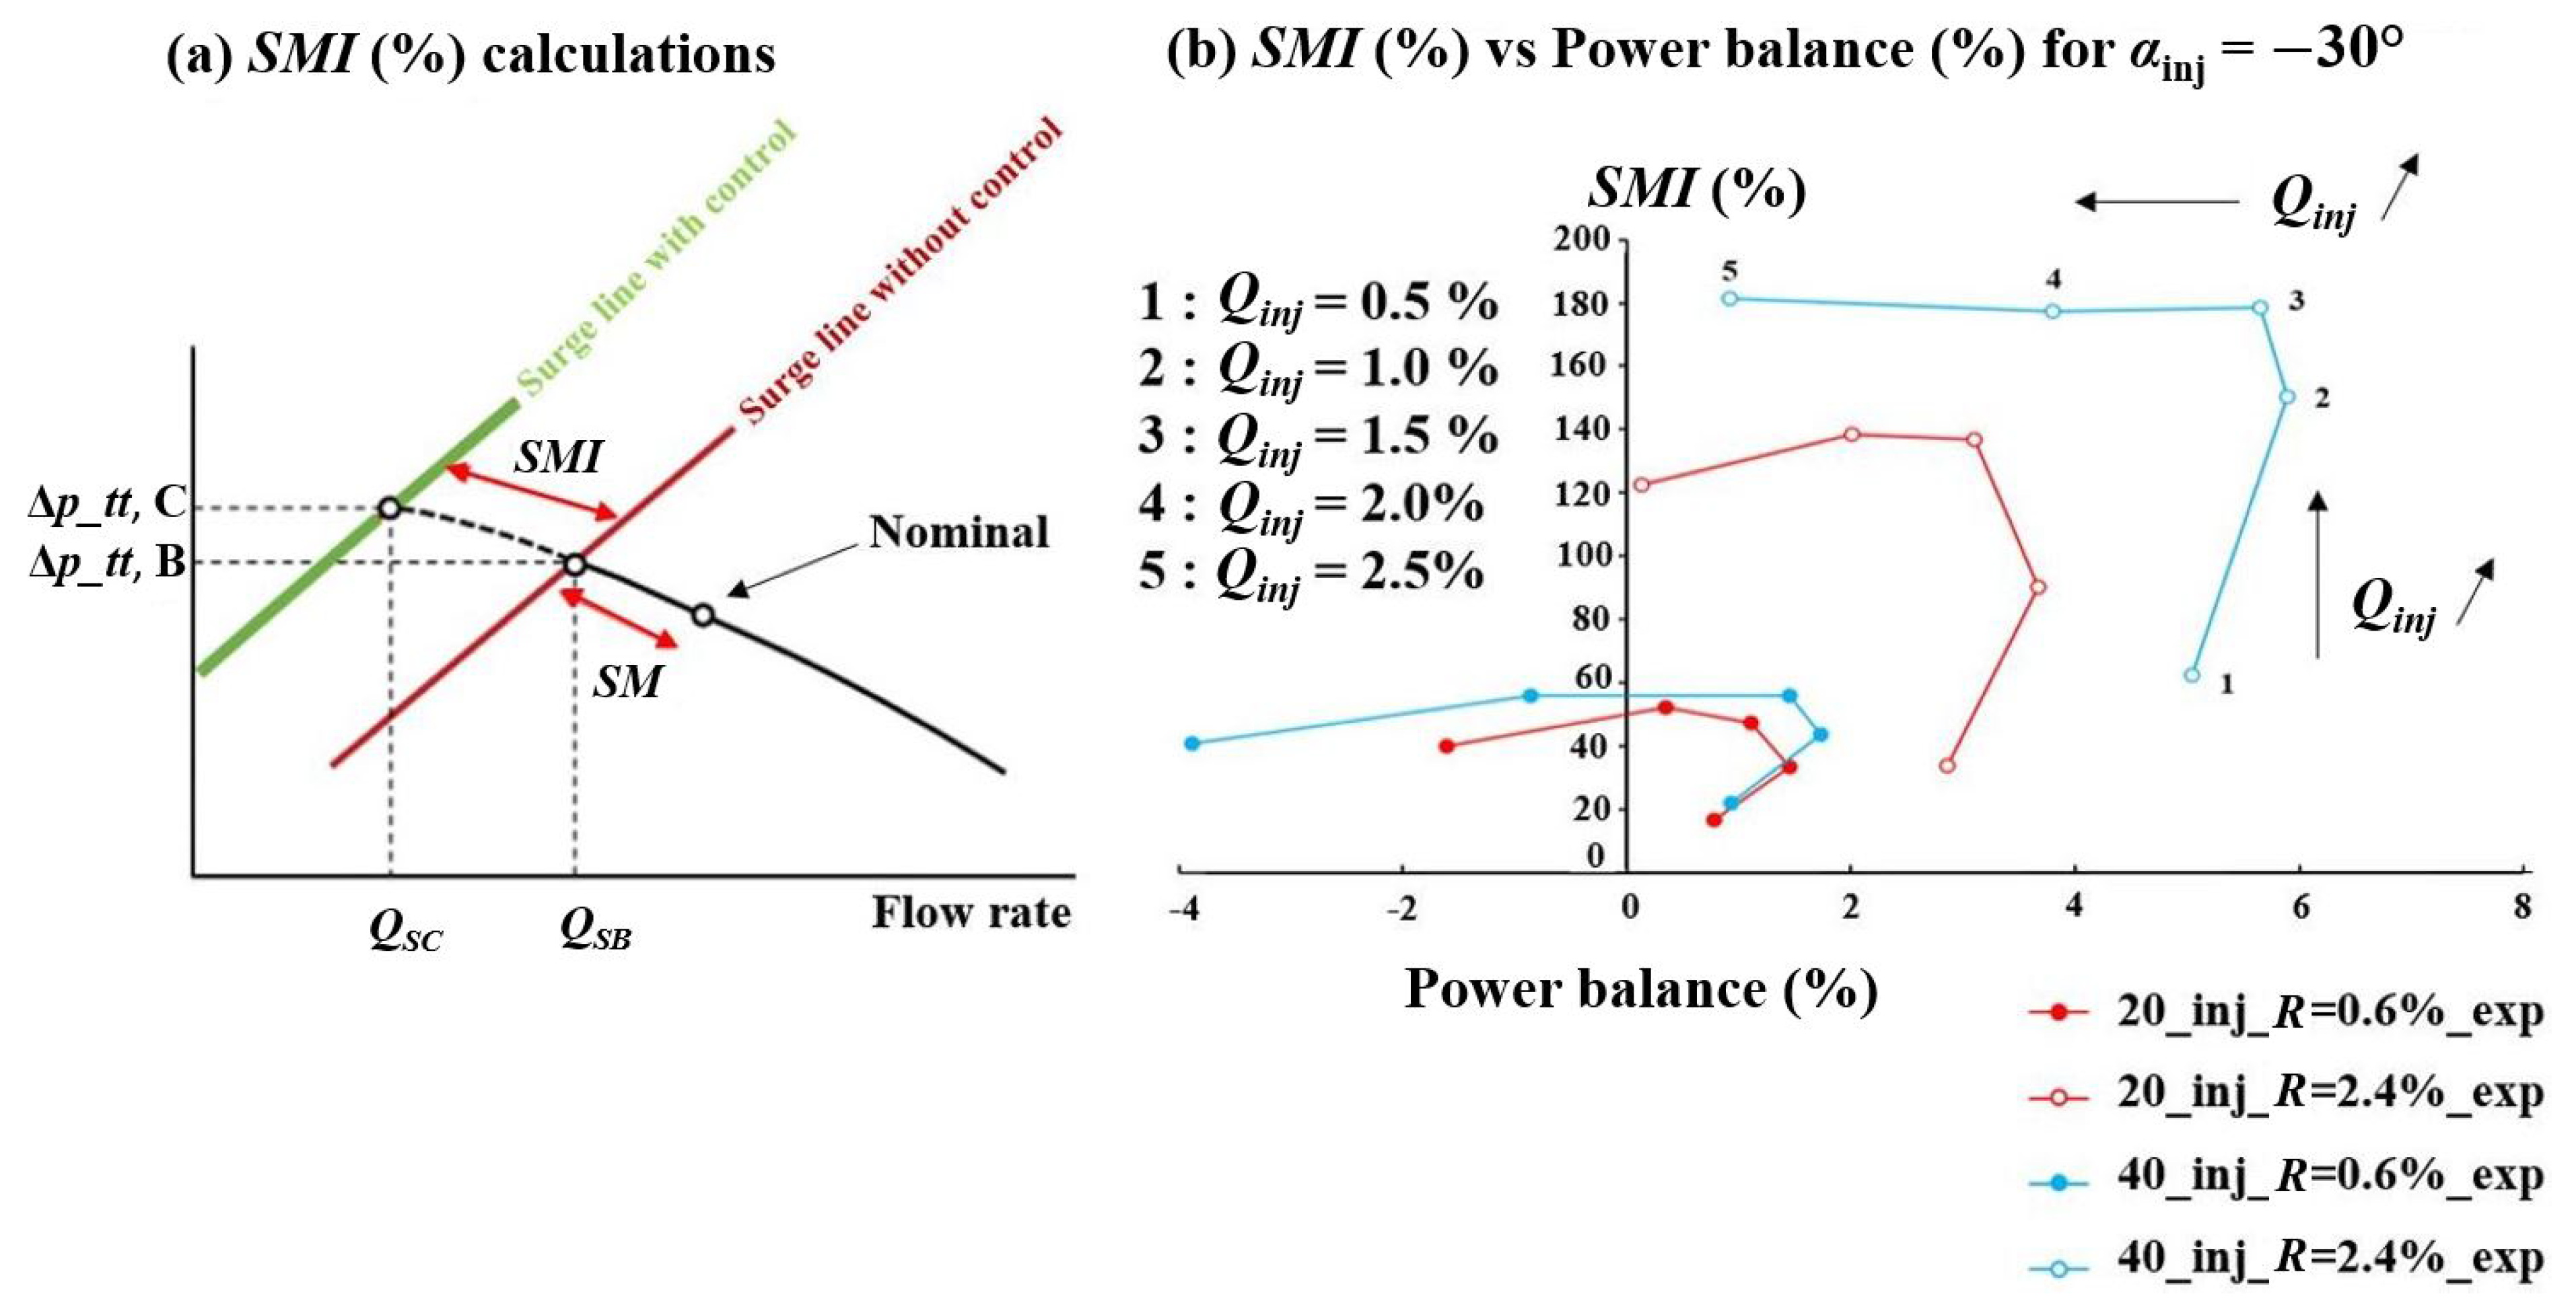
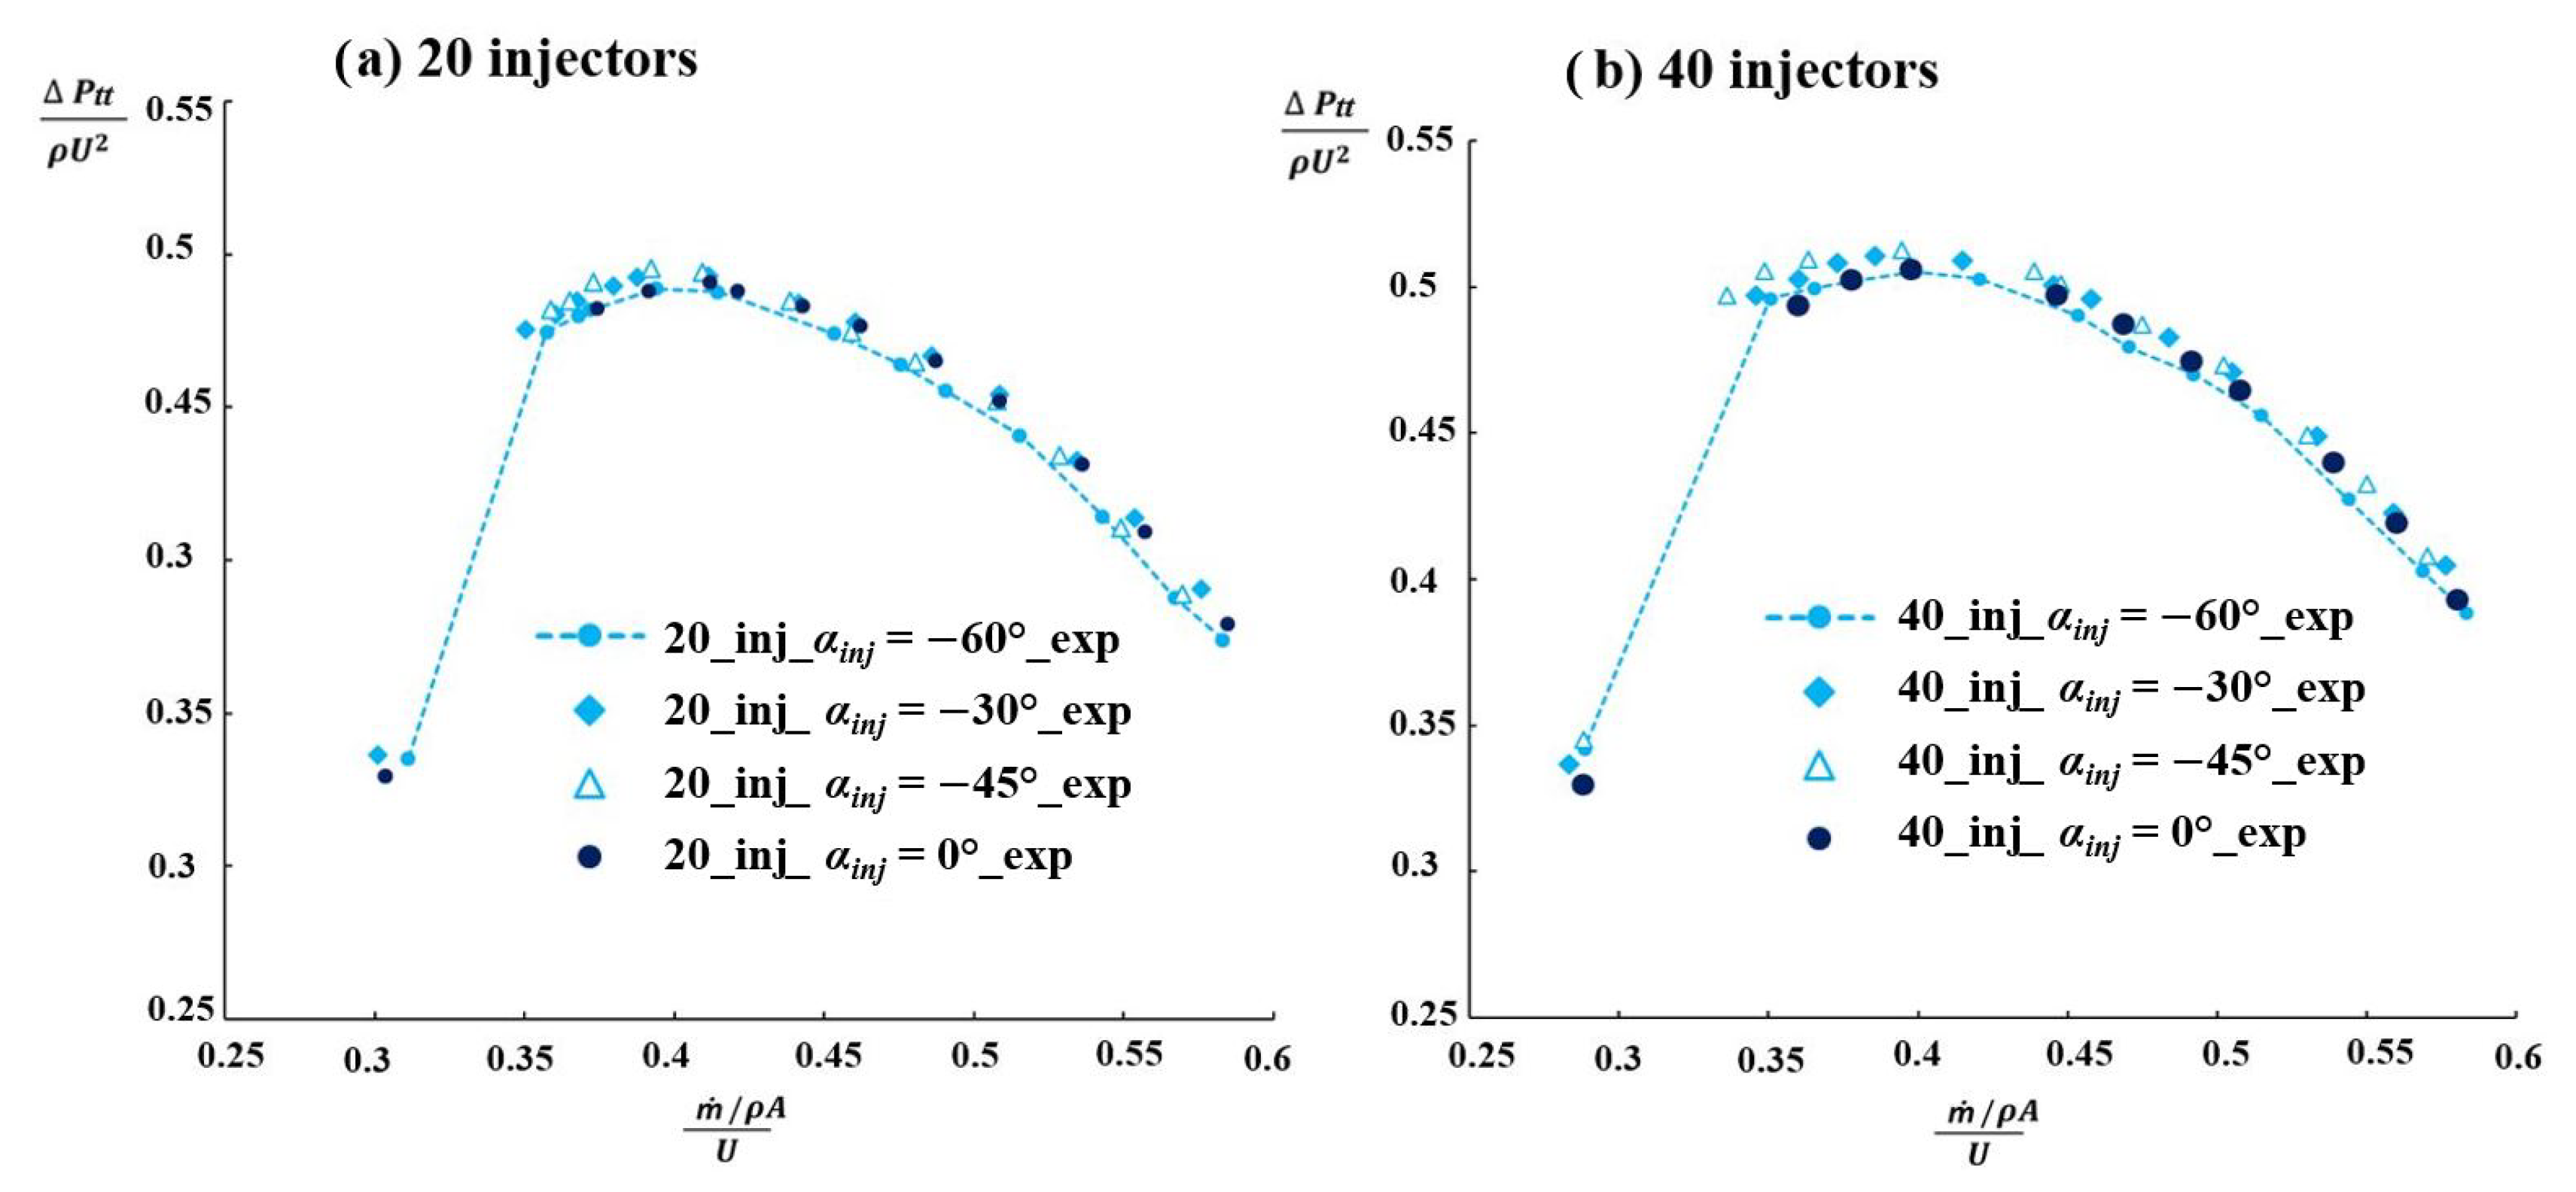
3.3. Impact of the Injection Control Parameters

Further configurations are explored experimentally with different control parameters. In this section, the active flow control for continuous blowing at 3200 RPM is tested with 40 and 20 injectors activated and various absolute flow angles: the performance curves are presented with α i n j = 0°, −30°, −45°, −60° at Q i n j = 1.5 % (Figure 9). For the configurations with 40 injectors, the best results are obtained at α i n j = −45°, and with 20 injectors, the best results are obtained at α i n j = −30°. Indeed, the effect of blowing control generates higher static pressure rise at these angles. In addition, the stall onset is delayed, especially for the 40-injector configuration.
The global performance of the other fluidic parameters is then analyzed, focusing on the configurations with 40 injectors, as this configuration produces the best results in terms of performance. In Figure 10a, the power balance vs. SMI is investigated for continuous blowing at specific angles of injection. As expected, blowing control configurations allow for providing the best SMI with a high positive power balance with α i n j = −45°, especially for the injected mass flow rates at Q i n j = 1% and 1.5%. Consequently, it seems that for a larger tip gap size, the best configuration for active control is obtained with 40 injectors at α i n j = −45°. In Figure 10b, the SMI is reported as a function of the relative blowing angle, β . The results are extracted for different values of V j e t * defined by the jet velocity scaled by the rotor tip blade velocity (U). The SMI clearly presents maxima for a relative blowing angle around 60° (Figure 10b). In a previous study [9], at R = 0.6%, this value for the relative blowing angle allowed for obtaining the best SMI. Moreover, this value approximately matched with the inlet blade angle at the tip for the CME2 compressor.

4. Conclusions

The present study reported the effect of active flow control on narrow and large tip gap sizes. The experimental campaign was conducted on a single-stage axial compressor test bench equipped with fluidic actuators around the circumference. The measurements were performed from design conditions to operating points close to stall for configurations with and without control.
Compared with previous studies carried out for a narrow tip gap size on the CME2 test bench (R = 0.6%), the present work highlighted the benefit of active flow control on a large tip gap size (R = 2.4%). The impact of blowing allowed a longer delay in stall onset (SMI of the order of 200% and power balance up to nearly 6%), as well as a pressure increase that allowed a net positive power balance of the system. This study also demonstrated that the optimal configurations for blowing were based on the specific injection angle ( α i n j = 45°) and full injector activation (40 injectors) around the compressor circumference. For the larger tip gap size (R = 2.4%), it seems that the air injection limits better the losses induced by the tip gap flow, generating a higher SMI than for narrow tip clearance (R = 0.6%). Further experimental tests should enhance the analysis of the development of stall with active control, thanks to the unsteady measurements, and attest the efficiency of tip blowing leading to the stabilization of the tip gap flow.
In parallel, RANS 2 π /10 simulations were achieved for the same configurations. The RANS 2 π /10 simulations rather accurately predicted the performance map without control (discrepancies less than 1% from nominal to last stable conditions) and were able to qualitatively catch the performance improvement induced by the control system. The analysis of the static pressure maps close to the casing showed that blowing confined the tip leakage vortex near the blade wall. Hence, this contributes to stall delay.

Author Contributions

Conceptualization, C.R., A.D. and J.M.; methodology, C.R., A.D. and J.M.; software, C.R. and J.M.; validation, C.R., A.D., J.M. and G.T.; formal analysis, C.R.; investigation, C.R.; resources, A.D., J.M. and G.T.; data curation, C.R., A.D., J.M. and G.T.; writing—original draft preparation, C.R.; writing—review and editing, C.R., J.M., A.D. and G.T.; visualization, C.R.; supervision, J.M., A.D. and G.T.; project administration, J.M., A.D. and G.T.; funding acquisition, J.M., A.D. and G.T. All authors have read and agreed to the published version of this manuscript.

Funding

This research was funded by the French Defence Innovation Agency (AID) and the Clean Sky 2 Joint Undertaking under the European Union’s Horizon 2020 research and innovation program (grant number: 886352).

Institutional Review Board Statement

Not applicable.

Informed Consent Statement

Not applicable.

Data Availability Statement

Not applicable.

Acknowledgments

This work was supported by the CIRT (Consortium Industrie-Recherche en Turbomachines). The authors wish to thank the members of the ACONIT project for providing the numerical database. The authors would like to thank the French Defence Innovation Agency (AID) for co-funding this Ph.D. All simulations were performed in the framework of the elsA agreement between SAFRAN and ONERA, who are co-owners of this software.

Conflicts of Interest

The authors declare no conflict of interest.

Abbreviations

The following abbreviations are used in this manuscript:
AAnnulus area at the rotor inlet ( A = 0.1029 m 2 )
α i n j Injection angle ( )
β Relative blowing angle ( )
ρ Density ( ρ = 1.225 kg / m 3 )
Δ P s Static pressure variation (Pa)
ϕ Flow coefficient: m ˙ / ρ A U (-)
m ˙ Mass flow rate (kg/s)
Ω Rotational velocity (rpm)
Ψ Pressure coefficient: Δ P s ρ U 2 (-)
PNominal compressor power (W)
P s , t Static, total pressure (Pa)
PBPower balance (%)
Q i n j Global injected mass flow rate (kg/s)
RANSReynolds-averaged Navier–Stokes
RRatio (tip gap size over the axial chord) (%)
SBCSingle-blade channel
SMIStall margin improvement (%)
SMStall margin (%)
T t Total temperature (K)
URotor tip velocity (m/s)
V j e t * Jet velocity scaled (-)

References

  1. Air Transport Action Group. Waypoint 2050. 2021. Available online: https://www.atag.org/ (accessed on 11 June 2023).
  2. Suder, K.L.; Hathaway, M.D.; Thorp, S.A.; Strazisar, A.J.; Bright, M.B. Compressor Stability Enhancement Using Discrete Tip Injection. J. Turbomach 2001, 123, 14. [Google Scholar] [CrossRef]
  3. Li, J.; Du, J.; Geng, S.; Li, F.; Zhang, H. Tip air injection to extend stall margin of multi-stage axial flow compressor with inlet radial distortion. Aerosp. Sci. Technol. Elsevier Masson SAS 2020, 96, 105554. [Google Scholar] [CrossRef]
  4. Marty, J.; Castillon, L.; Boniface, J.C.; Burguburu, S.; Godard, A. Numerical and Experimental Investigations of Flow Control in Axial Compressors. Aerospacelab J. 2013, 6, 1–13. [Google Scholar] [CrossRef]
  5. Neuhaus, L.; Neise, W. Active Control to Improve the Aerodynamic Performance and Reduce the Tip Clearance Noise of Axial Turbomachines. In Proceedings of the AIAA Aeroacoustics Conference, Monterey, CA, USA, 23–25 May 2005. [Google Scholar]
  6. Cumpsty, N.A. Compressor aerodynamics. Longman Sci. Tech. 1989. [Google Scholar] [CrossRef]
  7. Smith, H. The effect of tip clearance on the peak pressure rise of axial flow fans and compressors. In ASME Symposium on Stall; American Society of Mechanical Engineers: New York, NY, USA, 1958; Volume 149, pp. 149–152. [Google Scholar]
  8. Marty, J.; Castillon, L.; Joseph, P. Numerical Investigations on the Rotating Stall in an Axial Compressor and its Control by Flow Injection at Casing. ASME. J. Turbomach. 2023, 145, 051009. [Google Scholar] [CrossRef]
  9. Moubogha, J.; Margalida, G.; Joseph, P.; Roussette, O.; Dazin, A. Surge Margin Improvement by Continuous and Pulsed Tip injection. Int. J. Turbomach. Propuls. Power 2022, 7, 10. [Google Scholar] [CrossRef]
  10. Rannou, C.; Marty, G.; Dazin, A. Effect of Tip Gap Size on the Performance of an Axial Compressor Stage With and Without Active Flow Control. In Proceedings of the 15th European Turbomachinery Conference, Budapest, Hungary, 24–28 April 2023; Paper n.ETC2023-207. Available online: https://www.euroturbo.eu/publications/conference-proceedings-repository/ (accessed on 7 June 2023).
  11. Veglio, M. Etude Expérimentale et Numérique des Écoulements dans un étage de Compresseur Axial à Basse Vitesse en Régime de Fonctionnement Instable. Ph.D. Thesis, ENSAM, Paris, France, 2016. [Google Scholar]
  12. Rannou, C.; Dazin, A.; Marty, J.; Tanguy, G.; Castillon, L.; Moughoba, J. Effect of the Axial Compressor Tip Clearance Size: Performance and Transition to Rotating Stall. In Proceedings of the ASME Turbo Expo 2022, Turbomachinery Technical Conference and Exposition (GT2022-80914), Rotterdam, The Netherlands, 13–17 June 2022. [Google Scholar] [CrossRef]
  13. Cambier, L.; Heib, S.; Plot, S. The Onera elsA CFD software: Input from research and feedback from industry. Mech. Ind. 2013, 14, 159–174. [Google Scholar] [CrossRef]
  14. Baretter, A.; Godard, B.; Joseph, P.; Roussette, O.; Romano, F.; Barrier, R.; Dazin, A. Experimental and Numerical Analysis of a Compressor Stage under Flow Distortion. Int. J. Turbomach. Propuls. Power 2021, 6, 43. [Google Scholar] [CrossRef]
  15. Spalart, P.; Allmaras, S. A one-equation turbulence model for aerodynamic flow. In Proceedings of the 30th Aerospace Science Meeting & Exhibit, Reno, NV, USA, 6–9 January 1992; Volume 439, pp. 92–0439. [Google Scholar] [CrossRef]
  16. Margalida, G.; Joseph, P.; Roussette, O.; Dazin, A. Active flow control in an axial compressor for stability improvement: On the effect of flow control on stall inception. Exp. Fluids 2021, 62. [Google Scholar] [CrossRef]
  17. Weigl, H.J.; Paduano, J.D.; Fréchette, L.G.; Epstein, A.H.; Greitzer, E.M.; Bright, M.M.; Strazisar, A.J. Active Stabilization of Rotating Stall and Surge in a Transonic Single Stage Axial Compressor. In Proceedings of the ASME 1997 International Gas Turbine and Aeroengine Congress and Exhibition, Orlando, FL, USA, 2–5 June 1997; Volume 4. [Google Scholar] [CrossRef]
Figure 1. CME2 air injection system.
Ijtpp 08 00030 g001
Figure 2. Definition of the absolute angle of injection and CAD view of adjustable yaw blowing angle of the injectors.
Ijtpp 08 00030 g002
Figure 3. Preliminary and 2 π /10 configurations.
Ijtpp 08 00030 g003
Figure 4. Different mesh configurations at α i n j = 0 , −30 .
Ijtpp 08 00030 g004
Figure 5. CME2 performance map at two tip gap sizes (R = 2.4% and R = 0.6%) for configuration with injectors at α i n j = 0 without blowing for experimental tests and numerical results.
Ijtpp 08 00030 g005
Figure 6. CME2 performance map at (a) R = 2.4%, (b) R = 0.6%, with α i n j = −30 ( Q i n j = 2.0 % ).
Ijtpp 08 00030 g006
Figure 7. Static pressure field for R = 2.4% at nominal, last stable, and stall conditions for configurations: without and with control ( α i n j = −30 and Q i n j = 2.0 % ).
Ijtpp 08 00030 g007
Figure 8. (a) SMI calculations. (b) SMI (%) and power balance (%) of the control system with experimental data at R = 0.6% and 2.4% for α i n j = −30 with 20 and 40 injectors.
Ijtpp 08 00030 g008
Figure 9. Experimental CME2 performance map for R = 2.4% at 0 , −30 , −45 , −60 : with (a) 20 injectors, (b) 40 injectors.
Ijtpp 08 00030 g009
Figure 10. (a) SMI and power balance. (b) SMI (%) and β ( ) at R = 2.4% for α i n j = 0 , −30 , −45 , −60 with 40 injectors.
Ijtpp 08 00030 g010
Table 1. Boundary Conditions.
Upstream- Subsonic inlet condition with prescribed total pressure
- Axial flow direction, P t = 101,325 Pa, T t = 288.15 K
Blades, casing, hub- Adiabatic wall condition
- Fixed wall condition for casing and a part of the hub
- Mobile wall condition for hub and blades
Downstream- Subsonic outlet condition with radial equilibrium using a valve law on static pressure
Inlet of the injector- Subsonic inlet condition with prescribed mass flow rate, Q i n j
- Flow direction normal to boundary, T t = 288 K
Injector walls- Adiabatic wall conditions
Disclaimer/Publisher’s Note: The statements, opinions and data contained in all publications are solely those of the individual author(s) and contributor(s) and not of MDPI and/or the editor(s). MDPI and/or the editor(s) disclaim responsibility for any injury to people or property resulting from any ideas, methods, instructions or products referred to in the content.

