Abstract
Visually impaired people (VIP) feel a lack of aid for their facilitated urban mobility, mainly due to obstacles encountered on their routes. This paper describes the design of AudioMaps, a prototype of cartographic technology for mobile devices. AudioMaps was designed to register the descriptions and locations of points of interest. When a point is registered, the prototype inserts a georeferenced landmark on the screen (based on Google Maps). Then, if the AudioMaps position is next to (15 or 5 m from) the previously registered point, it sends by audio the missing distance and a description. For a preview, a test area located in Monte Carmelo, Brazil, was selected, and the light poles, street corners (name of streets forming the intersections), and crosswalks were registered in AudioMaps. A tactile model, produced manually, was used to form the first image of four sighted people and four VIP, who completed a navigation task in the tested area. The results indicate that both the tactile model and the audiovisual prototype can be used by both groups of participants. Above all, the prototype proved to be a viable and promising option for decision-making and spatial orientation in urban environments. New ways of presenting data to VIP or sighted people are described.
1. Introduction
Humans have a need to connect with the environment in which they live, through everyday activities. Routinely, people engage in urban mobility in their cities, each with its own intrinsic characteristics. This process is called navigation [1]. The perception of the outside world is driven by information captured by sensory systems, as reported by Gibson [2]: auditory, haptic, olfactory, gustatory, and visual. Cartwright et al. [3] relied on the idea that information acquisition is an active process. Since people rely on sensory organs to form their inner knowledge of the environment (mental map), language is an essential factor for the apprehension of body space and, subsequently, space-environment. For Iida [4], perception occurs because of sensory stimulus processing, giving it meaning. This is how communication, enunciation, and understanding occur, since words are loaded with meaning [5,6,7].
The purpose of geographic information is to facilitate navigation. Each type of map has its own specifications and should produce appropriate information for each type of population, whether for social, economic, or physical (human or material) purposes [8]. For the case where the “readers” are visually impaired people (VIP), they can make use of the other senses of the body to interpret their surroundings, and this is called sensory compensation [9]. Therefore, maps can be handled by these users and become an object of inclusion, especially when their access is possible [10]. However, VIP have difficulty identifying objects, obstacles, and gaps; determining directions; following itineraries; and identifying signs [11]. The problems for VIP in urban mobility can be highlighted as access to and egress from establishments, obstructions of sidewalks, surfaces without accessibility features, events and crowds [12]. The difficulties faced by these people during locomotion lead them to seek products offered by the assistive technology industry. The concept of assistive technology is quite broad when considering care products. In the meantime, it can include methodologies, strategies, practices, and services that promote functionality related to the activities and participation of people with reduced mobility [13].
According to Morita [14], the dynamics of a system with digital resources and information in real time transform information from a map into visual or oral representation styles. In recent years, technologies and guidance systems for VIP have been developed. For sensory substitution systems in cartography, many efforts have been made to help VIP access information such as text, graphics, images, and sounds [15]. Some of the cartographic products used by VIP are accessible desktop-based maps, printable tactile maps, virtual acoustic maps, virtual tactile maps, enhanced paper-based tactile maps, braille tactile maps, and on-visual mobile maps (GPS-based maps, portable tactile screen maps, nonvisual mobile maps) [15,16,17,18,19,20,21,22,23,24,25,26,27,28,29]. Many computing devices for VIP were designed with the use of Global Positioning System (GPS) and Geographic Information System (GIS) [21,22]. These technological advances, however, have not been accompanied by an adequate investigation of human–computer interactions (e.g., designing navigational aids for people who form different cognitive maps for navigation) [23,30].
Currently, the components used in navigation are maps that provide information about places and routes [9]. The output of existing applications for VIP are usually vibrations or voices. In some projects, audio output is combined with tactile feedback such as vibrations [27,28]. These products have been tested during navigation tasks of VIP, since numerous problems and challenges have been encountered while VIP navigate in indoor and outdoor environments [31]. To cover problems for VIP in unfamiliar spaces and buildings, the authors of [9] designated categories of descriptive objects on maps. They cited fixed, rearranged, and transient objects, providing information on navigation tips and warnings.
The greatest obstacle to reading for VIP seems to be understanding spatialized data on maps because of a lack of specific knowledge to decode the cartographic generalizations applied to represent the real world [3]. The communicability of navigation models can be tested considering that interactive environments can improve the common user’s spatial perception. Regarding spatial comprehension, VIP have the same skills as people with vision [32]. The spatial representations underlying navigation performance can be abstracted from different perceptual modalities [29,33,34,35]. Such skills can be tested through cognitive maps, and two ways of evaluating them are highlighted: knowledge of routes and knowledge of configuration of spaces. In general, these maps are evaluated verbally or using drawn sketches [33].
Geospatial data representation can be carried out through cartographic products transmitted in media such as the internet [36,37]. From Web 2.0 to today, users’ relationships with information products have become interactive [37]. The case where the user can populate a cartographic database without necessarily having a professional or scientific link with the map is called Volunteered Geographical Information (VGI) [37]. In VGI, the user is considered as a central agent with the freedom to select what to represent and to produce according to his or her own interests [3,7,37]. In this way, cartographic generalization (as described in [3]) could potentially be solved. GIS plays a significant role in the collection, treatment, and dissemination of spatial information [11].
Based on the concepts of cartographic communication and visualization, a path is observed between the cartographer’s conceptions and the users of maps. In this context, different exploratory possibilities of environments can be inserted through communication models. Given the required ease in urban mobility of VIP, in this study, an online audiovisual mobile prototype with georeferenced information was developed to contribute to VIP navigation, called AudioMaps. The prototype contains global positioning information using a cartographic base map, courtesy of Google [38]. The Google Maps cartographic base is described visually on screen. Additionally, in the prototype, the user can insert or register georeferenced points (raised in the field automatically or already known from other sources), as in a VGI process. The register contains descriptions of the points (abstractions of the real world by users). When the user position (autocollected with AudioMaps) is near (15 or 5 m from) the registered point, the point description is presented in an audio output. The application was field-tested with eight volunteers who composed two groups (four sighted people and four VIP). An urban area in the city of Monte Carmelo, Brazil, was chosen to support the experiments. In each group, half the volunteers knew the test area, while the other half did not. A tactile model was designed and used prior to the tests to express the spatial information of the scenario, especially to the VIP. In the experiments, AudioMaps was already registered with locations and descriptions of light poles, street corners, and crosswalks. The volunteers accomplished a navigational task in the tested area to evaluate the cartographic communication of tactile model and the AudioMaps performance. Also, the efficiency of each group of volunteers was analyzed according to previous knowledge of the study area.
2. Materials and Methods
This research was developed based on the construction of a cartographic representation in a 2-dimensional audiovisual prototype (AudioMaps) and a 3-dimensional model (tactile model). Spatial data modeling encompassed a generalization process due to the numerous spatial features that need to be understood by users. At this stage, it was important to limit the area in which reality would be abstracted, thus avoiding a lack or an excess of geographic data. A real scenario (Section 2.1) was selected to guide the cartographic representations. The AudioMaps implementation (Section 2.2) and the tactile model design (Section 2.3) are described in this section.
2.1. Scenario
The selected scenario corresponds to the central part of Monte Carmelo, a representative area of the city, close to the main church, where there is a continuous flow of the local population and visitors. The place has several options for trade and public services, such as pharmacy, church, clothing store, funeral home, radiology clinic, and residences, among others. In addition, there is a steady stream of students, among whom the visually impaired can fit.
2.2. Prototype of Mobile Device Implementation
The design and production of the AudioMaps prototype was programmed and implemented on Integrated Development Environment (IDE; Android Studio) with the use of Source Development Kit (Android SDK) and application programming interfaces (APIs; Google Maps) [38]. The deployment source code is available on the GitHub repository [39]. The AudioMaps application has the objective of obtaining coordinates and registering points of interest. For each point registered in the prototype, whenever the location of the device is close to it (15 or 5 m), the prototype provides in audio form the previously registered point description (e.g., “15 meters to light pole”). The prototype was designed from these main functionalities: (1) accessibility of the platform for different users, sighted or not; (2) determination of the user’s position; (3) tool to register points of interest for the user; (4) automatic update of registered data (online); and (5) spatial information with sound to determine the distance of the user to the registered points. The system architecture is presented in Figure 1. The Samsung Galaxy Grand Prime cellphone (Android operating system, 5 inches) was utilized in the project to enable screen configuration and to provide positional information through GPS. The system lacks reliability as to the origin of positional information (coordinates). Therefore, whenever the cellphone GPS is offline, the system does not return information about previously registered points and does not allow the registration of new points.
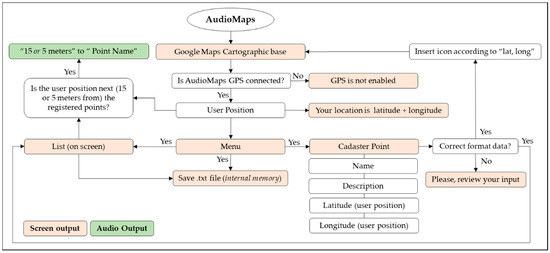
Figure 1.
AudioMaps architecture.
The AudioMaps initial interface allows users to enlarge or reduce the displayed area and visualize any area already available in the Google Maps cartographic base. At the top of the screen, the device symbol or logo appears (in blue), and users also can view their current location on the interface by means of a message at the bottom of the screen (text only) (Figure 2a). The user location is presented in sexagesimal degrees in the device. The lowest part of the screen shows the menu item, where the point registration is displayed; it is also possible to list the points already registered and save them in text file (.txt) format in the cellphone’s internal memory (Figure 2b). The registration of points of interest must be specified by phrases or words (Figure 2c). The register is specified by the point of interest name (mandatory), description (optional), and latitude and longitude in sexagesimal degrees (autogenerated by cellphone GPS or inserted manually). All system tools and inputs are available via touchscreen.
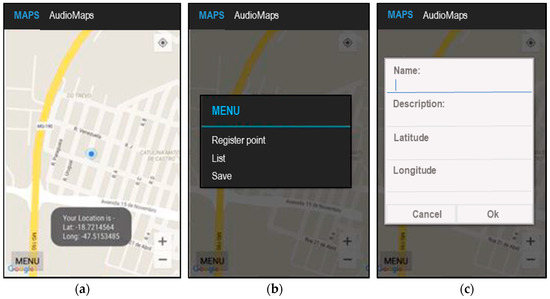
Figure 2.
AudioMaps interfaces: (a) initial (real-time location); (b) tools (point registration, visualization, and storage); (c) point registration description.
After the AudioMaps implementation, the prototype was used to register some points of interest in the tested area. Light poles, street names (crossings), and crosswalks were selected to be registered. The coordinates and descriptions of the recorded points were obtained using the Samsung Galaxy Grand Prime cellphone. Some points of interest for registration were located close together in the test area, so they were registered with a unique location. At this stage, a total of 26 points of interest were collected. The list of registered points can be found in Appendix A, Table A1. Figure 3a shows the points recorded in AudioMaps and Figure 3b shows an example of the point list generated by the second tool shown in Figure 2b. Preliminarily and visually, it could be verified that the prototype attended the task of collecting and registering the points of interest. The points appeared on the screen overlapping the ideal locations, e.g., the corners were at the ends of the streets.
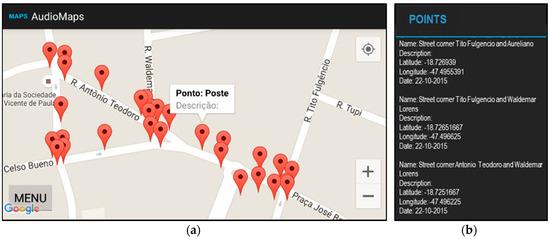
Figure 3.
(a) AudioMaps interface with collected and described points; (b) description of the collected points, e.g., street corners.
2.3. Tactile Model
According to [40], there are two types of tactile maps: one describes general or thematic references and the other assists in orientation and mobility (used in this work). Studies of tactile mobility maps have shown that users of maps for visually impaired people can effectively learn routes through an unfamiliar area with the use of tactile maps and facilitate the wayfinding process [17,41,42]. During the process of wayfinding, VIP need more details and environmental information tailored to their abilities and limitations [9,29]. Objectifying the design of tactile maps, [43] adapted the system of visual variables proposed by [44]. Also, some guidelines for the design of tactile symbols can be found in [45,46,47,48]. Regarding the size of the maps, the author of [42] proposed that they should not exceed two extensions of hands (450 mm). According to the author, the minimum size should be the A4 format, and it is emphasized that users preferred maps in A3 format, with horizontal orientation. As for the materials used in their production, tactile maps have been produced with various materials such as string, beads, sandpaper, wire, plastic, foam, and paper [49]. Although [50,51] points out that tactile maps are the best way to develop cognitive maps for VIP, several limitations are associated with their use: map reading is not innate and needs to be learned; touch is segmented and requires a great demand on memory [52]; the resolution of the finger is more limited than the eye; excessively detailed maps become unreadable [49]; braille text can take up a lot of space and is inflexible in size [42].
In this work, the tactile model was projected to express physical details of the tested area. Initially, the model was projected digitally to analyze the principal information that should be represented (Figure 4a), and it facilitated the tactile model development. The tactile map (Figure 2b) for the tested area was produced manually according to recommendations found in other studies [10,35,40,41,42,43,44,45,46,47,48,49,50,51]. The following information was represented in the tactile model from the survey of the needs of VIP for urban mobility: light poles, landmarks (church, hospital, funeral home), crosswalks, street corners, and road directions.
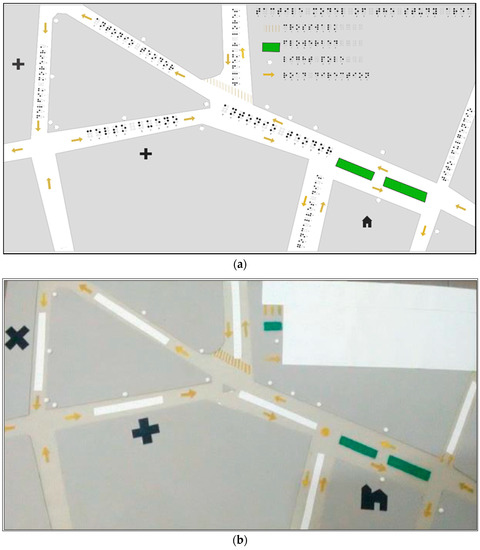
Figure 4.
(a) Tactile model project; (b) tactile model implemented.
A similar idea of presenting graphical information respecting symmetrical and zonal values by scale was considered adequate to the scale model, which had paper size A3 (420 × 297 mm), according to the recommendations of [42]. The minimum size of the represented objects corresponded to 0.5 cm (in pins, for light poles). The streets were represented by light gray color in satin vinyl foam texture. The crosswalk was represented in yellow, with the texture of sandpaper. The light poles were represented in white by plastic pins. The landmarks (church, hospital, and funeral parlor) were represented in black with suede texture, and the same texture was used to represent road direction signs (with arrow formats). The blocks in the tactile maps have an elevation in relation to the road (3 mm) in satin vinyl foam texture. The road names (toponymy) were represented by braille writing. There was still the demarcation of a central building site separating the principal road; it was represented in green, with a velvety texture.
3. Participants and Experiment
The experiment was carried out in 3 steps, all performed in the test area. The first step was the profile selection and characterization of volunteers (Section 3.1). In the second step, participants were trained to use the tactile model to perform preliminary recognition of the tested area (Section 3.2). The third step was the navigation task with prototype support in a part of the test area represented in the tactile model (Section 3.3). In the second and third stages, the experimenter collected time data with a stopwatch, and the general considerations of the volunteers about the task’s execution were collected in a questionnaire.
3.1. Sample
The experiment was performed with 8 volunteers (6 men and 2 women), 4 sighted people (first group) and 4 VIP (second group). All volunteers signed consent to provide results for this work while their personal information was preserved. The characteristics of all the volunteers as well as their interactions with mobile devices and other electronic technologies were collected and recorded in a participant characterization questionnaire. The data collected in this step are summarized in Table 1. The mean age of participants in the first group was 32 years old, while the second group had a mean age of 35 years old. Participants in the second group reported having visual impairments for at least 15 years, usually caused by illness or accidents. Both groups were selected based on their prior knowledge of the area. Soon, half of each group knew the area and the other half did not, and this was considered during the navigation tasks. All participants stated that they had cellphones and used them daily. In general, the participants reported having medium skill in manipulation of tactile models (at banks). Participants in the first group reported using online maps to perform navigation tasks (in unknown locations); in the second group this knowledge was not reported.

Table 1.
Participant characterization.
3.2. Tactile Model Reading
The tactile model was used for previous recognition by means of tactile reading of symbols that represented the area of study. For sighted volunteers, their eyes were blindfolded to manipulate the tactile model. Participants could feel the symbols of the tactile model and decipher their meanings through the legend. Symbols for church, hospital, and funeral home were explained verbally. For participants who had doubts about reading the braille text, it was read by the experimenter. The objects represented in the legend were used to verify the understanding of the spatial distribution of the symbols in the tactile model. In this way, the experimenter pointed out in the legend some symbols, and the participants had to point to their locations in the model. In addition, the experimenter requested that the participants identify similar symbols, thus showing if there was any spatial relationship between them. Thus, the objective was to verify if the light poles were perceived as pertaining to the same side of the track, as well as if the central beds were close and if it was possible for volunteers to notice the direction of the continuous flow of vehicles on the roads.
3.3. Navigation with AudioMaps Support
After each participant’s handshake was recognized, the experimenter led them to perform the navigation task with AudioMaps support. The area utilized in the navigation task is highlighted in Appendix A, Figure A1 and is presented in Figure 5a–c. The navigation path for the participants during the test totaled approximately 300 m. The navigation task was to get out of point 4 (shown in Appendix A, Figure A1) and move to point 8, then take the path back to the starting point. The participants received a total of 13 pieces of audio information along the way. All volunteers were assisted by the experimenter during this stage, who guided them by their arms and oriented them during the journey (Figure 5d). Although sighted people with blindfolds may perform poorly compared to blind people in navigation tasks [52], for the tests, the volunteers should be in the same condition of visual perception. Thus, the sighted volunteers remained blindfolded until the final moment of navigation. However, the VIP were encouraged to use their walking sticks during practice but refused to use them.
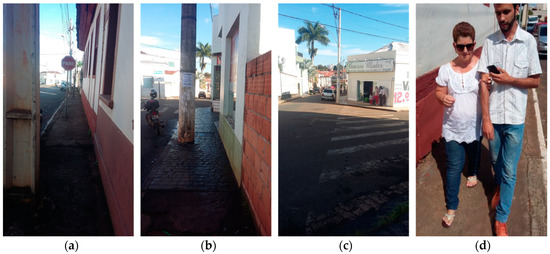
Figure 5.
(a–c) Scenario of the experiment; (d) navigation task with a volunteer.
4. Results and Discussion
The results are presented for the task of reading the tactile model (Section 4.1) and the navigation task with AudioMaps support (Section 4.2). The efficiency of the groups (sighted and VIP) was analyzed by average time spent, and general considerations about the procedures are presented qualitatively. The task execution time for each volunteer was recorded by using a stopwatch at the beginning and end of each experiment.
4.1. Understanding Symbols and Space by Touch
The average time of manipulation for the sighted group to use the tactile model was approximately five minutes, while the VIP took about a minute and a half more (Figure 6). Among the sighted group, those who previously knew the area were more efficient in the task. Therefore, the task of associating tactile symbols with the real world seems to have been facilitated in this case. Among the VIP group, those who had previous knowledge of the area were less efficient in the reading task. In this case, it was noted by the experimenter that the task may have required more complex abstractions, since previous spatial knowledge of the test area by these participants is due to the compensation of the other senses. In general, it was found that the size of the tactile model was suitable for reading the represented area; all volunteers were able to identify the information represented in the tactile model. The main difficulty of the VIP group was regarding the orientation of the pathways and reading the braille text, while for the sighted group it was the grouping of similar symbols. These difficulties were also presented in other works [13,50,51,52]. The volunteers in both groups who already knew the area described all the location symbols in a more detailed and practical way. However, these participants were less efficient in the reading task.
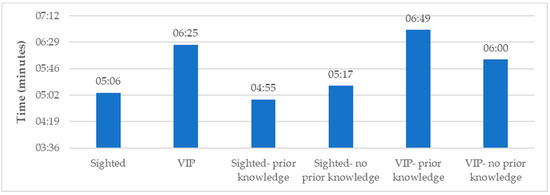
Figure 6.
Efficiency in tactile model reading.
4.2. Navigation with AudioMaps Support
The mean time for the navigation task for the sighted group was six and a half minutes, while the VIP group performed the task in about five minutes (Figure 7). Volunteers in both groups who already knew the area were more efficient in this task. It was observed that, as reported in [53], the sighted group showed a significant difference in the efficiency of the task due to being blindfolded, as well as unfamiliarity with the type of navigation required. For both groups of volunteers, the difference in efficiency among those who knew the study area and those who did not was about 20 minutes. After the practice, both groups were able to provide information on the place of navigation (pointing to the tactile model). Along the way through the test area, the volunteers stated that the prototype issued distance information between themselves and the registered objects. In this way, there were no signal problems in the internet network, besides problems in the effectiveness of the prototype. The distance between the volunteers and the registered objects was considered of extreme importance. Distance confirmation was achieved by correlating the number of steps needed to reach the point of interest reported by AudioMaps (approximately one step per meter). Thus, the distance reported by AudioMaps could be associated with the real world.
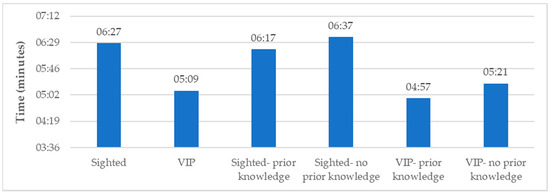
Figure 7.
Efficiency in navigation task.
5. Conclusions
The prototype enabled users to create relationships between represented (virtual) space and real (physical) space. The virtual navigation also allowed for enrichment of the mental maps of participants who did not know the test area. The volunteers reported that the prototype was easy to navigate and interesting, which can facilitate spatial orientation. The VIP were eager to learn how to register more points on AudioMaps, which can make them a potential category of VGI. During the experiment, some VIP reported having had traumatic experiences when attempting to perform urban mobility without assistance, including some accidents/incidents that occurred due to lack of adequate road signs and inadequate structure of guides. Transitory obstacles such as holes, garbage bags in the street, or debris (as described in [9]) were pointed out as necessary on this type of map as well as functions for route planning and maintenance. However, enabling this type of recording requires more assistive functions for AudioMaps, such as point registration via audio and mobile phones with assistive technology. In this sense, inserting thematic categories for each record is perhaps the solution, e.g., transitory objects could be valid for a brief time.
Although digital mapping approaches offer an opportunity to collect and share information for VIP, to date, it is not clear whether distinct groups of users (sighted or VIP) behave similarly when navigating in urban spaces with the use of maps. Several solutions have been proposed and implemented to deal with navigation in environments. Each solution may involve a different type of product, and the audio output seems to be a problem. However, here the idea is to make the user the information producer in the future and the amount of sound information is measured by the user during the registration of data. The methodology used in the tests provided preliminary results, and future quantitative analyses are required. In the experiment described here, the degree of communicability of the prototype was significant, revealing itself as a potential tool to promote the development of spatial perception of the visually impaired. The prototype allowed the environment to be characterized and exploited by users in a simple and interactive way, responding to their actions and allowing them to perceive the environment as if they were moving around the city. Future work will be carried out with the necessary modifications for the full operation and use of AudioMaps by sighted and visually impaired people.
Author Contributions
All authors contributed equally to the work reported.
Funding
This research received no external funding.
Conflicts of Interest
The authors declare no conflict of interest.
Appendix A
Table A1.
Points of interest of the test area registered in the prototype AudioMaps.
Table A1.
Points of interest of the test area registered in the prototype AudioMaps.
| ID | Description | Latitude | Longitude |
|---|---|---|---|
| 1 | Street corner Tito Fulgencio and Aureliano | −18.7269391 | −47.4955391 |
| 2 | Street corner Tito Fulgencio and Aureliano | −18.7270246 | −47.4955769 |
| 3 | Street corner Tito Fulgencio and Aureliano | −18.7270324 | −47.4956723 |
| 4 | Street corner Tito Fulgencio and Aureliano | −18.7268861 | −47.4956194 |
| 5 | Street corner Gonçalves Dias and Aureliano | −18.7269981 | −47.4959301 |
| 6 | Street corner Gonçalves Dias and Aureliano | −18.7268003 | −47.4960763 |
| 7 | Street corner Gonçalves Dias and Aureliano | −18.7264887 | −47.4965614 |
| 8 | Street corner Gonçalves Dias and Aureliano | −18.7264175 | −47.4966506 |
| 9 | Light pole and street corner Ant. Teodoro and Delfim Moreira | −18.7260982 | −47.4972655 |
| 10 | Light pole and street corner Ant. Teodoro and Delfim Moreira | −18.7261689 | −47.4972675 |
| 11 | Street corner Antônio Teodoro and Delfim Moreira | −18.7260777 | −47.4973805 |
| 12 | Light pole and street corner Delfim Moreira and Celso Bueno | −18.7267122 | −47.4972827 |
| 13 | Street corner Delfim Moreira and Celso Bueno | −18.7267705 | −47.4972771 |
| 14 | Street corner Delfim Moreira and Celso Bueno | −18.7267818 | −47.4973225 |
| 15 | Street corner Delfim Moreira and Celso Bueno | −18.7267243 | −47.4973592 |
| 16 | Light pole and street corner Celso Bueno and Waldemar Lorens | −18.7266134 | −47.4966145 |
| 17 | Street corner Celso Bueno and Waldemar Lorens | −18.7266531 | −47.4965365 |
| 18 | Street corner Celso Bueno and Waldemar Lorens | −18.7265166 | −47.4960643 |
| 19 | Light pole | −18.7270371 | −47.4955739 |
| 20 | Light pole | −18.7269777 | −47.4957937 |
| 21 | Light pole | −18.7267197 | −47.4960563 |
| 22 | Light pole | −18.7268336 | −47.4957796 |
| 23 | Light pole | −18.7266722 | −47.4962215 |
| 24 | Light pole | −18.7265261 | −47.4964702 |
| 25 | Light pole | −18.7264243 | −47.4966845 |
| 26 | Light pole | −18.7262423 | −47.4969843 |

Figure A1.
Points of interest collected with AudioMaps and location of experiment.
References
- Board, C. Map reading tasks appropriate in experimental studies in cartographic communication. Cartographica Int. J. Geogr. Inf. Geovis. 1978, 15, 1–12. [Google Scholar] [CrossRef]
- Gibson, J.J. The Senses Considered as Perceptual Systems; Houghton Mifflin Company: Boston, MA, USA, 1966. [Google Scholar]
- Cartwright, W.; Peterson, M.P.; Gartner, G. Multimedia Cartography, 2nd ed.; Springer: Berlin, Germany, 1999. [Google Scholar]
- Iida, I. Ergonomia: Projeto e Produção, 2nd ed.; Edgard Blücher: São Paulo, Brazil, 2005. [Google Scholar]
- Vygotsky, L.S. A Formação Social da Mente; Neto, J.C.; Barreto, L.S.M.; Afeche, S.C., Translators; São Paulo, Brazil, 1991; Available online: http://www.wilsondasilva.com.br/alunos/sion/psicologia_desenvolvimento/a_formacao_social_da_mente.pdf (accessed on 1 December 2018).
- Slocum, A.T.; McMaster, R.B.; Kessler, F.C.; Howard, H.H. Thematic Cartography and Geovisualization, 3rd ed.; Prentice Hall: New York, NY, USA, 2009. [Google Scholar]
- MacEachren, A.M.; Kraak, M. Exploratory Cartographic Visualization: Advancing the Agenda. Comput. Geosci. 1997, 23, 335–343. [Google Scholar] [CrossRef]
- Keates, J.S. Cartographic Design and Production, 2nd ed.; Longman: London, UK, 1989. [Google Scholar]
- Jeamwatthanachai, W.; Wald, M.; Wills, G. Map data representation for indoor navigation by blind people. Int. J. Chaot. Comput. 2017, 4, 70–78. [Google Scholar]
- Nogueira, R.E.; Almeida, L.C. Iniciação cartográfica de adultos invisuais. In Motivações Hodiernas para Ensinar Geografia; Nova Letra: Florianópolis, Brazil, 2009. [Google Scholar]
- Cambiaghi, S. Desenho Universal: Métodos e Técnicas para Arquitetos e Urbanistas; Senac and Livraria Cultura: São Paulo, Brazil, 2007. [Google Scholar]
- LOPES, M.N.N. Plano de Promoção de Acessibilidade para Todos. Master Thesis, Faculdade de Engenharia, Universidade do Porto, Portugal, 2010. [Google Scholar]
- Manzini, E.J. Tecnologia assistiva para educação: Recursos pedagógicos adaptados. In Ensaios Pedagógicos: Construindo Escolas Inclusivas; SEESP/MEC: Brasília, Brazil, 2005; pp. 82–86. [Google Scholar]
- Morita, T. Grading of the Map Functions in Navigation System. In Proceedings of the International Cartographic Conference, Cologne, Germany, 3–9 May 1993. [Google Scholar]
- Meijer, P.B.L. An experimental system for auditory image representations. IEEE Trans. Biomed. Eng. 1992, 39, 112–121. [Google Scholar] [CrossRef] [PubMed]
- Zeng, L.; Weber, G. Accessible maps for the visually impaired. In Proceedings of the IFIP INTERACT 2011—Workshop on ADDW, CEUR, Lisbon, Portugal, 9–12 September 2011; pp. 54–60. [Google Scholar]
- Jacobson, R.D. Cognitive mapping without sight: Four preliminary studies of spatial learning. J. Environ. Psychol. 1998, 18, 289–306. [Google Scholar] [CrossRef]
- Kane, S.K.; Morris, M.R.; Perkins, A.Z.; Wigdor, D.; Ladner, R.E.; Wobbrock, J.O. Access overlays: Improving non-visual access to large touch screens for blind users. In Proceedings of the 24th annual ACM Symposium on User Interface Software and Technology, Santa Barbara, CA, USA, 16–19 October 2011; ACM: New York, NY, USA, 2011; pp. 273–282. [Google Scholar]
- Giehl, F.C.; Duarte, M. Caracterização dos Estudos Sobre a Cartografia Tátil Publicados em Periódicos. Revista Percurso 2016, 8, 5–20. [Google Scholar]
- Barbosa, L.C.; De Sá, L.A.C.M. Desenvolvimento de um Aplicativo Computacional para Auxílio na Aprendizagem da Cartografia para Alunos Deficientes Visuais nas Séries de Nível Básico. In Proceedings of the VI Simpósio Brasileiro de Ciências Geodésicas e Tecnologias da Geoinformação, Recife, Brazil, 24–25 August 2016. [Google Scholar]
- Helal, A.; Moore, S.E.; Ramachandran, B. Drishti: An integrated navigation system for visually impaired and disabled. In Proceedings of the Fifth International Symposium on Wearable Computers, Zurich, Switzerland, 8–9 October 2001. [Google Scholar]
- Lin, B.S.; Lee, C.C.; Chiang, P.Y. Simple Smartphone-Based Guiding System for Visually Impaired People. Sensors 2017, 17, 1371. [Google Scholar] [CrossRef] [PubMed]
- Dischinger, M. Designing for All Senses: Accessible Spaces for Visually Impaired Citizens. Ph.D. Thesis, Department of Space and Process School of Architecture, Chalmers University of Technology, Gothenburg, Sweden, 2000. [Google Scholar]
- Zhao, Q.; Zhang, B.; Lyu, S.; Zhang, H.; Sun, D.; Li, G.; Feng, W. A CNN-SIFT Hybrid Pedestrian Navigation Method Based on First-Person Vision. Remote Sens. 2018, 10, 1229. [Google Scholar] [CrossRef]
- Elmannai, W.; Elleithy, K. Sensor-Based Assistive Devices for Visually-Impaired People: Current Status, Challenges, and Future Directions. Sensors 2017, 17, 565. [Google Scholar] [CrossRef] [PubMed]
- Yang, K.; Wang, K.; Bergasa, L.M.; Romera, E.; Hu, W.; Sun, D.; Sun, J.; Cheng, R.; Chen, T.; López, E. Unifying Terrain Awareness for the Visually Impaired through Real-Time Semantic Segmentation. Sensors 2018, 18, 1506. [Google Scholar] [CrossRef] [PubMed]
- Poppinga, B.; Magnusson, C.; Pielot, M.; Rassmus-Gröhn, K. TouchOver map: Audio-tactile exploration of interactive maps. In Proceedings of the 13th International Conference on Human Computer Interaction with Mobile Devices and Services, Stockholm, Sweden, 30 August 30–2 September 2011; ACM: New York, NY, USA, 2011; pp. 545–550. [Google Scholar]
- Yatani, K.; Banovic, N.; Truong, K. SpaceSense: Representing geographical information to visually impaired people using spatial tactile feedback. In Proceedings of the SIGCHI Conference on Human Factors in Computing Systems, Austin, TX, USA, 5–10 May 2012; ACM: New York, NY, USA, 2012; pp. 415–424. [Google Scholar]
- Papadopoulos, K.; Koustriava, E.; Koukourikos, P. Orientation and mobility aids for individuals with blindness: Verbal description vs. audio-tactile map. Assist. Technol. 2017, 30, 191–200. [Google Scholar] [CrossRef] [PubMed]
- Cattaneo, Z.; Vecchi, T. Blind Vision: The Neuroscience of Visual Impairment; MIT Press: Cambridge, MA, USA, 2011. [Google Scholar]
- Zeng, L. A Survey: Outdoor Mobility Experiences by the Visually Impaired. In Mensch & Computer 2015—Workshop Band; Oldenbourg Wissenschaftsverlag: Stuttgart, Germany, 2015; pp. 391–397. [Google Scholar]
- Kitchin, R.; Jacobson, R.D. Techniques to collect and analyze the cognitive map knowledge of persons with visual impairment or blindness: Issues of validity. J. Vis. Impair. Blind. 1997, 91, 360–376. [Google Scholar]
- Ohuchi, M.; Iwaya, Y.; Suzuki, Y. Cognitive-Map Formation of Blind Per-sons in a Virtual Sound Environment. In Proceedings of the 12th International Conference on Auditory Display, London, UK, 20–23 June 2006. [Google Scholar]
- Lacey, S.; Stilla, R.; Sreenivasan, K.; Deshpande, G.; Sathian, K. Spatial imagery in haptic shape perception. Neuropsychologia 2014, 60, 144–158. [Google Scholar] [CrossRef] [PubMed]
- Lacey, S.; Sathian, K. Representation of object form invision and touch. In The Neural Bases of Multisensory Processes; Murray, M., Wallace, M., Eds.; CRC: BocaRaton, FL, USA, 2012. [Google Scholar]
- Flanagin, A.J.; Metzger, M.J. The credibility of volunteered geographic information. GeoJournal 2008, 72, 137–148. [Google Scholar] [CrossRef]
- Goodchild, M.F. Citizens as sensors: The world of volunteered geography. GeoJournal 2007, 69, 211–221. [Google Scholar] [CrossRef]
- Android Studio. The Official IDE for Android. Available online: https://developer.android.com/studio/ (accessed on 10 October 2018).
- Amorim, F.R. AudioMaps. GitHub Repository. 2018. Available online: https://github.com/CartoFabricio/AudioMaps (accessed on 15 October 2018).
- Thesbita, L. Mapa tátil como recurso de acessibilidade à cidade: um estudo de caso na estação do metrô Santa Cruz da cidade de São Paulo. Ph.D. Thesis, Universidade de São Paulo, São Paulo, Brazil, 2014. [Google Scholar]
- Ungar, S.; Blades, M.; Spencer, C. Map use by adults with visual impairments. Prof. Geogr. 1999, 51, 539–553. [Google Scholar]
- Tatham, A.F. The design of tactile maps: Theoretical and practical considerations. In Proceedings of the 15th International Cartographic Association (ICA) Conference, Bournemouth, UK, 10–15 January 1991. [Google Scholar]
- Vasconcellos, R. Tactile mapping design and the visually impaired user. In Cartographic Design: Theoretical and Practical Perspectives; John Wiley & Sons: Chichester, UK, 1996. [Google Scholar]
- Bertin, J.; Berg, W.J.; Wainer, H. Semiology of Graphics: Diagrams, Networks, Maps; University of Wisconsin Press: Madison, WI, USA, 1983. [Google Scholar]
- Edman, P. Tactile Graphics; American Foundation for the Blind: New York, NY, USA, 1992. [Google Scholar]
- Koch, W.G. State of the art of tactile maps for visually impaired people. In True-3D in Cartography; Springer: Berlin/Heidelberg, Germany, 2011; pp. 137–151. [Google Scholar]
- Brock, A.; Lebaz, S.; Oriola, B.; Picard, D.; Jouffrais, C.; Truillet, P. Kin’touch: Understanding how visually impaired people explore tactile maps. In CHI’12 Extended Abstracts on Human Factors in Computing Systems; ACM: New York, NY, USA, 2012; pp. 2471–2476. [Google Scholar]
- Picard, D. Visuo-Tactile Atlas; Organisation Mondiale de la Propriété Intellectuelle: Midi-Pyrénées, France, 2012. [Google Scholar]
- Gardner, J.A. Tactile graphics: An overview and resource guide. Inf. Technol. Disabil. 1996, 3, 20–25. [Google Scholar]
- Espinosa, M.A.; Ungar, S.; Ochaíta, E.; Blades, M.; Spencer, C. Comparing methods for introducing blind and visually impaired people to unfamiliar urban environments. J. Environ. Psychol. 1998, 18, 277–287. [Google Scholar] [CrossRef]
- Hampson, P.J.; Daly, C.M. Individual variation in tactile map reading skills: Some guidelines for research. J. Vis. Impair. Blind. 1989, 505–509. [Google Scholar]
- Hatwell, Y.; Streri, A.; Gentaz, E. Touching for Knowing: Cognitive Psychology of Haptic Manual Perception; John Benjamins Publishing: Amsterdam, The Netherlands, 2003. [Google Scholar]
- Tinti, C.; Adenzato, M.; Tamietto, M.; Cornoldi, C. Visual experience is not necessary for efficient surveyspatial cognition. Q. J. Exp. Psychol. 2006, 59, 1306–1328. [Google Scholar] [CrossRef] [PubMed]
© 2018 by the authors. Licensee MDPI, Basel, Switzerland. This article is an open access article distributed under the terms and conditions of the Creative Commons Attribution (CC BY) license (http://creativecommons.org/licenses/by/4.0/).