Article

Investigation on Pore Structure and Permeability of Concrete–Rock Interfacial Transition Zones Based on Fractal Theory

1
College of Water Conservancy and Hydropower Engineering, Hohai University, Nanjing 210098, China
2
School of Civil Engineering, Shaoxing University, Shaoxing 312000, China
*
Authors to whom correspondence should be addressed.
Fractal Fract. 2022, 6(6), 329; https://doi.org/10.3390/fractalfract6060329
Submission received: 7 May 2022 / Revised: 8 June 2022 / Accepted: 9 June 2022 / Published: 13 June 2022
(This article belongs to the Special Issue Fractal and Fractional in Geomaterials)

Abstract

:
The concrete–rock interfacial transition zone (ITZ) is generally considered the weak layer in hydraulic engineering, for it is more permeable than the intact concrete or rocks. The water permeability of the ITZ is a critical parameter concerned with structural safety and durability. However, the permeability and pore structure of the ITZ has not been investigated previously, and the mathematical model of ITZ permeability has not been established. This study performed multi-scale experiments on the concrete–rock ITZ with various rock types (limestone, granite, and sandstone). A series of quantitative and qualitative analysis techniques, including NMR, SEM-EDS, and XRD, characterize the ITZ pore structures. The controlled constant flow method was used to determine the permeability of the concrete, rock, and ITZ. The mathematical model of ITZ permeability was proposed using the fractal theory. The consistency between the experimental data and the proposed model indicates the reliability of this study. The results of the experiment show that ITZ permeability is between 4.08 × 10⁻¹⁸ m2 and 5.74 × 10⁻¹⁸ m2. The results of the experiment and the proposed model could determine ITZ permeability in hydraulic structure safety and durability analysis.

1. Introduction

The concrete–rock interfacial transition zone (ITZ) widely exists in hydraulic engineering, such as arch dams, concrete gravity dams, and tunnels. The concrete–rock ITZ is characterized by high porosity, poor densification, calcium hydroxide (CH) enrichment, high permeability, and low shear strength, which is generally considered the weak layer and adversely impacts hydraulic structures. Thus, research on the properties of the ITZ has been a hot topic in hydropower engineering projects [1,2,3]. The durability of the concrete–rock structure depends on the penetration of water and corrosive ions into the matrix [4]. As the weakest layer of the whole system, the concrete–rock interface is considered one of the main flow channels for the erosion solution. The deterioration of the mechanical properties of the ITZ is vital to the stability of hydropower engineering projects [5].
The macroscopic physical properties of the ITZ are generally dependent on ITZ microstructures. Therefore, many researchers have conducted experiments to investigate the mineral composition and microstructures of the ITZ. Wang et al. [6] investigated the microstructure of the ITZ between the aggregate and cement slurry at different stages. The results showed that the porosity and micro-fracture length gradually increased while the average pore size decreased with the curing process. Several researchers [7,8,9,10,11] have studied the effect of the concrete mixture on the ITZ microstructures by adding silica fume, nano-silica, rice husk ash, kaolin, slag, fly ash, pozzolan, etc. It is believed that the addition of colloids can fill the accumulation pores of cement particles and reduce the content of calcium hydroxide (CH), increasing the ITZ compactness. The influences of aggregates (including light aggregates, heavy aggregates, different particle sizes and shapes) on the ITZ microstructural characteristics were discussed by Lin [12], Bentz et al. [13], and Lyu et al. [14], respectively. The results indicate that the ITZ between the light porous aggregate and cement slurry generates a denser ITZ microstructure.
Permeability is a crucial parameter closely related to the project’s seepage characteristics and benefits in hydraulic engineering. As a potential leakage channel, the permeability of the ITZ has been investigated by many researchers. Skalny [15,16] first proposed to investigate the permeability characteristics of the ITZ by comparing the permeability test results of pure rock, cement-based and cement slurry–rock. Subsequently, many scholars have obtained the permeability of the ITZ by this method and proved that the permeability of the ITZ is far greater than mortar [17,18]. However, some scholars have assumed that although the permeability of the ITZ is large, it is not necessarily the permeability channel of the whole structure [15,16]. Since the experimental determination process is deemed time-consuming, and only some discrete data points can be obtained in the experimental operation, researchers attempted to use numerical simulation methods and analytical models to calculate the permeability of the ITZ. Snyder et al. [19] investigated the seepage mechanism of the ITZ around the spherical aggregate in mortar by the sphere model. Bentz et al. [13,20] and Zheng et al. [21,22] simplified the aggregates into spherical and polygonal agglomerates and developed a multiscale spherical stacking model to estimate the effects of the ITZ thickness, aggregate particle size distribution and aggregate type on the seepage characteristics of the ITZ. In order to obtain a more realistic three-dimensional model of the ITZ, Kim et al. [23] used μ-CT images to describe the cement slurry samples with different porosity by a low-order probability function. They reconstructed a three-dimensional ITZ microstructure framework with porosity gradients. Li et al. [24,25] constructed the cement slurry based on the Discrete Element Method (DEM), and the porosity and permeability of the cement matrix and the ITZ were obtained. Jia et al. [26,27] proposed an effective and convenient approach to obtain the intrinsic permeability of the tight porous media and constructed a 3D model, including the fracture penetrating the shale core to simulate the flow process in the fracture-matrix system realistically. Sun et al. [28] reconstructed the 3D microstructure image of the ITZ based on SEM imaging technology and obtained the total porosity, seepage porosity, and permeability of the ITZ using the permeability solving code.
Although the permeability properties and the microstructure characteristics of the ITZ have been consistently studied, the relationship between permeability and microstructure has not been established. Most existing permeability models are based on the intrinsic permeability calculation model of porous media. It was thought that the permeability of the ITZ is in direct proportion to the porosity, pore connectivity, and pore size [28,29,30]. Some models considered the effect of simplified ITZ microstructures on permeability [30]. However, the high complex and irregular geometry features have been ignored [31,32,33,34]. Many scholars have simulated cement and rock internal pore structures based on a fractal model; pore structure characteristics can be described by fractal parameters such as fractal dimensions of the pore surface, pore tortuosity, and fracture surface [35,36,37,38,39,40]. The studies provide a theoretical background to the proposed functional relationships between fractal dimensions and basic macro properties.
The objective of this study was to investigate the permeability of the concrete–rock ITZ and develop a mathematical model based on the fractal theory. Firstly, most of the previous microstructure research is focused on the ITZ between the aggregate and cement slurry. There is a lack of systematic research on the ITZ between the bedrock and concrete structure, especially concerning the permeability of the ITZ. Secondly, the influence of the ITZ on the leakage is still uncertain, and some scholars even believe that the ITZ may not be a seepage channel. Finally, the relationship between the permeability and microstructure of the ITZ has not been fully established. It was therefore necessary to introduce the micropore structure characteristics into the permeability model and quantify the effect of microcracks and pores on the seepage characteristics in the ITZ.
This study performed macro and micro experiments on the concrete–rock ITZ with different rock types (limestone, granite, and sandstone). A series of quantitative and qualitative analysis techniques, including NMR, SEM-EDS, and XRD, were used to characterize the ITZ pore structures and mineralogy. The controlled constant flow method was used to determine the permeability of the concrete, rock, and the ITZ, improving the reliability of the test results. Based on the experimental results and fractal theory, the ITZ permeability model was proposed to relate pore structure parameters and permeability. The proposed model could provide reasonable permeability parameters for hydraulic engineering seepage analysis.

2. Materials and Methods

2.1. Sample Preparation

The rocks used in the experiment (sandstone, limestone and granite) were taken from Huaqi Quarry in Nanjing, Jiangsu Province. Selected bedrocks were cut into 100 × 100 × 50 mm rectangular and 50 × 100 mm cylindrical specimens with an accuracy control of ± 0.1   mm The compressive strength grade of concrete is C30, prepared by P.O. 42.5 ordinary silicate cement, standard sand (2.3~3.0 mm) and continuous graded gravel (particle size 3~15 mm). The mixing proportion of the concrete is shown in Table 1.
The casting steps were as follows:
(1)
The cleaned rock was placed into the molds and the raw materials were prepared strictly according to the C30 concrete mixing ratio. The weighed cement, sand, stones, admixtures, and water were poured into the concrete mixer and mixed for 60 s.
(2)
After mixing was completed, the concrete was poured sequentially into the steel molds. Then, the molds were placed on a vibrating table to remove air bubbles from the samples. Vibrating time should not exceed 30 s to avoid the effect of water secretion.
(3)
The composite specimen was dismantled within 24 h, put into a standard curing box for 28 days, and finally, a cube specimen of 100 × 100 × 100 mm was obtained.
(4)
According to the sample size required for the penetration test, a coring machine was used to take the core from the cube specimen. Finally, a cylindrical example of 50 × 100 mm was obtained. Figure 1 shows the fabrication process of the cylindrical concrete–rock mixed specimen.

2.2. Permeability Test and Procedure

After sampling was completed, bedrock-concrete samples were selected and a laser controlled cutting machine was used to cut the samples into the size required by the macro and micro test instruments. As shown in Figure 2, the operation method for each test was as follows:
The size of the X-ray Diffractometer (XRD) test sample was powder with a particle size less than 0.0075 mm. The cement slurry of the ITZ was ground into powder and then placed in a drying oven at 45 °C for 12 h until it reached a constant weight. Then, it was placed on the observation lens in the Ultima IV observation cavity. The diffraction angle range was 5~80° and the scanning speed was 3°/s. Finally, the phase content of the ITZ was obtained.
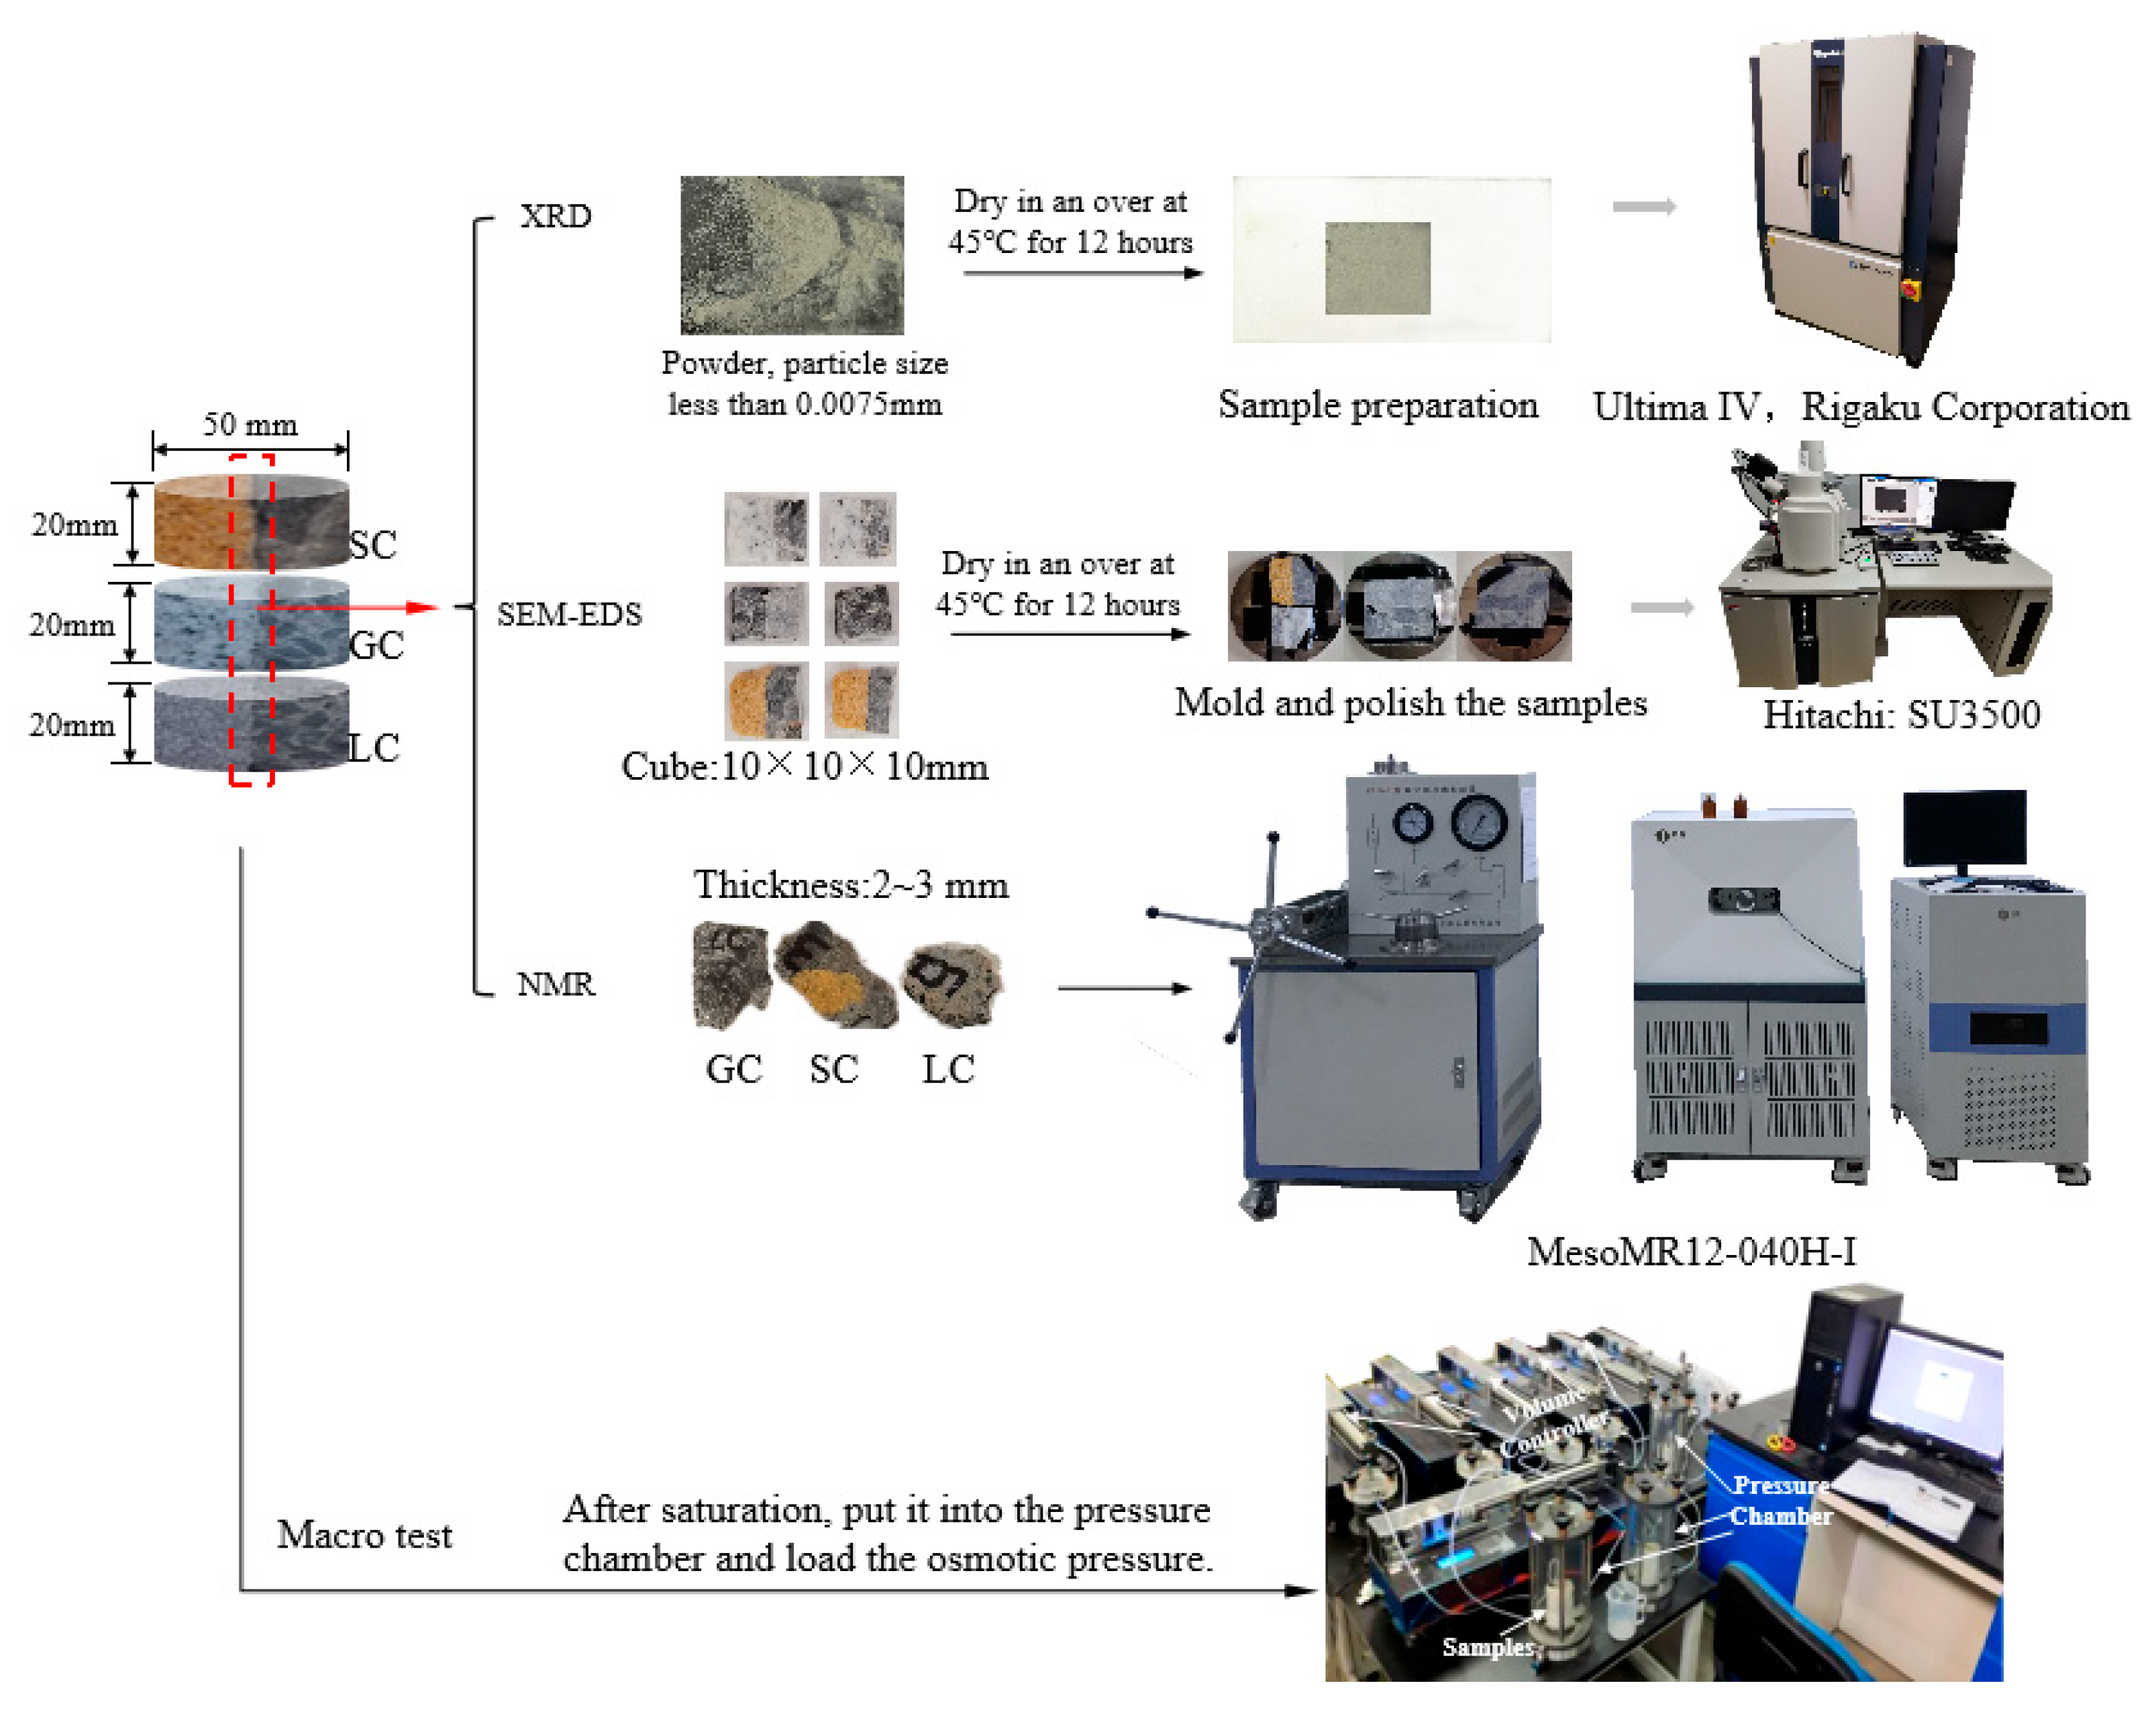
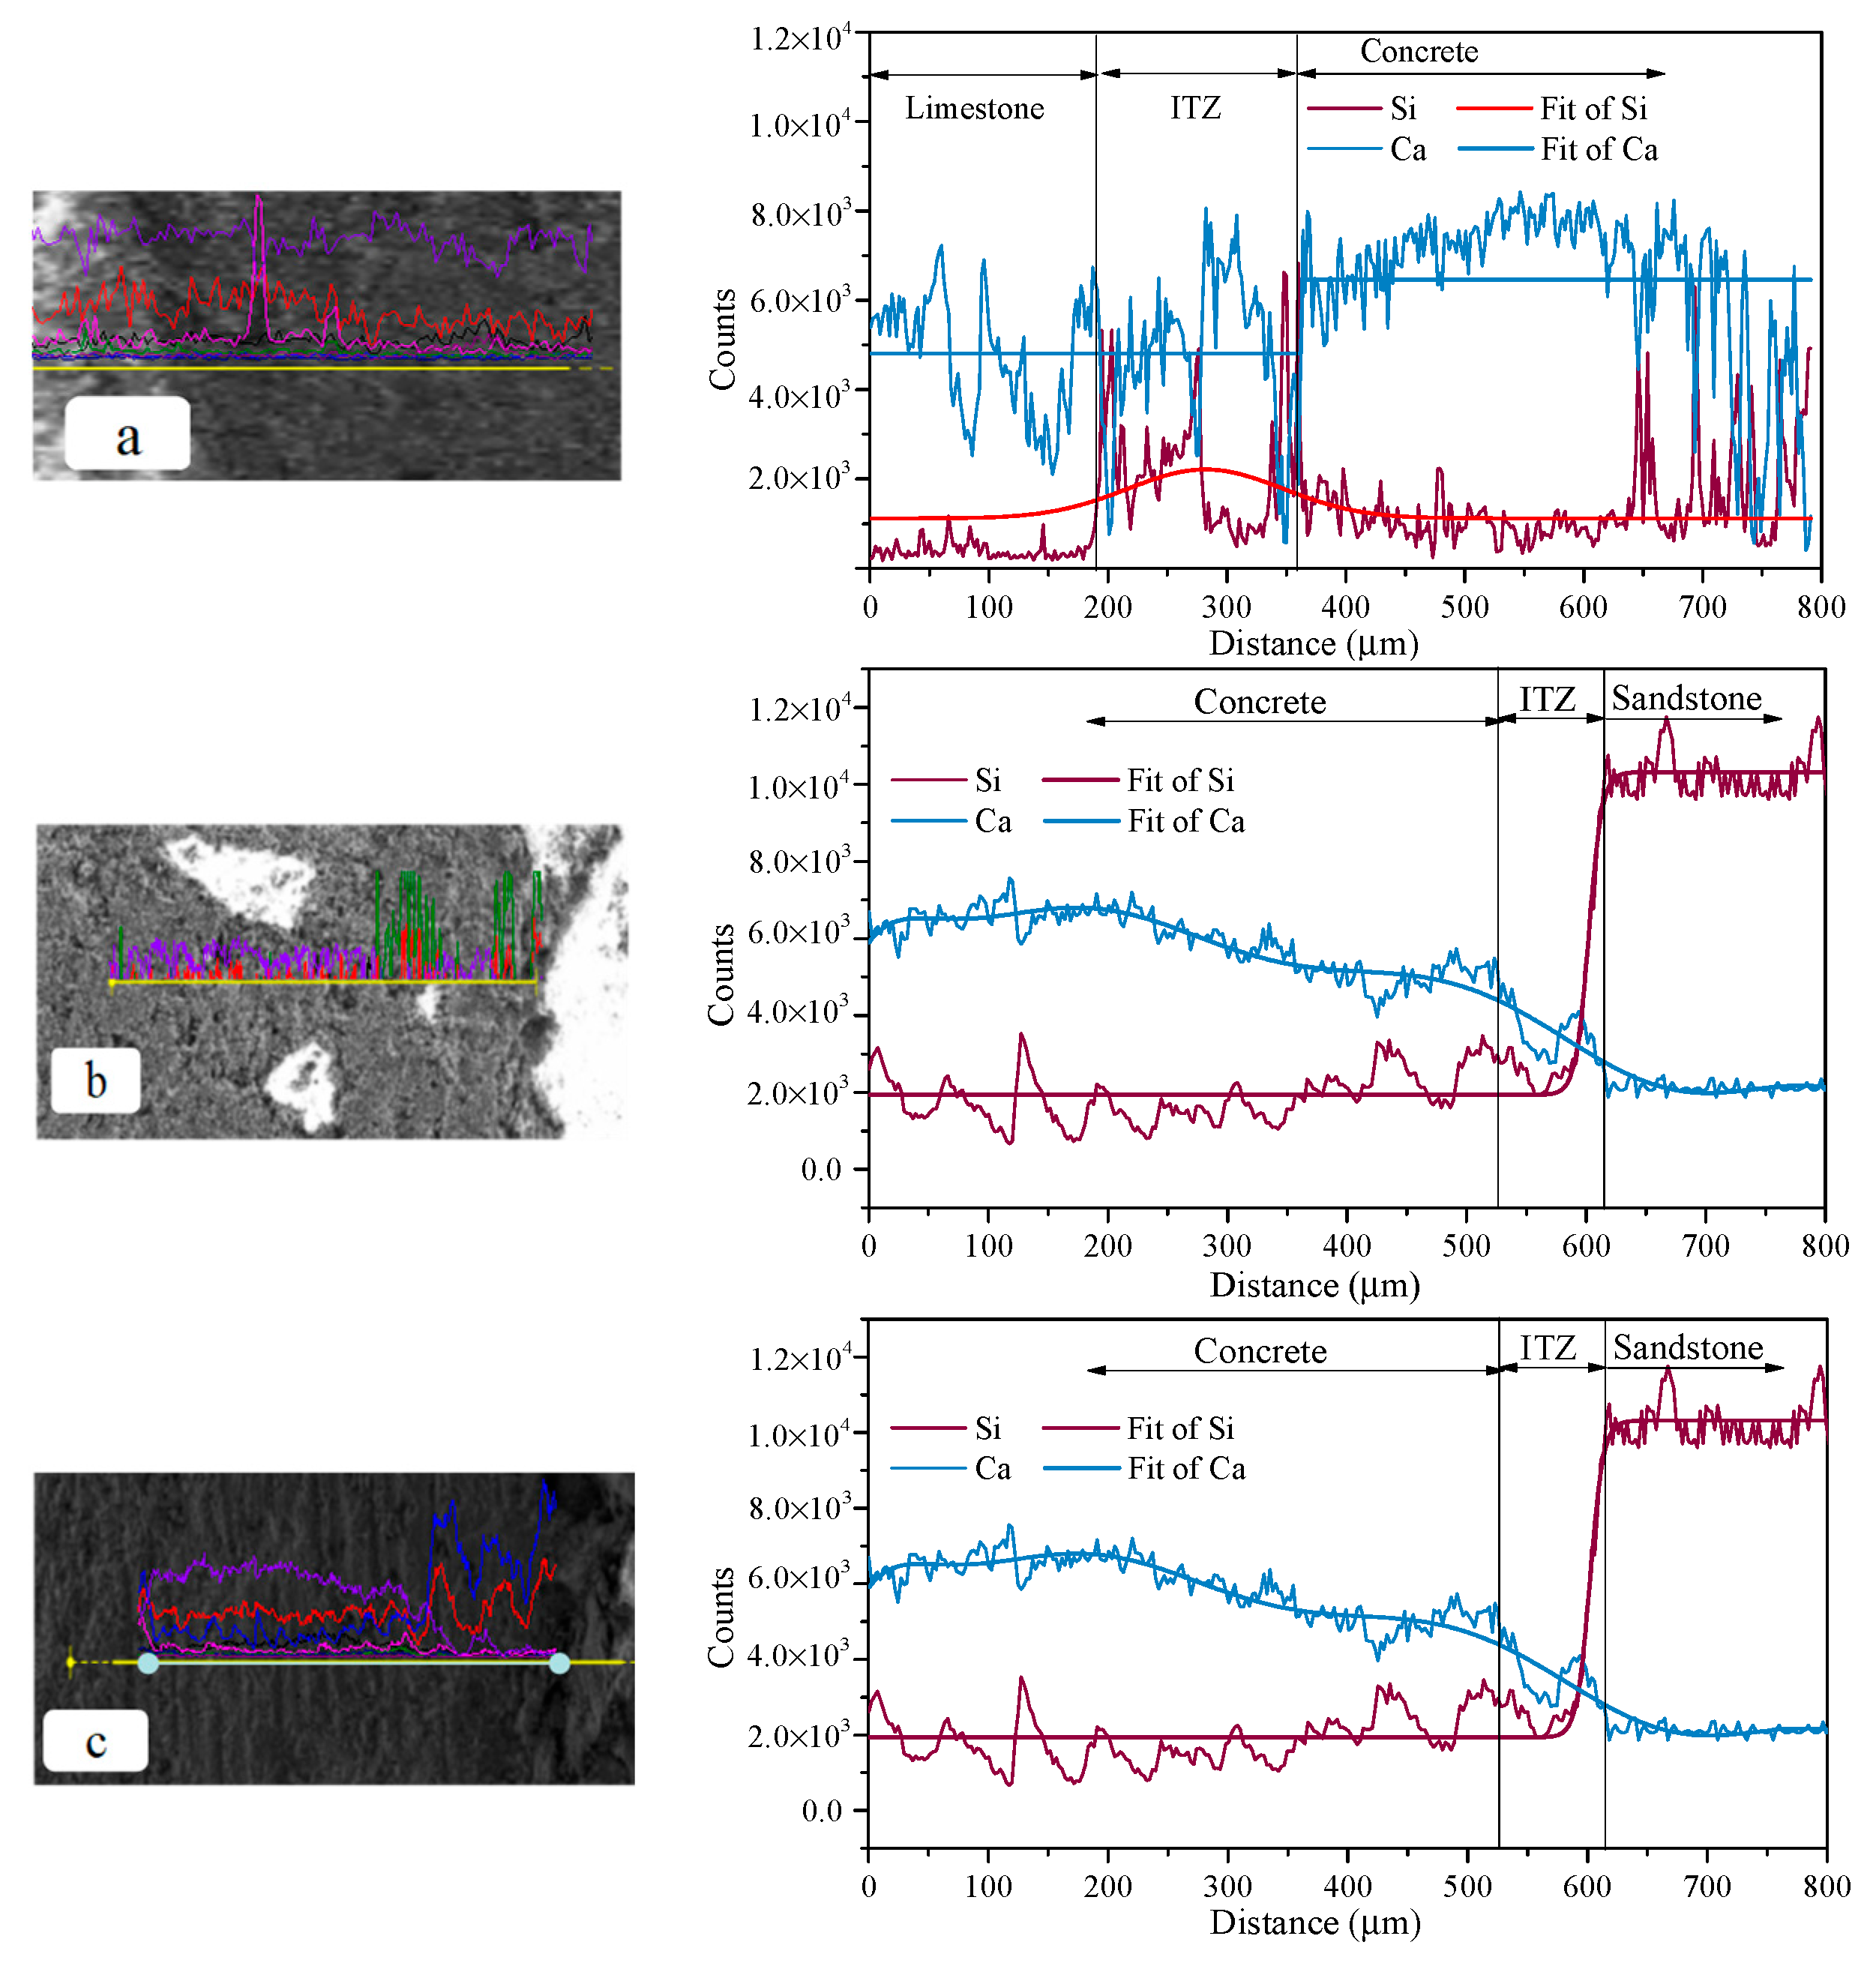
  • The samples for the scanning electron microscope-energy spectrum analysis (SEM-EDS) were a cube of 10 × 10 ×10 mm, and the sample contained both rock and concrete. Then, the samples were dried in a drying oven at 45 °C for 12 h to a constant weight. The samples were scanned using a SU3500-HITACHI SEM-EDS at an accelerating voltage of 3000 V. The image was focused, adjusted, and photographed at different magnifications. Under the observation condition of magnification of 500, a regular line was drawn in the adjacent area of rock and concrete. The starting point of the standard line was inside the rock, and the endpoint was inside the concrete slurry. The length of the entire element distribution observation line was within 800 μm.
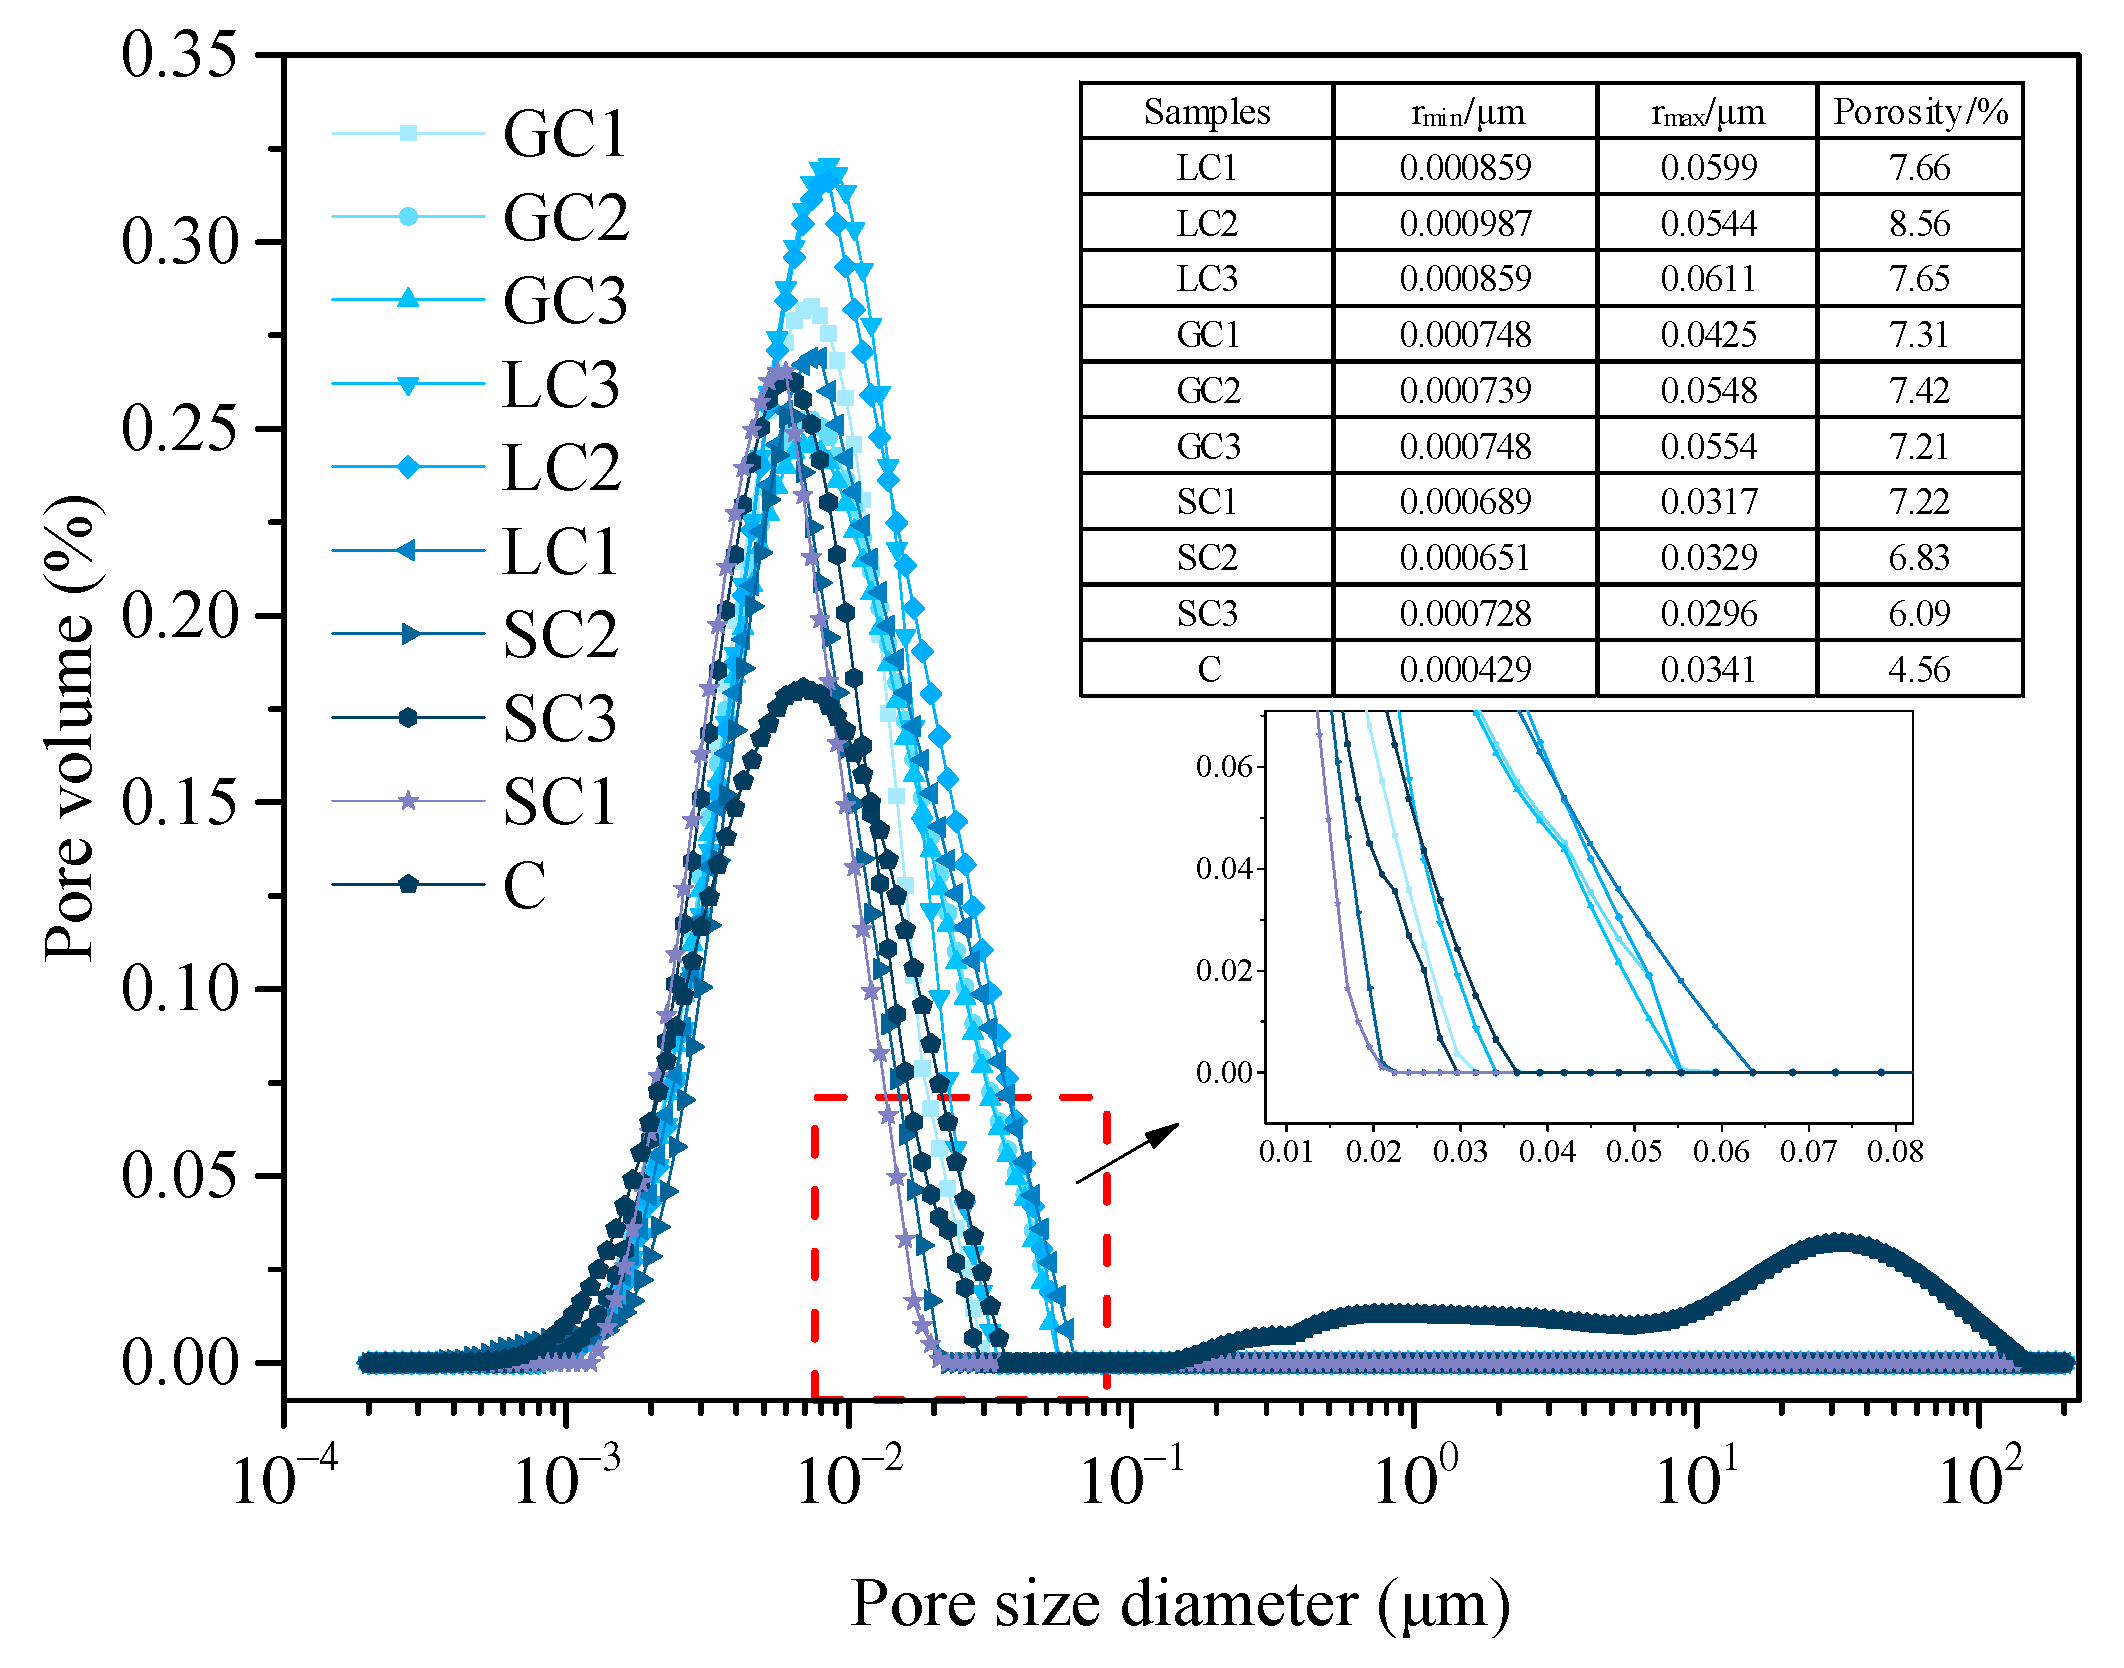
  • The samples for the Nuclear Magnetic Resonance (NMR) were a 2~3 mm block mortar of ITZ, and the samples were saturated with vacuum-saturation equipment (type: MesoMR12-040H-I). Subsequently, the saturated samples were wrapped in plastic film and placed inside the sample chamber. After finding the appropriate center frequency, the proper relaxation time and echo time were selected according to the sample and the pore size distribution curve was obtained. Finally, the porosity and pore size distribution curve of the samples were obtained by inversion.
  • The samples for the macro test were cylindrical specimens of 50 × 20 mm. Firstly, the samples were saturated with vacuum-saturation equipment. Subsequently, the saturated samples were placed inside the pressure chamber of cement-based materials steady-state permeation test equipment. According to the project operation environment, the seepage pressure was set at 2 MPa until the test ended.

3. Results

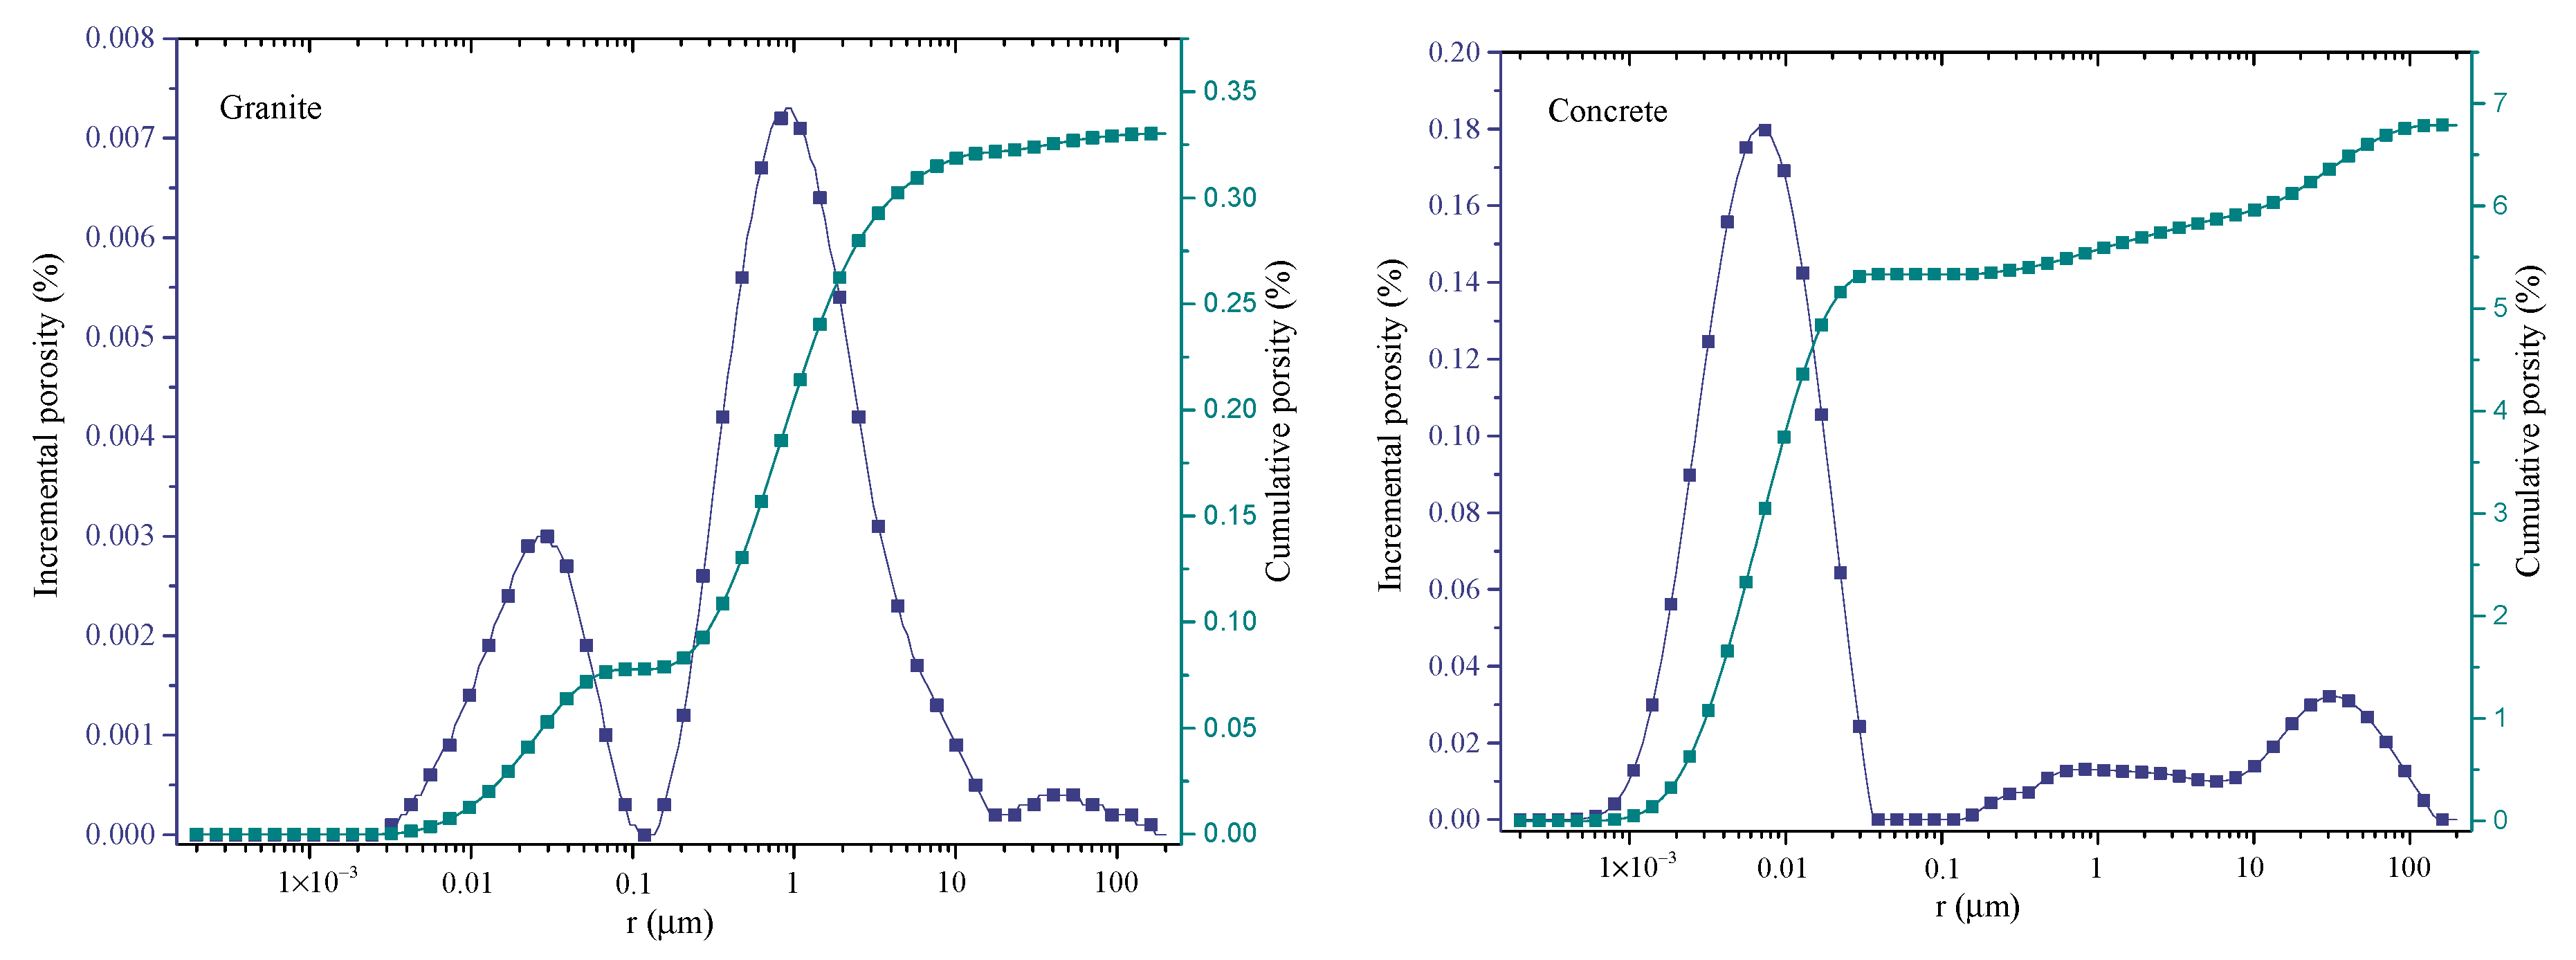
3.1. Pore-Structure of Bedrocks and Concrete

The porosity of limestone, granite, sandstone, and concrete is 0.52~0.64%, 0.31~0.48%, 16.5~17.8%, and 4.27~4.95%, respectively. Figure 3 shows the pore size distribution characteristics of the bedrock and concrete matrix. As shown in Figure 2, the pore size distribution of limestone ranged from 0.000802 to 4.709 μm with a peak size of 0.05 μm. In comparison, the pore size ranged from 0.03212 to 23.246 μm and from 0.001216 to 40.510 μm for sandstone. Compared with limestone, the pore size distribution of granite and sandstone drifts to the large pore, and the peak sizes are about 1μm and 3μm, respectively. The pore size of concrete ranged from 0.000429 to 0.0341 μm; 90% of the pore diameters are concentrated within 0.03 μm.
This study used Jullien’s aperture classification method [41]. Pores were divided into gel pores (0.00~0.01 μm), medium capillary pores (0.01~0.05 μm), large capillary pores (0.05~10.00 μm), and macropores (>10 μm). Figure 4 gives the pore size distribution ratios of three types of rocks and concrete. Granite and sandstone have similar pore size distribution curves, mainly composed of medium and large capillary pores (more than 90%). While limestone contains more gel pores, it has a smaller average pore size.
Since sandstone and granite contain more medium and large pores, the cement slurry will penetrate into the pores near the bedrock interface and accumulate in the rock joint’s surface area, forming a better interface structure. Limestone contains more gel pores than granite and sandstone, which leads to poor bonding of the concrete–rock interface. However, the infiltration of cement slurry is also affected by porosity. Therefore, the microstructure characteristics of different concrete–rock interface transition zones need further study.

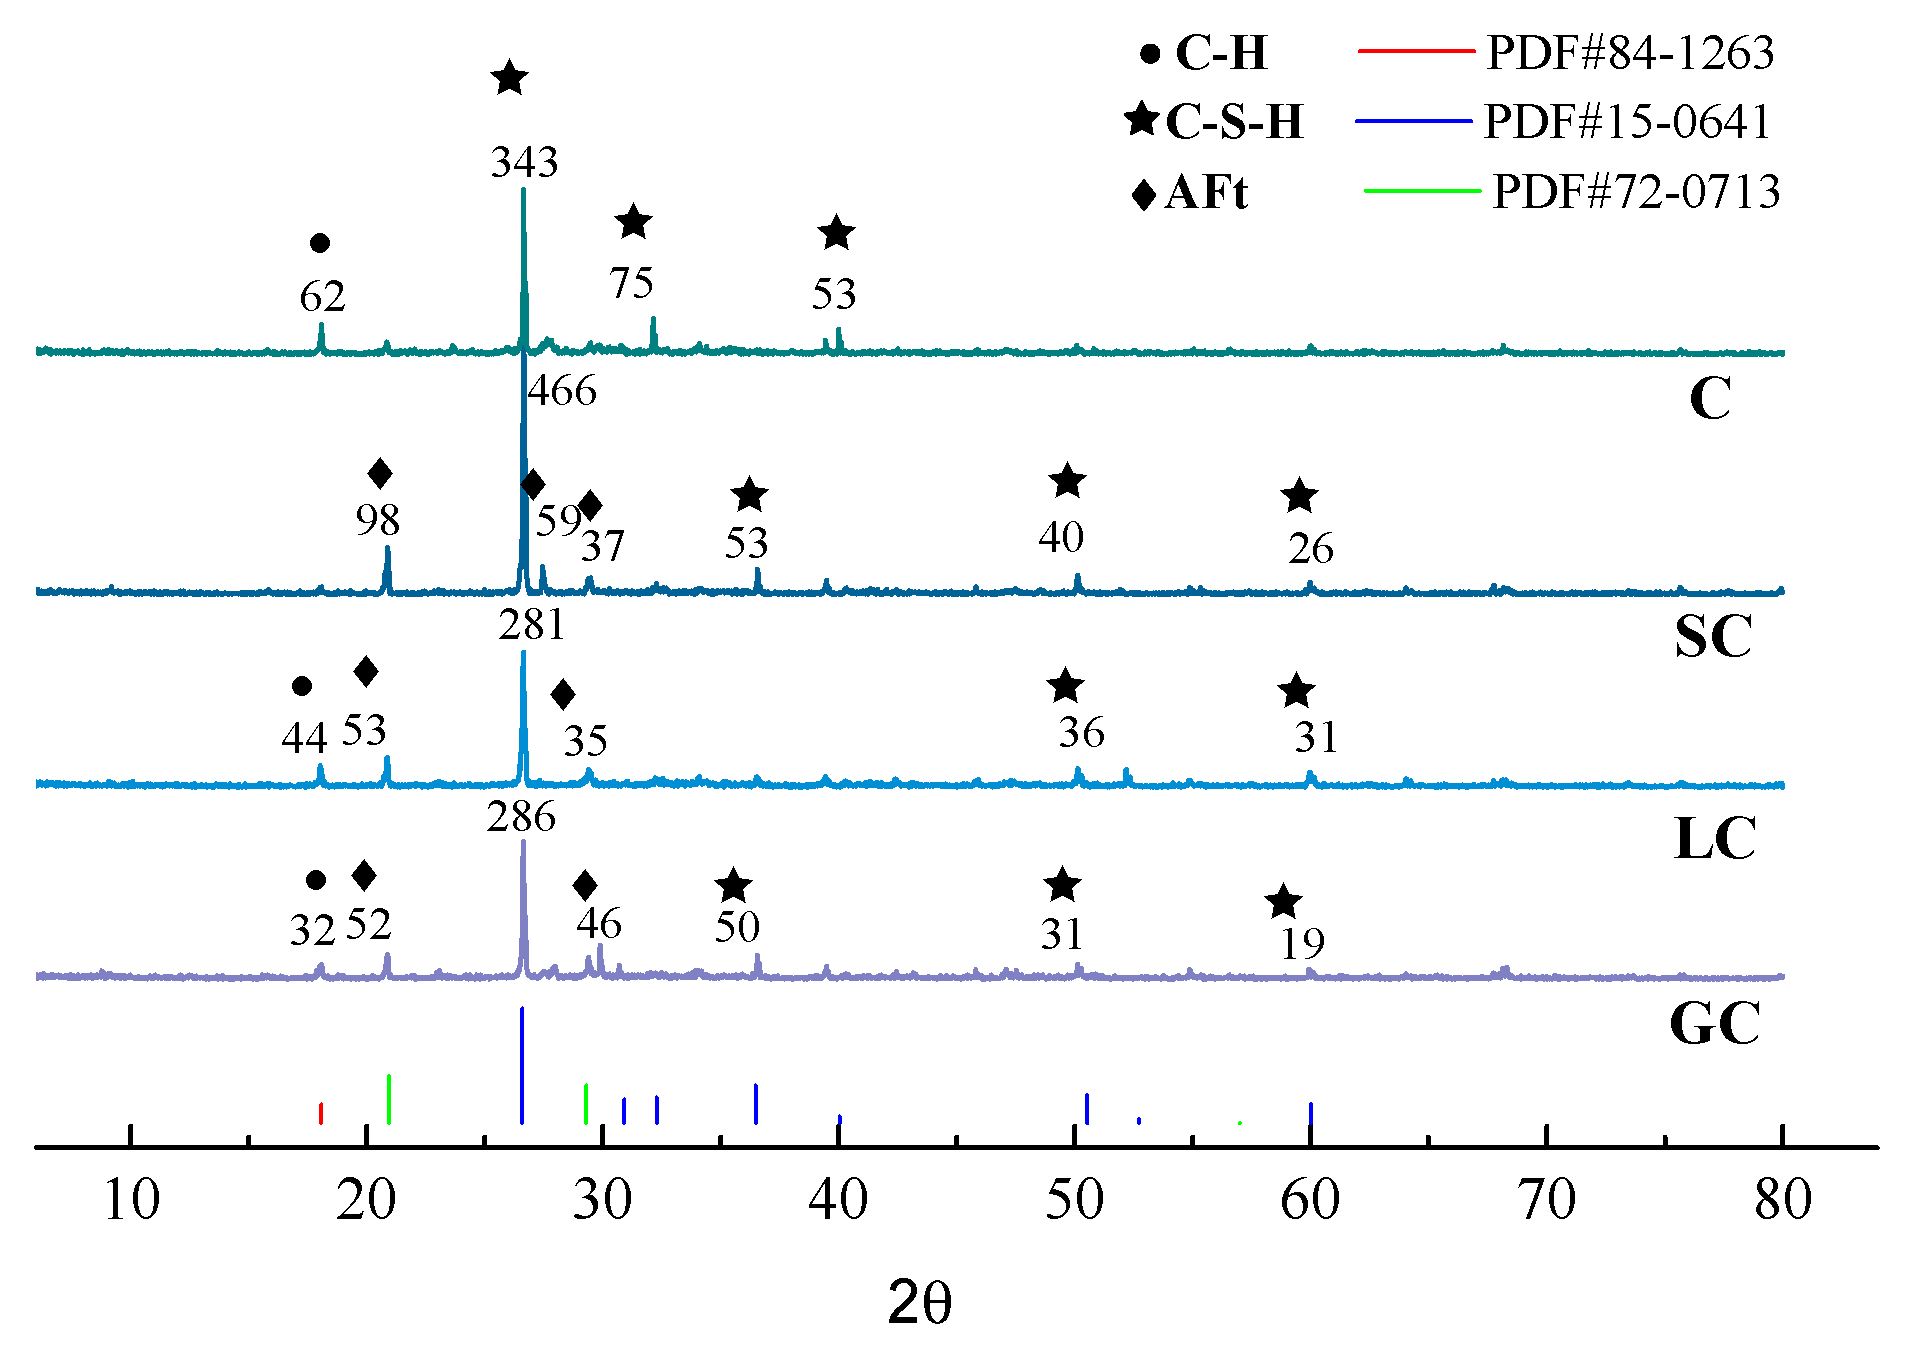
3.2. Calcium Compounds of ITZ

The bonding behavior between the rock and concrete is determined by the density of the ITZ and the content of calcium silicate hydrate (CSH) [42]. In order to investigate whether different phase compositions on the ITZ are related to rock types, the difference in hydration products on the surface was monitored by XRD. The XRD patterns in the range of 5–80° 2θ form the granite–concrete, sandstone–concrete, limestone, and concrete surface powders in Figure 5 with the same intensity scales. The crystalline phases identified in the ITZ include some typical cement hydration products, such as calcium hydroxide (CH), calcium silicate hydrate (CSH), and ettringite (Aft). The main hydration products are CSH gel, which is in line with the finding from [43].
Furthermore, the cement hydration products of concrete and the ITZ of rock and concrete are given in Figure 6. Previous studies have shown that the more CSH gel was formed, the denser ITZ was formed, and the more CH was formed, the higher the permeability of the ITZ [44,45]. XRD analysis shows that the content of CSH gel in the ITZ of concrete–rock is less than that of the cement slurry inside the concrete. This is because rock hinders the migration of water in the cement slurry, which makes water accumulate in the surface area of rock and forms a water film, providing a channel for the rapid migration of calcium ions, sulfate ions, and hydroxide ions. These ions eventually enrich at the rock interface and produce large amounts of calcium hydroxide and ettringite. The specimen around sandstone has the most hydrated products of CSH and has a lesser number of CH. In contrast, there is the least amount of CSH and the most amount of CH in the ITZ of limestone–concrete. The sandstone has the worst compactness from the pore structure characteristics of the three types of bedrock (the most significant porosity). The water absorption rate is much higher than that of limestone and granite, resulting in the lowest water–cement ratio in the sandstone–concrete interface transition zone. Compared with granite, limestone has the best compactness (minimum porosity), but macro pores dominate its pore size distribution. A larger pore can provide more contact surfaces and generate more CSH gel to fill micro-cracks and pores.

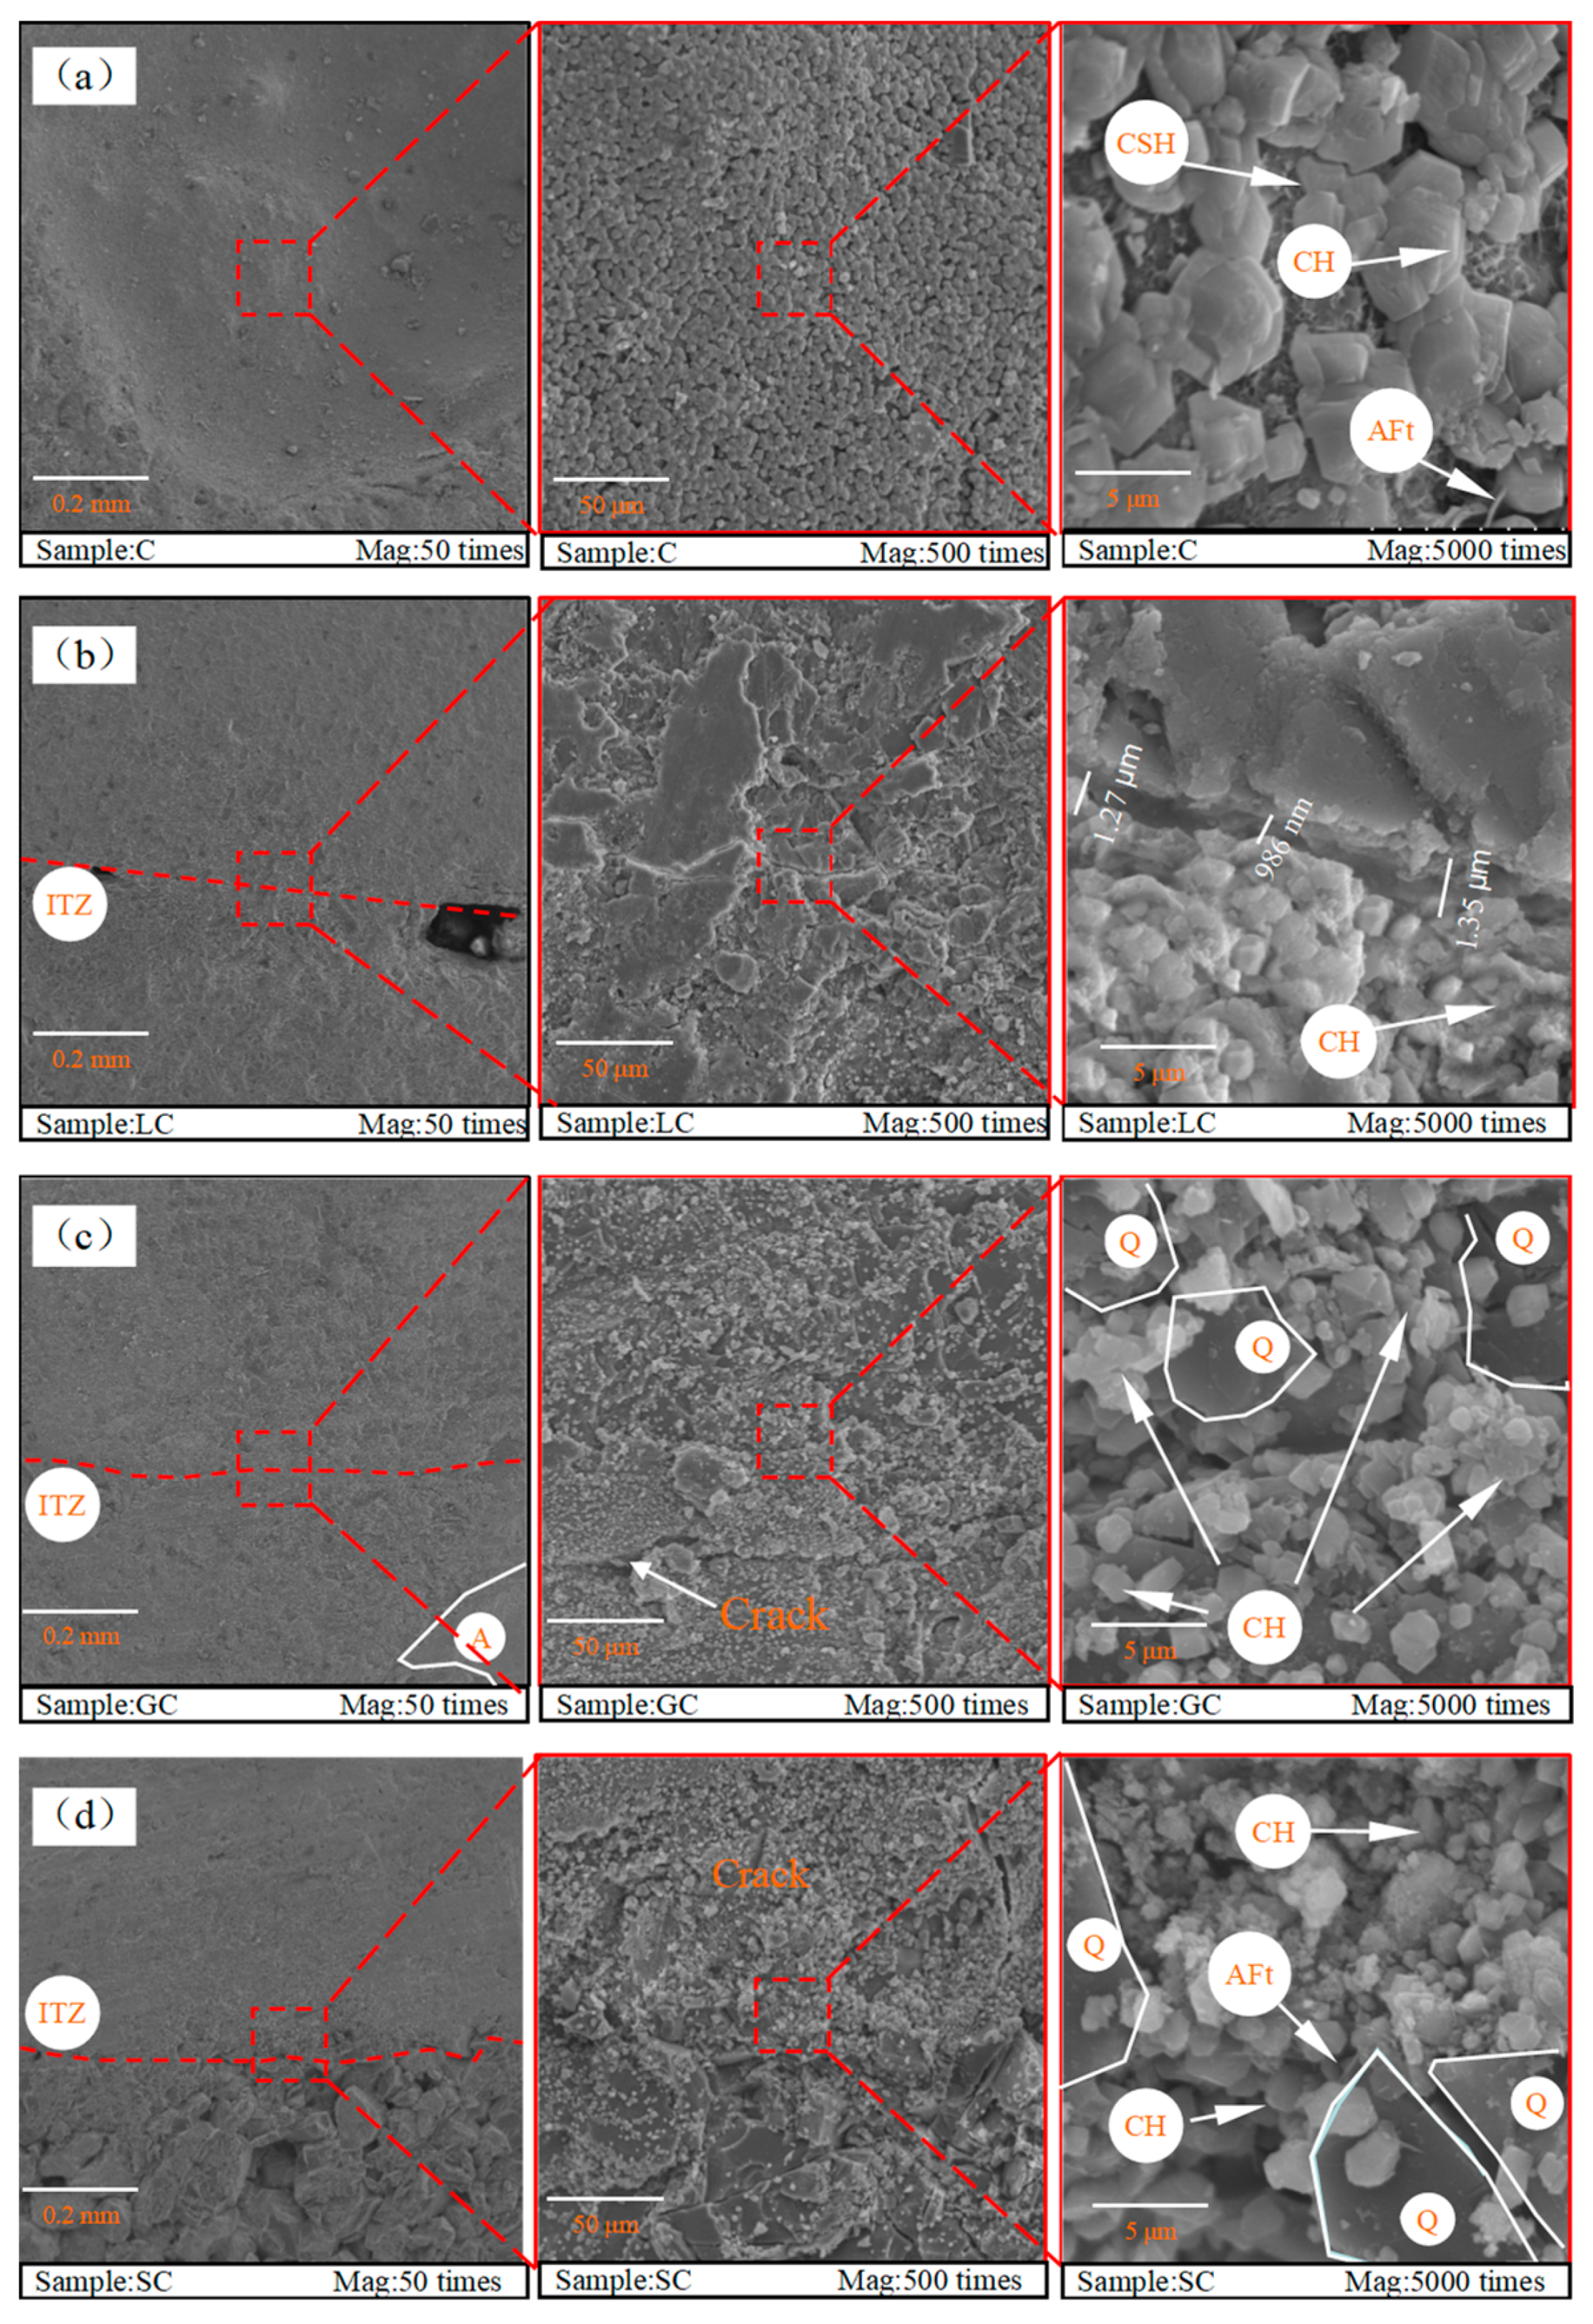
3.3. Thickness of ITZ

The content of CH in the ITZ was higher than the cement in the concrete, resulting in a region near the aggregate containing predominately fine particles and having a higher porosity [46]. Figure 7 shows the SEM images of concrete, limestone–concrete ITZ, granite–concrete ITZ and sandstone–concrete ITZ. In particular, three magnifications 100×, 500×, and 5000× were tested. As shown in Figure 7a, CSH gel, Aft and CH were formed on the concrete surface. The SEM images (Figure 7b) show no apparent boundary between limestone and concrete. However, at 5000× magnification, fractures can be easily observed, and the fracture width is measured at 1.08~1.35 µm. Compared with the limestone–concrete ITZ, the granite surface is layered and granular, strengthening the connection between rock and concrete. There is cement slurry immersion between the quartz and particle. We observed that a small amount of calcium hydroxide crystals were filled between the quartz particles so that the micro-cracks could not penetrate the entire observation area. The original “crack” is split into two pores with a diameter of about 3 µm. As for ITZ of sandstone and concrete, the interface area can be clearly observed due to the massive difference in pore size and pore structure between sandstone and concrete. There are no apparent pores on the surface of the concrete, and the shape is very dense, while the sandstone side is composed of pores and sandstone particles. The pores between the sandstone particles were covered with a cement hydration product. This result is consistent with typical laws of the aggregate influence on the micromorphology of the ITZ reported in the literature [7].
The hydration products in granite–concrete and sandstone–concrete specimens are uniformly filled with residual pores. They form a dense microstructure, especially sandstone–concrete, which can improve the permeability of the ITZ. On the contrary, the remaining pores in limestone are more significant than other pores. The hydration products such as CSH gel and Ca(OH)2 cannot fill up the remaining pore, which leads to a relatively loose microstructure. This is because the macroscopic pores inside the granite and sandstone increase the interface roughness. The rough interface restricts the shrinkage and deformation of the cement slurry during the hardening process, reducing the number of cracks in the ITZ region, and forming a better structural interface [47]. Therefore, under the three bedrocks, the sandstone–concrete interface has the tiniest cracks, followed by granite and limestone cracks developing the most.
Furthermore, the specimens with three different types of rock were measured using SEM-EDX, and the test results of Ca and Si are shown in Figure 8. The horizontal axis represents the distance from the rock to bulk cement paste in concrete, and the vertical axis is the mass element ratio. According to the linear distribution of Ca and Si elements in the ITZ region, the ITZ thicknesses of LC, GC, and SC are 155 μm, 105 μm, and 95 μm, respectively. By using granite, Xie et al. [48] observed similar results that the width of the ITZ is extended from around 60~150 μm. Moreover, the LC sample has the widest thickness. The mineral composition and surface structure of rock will affect the generation and growth of hydration products, especially for CH and Aft [45]. Combined with the ITZ XRD and SEM results, the difference in the micromorphology and phase content can lead to the difference in the thickness in the ITZ.

3.4. Pore Structure of ITZ

Referring to the research method of the ITZ pore structure in the literature [7], the pore characteristics of the mortar between 2 to 3 mm around the rock were measured by NMR imaging system to characterize the influence of different types of rock on the pore structure of the ITZ. The results are shown in Figure 9.
The total porosity measured by NMR is summarized in the table in Figure 9. The cement slurry is composed of less porosity than the ITZ. Of all the samples examined, the ITZ between limestone and concrete had the largest porosity at 7.56~8.56%, followed by granite–concrete samples, which were between 7.21 and 7.43%, and the porosity of the sandstone–concrete samples was the smallest at 6.09~7.54%. This may be caused by the different micro-roughness of the rock foundation. Existing research shows that the micro-roughness also dramatically influences the formation of the ITZ. It is believed that the delicate pores on the surface contribute to the production of hydration product crystals, forming a state of interlaced occlusion [49]. There are many macro and micro pores between sandstone particles, which provide much space for the growth and infiltration of cement slurry hydration products, improving the physical bonding performance between rock and cement slurry, obtaining the optimal interface transition zone. As for limestone and granite, the ITZ porosity of their bedrocks is similar, and the former is slightly larger than the latter. This is because the porosity of the two bedrocks is identical, while the pore size distribution is somewhat different, and granite contains more medium and large capillary pores, which increases the micro-roughness of the bonding surface and forms a better ITZ.
Figure 9 illustrates the pore size distribution curves of the different rock ITZs. The pores of the mortar around the limestone, granite, and sandstone are distributed in the range of 0.859~61.1 nm, 0.739~55.4 nm, and 0.698~29.64 nm, respectively. These test results are similar to the pore size distribution curve measured by Wu et al. [50] for the ITZ of the aggregate–cement slurry interface, and the pore size was concentrated between 1 nm and 100 nm. Compared with the specimen of concrete, the pore size distribution curves of the ITZ around the limestone and granite shift to the right (to a larger size), the proportion of harmless pore around the rock decreases, and the pore size of the mortar around the limestone and granite are similar. However, for the cement slurry on the limestone side, with more pore content and large critical pore size, this may be attributed to the pores of mortar around the limestone and are not refined. For the cement slurry on the sandstone side, the pore structure of the transition zone was significantly improved compared to the matrix and the other two types of bedrock. The result is similar to the observation result of the light aggregate–cement slurry interface [51].

3.5. Permeability of ITZ

The permeability of the rock, concrete and concrete–rock mixed samples can be obtained through the permeability test, but the permeability of the ITZ needs further calculation. Rock and concrete are two materials with different properties, similar to the stratum composed of different thin layers. The concrete–rock samples can be regarded as a layered porous medium for the one-dimensional seepage in the seepage test. Figure 10 shows the layered porous medium. Assume that K1, K2, and K3 are the permeability coefficients of the concrete layer, the rock base layer, and the bonding surface layer, respectively, and b1, b2, and b3 are the corresponding layer thicknesses. Using Darcy’s law to calculate the traffic Q of each layer, the total traffic should be equal to the sum of the traffic of each layer:
Q = i = 1 3 Q i = i = 1 3 K i b i L Δ P L
where L is the seepage length, Δ P L is the hydraulic gradient, constant during calculation.
It is assumed that the sample has an equivalent permeability coefficient KP, under the same hydraulic gradient, there should be the same flow through the sample:
Q   =   K P JA   =   K P bL Δ P L
Combining Equations (1) and (2), we obtained:
K P = i = 1 3 K i b i b
Since the permeability of sandstone is much higher than that of concrete and the ITZ, the permeable porous medium preferentially penetrates from the sandstone side during the test. The permeability of the ITZ cannot be obtained through sandstone, concrete, and sandstone–concrete binary samples. Therefore, the permeability of the ITZ in sandstone–concrete is not analyzed here. Up to now, many scholars have carried out experimental research on the permeability of granite and limestone and given the permeability test data of rock samples with different porosity, as shown in Figure 11. In the following studies, water was used as the permeable fluid. Compared with the results of this experiment, the limestone porosity range of Li et al. [52] was more extensive (1~9%), resulting in higher permeability. Selvadurai et al. [53,54] selected the limestone porosity in the range of 0.33~0.46%, and the permeability obtained in the test ranged from 1.17 × 10⁻²⁰ m2 to 6.5 × 10⁻²⁰ m2. The porosity of the limestone samples selected in this paper was 0.52~0.64%, which is similar to the limestone selected by Selvadurai, so the obtained results are also similar (3.34 × 10⁻²⁰~4.12 × 10⁻²⁰ m2). Figure 11 also plots the permeability test results of granite with different porosity (0.3~1%) by Chen et al. [55], Feng et al. [56], He [57], Jiang et al. [17], and Tian et al. [58], which were consistent with the permeability of granite in this experiment.
Figure 12a presents the permeability test results for limestone, concrete, and limestone–concrete binary specimens. Under the same seepage pressure, when the permeability coefficient tends to be stable, the permeability of the limestone–concrete binary specimen is significantly larger than that of the limestone or concrete specimen alone. Considering the existence of the transition zone at the limestone–concrete interface, the overall permeability of the binary sample increases by 30.1%. Based on the above results, the permeability coefficient of the ITZ was further calculated according to Formula (3). As shown in Figure 12, the ITZ permeability was 10−18 m2, two orders of magnitude larger than rock and concrete. Therefore, the limestone–concrete ITZ contributed most of the seepage channel of the sample.
Figure 12b presents the permeability test results for granite, concrete, and granite–concrete binary specimens. From the figure, it can be seen that under the same test conditions, the penetration test results of the granite–concrete binary specimen and the limestone–concrete binary specimen were similar. The permeability of the binary samples was greater than that of the granite or concrete samples alone. The ITZ penetration is much greater than the permeability of the matrix on both sides of the interface. However, compared with the limestone–concrete binary test, granite with minor porosity bonded with concrete to form samples with lower permeability. Combined with the SEM observation results, it is believed that the bonding of granite and concrete creates a better ITZ, which optimizes the impermeability of the binary body.

4. ITZ Permeability Model Based on the Fractional Theory

Most of the empirical formulas used to verify the permeability of the ITZ are established based on the fluid flow in porous media. First, they ignore that there are many micro-cracks at the concrete–rock interface, especially for the interface with poor bonding. Secondly, the median pore roar content and its connectivity are vital parameters determining permeability. The pore content in the porous media permeability model needs to be corrected. Based on the pore structure characteristics of the ITZ, we propose a dual-porosity medium model including fractures and pores. Figure 13 shows the schematic diagram of water transport in ITZ. Considering that the existing permeability models contain parameters with no apparent physical meaning, a permeability model of dual-porosity media based on the fractal theory was proposed.
The pore size distribution was assumed to obey the following fractal power law:
N λ r = r r max P r d r = r max / r D f
where N is the number of holes, λ and r is the pore radius, D f is the fractal dimension of pore distribution, P r is the pore distribution probability function:
P r = r max / r D f = D f r max D f r D f + 1
According to the fractal distribution of pores on the interface, the total pore area of the cross-section can be calculated by the following formula:
A p = r min r max π 4 r 2 d N = π D f r max 2 4 2     D f 1 ϕ capillary A p = r min r max r e d N = D f e r max 1     D f 1 r min r max 1     D f crack
where ϕ is the porosity, e is the aperture of the crack
Relationship between porosity and fractal dimension of porous media:
D f   =   d E ln ϕ / ln r min / r max
Porous media of rock and concrete are usually defined as a structure composed of pores of different sizes, randomly distributed in space and maybe randomly connected to form curved capillary channels. The tortuosity of the capillary pores is defined as the ratio of capillary real length Lτ(r) to actual length L0. According to Yu et al. [59]:
L τ r = L 0 D T r D T 1
τ r = L τ r L 0 = L 0 R D τ 1
The bending fractal dimension DT is used to describe this bending degree in the fractal model:
τ a v = r min r max τ r P r d r = D f D f   +   D T     1 N r min D T 1 D T = 1   +   ln τ a v D f   +   D T     1 / D f ln N / r min N r min = r max r min π 4 D f 2     D f 1     ϕ ϕ
where τ a v is average curvature, τ r is the curvature of a pore with a diameter of r, other parameters are consistent with the above annotations.
According to the existing tortuosity calculation model, the average tortuosity of the sample is obtained, and the tortuosity fractal parameter DT of the porous medium is obtained by simple iterative calculation combined with Formula (10).
For two different materials, rock and concrete, due to the difference in the microstructure and phase composition of the two, a weak area will be formed near the bonding surface. Assuming that the rock base surface is composed of a series of tree-like fracture meshes, there is a fractal proportional relationship between the number of fractures and the fracture gap. According to Xu [60], the flow in the fractal tree-like crack network can be expressed as:
q 1 = e r 2 + D T 2 + D T 2 1 + D T L 0 D T 1 ρ g μ Δ p L 0
where ρ is the density of water, g is the gravitational acceleration, μ —the viscosity coefficient of water, Δ p is the difference value of pressure.
According to the above fractal theory:
Q 1 = r w r max q ( r ) P ( r ) d r = e D f r max D f l 0 D T 1 2   +   D T 2 1 + D T ρ g μ Δ p l 0 r w r max r 1 + D T D f d r = e D f r max 2 + D T 2   +   D T 2 1 + D T l 0 D T 1 ρ g μ Δ p l 0 1 2   +   D T     D f 1 r min r max 2 + D T D f
According to Darcy’s Law:
Q 1 = k ρ g μ Δ p L 0 A
Combine the above formulas:
k f = ϕ 1 1 D f r max 1 + D T 2 + D T 2 + D T D f 2 1 + D T l 0 D T 1 1 r min r max 2 + D T D f 1 r min r max 1 D f
In the ideal hydrodynamic model, based on the Hagen–Poisseuille law governing steady flow, the single-width flow rate of liquid flow in a capillary is:
q 2 = π r 4 8 ρ g μ Δ p L
For the wide range of pore size distribution in the concrete material, pores in some pore size ranges contribute in a minor or even negligible way to the material’s permeability. Adopting Jullien’s [41] pore size classification method, pores between 0.01 and 10 μm are capillary pores that affect material permeability. Therefore, when the permeability classification model calculates the material’s permeability, the pore structure parameters (effective porosity, irreducible water ratio) need to be screened and corrected.
Calculation of effective porosity:
ϕ = V pore V = r w r max π r 2 L 0 P r dr L 0 A = ϕ 1 r w r max 2 D f 1 r min r max 2 D f
where ϕ is the effective porosity of the material, Vpore is the effective pore volume, V is the overall volume of the material, rw is the minimum pore size that affects the permeability of the material.
The proportion of pores with a pore size smaller than rw:
s w = V w V pore = r w 3 D T D f r min 3 D T D f r max 3 D T D f r min 3 D T D f
where Vw is the volume occupied by pores with a pore size smaller than rw.
According to the pore size distribution characteristics of the concrete, the flow in a single capillary is integrated to obtain the total flow of material:
Q 2 = r w r max q ( r ) P ( r ) d r = Δ p ρ g π D f r max D f 8 μ L 0 D T r w r max r 2 + D T D f d r = ρ g Δ p 8 μ L 0 D T π D f r max D f 3   +   D T     D f r max 3 + D T D f r w 3 + D T D f
Combining Equation (17) and Equation (18), we obtained:
k p = 2     D f r max D f 2 2 3   +   D T     D f L 0 D T 1 ϕ 1     ϕ r max 3 + D T D f r w 3 + D T D f = 2 D f r max 1 + D T 2 3 + D T D f L 0 D T 1 ϕ 1 ϕ 1 r min r max 3 D T D f + s w 1 r min r max 3 D T D f 3 + D T D f 3 D T D f
Finally:
k = k f   +   k p = ϕ 1 D f r max 1 + D T 2 + D T 2 + D T D f 2 1 + D T l 0 D T 1 1 r min r max 2 + D T D f 1 r min r max 1 D f   + 2 D f r max 1 + D T 2 3 + D T D f L 0 D T 1 ϕ 1 ϕ 1 r min r max 3 D T D f + s w 1 r min r max 3 D T D f 3 + D T D f 3 D T D f
Table 2 lists some of the models available for the porous media permeability estimation: the fracture model proposed by Monachesi and Guarracino [61], the pore model proposed by YU B [62] and the XY model proposed by Xu and Yu [63] based on the KC model. The comparison between the calculated results of those models and the experimental data reported in Section 3.4 is shown in Figure 14. The results show that the permeability values calculated from the proposed model, pore model, KC model, and XY model were close to the experimental data, with the order 10−18 m2. They were noted that the fracture model gave a worse result than others. It may be that the fracture model ignores the tortuosity of the permeable channel, assuming that the permeable channel is a simple cross model. However, the ITZ texture consists of mineral grains of various shapes and sizes, and its pore structure is highly complex.
Figure 15 shows the calculated deviation results. The deviation for the proposed model, pore model, and XY model was calculated to be 0.21 × 10⁻¹⁸ m2, 1.325 × 10⁻¹⁸ m2, and 1.369 × 10⁻¹⁸ m2, respectively. The representative comparison shows that the proposed model provides a perfect prediction with experimental data and those predicted from the other models.
Figure 16 shows the percentage of permeability of micro-fractures and pores for samples. For all samples, the penetration caused by micro-fractures accounts for more than 50% of the total penetration, which indicates that micro-fractures have a more significant effect on fluid flow than a pore in the transition zone of the concrete–rock. For the lim-stone-concrete samples, the contribution of micro-fractures to the penetration reaches up to 82%. The calculation result supports that the bedrock with higher macropore content provides more space for cement slurry infiltration and reduces the number of microcracks. Little research compares the effects of microcracks and pores on permeability, but the above observation results are consistent with the current experimental and theoretical results [64,65,66].

5. Conclusions

This study investigated the effect of rock types on the calcium compounds, thickness, pore structures, and permeability of the ITZ. The main intention was to quantitatively describe the microstructure characteristics of the ITZ to understand the link between microstructure and macro seepage properties. The main conclusions are as follows:
(1)
The main hydration products in the concrete–rock ITZ are CSH gel, CH, and Aft. The CSH gel content in different ITZs is between 72.5 and 75.1%, less than the cement slurry in the concrete, which is 88%. The sandstone–concrete ITZ has the highest CSH content and lowest CH content. In contrast, the limestone–concrete ITZ has the highest CH content and lowest CSH content. The CSH content is closely related to the rock particle size. The ITZ formed by coarse-grained rocks has high CSH content.
(2)
The thickness of concrete–rock ITZ is between 95 and 155 μm, the porosity is between 6.09 and 8.59%, and the pore size distribution is between 0.698 and 61.6 nm. Compared with the cement slurry–aggregate ITZ, the concrete–rock ITZ has more micro-cracks and larger thickness, while its range of pore size decreases. The difference in the micro-morphology and phase content leads to the difference in the thickness in the ITZ.
(3)
The porosity and pore size distribution properties of bedrock have significant effects on the microstructure characteristics of the ITZ. The microstructure of the sandstone–concrete ITZ is the densest, followed by granite–concrete ITZ, and the limestone–concrete ITZ is the loosest. Macro-pores increase the roughness of the interface, which will limit the shrinkage and deformation of cement slurry in the hardening process, reduce the number of cracks in the ITZ area, and form a better structural interface.
(4)
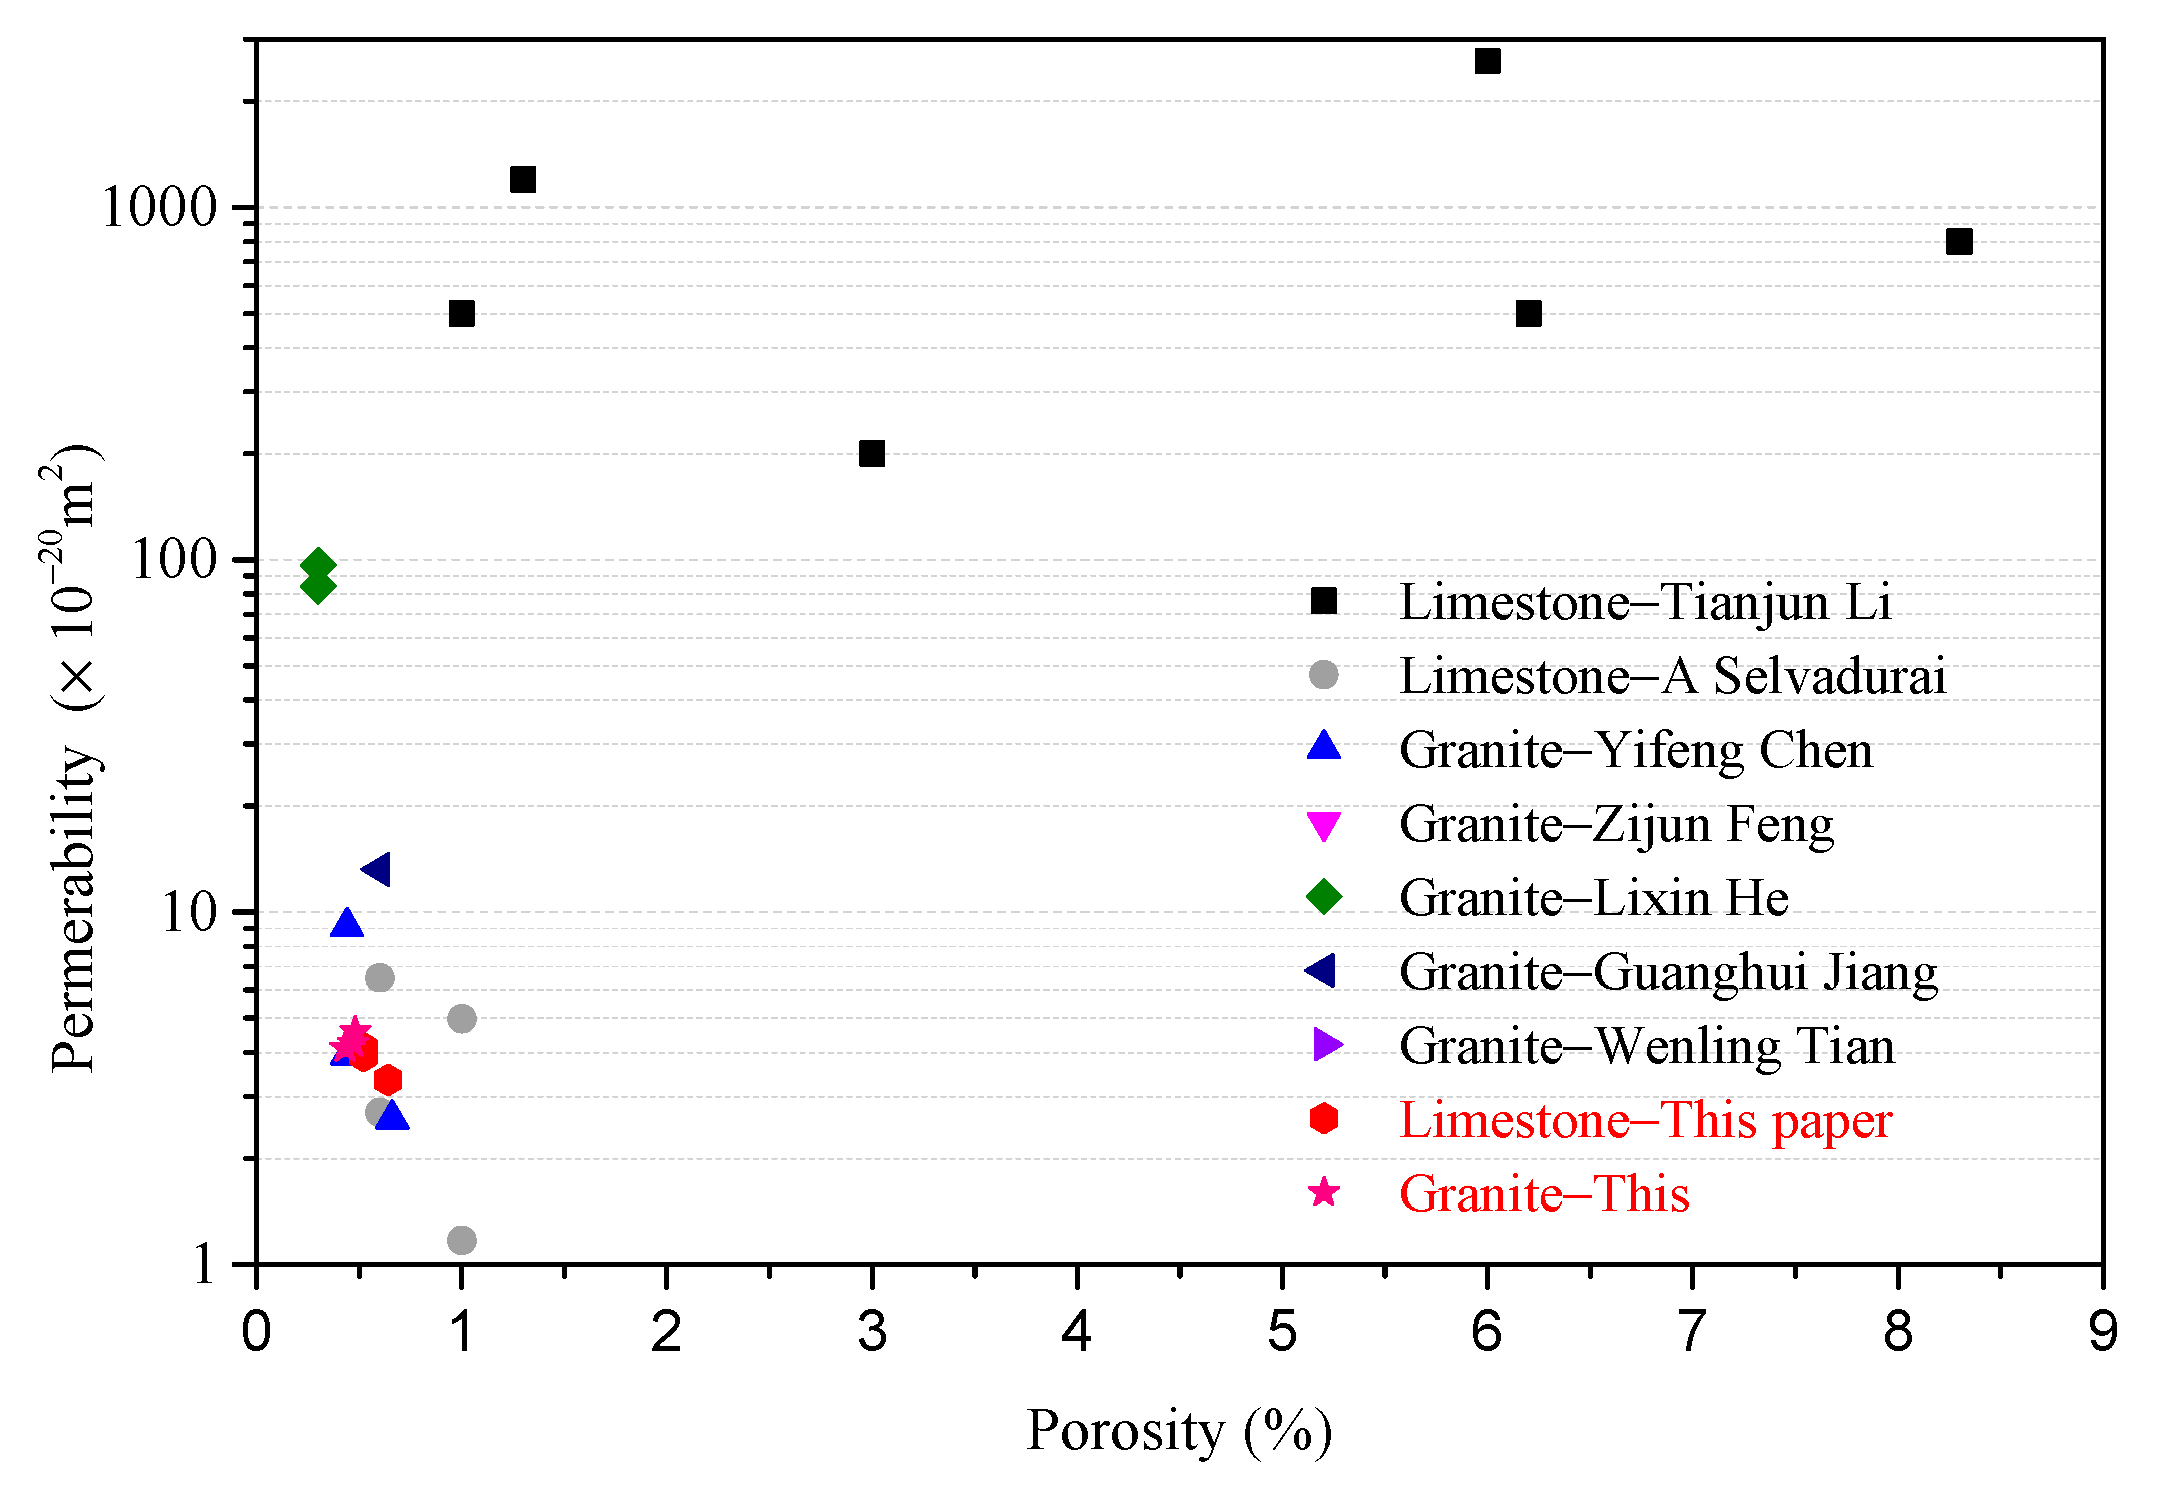
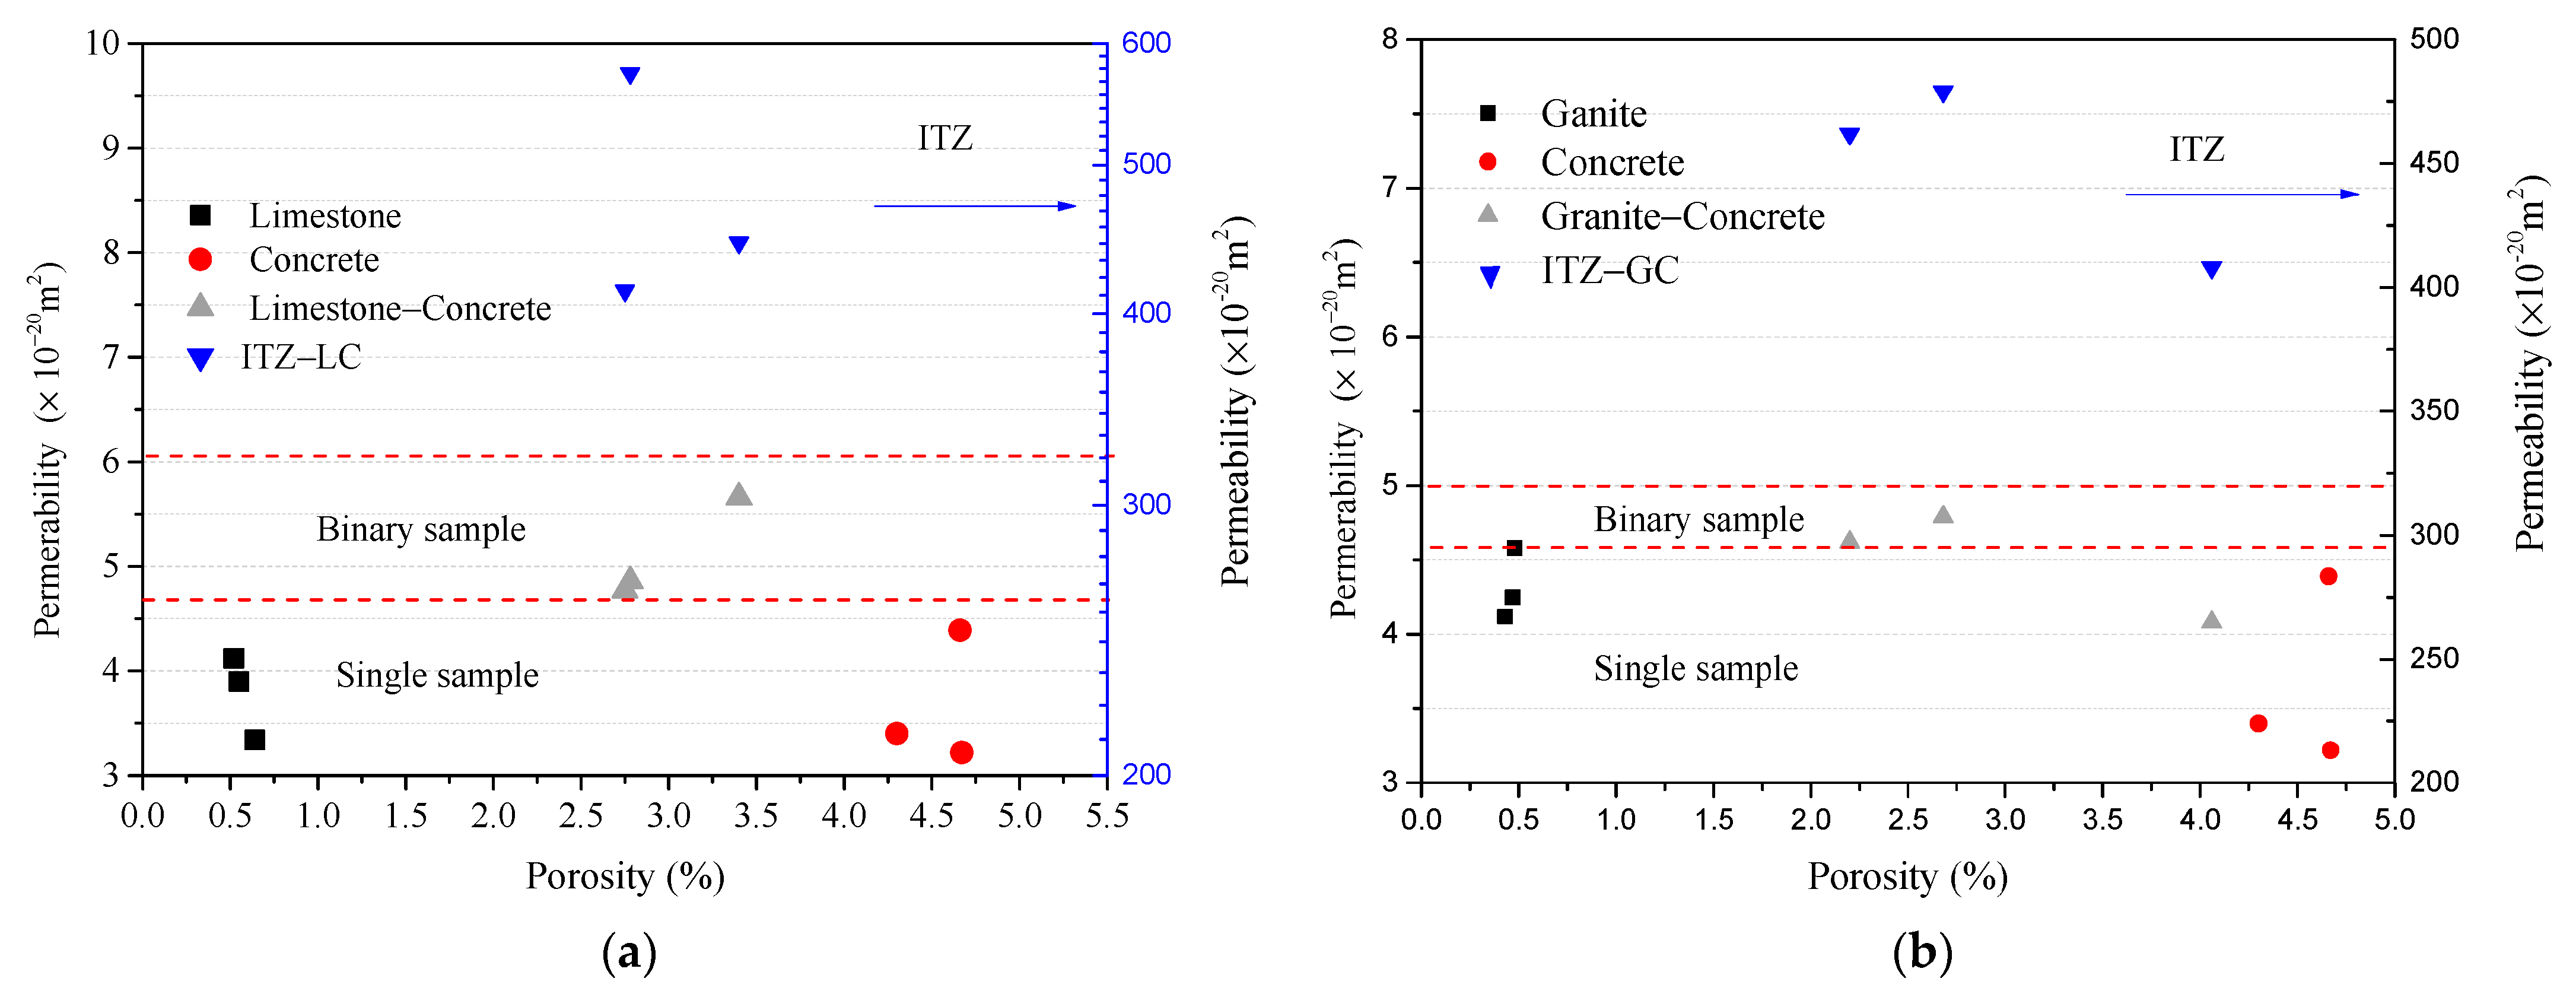
The impermeability of sandstone and concrete binary structure is not affected by the existence of a bonding interface. However, when limestone and granite (low porosity) are used as bedrocks, the ITZ has a significantly higher permeability. The ITZ permeability between 4.08 × 10⁻¹⁸ m2 and 5.74 × 10⁻¹⁸ m2 was two orders of magnitude larger than the permeability coefficient of rock and concrete.
(5)
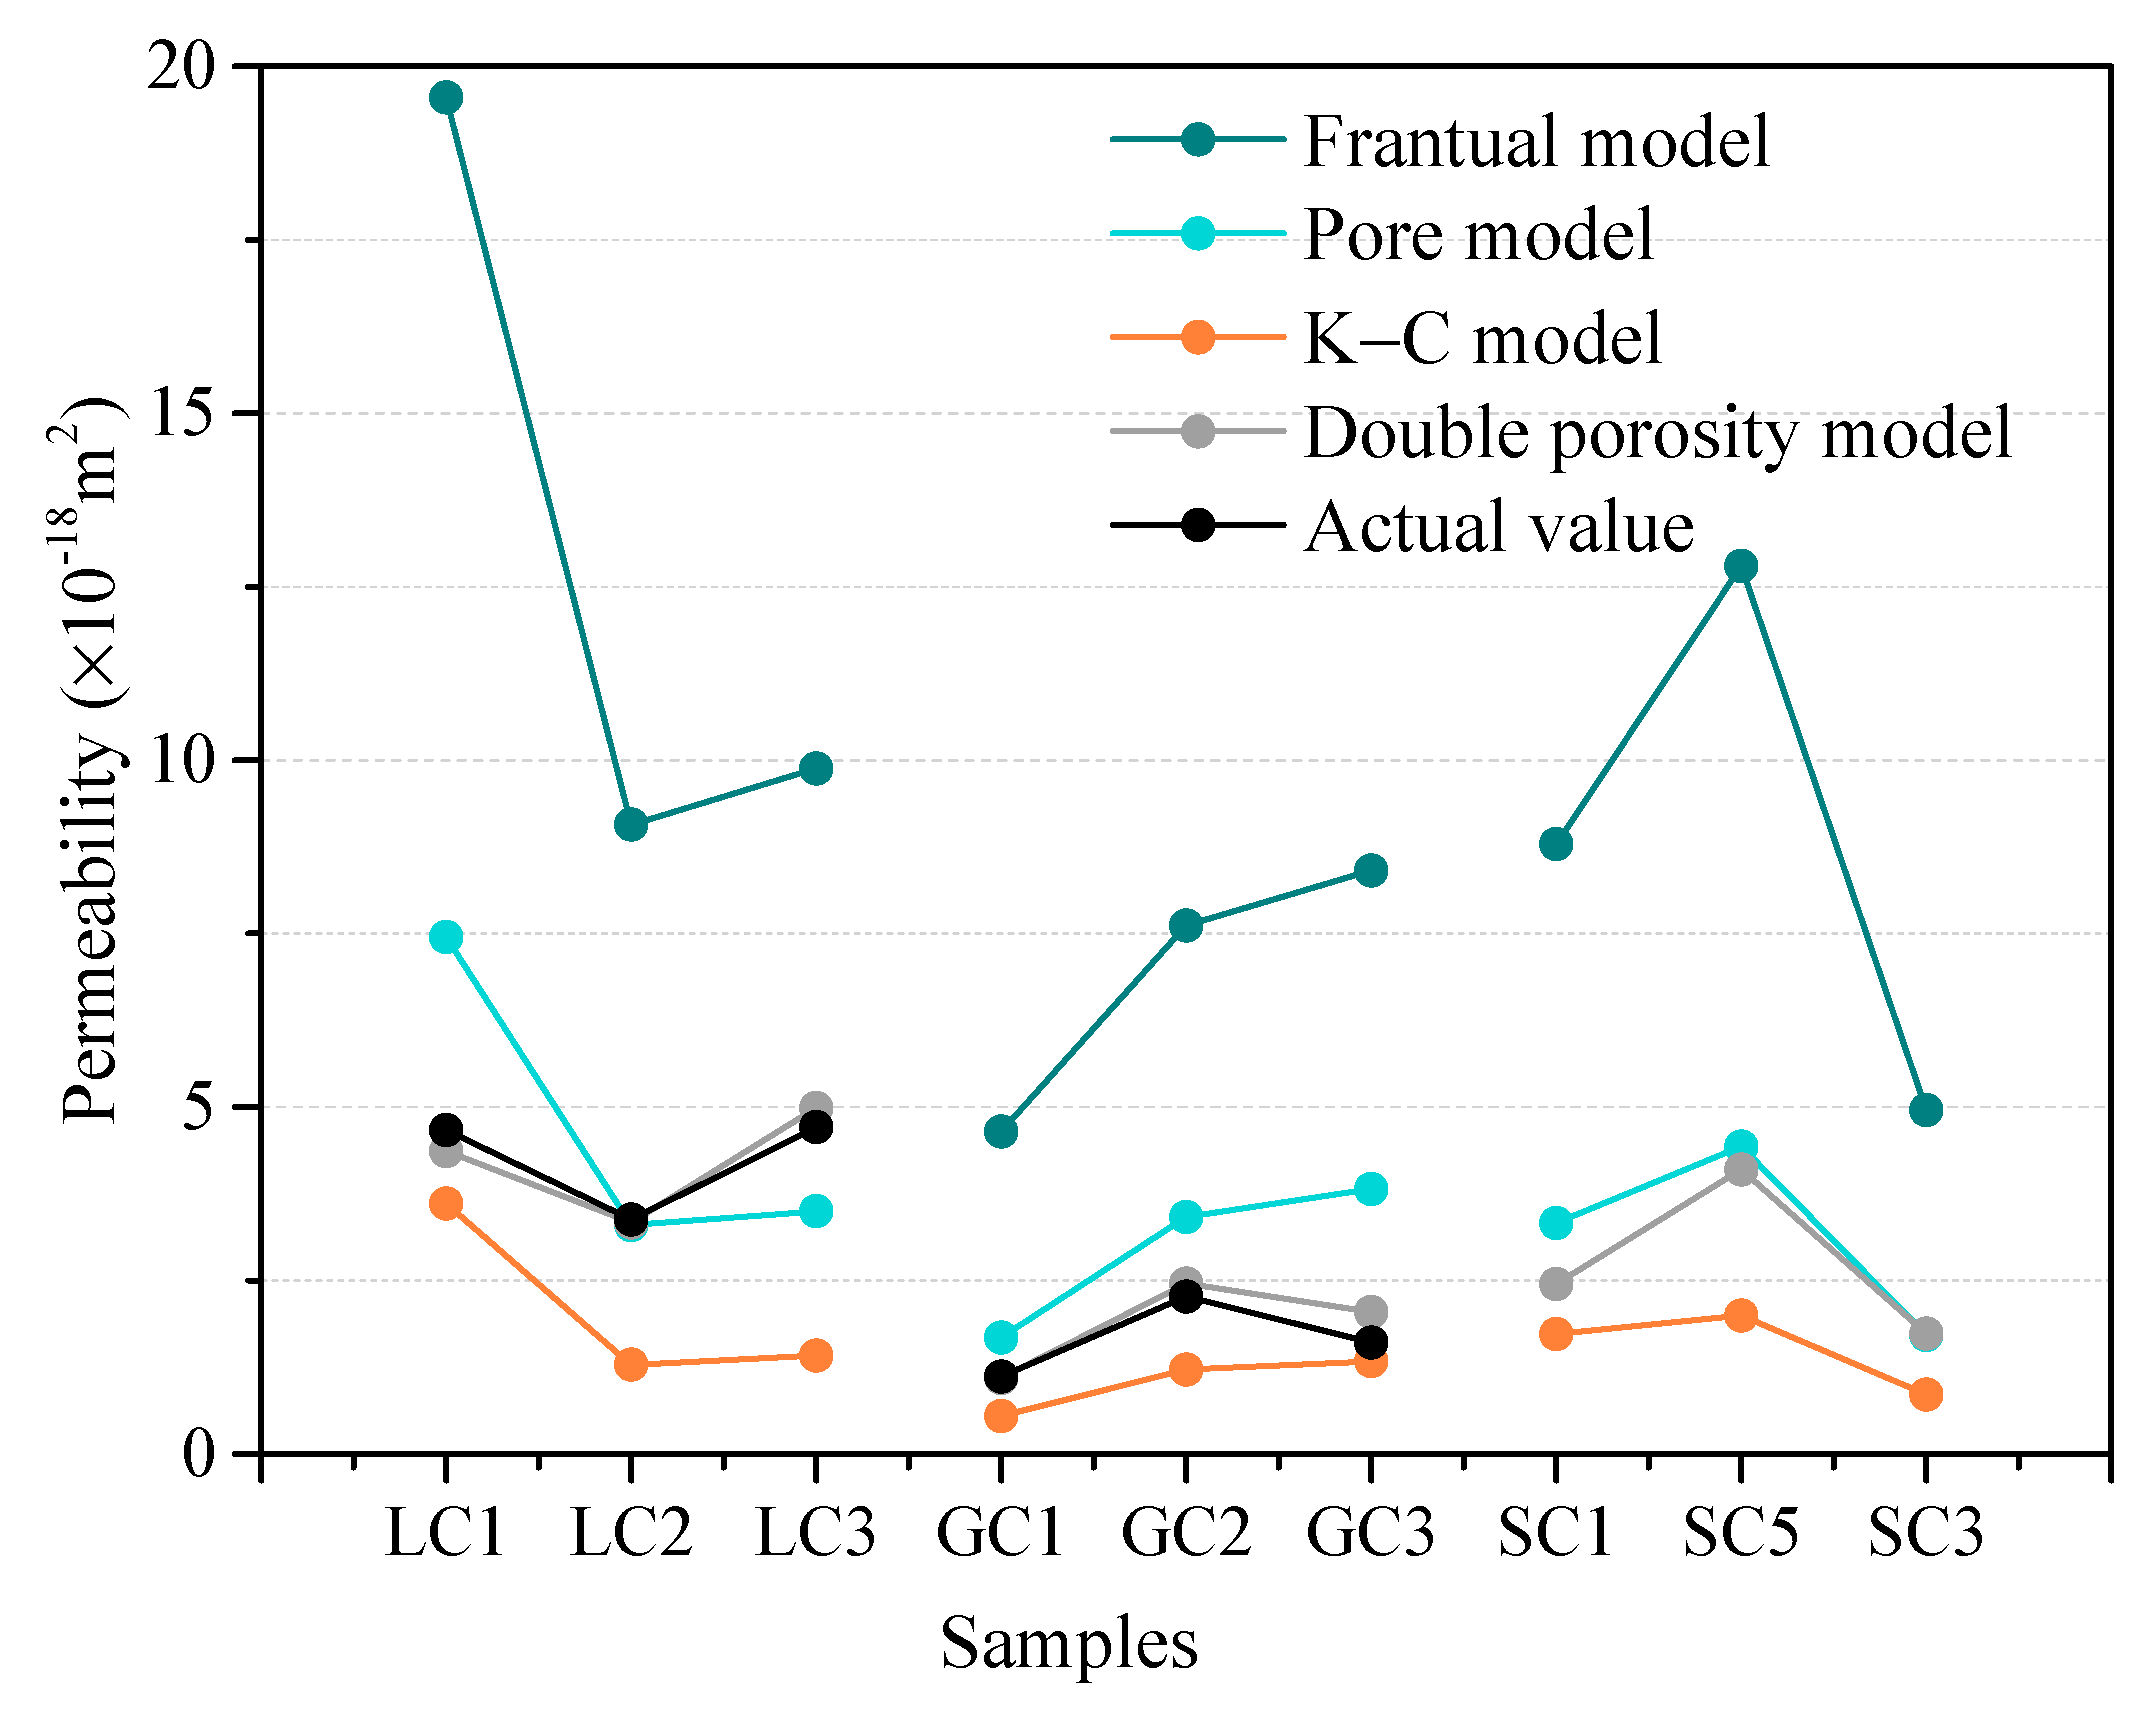
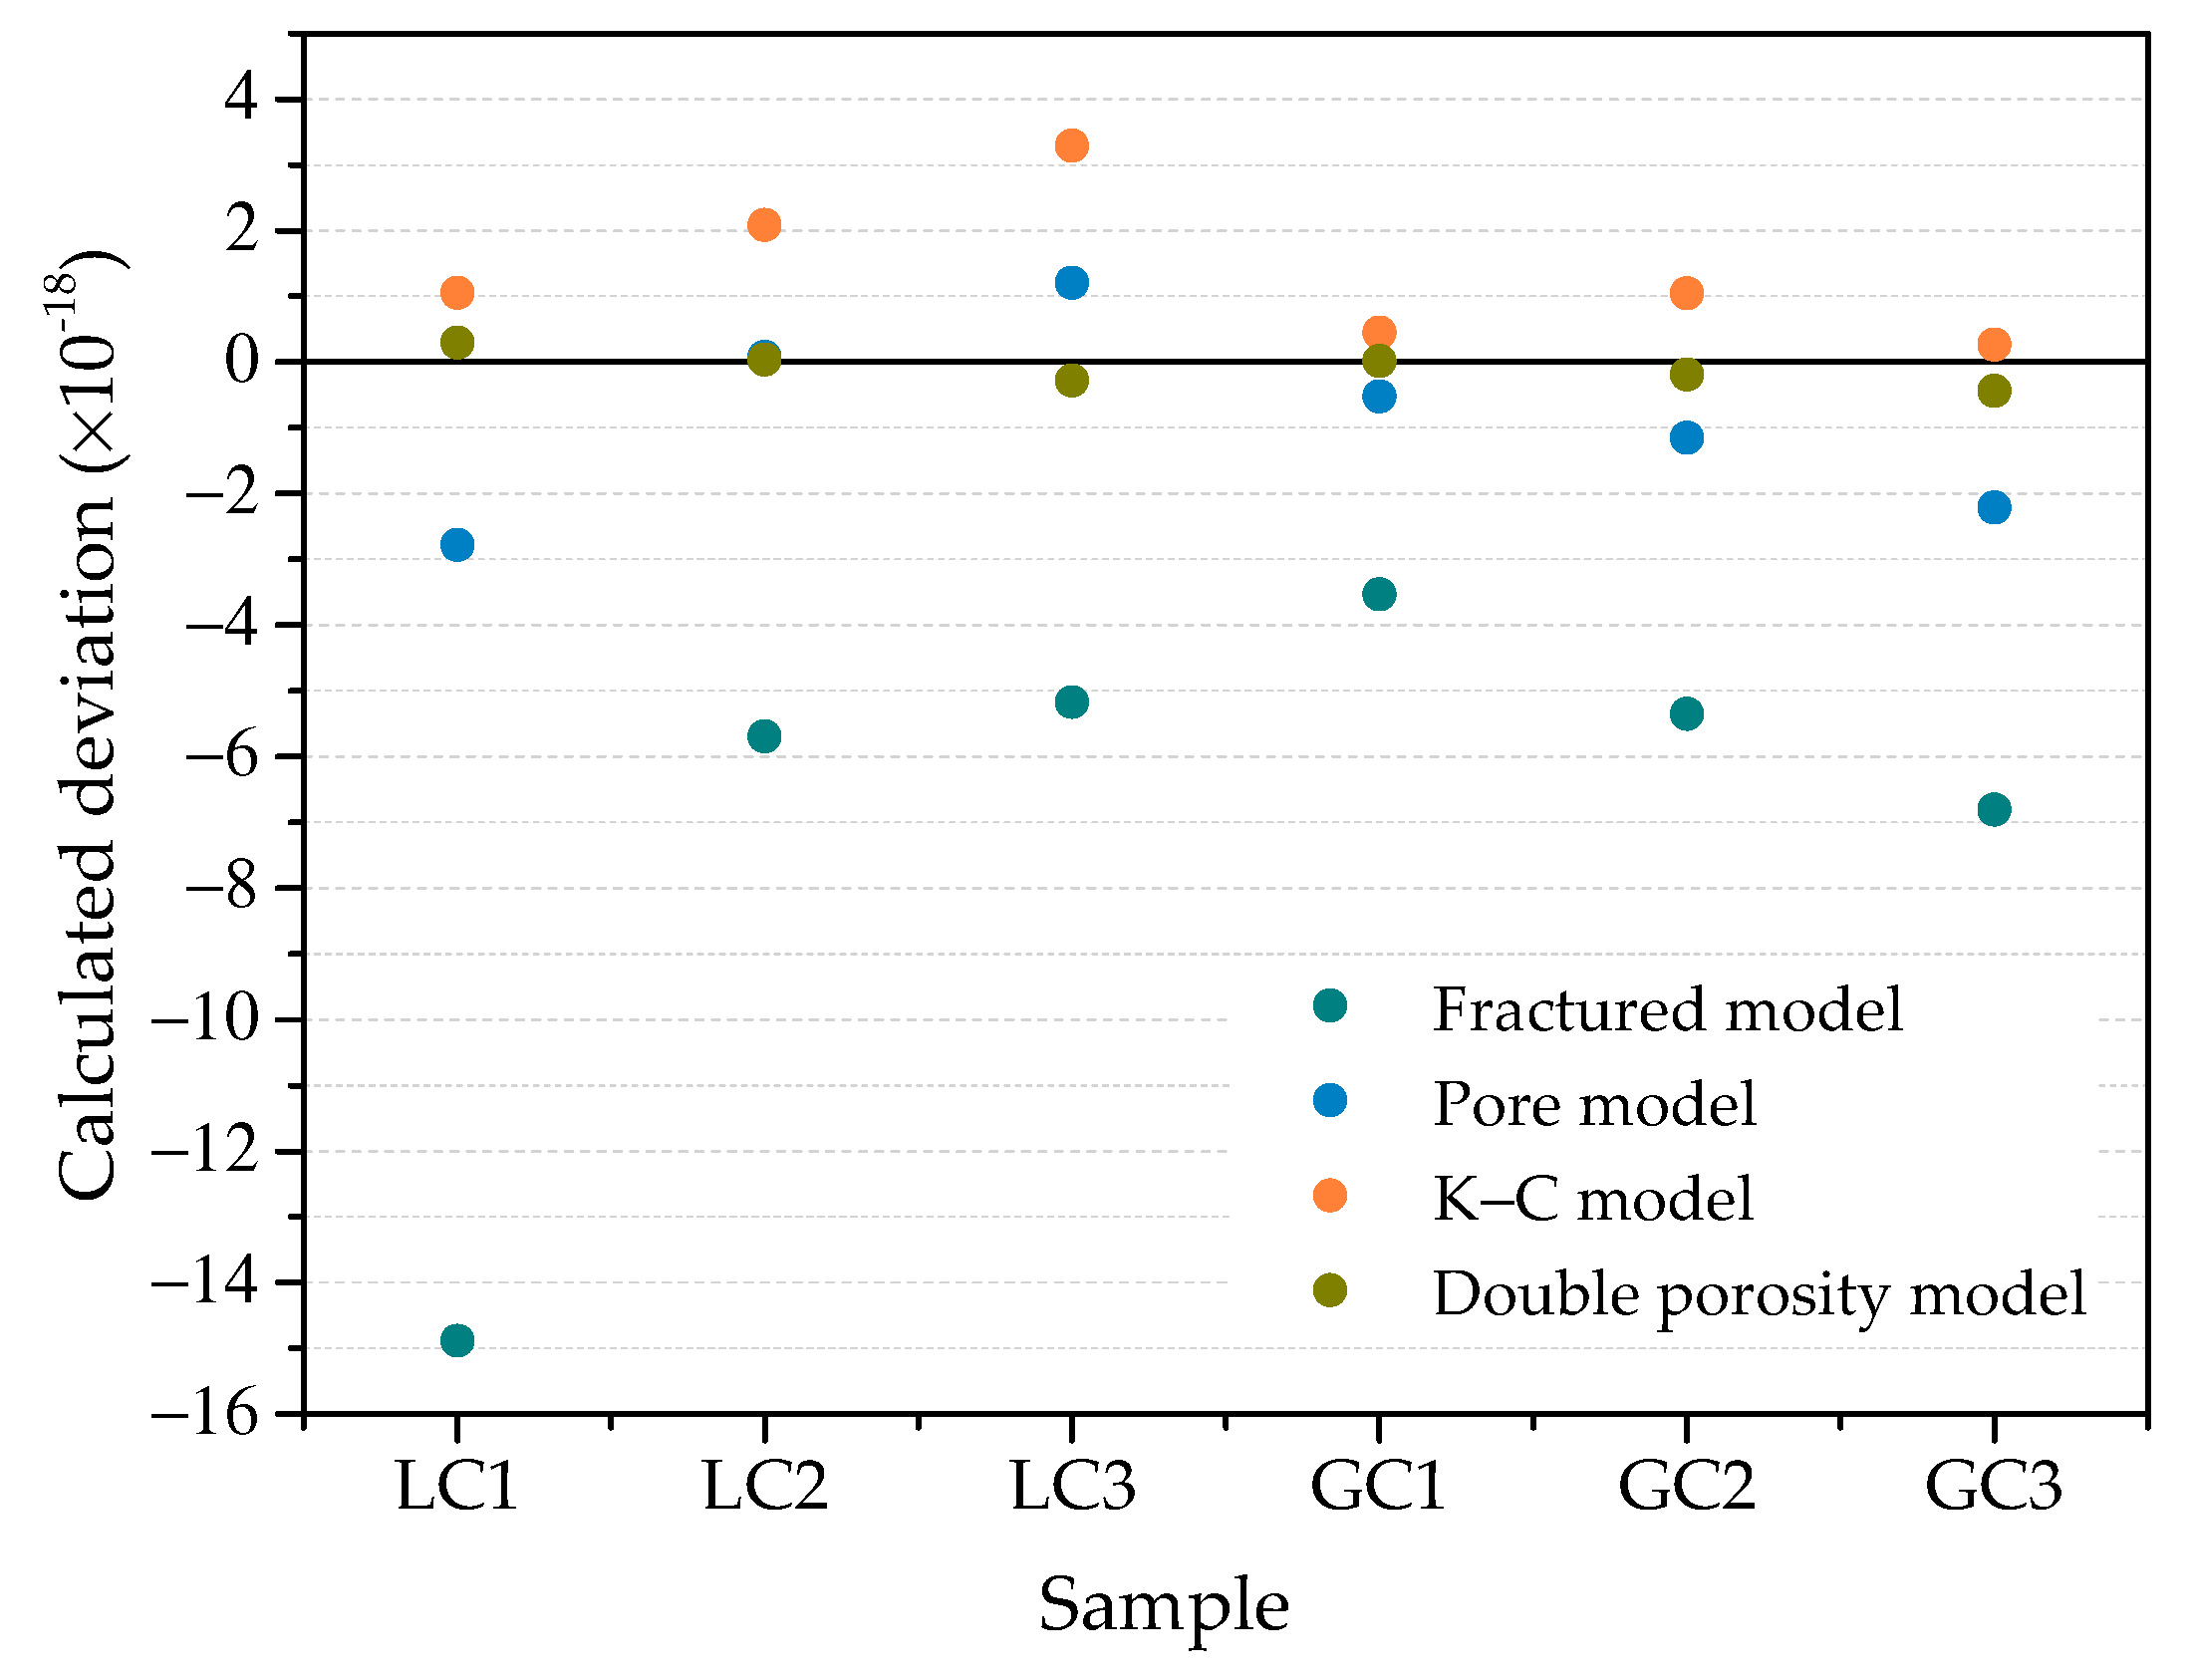
The fractal permeability model in this study relates to the micropore structure. The proposed model provides a perfect prediction with experimental data and those predicted from the other models. It is pointed out that the contribution of microcracks to the permeability of the ITZ cannot be ignored.
In hydraulic engineering, the concrete–rock ITZ is often subjected to erosive ions and calcium leaching. During long-term service, the permeability of the ITZ is not constant. The evolution of the permeability of the ITZ is critical to project safety and benefits. The evolution of permeability under complex long-term conditions needs to be further studied.

Author Contributions

J.Y., J.S. and H.W. mostly contributed to the design of the manuscript. Y.H. and K.Z. carried out data collection and processing. Y.L., Q.Z. and M.Z. were involved in immersing the specimens. J.Y. revised the paper. All authors have read and agreed to the published version of the manuscript.

Funding

This research was funded by National Natural Science Foundation of China under Grant No. 51579078, 51679070, Collaborative Innovation Center for Prevention and Control of Mountain Geological Hazards of Zhejiang Province under Grant No. PCMGH-2017-Z-02, Basic Research Youth Innovation Intersection Team of Qinghai Institute of Salt Lakes, Chinese Academy of Sciences under Grant No. ISLJCTD-2022-2, and Hunan Water Conservancy Science and Technology Project under Grant No. XSKJ2021000-35, XSKJ2019081-04.

Institutional Review Board Statement

Not applicable.

Informed Consent Statement

Not applicable.

Data Availability Statement

The data that support the findings of this study are available from the corresponding author upon reasonable request.

Conflicts of Interest

The authors declare no conflict of interest.

References

  1. Lizarazo, M.; Higuera, C.; Claisse, P. Measuring the effect of the ITZ on the transport related properties of mortar using electrochemical impedance. Constr. Build. Mater. 2014, 52, 9–16. [Google Scholar] [CrossRef]
  2. Zhang, S.; Zhang, C.; Liao, L.; Wang, C. Numerical study of the effect of ITZ on the failure behaviour of concrete by using particle element modelling. Constr. Build. Mater. 2018, 170, 776–789. [Google Scholar] [CrossRef]
  3. Zhu, Z.; Provis, J.; Chen, H. Quantification of the influences of aggregate shape and sampling method on the overestimation of ITZ thickness in cementitious materials. Powder Technol. 2018, 326, 168–180. [Google Scholar] [CrossRef]
  4. Patel, R.A.; Quoc Tri, P.; Seetharam, S.C.; Perko, J.; Jacques, D.; Maes, N.; De Schutter, G.; Ye, G.; Van Breugel, K. Diffusivity of saturated ordinary Portland cement-based materials: A critical review of experimental and analytical modelling approaches. Cem. Concr. Res. 2016, 90, 52–72. [Google Scholar] [CrossRef]
  5. Nemati, K.M.; Gardoni, P. Microstructural and statistical evaluation of interfacial zone percolation in concrete. Strength Fract. Complex. 2005, 3, 191–197. [Google Scholar]
  6. Wang, J.; Guo, Z.; Yuan, Q.; Zhang, P.; Fang, H. Effects of ages on the ITZ microstructure of crumb rubber concrete. Constr. Build. Mater. 2020, 254, 111329. [Google Scholar] [CrossRef]
  7. Qiu, J.; Zhou, Y.; Guan, X.; Zhu, M. The influence of fly ash content on ITZ microstructure of coal gangue concrete. Constr. Build. Mater. 2021, 298, 1–11. [Google Scholar] [CrossRef]
  8. Nežerka, V.; Bílý, P.; Hrbek, V.; Fládr, J. Impact of silica fume, fly ash, and metakaolin on the thickness and strength of the ITZ in concrete. Cem. Concr. Compos. 2019, 103, 252–262. [Google Scholar] [CrossRef]
  9. Bílý, P.; Nežerka, V.; Hrbek, V.; Fládr, J. Validation of micromechanical model for prediction of itz thickness of high-strength concrete containing secondary cementitious materials. Mater. Sci. Forum 2020, 995, 143–148. [Google Scholar] [CrossRef]
  10. He, S.; Yang, E. Strategic strengthening of the interfacial transition zone (ITZ) between microfiber and cement paste matrix with carbon nanofibers (CNFs). Cem. Concr. Compos. 2021, 119, 104019. [Google Scholar] [CrossRef]
  11. Hosan, A.; Shaikh, F.U.A.; Sarker, P.; Aslani, F. Nano- and micro-scale characterisation of interfacial transition zone (ITZ) of high volume slag and slag-fly ash blended concretes containing nano SiO2 and nano CaCO3. Constr. Build. Mater. 2021, 269, 121311. [Google Scholar] [CrossRef]
  12. Lin, J.; Chen, H.; Zhao, Q.; Li, M. Statistical analysis of the critical percolation of ITZ around polygonal aggregates in three-phase concrete materials. Physica A 2021, 572, 125878. [Google Scholar] [CrossRef]
  13. Bentz, D.P. Influence of internal curing using lightweight aggregates on interfacial transition zone percolation and chloride ingress in mortars. Cem. Concr. Compos. 2009, 31, 285–289. [Google Scholar] [CrossRef]
  14. Lyu, K.; She, W. Determination of aggregate surface morphology at the interfacial transition zone (ITZ). J. Vis. Exp. 2019. [Google Scholar] [CrossRef] [PubMed]
  15. Skalny, J. Challenges for cement research—Are we ready. Am. Ceram. Soc. Bull. 1984, 63, 1138. [Google Scholar]
  16. Wakeley, L.D.; Roy, D.M. A method for testing the permeability between grout and rock. Cem. Concr. Res. 1982, 12, 533–534. [Google Scholar] [CrossRef]
  17. Jiang, G.; Zuo, J.; Ma, T.; Wei, X. Experimental investigation of wave velocity-permeability model for granite subjected to different temperature processing. Geofluids 2017, 2017, 6586438. [Google Scholar] [CrossRef] [Green Version]
  18. Yang, C. Influence of aggregate content on the percolated interfacial transition zone of cement-based materials by using accelerated chloride migration test. J. Chin. Inst. Eng. 2006, 29, 159–164. [Google Scholar] [CrossRef]
  19. Snyder, K.A.; Winslow, D.N.; Bentz, D.P.; Garboczi, E.J. Effects of interfacial zone percolation on cement-based composite transport properties. MRS Online Proc. Libr. 1991, 245, 265–270. [Google Scholar] [CrossRef]
  20. Bentz, D.P.; Hwang, J.T.G.; Hagwood, C.; Garboczi, E.J.; Snyder, K.A.; Buenfeld, N.; Scrivener, K.L. Interfacial zone percolation in concrete: Effects of interfacial zone thickness and aggregate shape. Mater. Res. Soc. Symp. Proc. 1994, 370, 437. [Google Scholar] [CrossRef] [Green Version]
  21. Zheng, J.; Zhou, X. Percolation of ITZs in concrete and effects of attributing factors. J. Mater. Civ. Eng. 2007, 19, 784–790. [Google Scholar] [CrossRef]
  22. Zheng, J.; Zhou, X. Effective medium method for predicting the chloride diffusivity in concrete with ITZ percolation effect. Constr. Build. Mater. 2013, 47, 1093–1098. [Google Scholar] [CrossRef]
  23. Kim, S.U.; Kim, J.S.; Kang, J.W.; Han, T.S. Construction of virtual interfacial transition zone (ITZ) samples of hydrated cement paste using extended stochastic optimization. Cem. Concr. Compos. 2019, 102, 84–93. [Google Scholar] [CrossRef]
  24. Li, K.; Stroeven, M.; Stroeven, P.; Sluys, L.J. Effects of technological parameters on permeability estimation of partially saturated cement paste by a DEM approach. Cem. Concr. Compos. 2017, 84, 222–231. [Google Scholar] [CrossRef]
  25. Li, K.; Stroeven, P.; Stroeven, M.; Sluys, L.J. A numerical investigation into the influence of the interfacial transition zone on the permeability of partially saturated cement paste between aggregate surfaces. Cem. Concr. Res. 2017, 102, 99–108. [Google Scholar] [CrossRef]
  26. Jia, B.; Cui, X. Pore pressure dependent gas flow in tight porous media. J. Pet. Sci. Eng. 2021, 205, 108835. [Google Scholar] [CrossRef]
  27. Jia, B.; Xian, C.-G. Permeability measurement of the fracture-matrix system with 3D embedded discrete fracture model. Pet. Sci. 2022. [Google Scholar] [CrossRef]
  28. Sun, X.; Zhang, B.; Dai, Q.; Yu, X. Investigation of internal curing effects on microstructure and permeability of interface transition zones in cement mortar with SEM imaging, transport simulation and hydration modeling techniques. Constr. Build. Mater. 2015, 76, 366–379. [Google Scholar] [CrossRef]
  29. Wang, Q.; Zhang, G.; Tong, Y.; Gu, C. Prediction on permeability of engineered cementitious composites. Crystals 2021, 11, 526. [Google Scholar] [CrossRef]
  30. Tran, T.T.; Pham, D.T.; Vu, M.N.; Truong, V.Q.; Ho, X.B.; Tran, N.L.; Nguyen-Sy, T.; To, Q.D. Relation between water permeability and chloride diffusivity of concrete under compressive stress: Experimental investigation and mesoscale lattice modelling. Constr. Build. Mater. 2021, 267, 121164. [Google Scholar] [CrossRef]
  31. Yu, P.; Duan, Y.H.; Chen, E.; Tang, S.W.; Wang, X.R. Microstructure-based fractal models for heat and mass transport properties of cement paste. Int. J. Heat Mass Transf. 2018, 126, 432–447. [Google Scholar] [CrossRef]
  32. Jin, S.; Zhang, J.; Han, S. Fractal analysis of relation between strength and pore structure of hardened mortar. Constr. Build. Mater. 2017, 135, 1–7. [Google Scholar] [CrossRef]
  33. Tang, S.W.; He, Z.; Cai, X.H.; Cai, R.J.; Zhou, W.; Li, Z.J.; Shao, H.Y.; Wu, T.; Chen, E. Volume and surface fractal dimensions of pore structure by NAD and LT-DSC in calcium sulfoaluminate cement pastes. Constr. Build. Mater. 2017, 143, 395–418. [Google Scholar] [CrossRef]
  34. Wang, L.; Zeng, X.; Yang, H.; Lv, X.; Guo, F.; Shi, Y.; Hanif, A. Investigation and application of fractal theory in cement-based materials: A review. Fractal Fract. 2021, 5, 247. [Google Scholar] [CrossRef]
  35. Meng, Q.; Qin, Q.; Yang, H.; Zhou, H.; Wu, K.; Wang, L. Fractal characteristics of the pore structure of coral powder-cement slurry under different fractal models. Fractal Fract. 2022, 6, 145. [Google Scholar] [CrossRef]
  36. Shan, J.; Zhang, Y.; Wu, S.; Lin, Z.; Li, L.; Wu, Q. Pore characteristics of pervious concrete and their influence on permeability attributes. Constr. Build. Mater. 2022, 327, 126874. [Google Scholar] [CrossRef]
  37. Wang, B.; Guo, J.; Liu, J.; Wang, Q. Prediction method of permeability of textile-reinforced concrete based on fractal dimension theory. Constr. Build. Mater. 2022, 327, 126868. [Google Scholar] [CrossRef]
  38. Dai, Q.; Wang, G.; Zhao, X.; Han, Z.; Lu, K.; Lai, J.; Wang, S.; Li, D.; Li, Y.; Wu, K. Fractal model for permeability estimation in low-permeable porous media with variable pore sizes and unevenly adsorbed water lay. Mar. Pet. Geol. 2021, 130, 105135. [Google Scholar] [CrossRef]
  39. Li, R.; Chen, Z.; Wu, K.; Liu, X.; Dou, L.; Yang, S.; Xu, J. A fractal model for gas-water relative permeability curve in shale rocks(Article). J. Nat. Gas Sci. Eng. 2020, 81, 103417. [Google Scholar] [CrossRef]
  40. Wen, F.; Fan, H.; Zhai, S.; Zhang, K.; Liu, F. Pore characteristics analysis and numerical seepage simulation of antifreeze permeable concrete. Constr. Build. Mater. 2020, 255, 119310. [Google Scholar] [CrossRef]
  41. Jullien, M.; Raynal, J.; Kohler, É.; Bildstein, O. Physicochemical reactivity in clay-rich materials: Tools for safety assessment (Article). Oil Gas Sci. Technol. 2005, 60, 107–120. [Google Scholar] [CrossRef] [Green Version]
  42. Zhu, J.; Bao, W.; Peng, Q.; Deng, X. Influence of substrate properties and interfacial roughness on static and dynamic tensile behaviour of rock-shotcrete interface from macro and micro views. Int. J. Rock Mech. Min. Sci. 2020, 132, 104350. [Google Scholar] [CrossRef]
  43. Wang, Y.; Lu, B.; Hu, X.; Liu, J.; Zhang, Z.; Pan, X.; Xie, Z.; Chang, J.; Zhang, T.; Nehdi, M.L.; et al. Effect of CO2 surface treatment on penetrability and microstructure of cement-fly ash–slag ternary concrete. Cem. Concr. Compos. 2021, 123, 1–12. [Google Scholar] [CrossRef]
  44. Rao, G.A.; Prasad, B.R. Influence of the roughness of aggregate surface on the interface bond strength. Cem. Concr. Res. 2002, 32, 253–257. [Google Scholar] [CrossRef]
  45. Shi, Y.; Lv, X.; Zhou, S.; Liu, Z.A.; Yang, M.; Liu, C.; Lu, C. Mechanical properties, durability, and ITZ characteristics of full-grade dam concrete prepared by aggregates with surface rust stains. Constr. Build. Mater. 2021, 305, 1–14. [Google Scholar] [CrossRef]
  46. Hussin, A.; Poole, C. Petrography evidence of the interfacial transition zone (ITZ) in the normal strength concrete containing granitic and limestone aggregates. Constr. Build. Mater. 2011, 25, 2298–2303. [Google Scholar] [CrossRef]
  47. He, J.; Lei, D.; Xu, W. In-situ measurement of nominal compressive elastic modulus of interfacial transition zone in concrete by SEM-DIC coupled method. Cem. Concr. Compos. 2020, 114, 103779. [Google Scholar] [CrossRef]
  48. Xie, Y.; Corr, D.; Jin, F.; Zhou, H.; Shah, S. Experimental study of the interfacial transition zone (ITZ) of model rock-filled concrete (RFC). Cem. Concr. Compos. 2015, 55, 223–231. [Google Scholar] [CrossRef]
  49. Petrounias, P.; Giannakopoulou, P.P.; Rogkala, A.; Stamatis, P.M.; Tsikouras, B.; Papoulis, D.; Lampropoulou, P.; Hatzipanagiotou, K. The influence of alteration of aggregates on the quality of the concrete: A case study from serpentinites and andesites from central macedonia. Geosciences 2018, 8, 115. [Google Scholar] [CrossRef] [Green Version]
  50. Wu, K.; Shi, H.; Xu, L.; Ye, G.; De Schutter, G. Microstructural characterization of ITZ in blended cement concretes and its relation to transport properties. Cem. Concr. Res. 2016, 79, 243–256. [Google Scholar] [CrossRef]
  51. Liu, Y.; Shen, P.; He, Y.; Wang, F. Research progress of special aggregate concrete. Bull. Chin. Ceram. Soc. 2021, 40, 2831–2855. [Google Scholar] [CrossRef]
  52. Li, T.; Huang, Z.; Feng, Y.; Chen, X.; Ma, Q.; Liu, B.; Guo, X. Reservoir characteristics and evaluation of fluid mobility in organic-rich mixed siliciclastic-carbonate sediments: A case study of the lacustrine Qiketai Formation in Shengbei Sag, Turpan-Hami Basin, Northwest China. J. Pet. Sci. Eng. 2020, 185, 106667. [Google Scholar] [CrossRef]
  53. Selvadurai, A.; Głowacki, A. Estimates for the local permeability of the cobourg limestone. J. Rock Mech. Geotech. Eng. 2018, 10, 1009–1019. [Google Scholar] [CrossRef]
  54. Selvadurai, A.; Głowacki, A. Stress-induced permeability alterations in an argillaceous limestone. Rock Mech. Rock Eng. 2017, 50, 1079–1096. [Google Scholar] [CrossRef]
  55. Chen, Y.; Hu, S.; Wei, K.; Hu, R.; Zhou, C.; Jing, L. Experimental characterization and micromechanical modeling of damage-induced permeability variation in Beishan granite. Int. J. Rock Mech. Min. Sci. 2014, 71, 64–76. [Google Scholar] [CrossRef]
  56. Feng, Z.; Zhao, Y.; Liu, D. Permeability evolution of thermally cracked granite with different grain sizes. Rock Mech. Rock Eng. 2021, 54, 1953–1967. [Google Scholar] [CrossRef]
  57. He, L.; Yin, Q.; Jing, H. Laboratory investigation of granite permeability after high-temperature exposure. Processes 2018, 6, 36. [Google Scholar] [CrossRef] [Green Version]
  58. Tian, W.; Yang, S.; Elsworth, D.; Wang, J.; Li, X.-Z. Permeability evolution and crack characteristics in granite under treatment at high temperature. Int. J. Rock Mech. Min. Sci. 2020, 134, 104461. [Google Scholar] [CrossRef]
  59. Yu, B.; Cheng, P. A fractal permeability model for bi-dispersed porous media. Int. J. Heat Mass Transf. 2002, 45, 2983–2993. [Google Scholar] [CrossRef]
  60. Xu, P.; Yu, B. The scaling laws of transport properties for fractal-like tree networks. J. Appl. Phys. 2006, 100, 104906. [Google Scholar] [CrossRef] [Green Version]
  61. Monachesi, L.B.; Guarracino, L. A fractal model for predicting water and air permeabilities of unsaturated fractured rocks. Transp. Porous Media 2011, 90, 779–789. [Google Scholar] [CrossRef]
  62. Yu, B. Analysis of flow in fractal porous media. Appl. Mech. Rev. 2008, 61, 0508011–05080119. [Google Scholar] [CrossRef]
  63. Xu, P.; Yu, B. Developing a new form of permeability and Kozeny–Carman constant for homogeneous porous media by means of fractal geometry. Adv. Water Resour. 2008, 31, 74–81. [Google Scholar] [CrossRef]
  64. Gérard, B.; Marchand, J. Influence of cracking on the diffusion properties of cement-based materials. Cem. Concr. Res. 2000, 30, 37–43. [Google Scholar] [CrossRef]
  65. Wong, H.S.; Buenfeld, N.R.; Hill, J.; Harris, A.W. Mass transport properties of mature wasteform grouts. Adv. Cem. Res. 2007, 19, 35–46. [Google Scholar] [CrossRef] [Green Version]
  66. Wong, H.S.; Zobel, M.; Buenfeld, N.R.; Zimmerman, R.W. Influence of the interfacial transition zone and microcracking on the diffusivity, permeability and sorptivity of cement-based materials after drying. Mag. Concr. Res. 2009, 61, 571–589. [Google Scholar] [CrossRef] [Green Version]
Figure 1. Preparation of concrete–rock mixed samples.
Fractalfract 06 00329 g001
Figure 2. Macro and micro test schemes.
Fractalfract 06 00329 g002
Figure 3. Comparison of pore size distribution of rock.
Fractalfract 06 00329 g003aFractalfract 06 00329 g003b
Figure 4. Mortar pore size proportion around rock and concrete.
Fractalfract 06 00329 g004
Figure 5. XRD patterns of concrete and ITZ.
Fractalfract 06 00329 g005
Figure 6. Content of Calcium compounds.
Fractalfract 06 00329 g006
Figure 7. SEM images of ITZ microstructure at different magnifications: (a) C; (b) LC; (c) GC; (d) SC; “A”—aggregate, “Q”—quart particles.
Fractalfract 06 00329 g007
Figure 8. Comparison of SEM-EDS test results of concrete–rock interface; (a) limestone–concrete; (b) granite–concrete; (c) sandstone–concrete.
Fractalfract 06 00329 g008
Figure 9. Pore size distribution of ITZ.
Fractalfract 06 00329 g009
Figure 10. Schematic diagram of the flow of layered porous media along with the layer.
Fractalfract 06 00329 g010
Figure 11. Comparison of the experimental data with the results of other scholars on limestone and granite.
Fractalfract 06 00329 g011
Figure 12. Comparison of permeability test results of different types of rock, concrete and binary specimens, (a) limestone, (b) granite.
Fractalfract 06 00329 g012
Figure 13. Schematic diagram of water transport in ITZ.
Fractalfract 06 00329 g013
Figure 14. Comparison between measured permeability, the proposed model and other models available in the literature.
Fractalfract 06 00329 g014
Figure 15. Comparison of calculated deviation results.
Fractalfract 06 00329 g015
Figure 16. Percentage of permeability of different pore media.
Fractalfract 06 00329 g016
Table 1. Concrete grout mixture proportions.
MaterialWaterCementCrush StoneSandAdmixtures
Concrete0.3612.8241.3920.005
Table 2. Some of the models for porous media permeability estimation.
ModelEquationReference
Fracture model k = ϕ 2     D f r max 2 12 3     D f 1     r min r max 3 D f 1 r min r max 2 D f Monachesi and Guarracino (2011) [61]
Pore model k = 2     D f 8 τ 4     D f 1     ϕ ϕ r max 2 Yu (2008) [62]
XY model k = π D f 1 D T / 2 4 2     D f 1 + D T / 2 32 3   +   D T     D f ϕ 1     ϕ 1 + D T / 2 r max 2 Kozeny (1927) [62]; Xu and Yu (2008) [63]
Publisher’s Note: MDPI stays neutral with regard to jurisdictional claims in published maps and institutional affiliations.

