
Coupled Seepage Mechanics Model of Coal Containing Methane Based on Pore Structure Fractal Features


1
School of Resources & Environment, Henan Polytechnic University, Jiaozuo 454003, China
2
Collaborative Innovation Center of Coalbed Methane and Shale Gas for Central Plains Economic Region, Jiaozuo 454003, China
3
School of Electronic Engineering Department, China University of Mining & Technology, Beijing 100083, China
4
School of Environment and Biological Engineering, Henan University of Engineering, Zhengzhou 451191, China
*
Author to whom correspondence should be addressed.
Fractal Fract. 2022, 6(7), 391; https://doi.org/10.3390/fractalfract6070391
Submission received: 14 June 2022
/
Revised: 6 July 2022
/
Accepted: 13 July 2022
/
Published: 14 July 2022
(This article belongs to the Section Engineering)
Abstract
:The paper applies fractal theory to the structure of fractal coal pores and calculates the fractal dimension and integrated fractal dimension for each pore section >100 nm, 100 nm > d > 5.25 nm, and <2 nm. In the experiment, we performed the full stress–strain-seepage experiment of methane-bearing coal, revealed the deformation–seepage characteristics of methane-bearing coal under load, and deduced the dynamic prediction mechanical model of methane-bearing coal permeability based on pore heterogeneity, followed by practical verification. The results show that the permeability change in methane-bearing coal is an external manifestation of coal pore deformation, and the two are closely related and affected by changes in the effective stress coefficient. The derived fractal-deformation-coupled methane permeability mechanics model based on coal pore heterogeneity has high accuracy, a general expression for the stress–strain-permeability model based on coal heterogeneity is given, and the fractal Langmuir model is verified to be highly accurate (>0.9) and can be used for coal reservoir permeability prediction.
1. Introduction
Coal reservoirs have complex pore-fracture systems and high heterogeneity, and their pore structure and morphology are critical for coalbed methane adsorption, desorption, and reservoir [1,2,3]. With the development of testing and analysis techniques, a series of techniques have been applied to quantify the complex pore structure of coal, such as cryogenic liquid nitrogen adsorption, mercury intrusion, nuclear magnetic resonance, nano-CT, field emission scanning electron microscopy, and many other testing methods [4,5,6,7,8]. There are differences in the measurement range of coal seam pore size for different test methods [9]. For example, the mercury intrusion method can test pores with a pore size larger than 3.5 nm and mainly uses the mercury injection method to measure the pore size distribution curve, pore volume, pore specific area, displacement pressure, and other parameters, which is more accurate to measure the holes above the small holes [10]. Microporosity of less than 10 nm can be measured using cryogenic liquid nitrogen adsorption.
In recent years, the fractal theory has been widely applied to quantitatively describe the structure and morphology of coal pores, and it is a useful tool to describe granularity, mutagenicity, and roughness [11,12,13]. Jin et al. [14,15] used fractal topology theory to summarize and analyze the influence of behavioral and primitive complexity on pore structure, constructed the particle-filled fractal porous media model, and deduced a coupled pore-pore throat fractal algorithm for fine characterization of porosity and specific surface area. Table 1 summarizes the permeability model deduced by predecessors, among which the P&M model [16] and the S&D model [17] are the most representative permeability models at present.

Table 1.
Comparison of permeability models of coal seams.
| Authors | Models | Notes | Limitations |
|---|---|---|---|
| Seidle [18] | kf is cleat permeability, 10−3 μm2 pp is pore pressure, 0.6895 × 10⁻² MPa. | The relationship equation between coal seam permeability, stress, and burial depth. | Does not explain the local permeability changes in coal seam caused by stress. |
| Li et al. [19] | . ka is absolute permeability, 10−3 μm2; , 1/ks = Cm, Cm is the coal matrix shrinkage factor, MPa−1; εs is the volumetric strain from coal rock adsorption/desorption; εTp is the volumetric strain from thermal cracking of the coal rock; εe is the volumetric strain caused by thermal expansion. | Correction of the strain caused by the permeability of coal and rock under the action of temperature. | No consideration of the effect of pore deformation on permeability. |
| Palmer and Mansoori [16] | φ is coalbed porosity, fraction. | Under stable low pressure, permeability can rebound when matrix shrinkage is strong enough. | No consideration of pressure changes. |
| Shi and Durucan [17] | The S&D model is perfected based on the P&M model. The rebound pressure predicted by this model is greater than that of the P&M model. | The same as the P&M model, the pressure changes are not considered. |
Although there are differences in the modeling approach and characterization methods of the various coal rock stress–strain-permeability models, they all consider the effects of stress conditions, gas pressure, pore structure, and adsorption expansion on the deformation characteristics and permeability of the coal body to varying degrees. Most models assume that the coal rock is in a uniaxial stress–strain state, and most adsorption expansion-deformation models use the simplified Langmuir model, ignoring the effect of the heterogeneity of the coal matrix pores on the deformation and permeability of the coal body. Based on previous studies, this study performed the full stress–strain-seepage experiment and pore structure experiment of coal body under load, used fractal dimension to characterize the heterogeneous characteristics of coal pore development, and derived a ‘stress–strain-permeability’ mechanical model of methane-bearing coal under full stress based on coal pore fractal to investigate the coupled response of gas permeability and coal body deformation.
2. Experiments and Theory
2.1. Samples
The experimental samples were taken from the II-1 coal seam of Guhanshan Mine, Jiaozuo Mining area, China, and the coal type was anthracite. Geographic sketch maps of Guhanshan coal mine are shown in Figure 1. The reflectance, microscopic composition, industrial analysis, and porosity test results of the samples are shown in Table 2 and Table 3.
2.2. Triaxial Stress–Strain-Permeability Test
The primary structural coal with a size of 20 cm × 20 cm × 20 cm was processed into a cylindrical specimen with a diameter of 50 mm × 100 mm and a diameter-to-height ratio of 1:2, and the coal sample was dried at a constant temperature for an adsorption time of not less than 24 h and a desorption time of not less than 6 h. The experimental equipment used a thermo-solid-fluid coupling triaxial servo seepage device of methane-containing coal bodies (Figure 2). This experiment observed the change in permeability of the coal body during the full stress–strain under different gas pressures (1 MPa, 2 MPa) and different confining pressures (4, 6, 8 MPa) at the coal sample reservoir temperature (20 °C), and the frequency of recording was 1 time/s.
During the experiment, the confining pressure was slowly loaded to the set value, the coal sample was degassed with a vacuum pump to ensure that they were full of gas; after the degassing was completed, the gas adsorption was performed on the coal samples according to the gas pressure in the experimental plan to ensure that the gas was fully adsorbed to achieve smooth adsorption; the axial stress uses the slow loading method, the loading rate is 0.01 KN/s, the computer loading control program was then launched, and the inlet and outlet valves (normal pressure 0.1 MPa) were opened. The experimental data recording frequency adopted times/1 s, and the stress–strain-permeability of coal samples was observed and recorded following the scheme in Table 4.
2.3. Pore Structure Test
Mercury intrusion experiments and liquid nitrogen adsorption experiments were conducted using AutoPore IV 9505 fully braked mercury intrusion instrument and ASAP2020 M fully automated specific surface area and physical adsorption analyzer, respectively.
Mercury intrusion experiments can be used to determine the pore size structure of pores larger than 5.5 nm. The experimental coal sample was crushed into 2 mm particles, dried at 70–80 °C for 12 h, and then evacuated to p < 6.67 Pa in a dilatometer, where the specific surface area and specific pore volume of each pore size section in the coal sample were measured.
2.4. Pore Fractal Theory
The pore structure and surface of coal are highly heterogeneous, and the pore structure of coal can be characterized by fractal geometry [23,24,25].
The fractal dimension can be calculated by the mercury intrusion method using the Menger sponge fractal model to characterize the three-dimensional spatial structure of the coal body and then introducing the Washburn equation [26,27,28,29]:
where V is the volume of mercury injected at pressure p, cm3/g; p is the applied pressure, MPa; and D1 is the fractal dimension obtained by the mercury intrusion experiment.
Fitting log (dV/dp) to log p yields the D1:
where k is the slope of the double logarithmic curve between the applied pressure p and the metallic mercury volume V.
Here, the fractal dimension was calculated using the FHH model after sorting the total adsorption data [30,31,32,33]. When the adsorbate is highly covered, the membrane/gas interface is controlled by the liquid/gas surface tension, and leaving the interface off the surface [34], which is expressed as:
where V is the adsorption volume at pressure p0/p, cm3/g; Vm is the volume of gas adsorbed in a single layer, mL; p0 is the saturated vapor pressure, MPa; D2 is the fractal dimension obtained from the liquid nitrogen adsorption experiment.
Due to the heterogeneity and complexity of the pore size of the coal body, each pore size distribution segment cannot represent the overall coal pore size fractal dimension, and the weighted average of the coal specific surface area is used here to characterize the comprehensive fractal dimension of the coal [35]:
where Dz is the integrated fractal dimension of coal, i is the ith pore size distribution segment, which is a positive integer; n is the number of pore size distribution segments, which is a positive integer; Di and bi are the coal fractal dimension and the pore specific surface area ratio corresponding to the ith pore size distribution segment, respectively.
3. Results and Discussion
3.1. Coal Deformation Seepage Characteristics
Through the testing of gas pressure and flow rate during the experiment, the permeability of the loaded raw coal under different gas pressure can be calculated, and the calculation formula is:
where, k is the permeability of the raw coal, 10−3 μm2; q is the gas flow rate through the coal body per unit atmospheric pressure, mL/s; μ is the gas viscosity, which is 1.087 × 10⁻⁶ Pa·s at room temperature of 20 °C; H is the height of the specimen, mm; A is the cross-sectional area of the specimen, mm2. p1 and p2 are the outlet pressure (atmospheric pressure) and inlet pressure of the specimen, MPa.
The variation of stress–strain and strain-permeability of the gas-containing coal samples are shown in Figure 3. Figure 3 shows that the deformation of the methane-containing coal body under load can be divided into three stages: initial compression, quasi-elastic deformation, and plastic deformation, which correspond to three stages of unstable seepage, stable seepage, and accelerated seepage of methane seepage, respectively. In the initial compression stage, the compression of pores leads to a rapid decrease in permeability; with the increase in stress and strain, the permeability gradually decreases, and when the stress increases to 40% of the peak stress, the permeability reaches a minimum value; then, the coal body undergoes plastic deformation, and the deformation modulus decreases; after the stress peak, the fractures in the coal sample are connected and the permeability increases rapidly.
As the confining pressure increased, the compressive strength of the coal sample increased rapidly, and both axial and radial strains increased; as the fluid pressure (methane pressure) increased, the initial permeability and minimum permeability of the coal sample increased and the compressive strength decreased. The test results under different experimental conditions are shown in Table 4.
3.2. Pore Structure Characteristics and Fractal Dimension
3.2.1. Pore Structure Characteristics—Mercury Intrusion Method
The mercury injection line of 1 coal sample is shown in Figure 4.
Most of the mercury injection and mercury ejection curves overlap, indicating that the coal sample has poor pore connectivity and many semi-closed pores. The experimental data were analyzed and processed to obtain the specific pore volume, specific surface area, and percentage of each pore section, see Table 5 and Table 6.
According to Figure 5 and formula (2), the fractal dimension of coal (mercury intrusion method) was calculated; see Table 7.
Shown in the experimental data of mercury intrusion and the fractal dimension calculated in Figure 5, the boundary point of pore size is 62.6 nm, and the correlation coefficient between log(dV/dp) and log p for pore sizes larger than 62.6 nm is 0.9616, which has significant fractal characteristics; log(dV/dp) and log p correlation coefficient for pore sizes smaller than 62.6 nm is 0.5083, which does not have fractal characteristics.
3.2.2. Pore Structure Fractal Characteristics—N2 Adsorption
According to the experimental data of low-temperature liquid nitrogen adsorption, the adsorption line of the 1 coal sample was plotted, as shown in Figure 6.
According to Figure 6, the adsorption/desorption curves can be seen to be horizontal over a wide pressure range when combined with the type I adsorption return line analysis; it shows that there are a large number of micropores in the 1 coal sample. The experimental data were processed and classified to obtain the specific pore volume, specific surface area, and percentage of each pore segment with pore diameters in the range of 2~361 nm; see Table 8 and Table 9.
According to the adsorption data of liquid nitrogen, the statistical relationship diagram of lnV and ln[ln(p0/p)] of 1 coal sample can be made (Figure 7).
The fractal dimension is calculated from the experimental data of liquid nitrogen adsorption and shown in Table 10. The results show that the correlation coefficient between lnV and ln[ln(p0/p)] in the pore size range of 2.03~338.64 nm is above 95%, and the correlation is significant, indicating that the pore segment has obvious fractal characteristics; the correlation between the pore size range >5.24 nm is better than that of the pore size range <5.24 nm.
3.2.3. Comprehensive Fractal Dimension
The fractal dimension of the experimental coal body was calculated using the previous method, obtaining the fractal dimension was calculated using the mercury intrusion method for pore sizes >100 nm, and the fractal dimension was calculated using the adsorption method for pore sizes 2 nm < d ≤ 100 nm. Then, using formula (4), we obtain the comprehensive fractal dimension Dz; the results are shown in Table 11
3.3. Model Establishment and Derivation
Volume deformation and particle skeleton adsorption deformation are the two types of coal body–stress deformation. When the coal seam is full of adsorbed gas, the gas and coal particles form a deformed whole. Currently, the effective stress increases, the coal particles squeeze each other, the pore volume becomes smaller, and the permeability decreases [36,37].
Experiments show that coal permeability and strain have a certain relationship [38,39,40,41,42]. The combined effects of volume deformation and adsorption deformation should be considered when developing the stress–strain-permeability model [43,44,45,46], where volume deformation can be measured by experimental methods and adsorption expansion deformation is obtained through the fractal Langmuir model of coal heterogeneity. The following assumptions are introduced to avoid complicated theoretical derivation:
- (1)
- The adsorption and desorption are completed instantaneously, the occurrence state conforms to the Gibbs interface model, the adsorption process conforms to the Langmuir equation, the temperature is constant, and the moisture of the coal body is the same;
- (2)
- The gas-bearing coal body is assumed to be an isotropic homogeneous medium with the same isotropic adsorption and surface tension;
- (3)
- Under the ideal confinement state, the expansion stress generated during the gas absorption of the coal rock is completely transformed into elastic expansion energy;
- (4)
- The surface of the coal body is smooth and completely in contact with the constraint boundary.
The stress–strain equation of gas-bearing coal under load can be described by the following equation [47,48]:
where: δij is the Kronecher function, ; εij, σij, and σkk are the strain tensor, effective stress tensor and compressive stress, respectively, MPa; p is the pore pressure (gas pressure), MPa; G is the shear modulus of the coal body, MPa; K is the bulk modulus, MPa; and α is the effective stress coefficient of the coal body.
During the loading process, the coal body fissures produce inward shrinkage and outward deformation, and the permeability and porosity are controlled by the fissures. Therefore, the permeability and porosity can be expressed by the following formula:
Porous media, pore volume, and solid volume changes satisfy the matrix:
where ∆Vn is the fracture volume increment before and after deformation; the negative sign represents the direction of fracture increment opposite to that of inward deformation increment and decrement; ∆Vv and ∆Vp are the coal skeleton volume and inward adsorption change, respectively, m3; φ is the fracture porosity; k is the permeability, 10−3 μm2; and εv and εp are the inward adsorption expansion and outward adsorption deformation strain, respectively, mm.
The following can be inferred from Betti-Maxwell’s reciprocity theorem:
Then, the change law of porosity and initial porosity is obtained:
where φ0 is the initial porosity; α is the effective stress coefficient; and K is the bulk modulus, MPa. When the change in effective stress coefficient of the coal porous gas pressure is not considered, formula (10) can be transformed into:
where Es is the elastic modulus, and the effective stress coefficient also considers the coal matrix shrinkage deformation caused by the change in gas pressure in the coal, the coal matrix expansion deformation caused by gas absorption, and the change in the effective stress coefficient with the gas pressure.
The relationship between permeability and porosity follows the cubic law:
Shown in Equations (11) and (12), the relationship between permeability and porosity after considering the adsorption expansion effect can be obtained as follows:
The pore size of coal is heterogeneously developed, and different pores have a large effect on the effective stress coefficient of coal. Here, the fractal dimension is used to represent the heterogeneity of coal. Based on the Langmuir single molecular layer adsorption model (Langmuir, 1916), the fractal Langmuir model is established:
Substituting Equation (14) into Equation (13), the fractal-based stress-–strain-permeability model is obtained:
where k and k0 are the permeability of the coal body before and after deformation, respectively, 10−3 μm2; R is the molar gas constant, taken as R = 8.3143 J/(mol∙K); is the average effective stress, MPa; μs is the Poisson’s ratio of the coal skeleton; a and b are the absorption constants of the coal; V is the maximum adsorption volume when the adsorption pressure is p, cm3/g or m3/t; S is the cross-sectional area of the adsorbent molecules (CH4), where CH4 is taken as 0.0181; Df is the fractal dimension (pore space) of the absorbent (coal); Vm is the Langmuir volume, that is, the maximum absorption amount at the absorption pressure p, Vm = a = VL, cm3/g or m3/t; PL is the Langmuir pressure, PL = 1/b; VF-L is the fractal Langmuir volume, cm3/g or m3/t; and PF-L is the fractal-Langmuir pressure, MPa.
Equation (15) shows that the change in permeability after deformation of a methane-bearing coal body under load is not only related to the average effective stress, pore pressure, and porosity, but also to skeleton deformation, elastic modulus, bulk modulus of coal skeleton, Poisson’s ratio, and temperature. The fractal Langmuir volume and fractal Langmuir pressure also affect the adsorption thermodynamic properties when considering coal heterogeneity.
Formula (14) shows that when Df = 2, the Langmuir equation is a special case of the fractal Langmuir equation.
3.4. Model Applicability
The fractal-based stress–strain-permeability model was validated by combining parameters obtained from mercury intrusion and liquid nitrogen adsorption experiments. The comprehensive fractal dimension of the coal was first calculated with the basic parameters shown in Table 11, and the calculation results of the VF-L, PF-L, VL, and pL are shown in Table 12.
Plot the statistical relationship between VF-L and VL and the statistical relationship between PF-L and PL, as shown in Figure 8.
The linear equations of the Langmuir model and the fractal Langmuir model were obtained by linear fitting based on the isothermal adsorption data of the No. 1 coal sample, and the fitted correlation coefficients were above 0.95, indicating that the model had high accuracy and could be applied to the stress–strain-permeability model.
In this study, the permeability under load was calculated based on the mechanical parameters and boundary conditions of the experimental coal samples, and the accuracy of the established fractal stress–strain-permeability model was verified. Given the complexities of the gas-bearing coal body’s stress–strain process, the study only calculated the permeability change before the coal body reached the peak of damage.
The theoretical calculation curve and test curve of the coal sample are shown in Figure 9. The theoretical value calculated by the permeability model based on coal heterogeneity is very close to the experimental value. This model is more realistic and can reflect the coupled response of mechanical deformation and permeability of the coal body under different gas pressures.
4. Conclusions
- (1)
- The model considers the effect of coal body adsorption deformation on effective stress (skeleton shrinkage caused by pore pressure and adsorption expansion caused by adsorbed gas). The analysis reveals that the effective stress coefficient varies with pore pressure, that is, with the increase in pore pressure, the effective stress coefficient of the coal skeleton increases. The entire stress–strain-percolation curve of gas-bearing coal bodies can be divided into three stages: pore compression unstable flow, linear elastic stable flow, and plastic deformation seepage acceleration. The permeability of coal samples is intrinsically related to deformation; changes in external stress and pore pressure are the dominant factors causing changes in coal permeability, and changes in coal permeability reflect the appearance of the solid and are an external manifestation of deformation.
- (2)
- The general expression of the fractal stress–strain-permeability model based on coal heterogeneity is theoretically deduced based on the integrated consideration of gas adsorption deformation and matrix shrinkage deformation. When the fractal dimension of coal pores is Df = 2, the model can be transformed into the Langmuir model, . The Langmuir model can be regarded as a special case of the fractal stress–strain-permeability model, so the established fractal model has more general theoretical significance.
- (3)
- The fractal Langmuir model is validated, and the goodness-of-fit was greater than 0.95. Nevertheless, the error between the theoretical solution of the model and the measured value is small, which is in good agreement with the experimental data. It shows that the prediction model is more accurate than the traditional Euclidean geometric method in calculating permeability and can accurately reflect the coupled response of coal mechanical deformation and permeability under different gas pressure, which can better characterize the variation law of gas-bearing coal permeability during the gas extraction process.
Author Contributions
Conceptualization, R.L.; methodology, R.L.; validation, X.M., X.N. and J.R.; data curation, R.L.; writing—original draft preparation, Y.Z.; writing—review and editing, R.L. and X.M. All authors have read and agreed to the published version of the manuscript.
Funding
This work was financially supported by the National Natural Science Foundation of China (Grant Nos. 41572139, 41872169, 41972177 and 42002185), Key Technologies Research and Development Program of Henan Province (212102310425), and the Program for Innovative Research Team (in Science and Technology) in Universities of Henan Province, China (Grant No. 21IRTSTHN007).
Conflicts of Interest
The authors declare no conflict of interest.
References
- Sun, W.; Feng, Y.; Jiang, C.; Chu, W. Fractal characterization and methane adsorption features of coal particles taken from shallow and deep coalmine layers. Fuel 2015, 155, 7–13. [Google Scholar] [CrossRef]
- Liu, X.; He, X. Effect of pore characteristics on coalbed methane adsorption in middle-high rank coals. Adsorpt. J. Int. Adsorpt. Soc. 2017, 23, 3–12. [Google Scholar] [CrossRef]
- Wang, K.; Zhao, W. Research Progress on the Control Mechanism of Coal Pore Space Geometric Characteristics on the Shape of Gas Desorption Curves. Bull. Natl. Nat. Sci. Found. China 2021, 35, 917–923. [Google Scholar]
- Liu, Y.; Zhu, Y.; Li, W.; Zhang, C.; Wang, Y. Ultra micropores in macromolecular structure of subbituminous coal vitrinite. Fuel 2017, 210, 298–306. [Google Scholar] [CrossRef]
- Wei, Q.; Li, X.; Zhang, J.; Hu, B.; Zhu, W.; Liang, W.; Sun, K. Full-size pore structure characterization of deep-buried coals and its impact on methane adsorption capacity: A case study of the Shihezi Formation coals from the Panji Deep Area in Huainan Coalfield, Southern North China. J. Pet. Sci. Eng. 2019, 173, 975–989. [Google Scholar] [CrossRef]
- Wang, D.; Zhang, H.; Wei, J.; Wu, Y.; Zhang, H.; Yao, B.; Fu, J.; Zhao, L. Dynamic evolution characteristics of fractures in gas-bearing coal under the influence of gas pressure using industrial CT scanning technology. J. China Coal Soc. 2021, 46, 3550–3564. [Google Scholar]
- Cai, Y.; Liu, D.; Yao, Y.; Li, J.; Liu, J. Fractal Characteristics of Coal Pores Based on Classic Geometry and Thermodynamics Models. Acta Geol. Sin. 2011, 85, 1150–1162. [Google Scholar] [CrossRef]
- Ha, A.; Ak, A.; Fura, A.; Az, B.; Si, A.; Ml, C. Coal cleat network evolution through liquid nitrogen freeze-thaw cycling. Fuel 2022, 314, 123069. [Google Scholar]
- Wang, G.; Ju, Y.; Yan, Z.; Li, Q. Pore structure characteristics of coal-bearing shale using fluid invasion methods: A case study in the Huainan-Huaibei Coalfield in China. Mar. Pet. Geol. 2015, 62, 1–13. [Google Scholar] [CrossRef]
- Giesche, H. Mercury Porosimetry: A General (Practical) Overview. Part. Part. Syst. Charact. 2006, 23, 9–19. [Google Scholar] [CrossRef]
- Fu, X.; Zhou, R.; Zhang, W.; Qin, Y.; Wei, C. Study on fractal and natural classification of coal pore based on coalbed methane migration. Chin. Sci. Bull. 2005, z1, 51–55. [Google Scholar]
- Mahnke, M.; Mögel, H.J. Fractal analysis of physical adsorption on material surfaces. Colloids Surf. A Physicochem. Eng. Asp. 2003, 216, 215–228. [Google Scholar] [CrossRef]
- Zhao, J.; Tang, D.; Qin, Y.; Xu, H. Fractal characterization of pore structure for coal macrolithotypes in the Hancheng area, southeastern Ordos Basin, China. J. Pet. Sci. Eng. 2019, 178, 666–677. [Google Scholar] [CrossRef]
- Jin, Y.; Quan, W.; Qin, J.; Liu, X.; Zheng, J.; Song, H. Quantitative characterization of complex assembly in fractalpore-throat porous media. J. China Coal Soc. 2020, 45, 1845–1854. [Google Scholar]
- Jin, Y.; Wang, Q.; Dong, J.; Liu, S.; Zheng, J.; Li, Y. Characterization of the complexity assembly of fractal bed-packing porous media. Chin. J. Rock Mech. Eng. 2022, 41, 1160–1171. [Google Scholar]
- Palmer, I.; Mansoori, J. How Permeability Depends on Stress and Pore Pressure in Coalbeds: A New Model. Spe Reserv. Eval. Eng. 1996, 1, 539–544. [Google Scholar] [CrossRef]
- Shi, J.Q.; Durucan, S. Drawdown Induced Changes in Permeability of Coalbeds: A New Interpretation of the Reservoir Response to Primary Recovery. Transp. Porous Media 2004, 56, 1–16. [Google Scholar] [CrossRef]
- Seidle, J.P.; Jeansonne, M.W.; Erickson, D.J. Application of Matchstick Geometry to Stress Dependent Permeability in Coals. In Proceedings of the SPE Rocky Mountain Regional Meeting, Casper, WY, USA, 18–21 May 1992; p. 433. [Google Scholar]
- Li, B.; Gao, Z.; Yang, K.; Li, J.; Ren, C.; Xu, J.; Cao, J. Study on coal adsorption-permeability model under the coupling of temperature and pore pressure. Chin. J. Rock Mech. Eng. 2020, 39, 668–681. [Google Scholar]
- Joubert, J.I.; Grein, C.T.; Bienstock, D. Effect of moisture on the methane capacity of american coals. Fuel 1974, 53, 186–191. [Google Scholar] [CrossRef]
- Li, A.; Ding, W.; He, J.; Dai, P.; Shuai, Y.; Fei, X. Investigation of pore structure and fractal characteristics of organic-rich shale reservoirs: A case study of Lower Cambrian Qiongzhusi formation in Malong block of eastern Yunnan Province, South China. Mar. Pet. Geol. 2016, 70, 46–57. [Google Scholar] [CrossRef]
- Zhang, Z.; Liu, G.; Cao, Y.; Lin, J.; Jin, Y.; Xian, B.; Lv, R.; Zhang, Z. Experimental Investigation of CS2 Extraction to Enhance the Permeability of Coal. Transp. Porous Media 2021, 136, 899–922. [Google Scholar] [CrossRef]
- Yao, Y.; Liu, D.; Tang, D.; Tang, S.; Huang, W.; Liu, Z.; Yao, C. Fractal characterization of seepage-pores of coals from China: An investigation on permeability of coals. Comput. Geosci. 2009, 35, 1159–1166. [Google Scholar] [CrossRef]
- Fu, H.; Tang, D.; Xu, T.; Xu, H.; Shu, T.; Li, S.; Yin, Z.Y.; Chen, B.; Zhang, C.; Wang, L. Characteristics of pore structure and fractal dimension of low-rank coal: A case study of Lower Jurassic Xishanyao coal in the southern Junggar Basin, NW China. Fuel 2017, 193, 254–264. [Google Scholar] [CrossRef]
- Chen, X.; Zhao, S.; Si, Z.; Qi, L.; Kang, N. Fractal characteristics of pore structure of coal with different metamorphicdegrees and its effect on gas adsorption characteristics. Coal Sci. Technol. 2020, 48, 118–124. [Google Scholar]
- Chen, Y.; Zou, C.; Maria, M.; Zhu, R.; Bai, B.; Yang, Z. Porosity and fractal characteristics of shale across a maturation gradient. Nat. Gas Geosci. 2015, 26, 1646–1656. [Google Scholar]
- Hu, J.; Tang, S.; Zhang, S. Investigation of pore structure and fractal characteristics of the Lower Silurian Longmaxi shales in western Hunan and Hubei Provinces in China. J. Nat. Gas Sci. Eng. 2016, 28, 522–535. [Google Scholar] [CrossRef]
- Zhang, S.; Tang, S.; Tang, D.; Huang, W.; Pan, Z. Determining fractal dimensions of coal pores by FHH model: Problems and effects. J. Nat. Gas Sci. Eng. 2014, 21, 929–939. [Google Scholar] [CrossRef]
- Liu, G. Mechanism and Model of Coal Adsorption Gas in High Temperature and Pressure and Three-Phase Medium. Ph.D. Thesis, Henan Polytechnic University, Jiaozuo, China, 2011. [Google Scholar]
- Wang, Z.; Cheng, Y.; Qi, Y.; Wang, R.; Wang, L.; Jiang, J. Experimental study of pore structure and fractal characteristics of pulverized intact coal and tectonic coal by low temperature nitrogen adsorption. Powder Technol. 2019, 350, 15–25. [Google Scholar] [CrossRef]
- Jaroniec, M. Evaluation of the Fractal Dimension from a Single Adsorption Isotherm. Langmuir 1995, 11, 2316–2317. [Google Scholar] [CrossRef]
- Fang, Y.; Cao, Y.; Jin, M.; Yang, J.; Qian, Z. Effect of Anthracite in Coal Blend on Micro-Crystal and Pore Structure of Coke. Iron Steel 2006, 41, 16. [Google Scholar]
- Ye, Z.; Hou, E.; Duan, Z.; Wen, Q.; Huang, M.; He, D. Fractal characteristics of pores and microfractures of coals with different structure and their effect on permeability. Coal Geol. Explor. 2019, 47, 70–78. [Google Scholar]
- Wang, Z.; Cheng, Y.; Zhang, K.; Hao, C.; Wang, L.; Li, W.; Hu, B. Characteristics of microscopic pore structure and fractal dimension of bituminous coal by cyclic gas adsorption/desorption: An experimental study. Fuel 2018, 232, 495–505. [Google Scholar]
- Pan, Z.; Connell, L.D. A theoretical model for gas adsorption-induced coal swelling. Int. J. Coal Geol. 2007, 69, 243–252. [Google Scholar] [CrossRef]
- Ttinger, I.L. Swelling stress in the gas-coal system as an energy source in the development of gas bursts. Sov. Min. Sci. 1979, 15, 494–501. [Google Scholar] [CrossRef]
- Xu, J.; Peng, S.; Yin, G.; Tao, Y.; Yang, H.; Wang, W. Development and Application of Triaxial Servo-controlled Seepage Equipment for Thermo-fluid-solid Coupling of Coal Containing Methane. Chin. J. Rock Mech. Eng. 2010, 29, 907–914. [Google Scholar]
- Zhao, Y.; Zhang, L.; Wang, W.; Tang, J.; Lin, H.; Wan, W. Transient pulse test and morphological analysis of single rock fractures. Int. J. Rock Mech. Min. Sci. 2017, 91, 139–154. [Google Scholar] [CrossRef]
- Zhao, J.; Xu, H.; Tang, D.; Mathews, J.P.; Li, S.; Tao, S. Coal seam porosity and fracture heterogeneity of macrolithotypes in the Hancheng Block, eastern margin, Ordos Basin, China. Int. J. Coal Geol. 2016, 159, 18–29. [Google Scholar] [CrossRef]
- Lv, R.; Peng, S.; Liu, G.; Li, B.; Pan, J.; Lin, X. High-pressure methane adsorption-induced coal swelling on equilibrium moisture coal samples. Energy Sources Part A Recovery Util. Environ. Eff. 2016, 38, 2119–2127. [Google Scholar]
- Lv, R.; Li, B.; Song, Z.; Liu, G. Experimental Investigation on Permeability and Mechanical Deformation of Coal Containing Gas under Load. Adv. Civ. Eng. 2018, 2018, 7341523. [Google Scholar] [CrossRef] [Green Version]
- Zhao, Y.; Liu, Q.; Zhang, C.; Liao, J.; Lin, H.; Wang, Y. Coupled seepage-damage effect in fractured rock masses: Model development and a case study. Int. J. Rock Mech. Min. Sci. 2021, 144, 104822. [Google Scholar]
- Zhao, Y.; Wang, Y.; Wang, W.; Tang, L.; Liu, Q.; Cheng, G. Modeling of rheological fracture behavior of rock cracks subjected to hydraulic pressure and far field stresses. Theor. Appl. Fract. Mech. 2019, 101, 59–66. [Google Scholar] [CrossRef]
- Zhao, Y.; Zhang, C.; Wang, Y.; Lin, H. Shear-related roughness classification and strength model of natural rock joint based on fuzzy comprehensive evaluation. Int. J. Rock Mech. Min. Sci. 2021, 137, 104550. [Google Scholar] [CrossRef]
- Liu, J.; Zhao, Y.; Tan, T.; Zhang, L.; Zhu, S.; Xu, F. Evolution and modeling of mine water inflow and hazard characteristics in southern coalfields of China: A case of Meitanba mine. Int. J. Min. Sci. Technol. 2022, 32, 513–524. [Google Scholar] [CrossRef]
- Liu, Q.; Zhao, Y.; Tang, L.; Liao, J.; Wang, X.; Tan, T.; Chang, L.; Luo, S.; Wang, M. Mechanical characteristics of single cracked limestone in compression-shear fracture under hydro-mechanical coupling. Theor. Appl. Fract. Mech. 2022, 119, 103371. [Google Scholar] [CrossRef]
- Wei, M.; Liu, J.; Feng, X.; Wang, C.; Fang, K.; Zhou, F.; Zhang, S.; Xia, T. Quantitative study on coal permeability evolution with consideration of shear dilation. J. Nat. Gas Sci. Eng. 2016, 36, 1199–1207. [Google Scholar] [CrossRef]
- Zhou, J.; Xian, X.; Jiang, Y.; Li, X.; Jiang, D. Permeability model considering effective stress and shrinkage effect of coal matrix. J. Southwest Pet. Univ. Sci. Technol. Ed. 2009, 31, 4–8. [Google Scholar]
Figure 1.
Geographic sketch maps of Guhanshan coal mine.

Figure 2.
Photos of experimental coal samples and equipment: (a) heat-shrinkable tube; (b) experimental coal sample; and (c) thermo-solid-fluid coupling triaxial servo seepage device.
Figure 2.
Photos of experimental coal samples and equipment: (a) heat-shrinkable tube; (b) experimental coal sample; and (c) thermo-solid-fluid coupling triaxial servo seepage device.
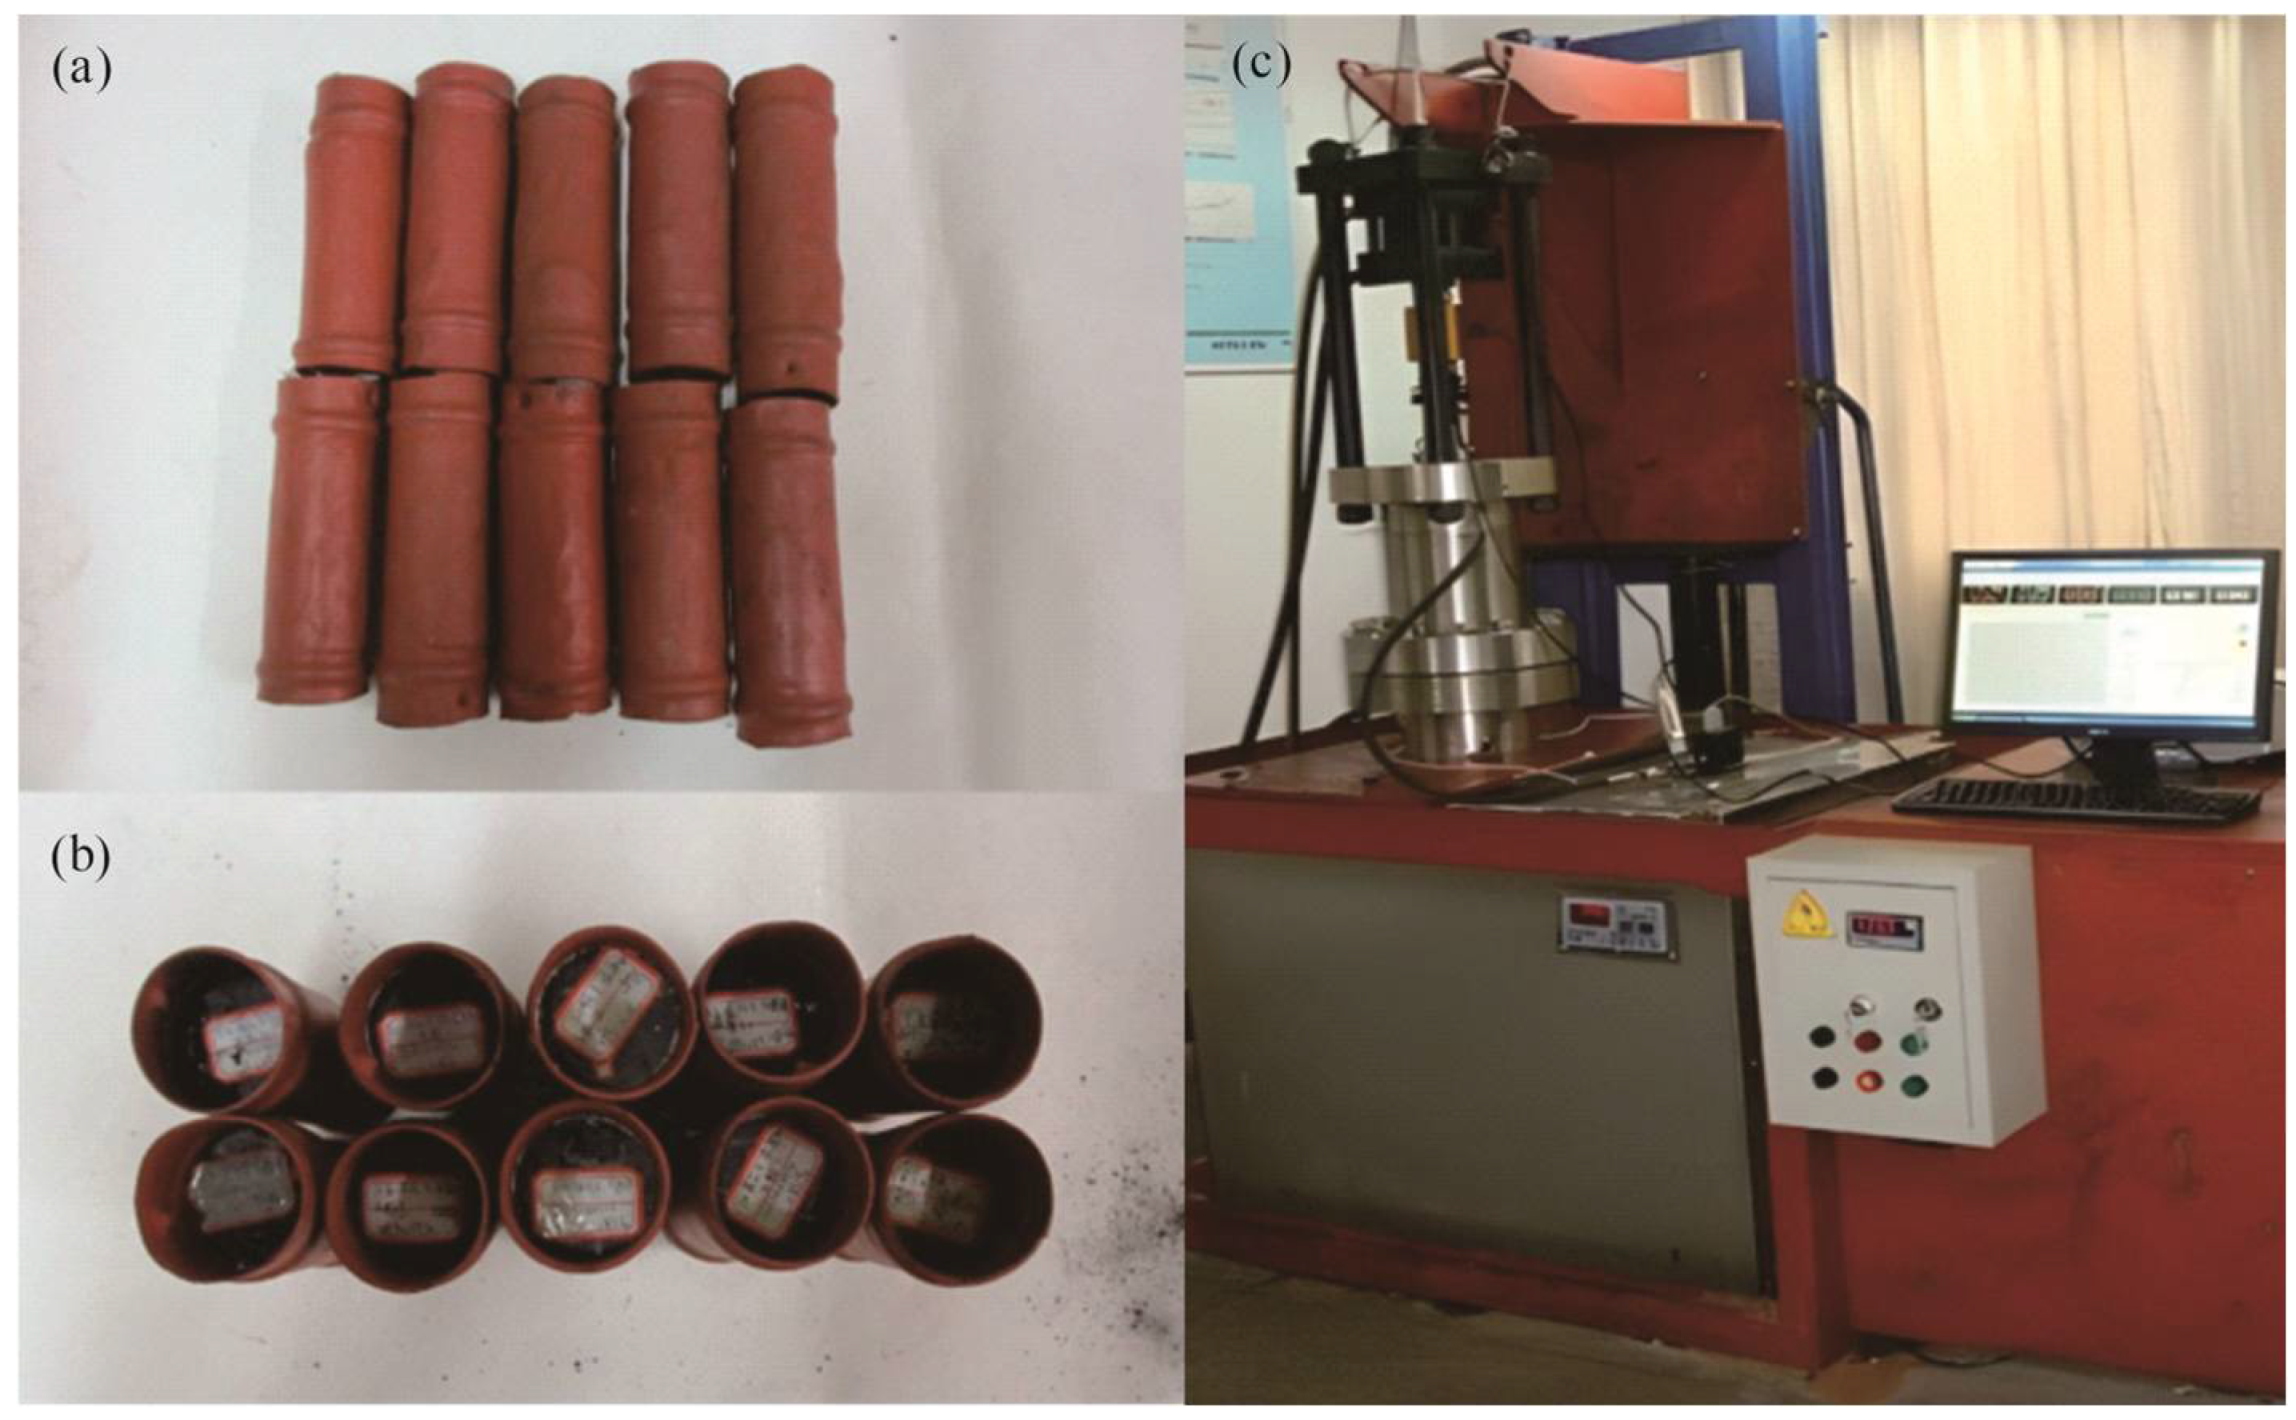
Figure 3.
Strain-permeability test curves: (a) inlet pressure of 1 MPa; (b) inlet pressure of 2 MPa; and (c) complete stress–strain curves for the confining pressure of 4, 6, and 8 MPa.
Figure 3.
Strain-permeability test curves: (a) inlet pressure of 1 MPa; (b) inlet pressure of 2 MPa; and (c) complete stress–strain curves for the confining pressure of 4, 6, and 8 MPa.
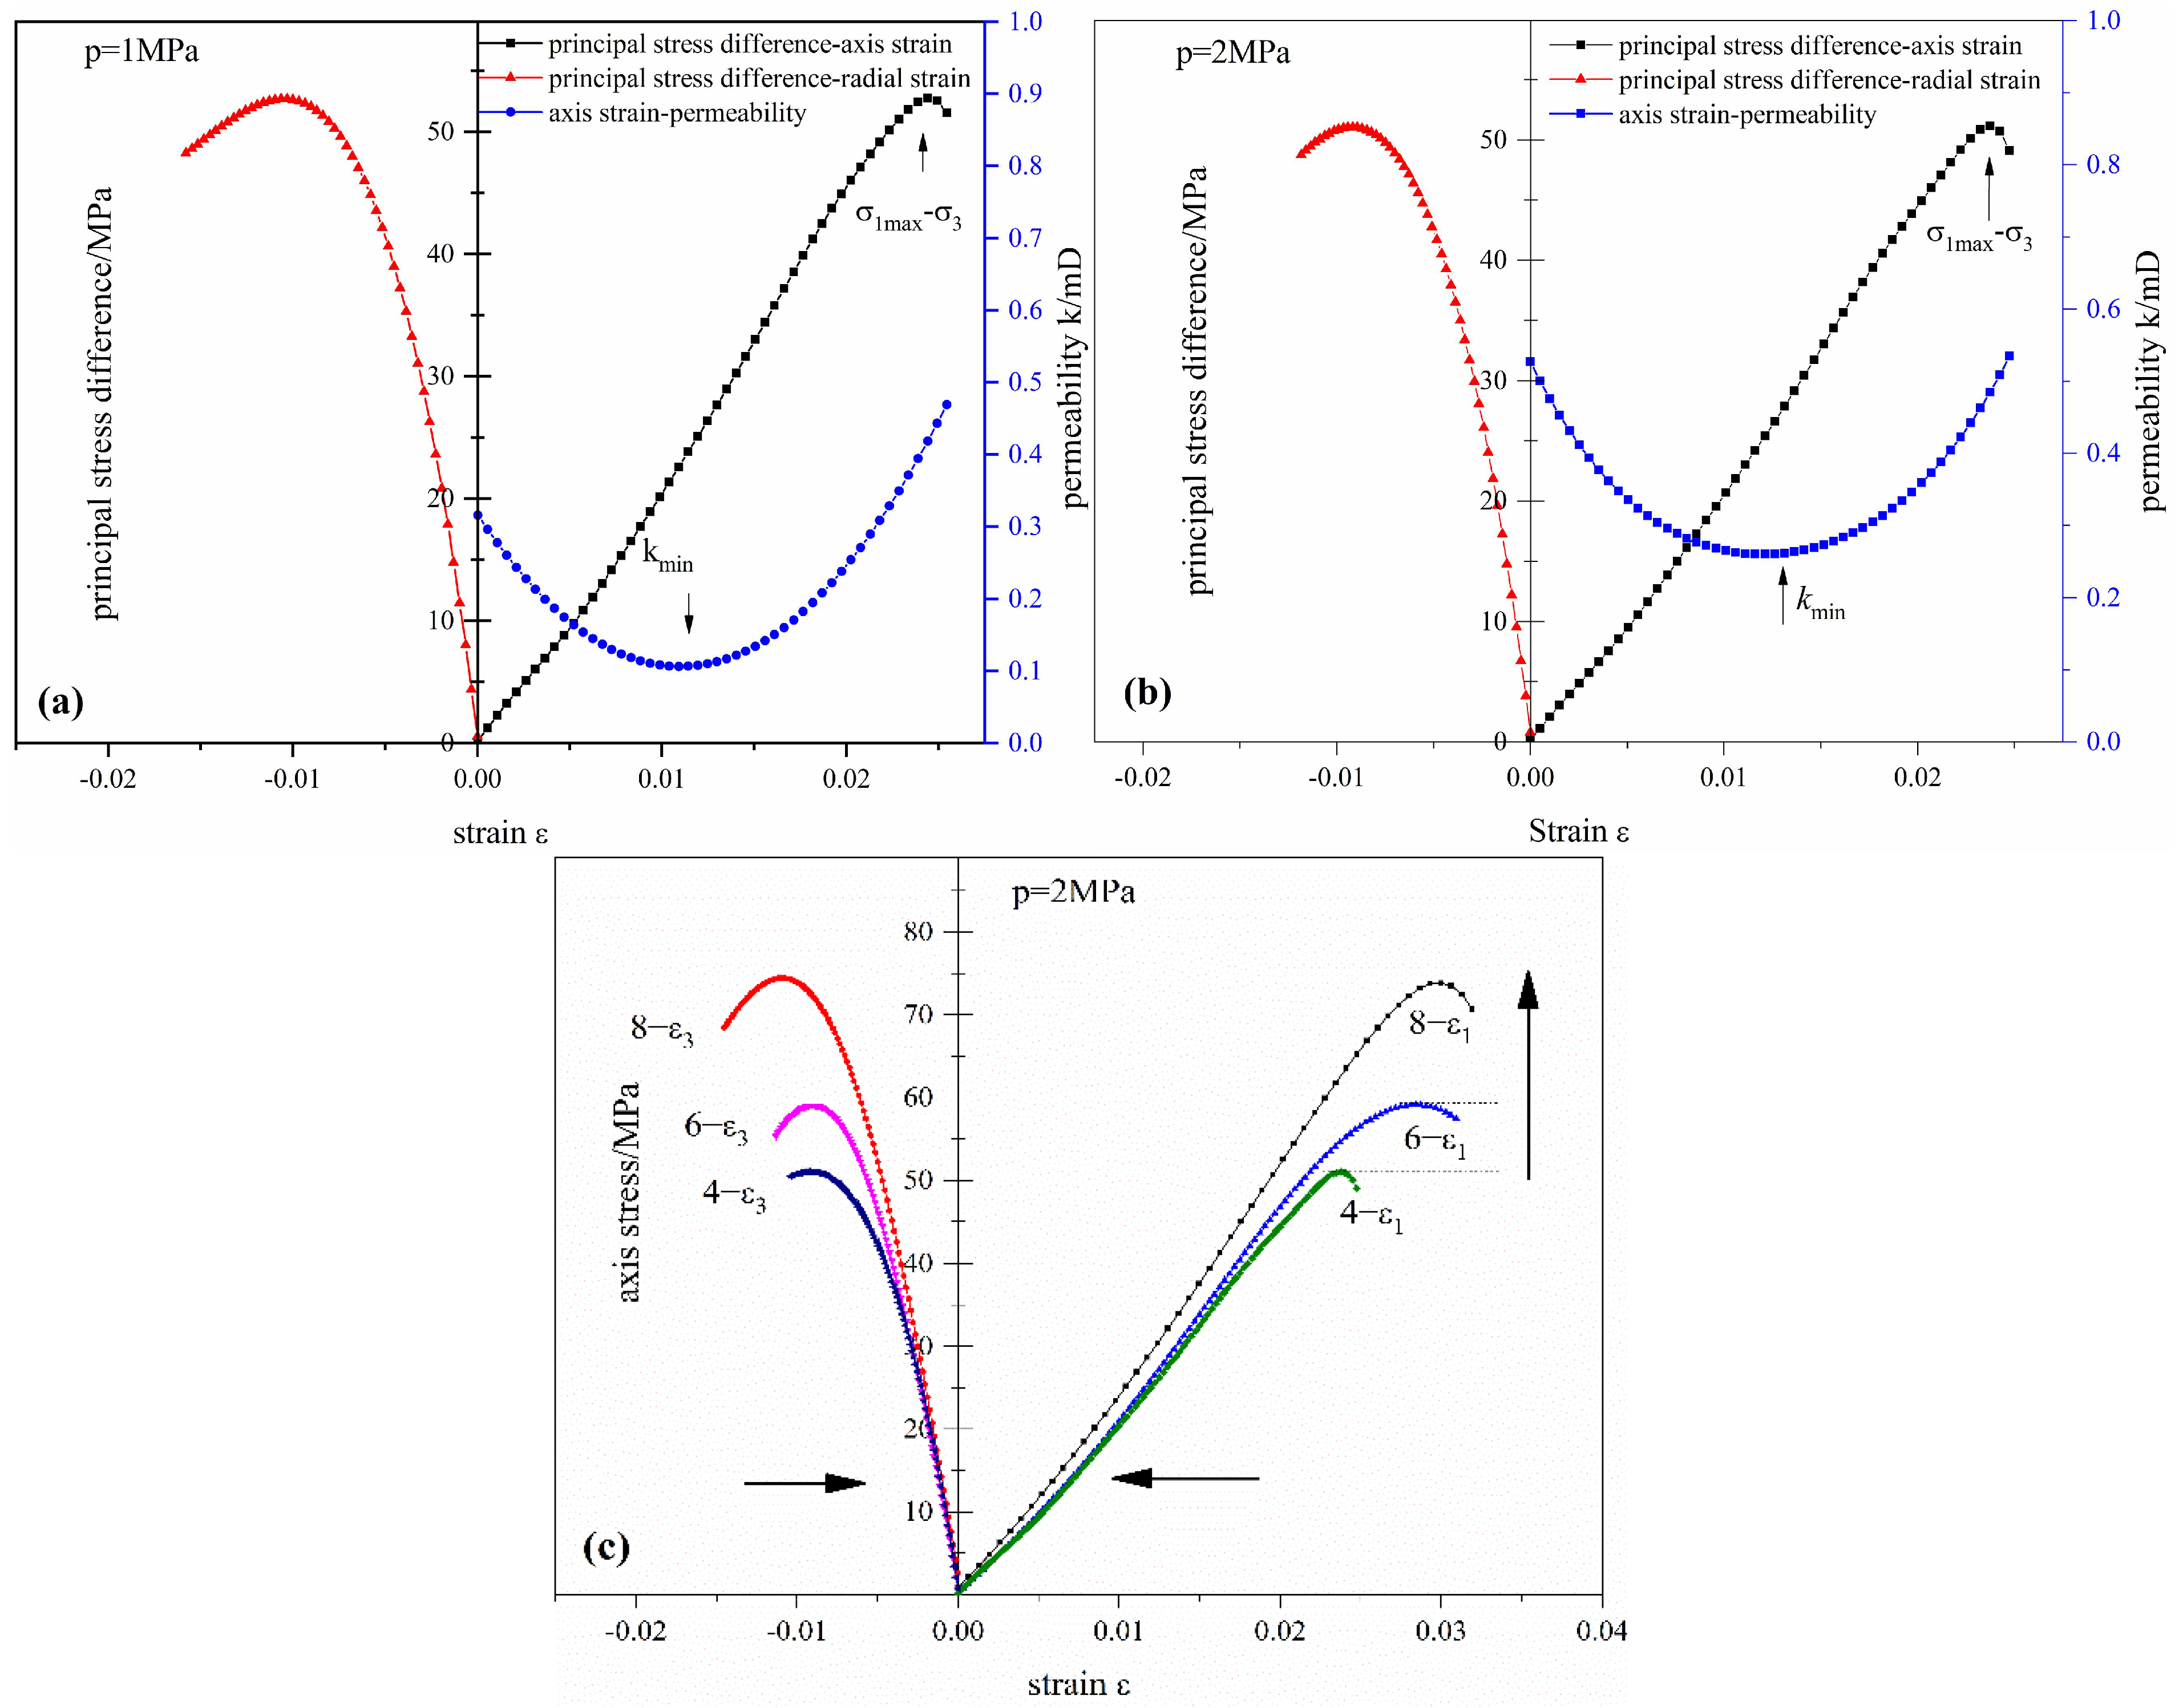
Figure 4.
Mercury injection and ejection curve of 1 coal sample.
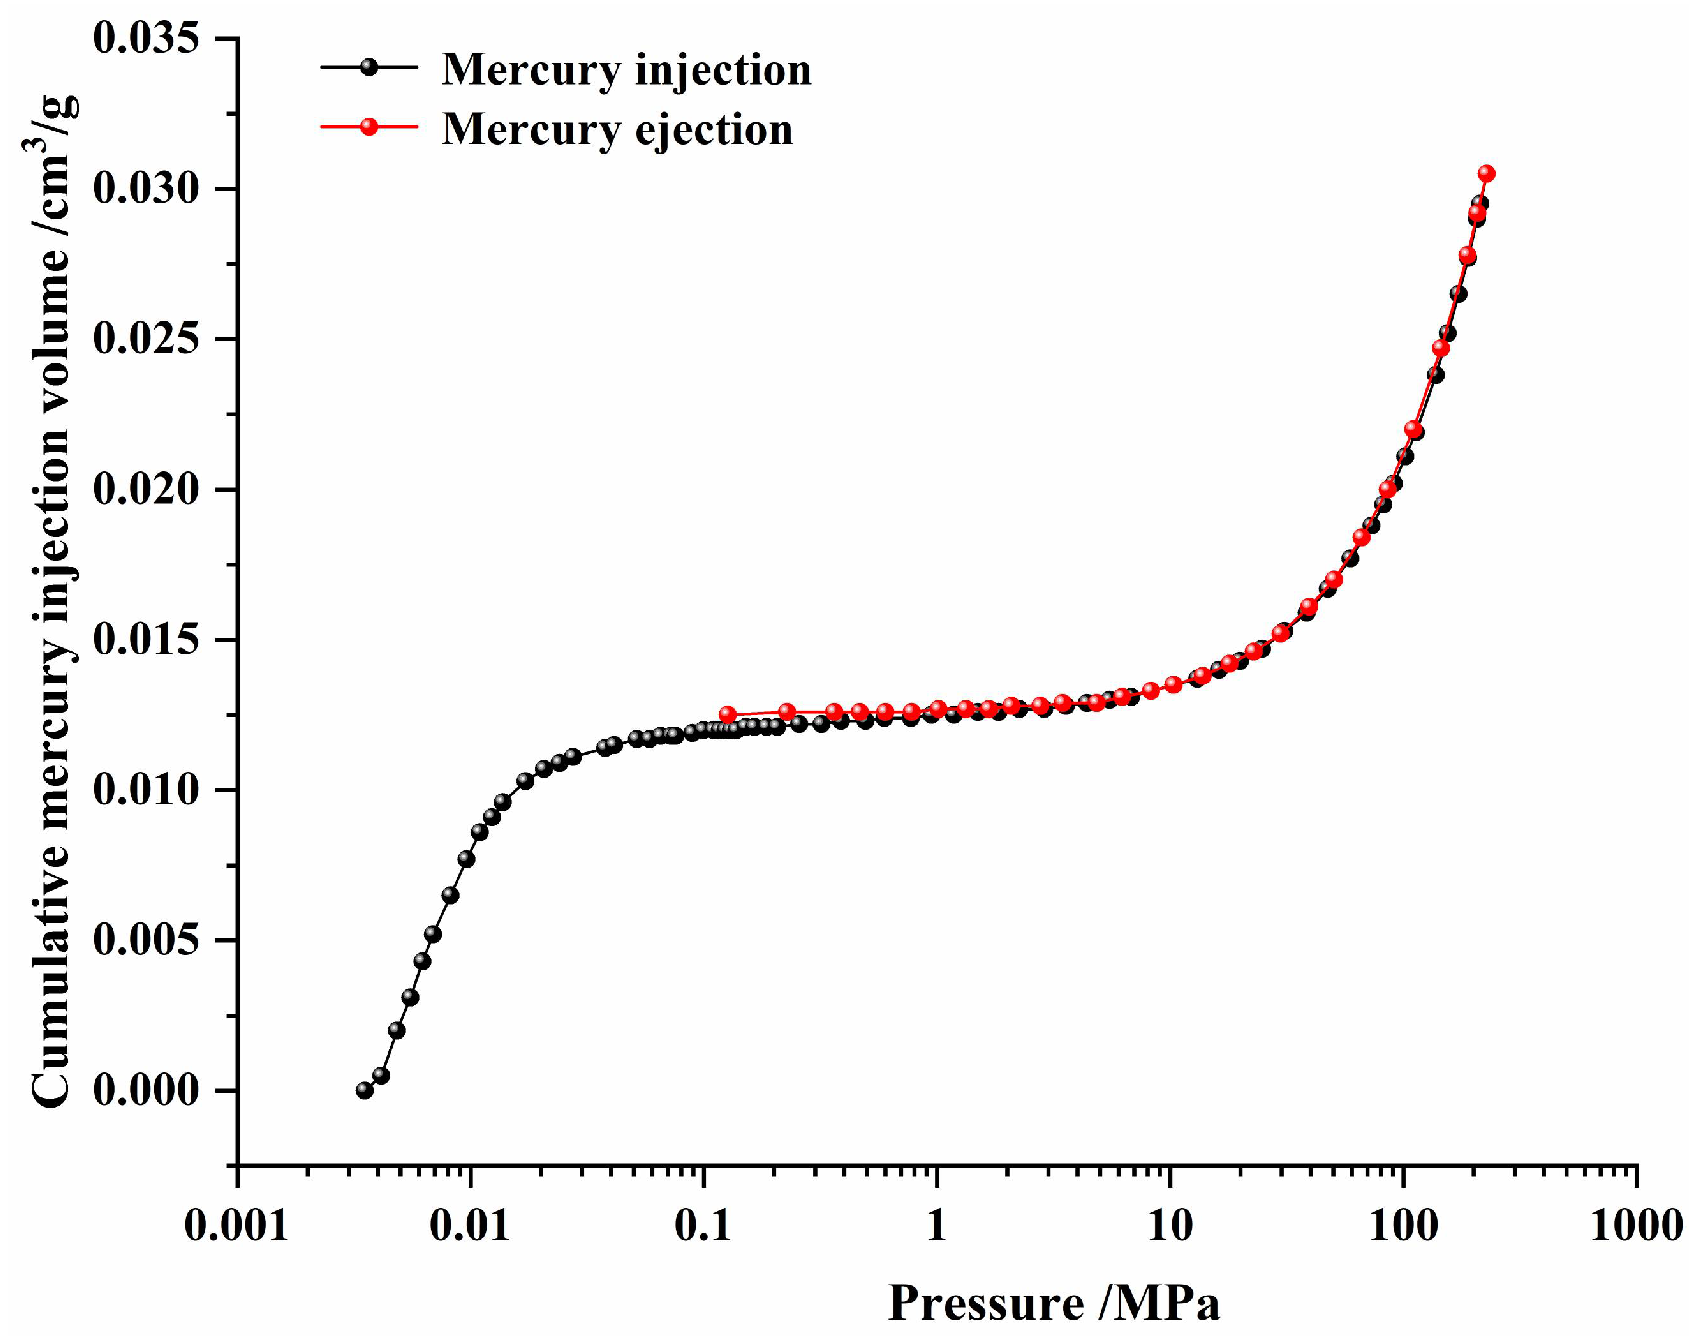
Figure 5.
Statistical relationship between log(dV/dp) and log p of 1 coal sample.
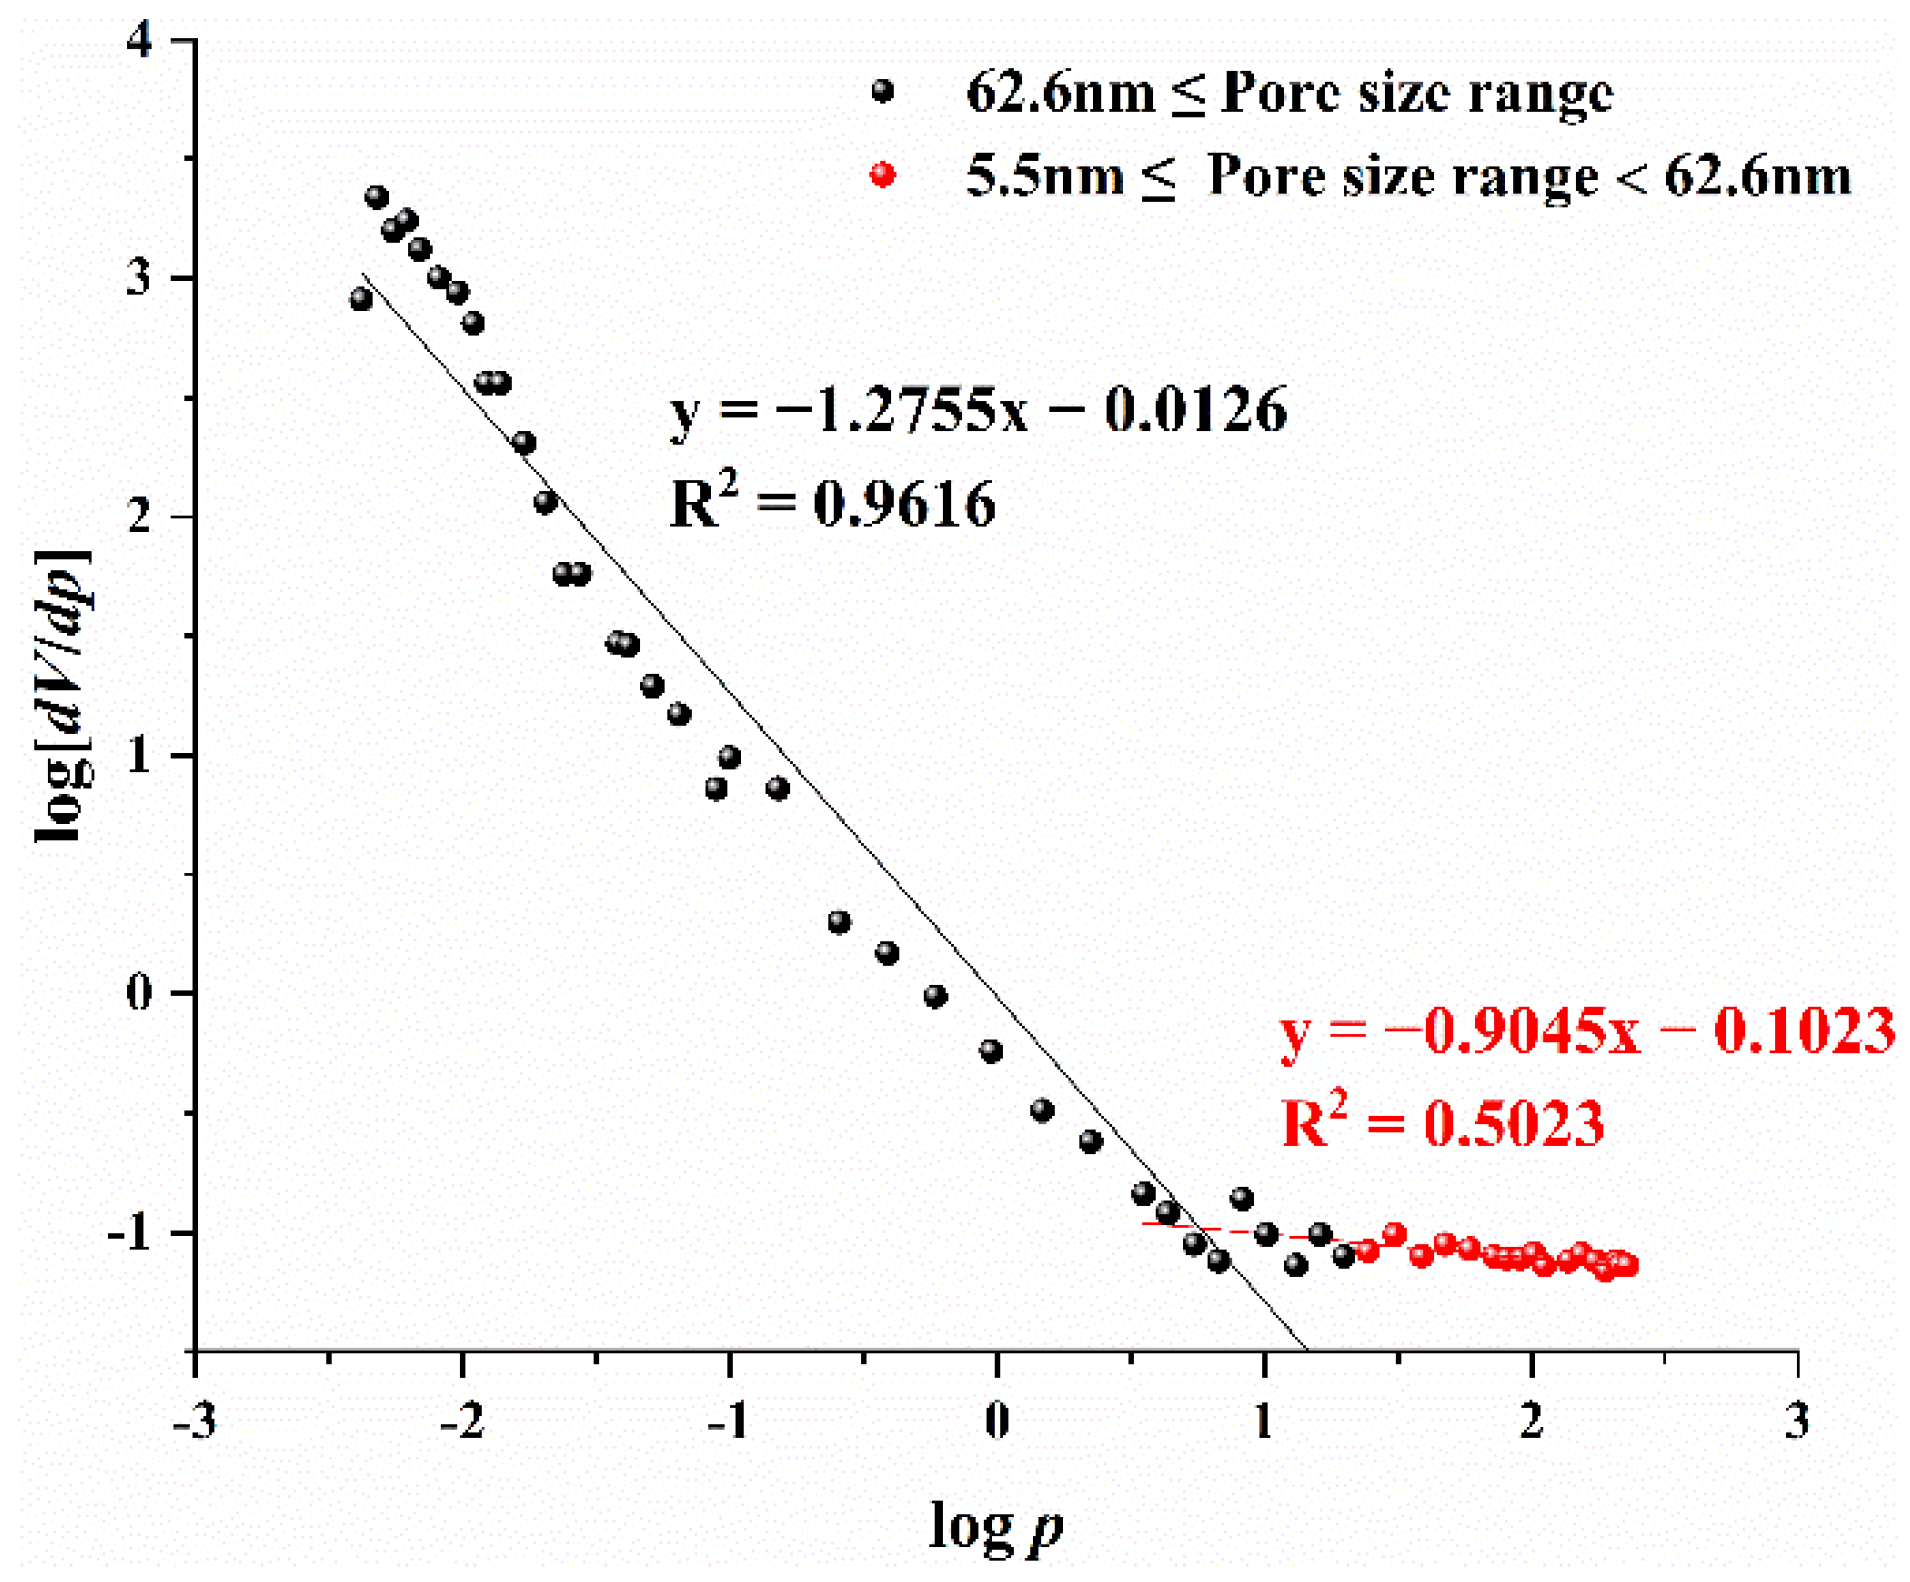
Figure 6.
Adsorption line of 1 coal sample.

Figure 7.
Statistical relationship between lnV and ln[ln(p0/p)] of 1 coal sample.
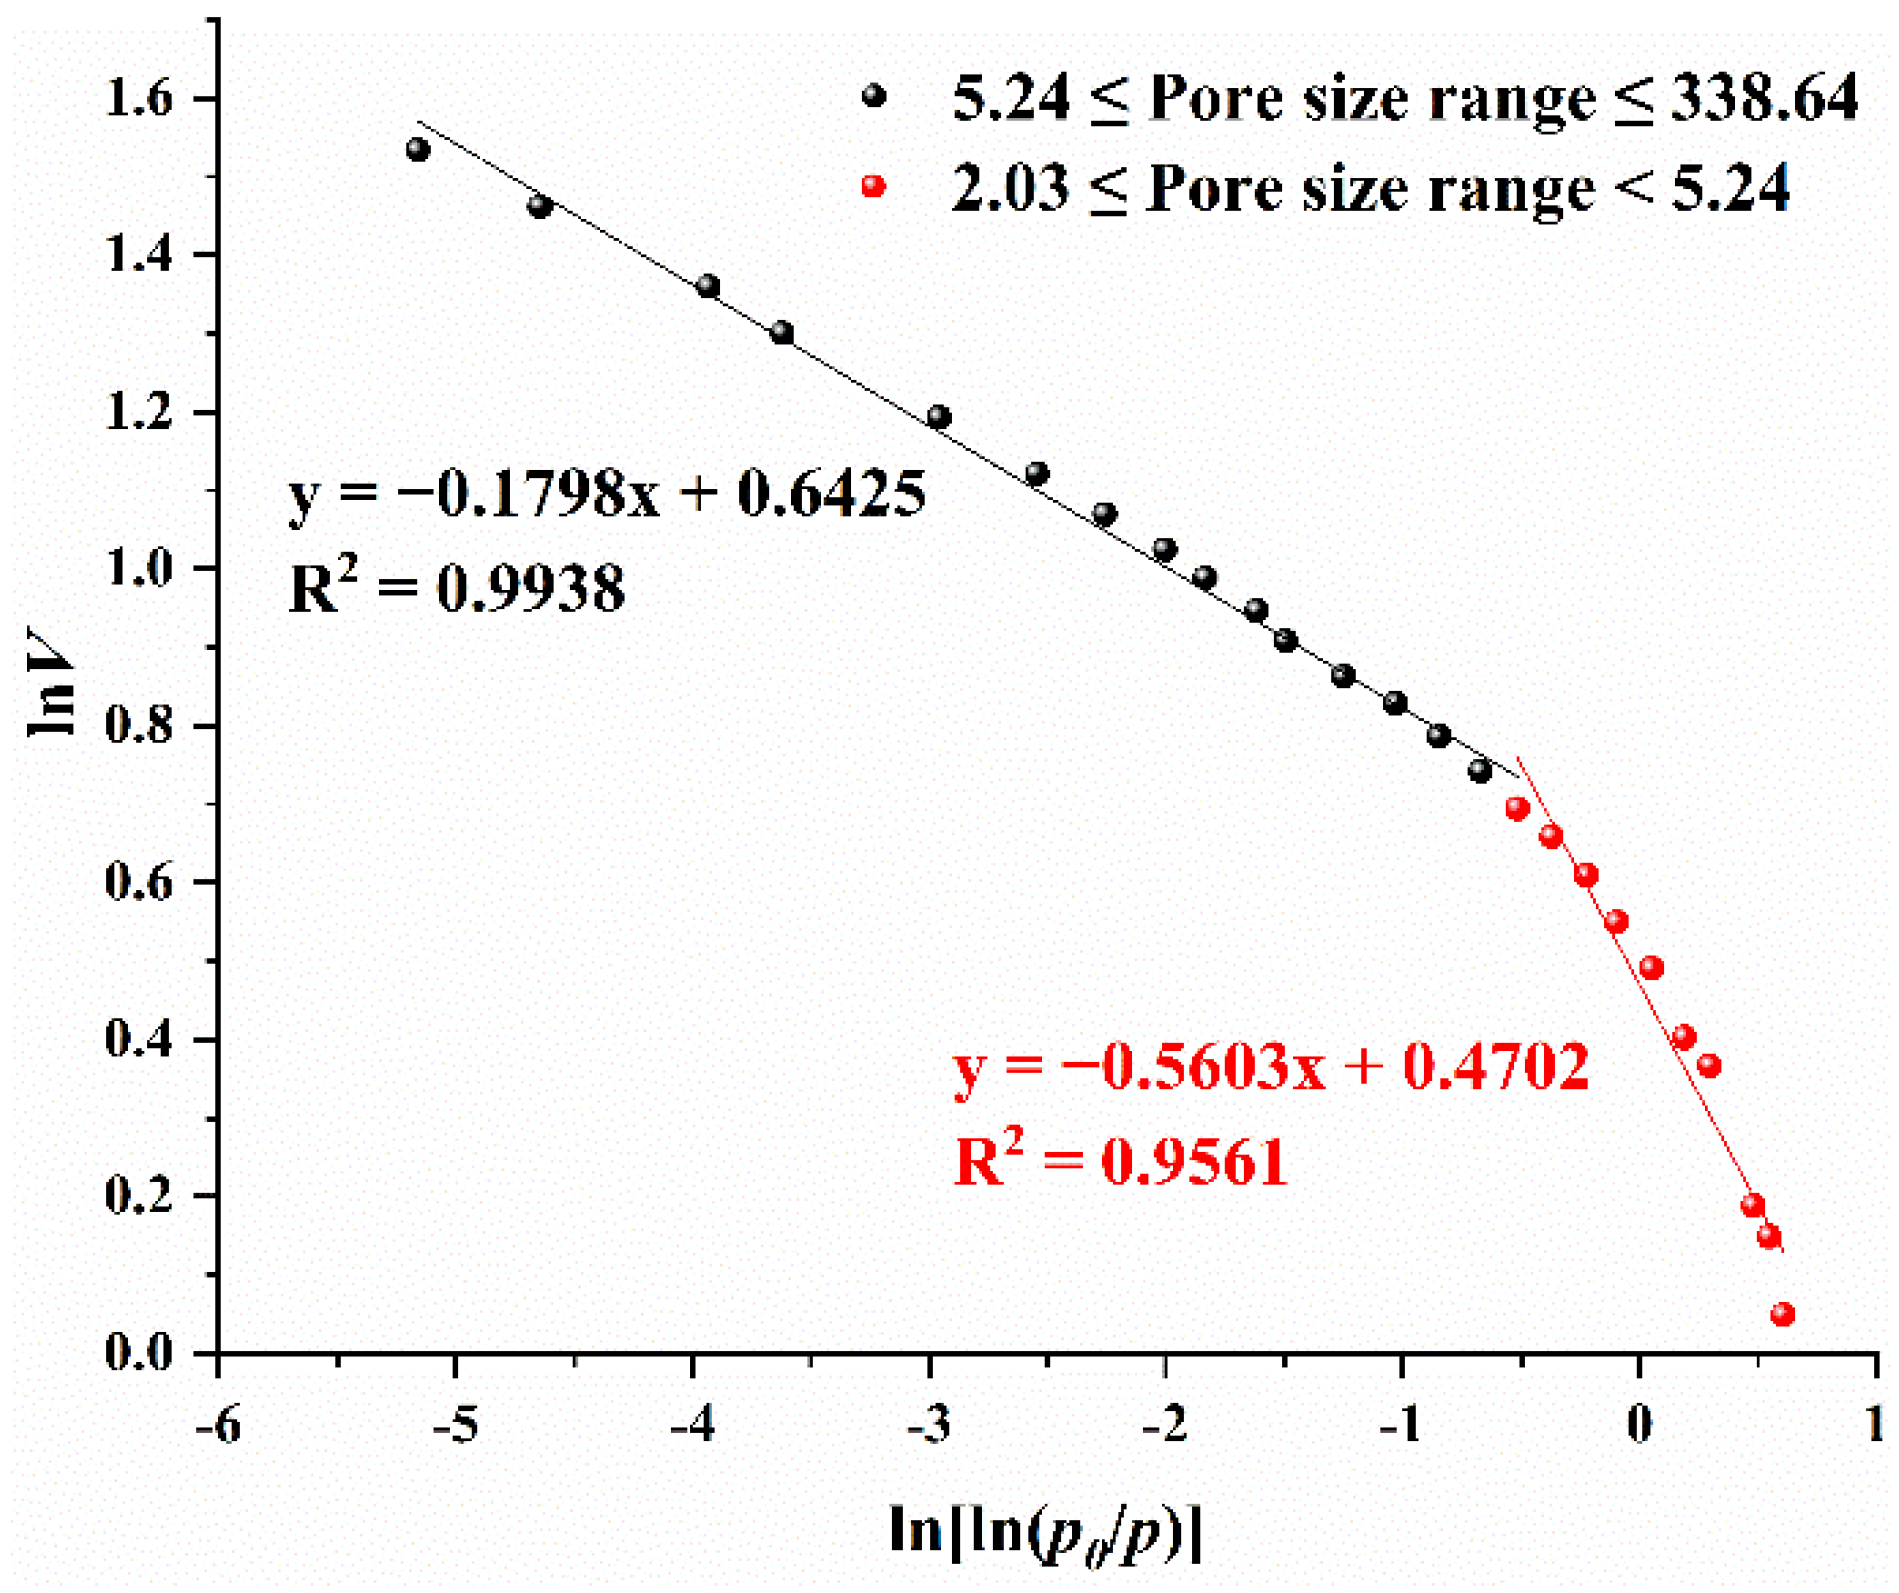
Figure 8.
Statistical plots of the fitting results for VL − VF-L and PL − PF-L.
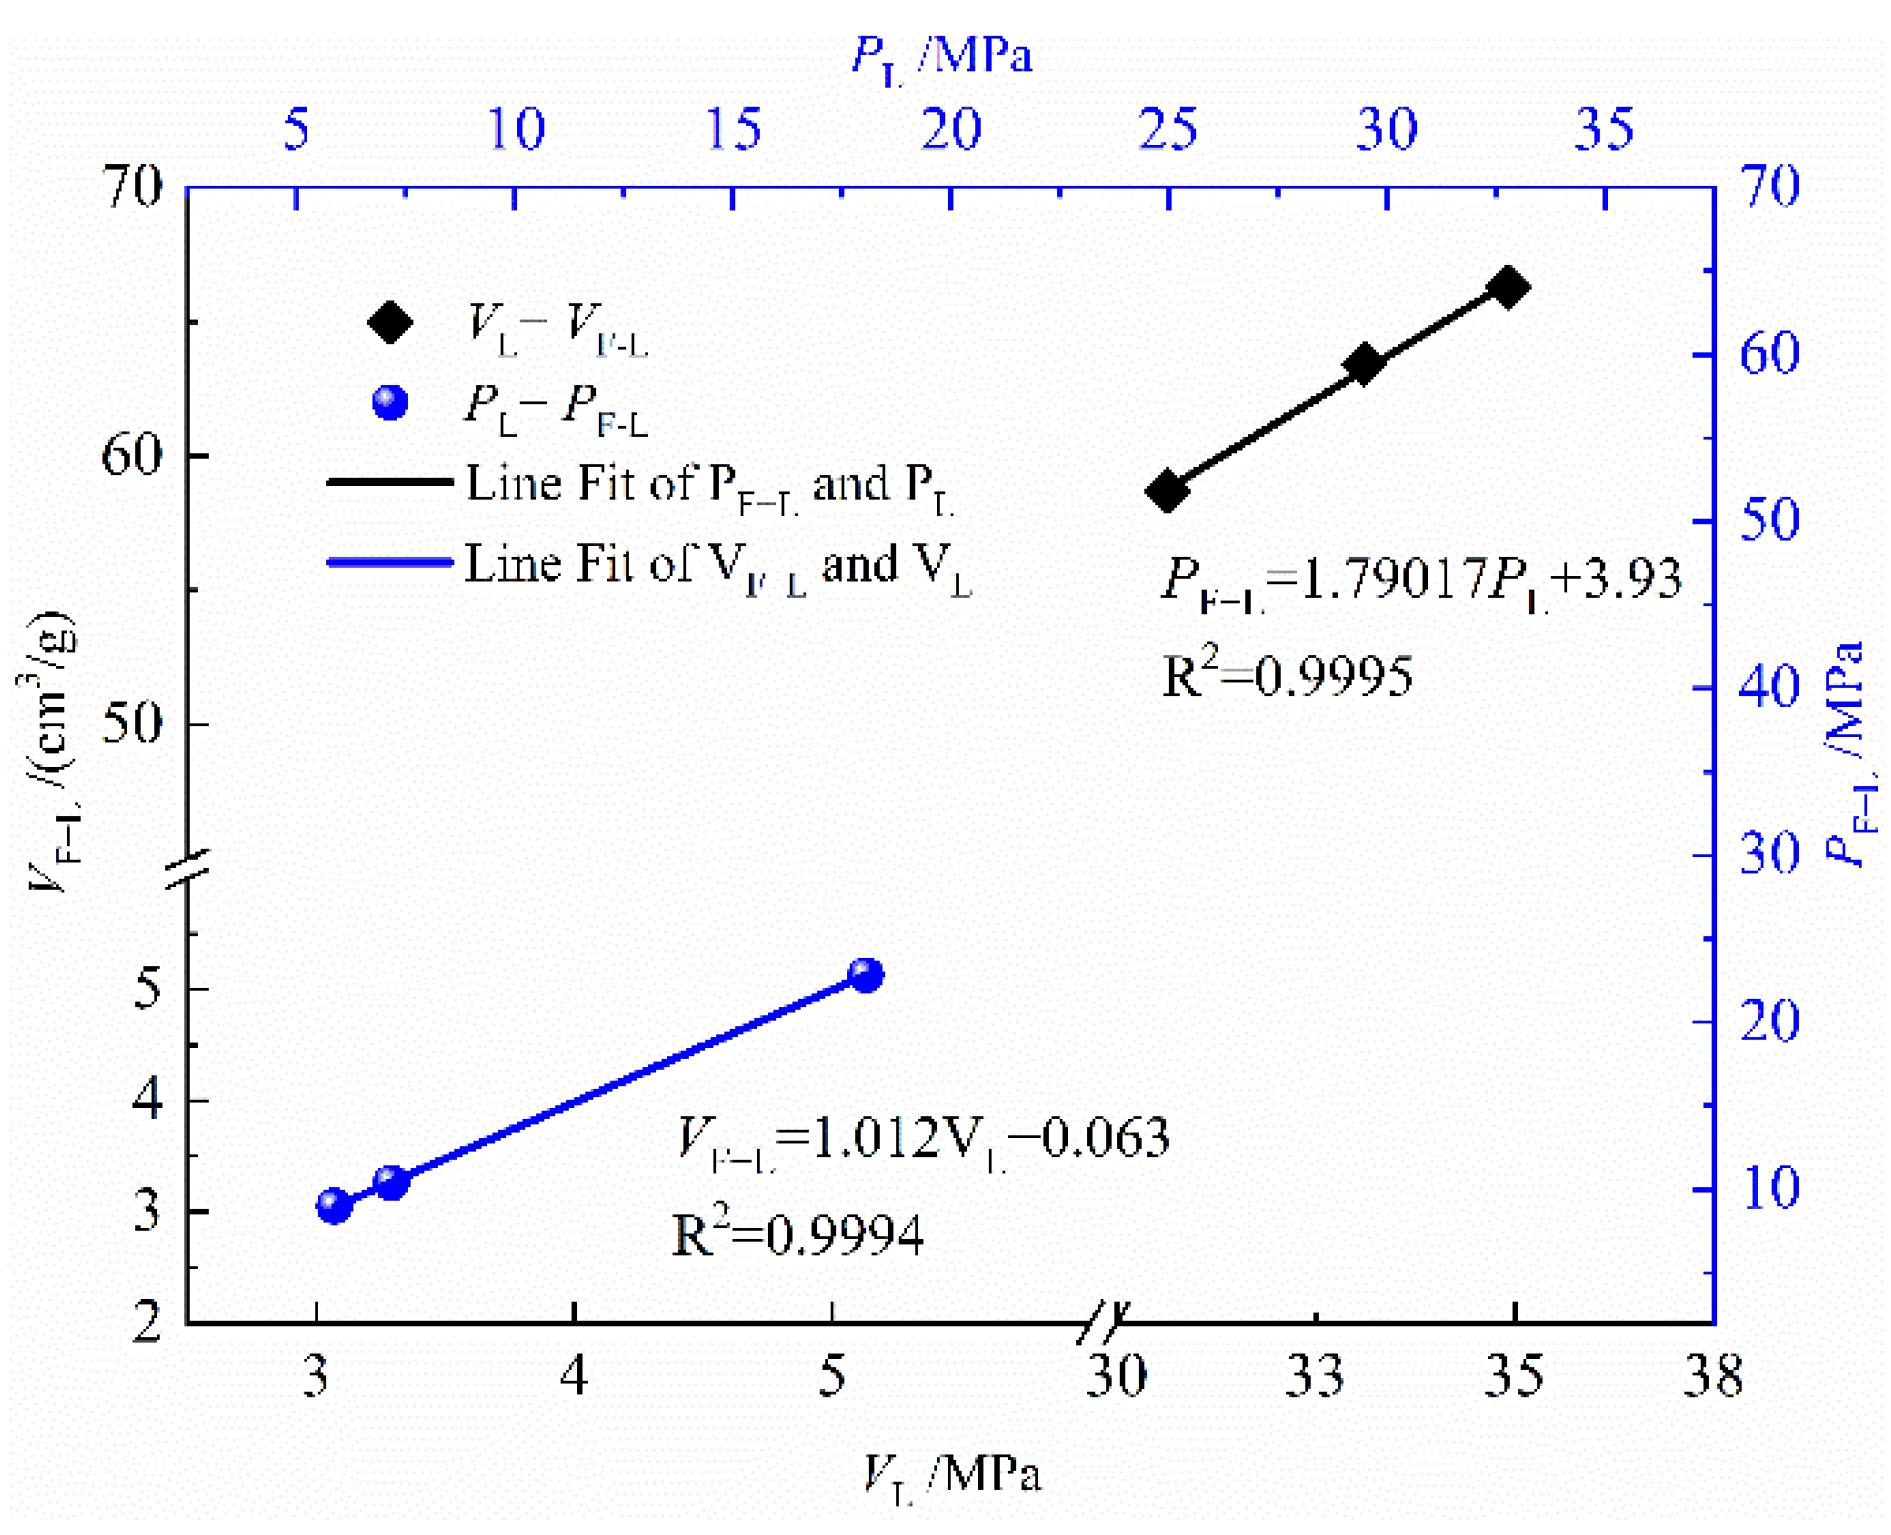
Figure 9.
Comparison of the theoretical solution and measured values.

Table 2.
Test results of reflectivity and microcomponents of coal samples.
| Coal Sample Number | Place of Origin | Ro,max/% | Microcomponents/% | |||
|---|---|---|---|---|---|---|
| Vitrinite | Exinite | Inertinite | Mineral | |||
| 1 | Jiaozuo Guhanshan Mine | 3.49 | 92 | Microscale | 6 | 2 |
Note: Ro,max is the maximum vitrinite reflectance.
Table 3.
Industrial analysis and permeability test results of coal samples.
| Coal Sample Number | Industrial Analysis | Porosity φ/% | |||
|---|---|---|---|---|---|
| Mad/% | Ad/% | Vdaf/% | FCad/% | ||
| 1 | 1.26 | 6.31 | 7.71 | 84.72 | 4.61 |
Note: Mad, moisture on air-dry basis; Ad, ash on a dry basis; Vdaf, volatile matter on dry ash free basis; FCad, fixed carbon on air-dry basis; and φ = (ARD − TRD)/ARD × 100%, where ARD is apparent relative density and TRD is true relative density.
Table 4.
Test results under different experimental conditions.
| Type | Test No. | σc Location | σ3/MPa | p/MPa | Permeability/10−3 μm2 | Compressive Strength/MPa | Poisson’s Ratio/μ | ||||
|---|---|---|---|---|---|---|---|---|---|---|---|
| ε1% | ε3% | εv% | Initial Value | Minimum | σc Location | ||||||
| Raw coal | 1 | 2.385 | −0.893 | 0.599 | 4 | 1 | 0.513 | 0.239 | 0.430 | 55.22 | 0.85 |
| 2 | 2.669 | −0.913 | 0.843 | 6 | 0.042 | 0.108 | 0.232 | 65.23 | 0.84 | ||
| 3 | 3.052 | −0.968 | 1.116 | 8 | 0.028 | 0.023 | 0.112 | 83.35 | 0.91 | ||
| 4 | 2.518 | −1.121 | 0.276 | 4 | 2 | 0.265 | 0.106 | 1.600 | 46.77 | 0.93 | |
| 5 | 2.717 | −1.130 | 0.457 | 6 | 0.161 | 0.095 | 0.457 | 57.89 | 0.82 | ||
| 6 | 2.935 | −1.213 | 0.509 | 8 | 0.096 | 0.033 | 0.046 | 69.32 | 0.87 | ||
Table 5.
Results of pore volume experiment by mercury intrusion method.
| Sample Number | Pore Volume/(mL/g) | Pore Volume Ratio/% | |||||||
|---|---|---|---|---|---|---|---|---|---|
| V1 | V2 | V3 | V4 | Vt | V1/Vt | V2/Vt | V3/Vt | V4/Vt | |
| 1 | 0.0007 | 0.001 | 0.0084 | 0.0086 | 0.0187 | 3.74 | 5.35 | 44.92 | 45.99 |
Note: V1 is macropore volume (φ > 1000 nm); V2 is mesopore volume (1000 nm > φ > 100 nm); V3 is transition pore volume (100 nm > φ > 10 nm); V4 is micropore volume (10 nm) > φ > 5.5 nm); and Vt is the total pore volume.
Table 6.
Experimental results of pore specific surface area by mercury intrusion method.
| Sample Number | Pore Specific Surface Area/(m2/g) | Pore Specific Surface Area Ratio/% | |||||||
|---|---|---|---|---|---|---|---|---|---|
| S1 | S2 | S3 | S4 | St | S1/St | S2/St | S3/St | S4/St | |
| 1 | 0.001 | 0.017 | 1.628 | 4.631 | 6.277 | 0.02 | 0.27 | 25.94 | 73.78 |
Note: S1 is macropore specific surface area (φ > 1000 nm); S2 is mesopore specific surface area (1000 nm > φ > 100 nm); S3 is transition pore specific surface area (100 nm > φ > 10 nm); S4 is micropore specific surface area (10 nm) > φ > 5.5 nm); and St is the total specific surface area.
Table 7.
Calculation results of fractal dimension of coal (mercury intrusion method).
| Coal Sample Number | Pore Size Range/nm | Slope K | D1 | Correlation Coefficient r |
|---|---|---|---|---|
| 1 | 62.6 ≤ r ≤ 357057.1 | −1.2755 | 2.7245 | 0.9616 |
Table 8.
Experimental results of pore volume by adsorption method.
| Coal Type | Sample Number | Ro,max/% | Pore Volume/(mL/g) | Pore Volume Ratio/% | |||||
|---|---|---|---|---|---|---|---|---|---|
| V2 | V3 | V4 | Vt | V2/Vt | V3/Vt | V4/Vt | |||
| Anthracite | 1 | 3.49 | 0.001212 | 0.002502 | 0.003773 | 0.007487 | 16.19 | 33.42 | 50.39 |
Note: V1 is macropore volume (φ > 1000 nm); V2 is mesopore volume (1000 nm > φ > 100 nm); V3 is transition pore volume (100 nm > φ > 10 nm); V4 is micropore volume (10 nm) > φ > 5.5 nm); and Vt is the total pore volume.
Table 9.
Experimental results of pore specific surface area by adsorption method.
| Coal Type | Sample Number | Ro,max/% | Pore Volume/(mL/g) | Pore Volume Ratio/% | |||||
|---|---|---|---|---|---|---|---|---|---|
| S2 | S3 | S4 | St | S2/St | S3/St | S4/St | |||
| Anthracite | 1 | 3.49 | 0.032 | 0.411 | 5.169 | 5.612 | 0.57 | 7.32 | 92.11 |
Note: S2 is mesopore specific surface area (1000 nm > φ > 100 nm); S3 is transition pore specific surface area (100 nm > φ > 10 nm); S4 is micropore specific surface area (10 nm) > φ > 5.5 nm); and St is the total specific surface area.
Table 10.
Calculation results of fractal dimension of coal (liquid nitrogen adsorption method).
| Coal Sample Number | Pore Size Range/nm | Slope K | D2 | Correlation Coefficient r |
|---|---|---|---|---|
| 1 | 5.24 ≤ d ≤ 338.64 | −0.1798 | 2.8202 | 0.9938 |
| 2.03 ≤ d ≤ 5.24 | −0.5603 | 2.4397 | 0.9561 |
Table 11.
Calculation results of comprehensive fractal dimension of coal.
| Coal Sample Number | Pore Size Range/nm | Di | Specific Surface Area/(m2/g) | Specific Surface Area Ratio/% | Dz |
|---|---|---|---|---|---|
| 1 | d > 100 | 2.7245 | 0.0185 | 0.33 | 2.6615 |
| 5.24 ≤ d ≤ 100 | 2.8202 | 4.717 | 84.51 | ||
| 2 < d < 5.24 | 2.4397 | 0.846 | 15.16 |
Table 12.
Fractal Langmuir pressure and volume calculation results for adsorption of coal samples.
| No. | Temperature/°C | Adsorption Volume/(cm3/g) | Adsorption Pressure/MPa | ||
|---|---|---|---|---|---|
| VL | VF-L | PL | PF-L | ||
| 1 | 30 | 33.28 | 63.42 | 5.02 | 5.02 |
| 40 | 34.91 | 66.59 | 3.27 | 3.28 | |
| 50 | 30.75 | 58.55 | 3.07 | 3.05 | |
Publisher’s Note: MDPI stays neutral with regard to jurisdictional claims in published maps and institutional affiliations. |
© 2022 by the authors. Licensee MDPI, Basel, Switzerland. This article is an open access article distributed under the terms and conditions of the Creative Commons Attribution (CC BY) license (https://creativecommons.org/licenses/by/4.0/).
Share and Cite
MDPI and ACS Style
Lv, R.; Zhu, Y.; Ma, X.; Ni, X.; Ren, J. Coupled Seepage Mechanics Model of Coal Containing Methane Based on Pore Structure Fractal Features. Fractal Fract. 2022, 6, 391. https://doi.org/10.3390/fractalfract6070391
AMA Style
Lv R, Zhu Y, Ma X, Ni X, Ren J. Coupled Seepage Mechanics Model of Coal Containing Methane Based on Pore Structure Fractal Features. Fractal and Fractional. 2022; 6(7):391. https://doi.org/10.3390/fractalfract6070391
Chicago/Turabian StyleLv, Runsheng, Yuchen Zhu, Xinyu Ma, Xiaoming Ni, and Jiangang Ren. 2022. "Coupled Seepage Mechanics Model of Coal Containing Methane Based on Pore Structure Fractal Features" Fractal and Fractional 6, no. 7: 391. https://doi.org/10.3390/fractalfract6070391