
Proportional-Integral-Derivative Controller Based-Artificial Rabbits Algorithm for Load Frequency Control in Multi-Area Power Systems


(This article belongs to the Section Engineering)
Abstract
:1. Introduction
- ▪
- In contrast to the scenario employed by the other methods, a unique model is utilized in the ARA.
- ▪
- Given the distinctive characteristics of the ARA, this paper’s focus is on optimizing the PID controller settings for the LFC problems.
- ▪
- The simulation techniques make use of a two-area non-reheat thermal MAPS.
- ▪
- The suggested ARA is used in comparison to the particle swarm optimization (PSO), differential evolution (DE), JAYA optimizer, and self-adaptive multi-population elitist (SAMPE) JAYA optimizers in three distinct test situations with different sets of disturbances.
- ▪
- The outcomes produced by the ARA-based PID controller design are evaluated against a number of published methods.
- ▪
- These simulated results demonstrate that the developed PID controller relying on the ARA is efficient and excellent at managing load frequency management in multiple-area power grids.
- ▪
- It is reliable and produces superior outcomes when compared to other indices and instances.
2. Problem Formulation
2.1. MAPS Model

2.2. Objective Function
- The frequency variation should recover to zero once the load is altered.
- The integral of the frequency error must have the lowest feasible value.
- The control loop needs to be sufficiently stable.
- Each region shall carry out its load under normal circumstances, and after a load disruption, the power exchange between areas should be quickly restored to its planned value. A time-domain goal function is modified using integral criteria to determine the best PID controller gains as follows:
For PID controller: Kpmin ≤ Kp ≤ Kpmax,
Kimin ≤ Ki ≤ Kimax,
Kdmin ≤ Kd ≤ Kdmax,
nmin ≤ n ≤ nmax
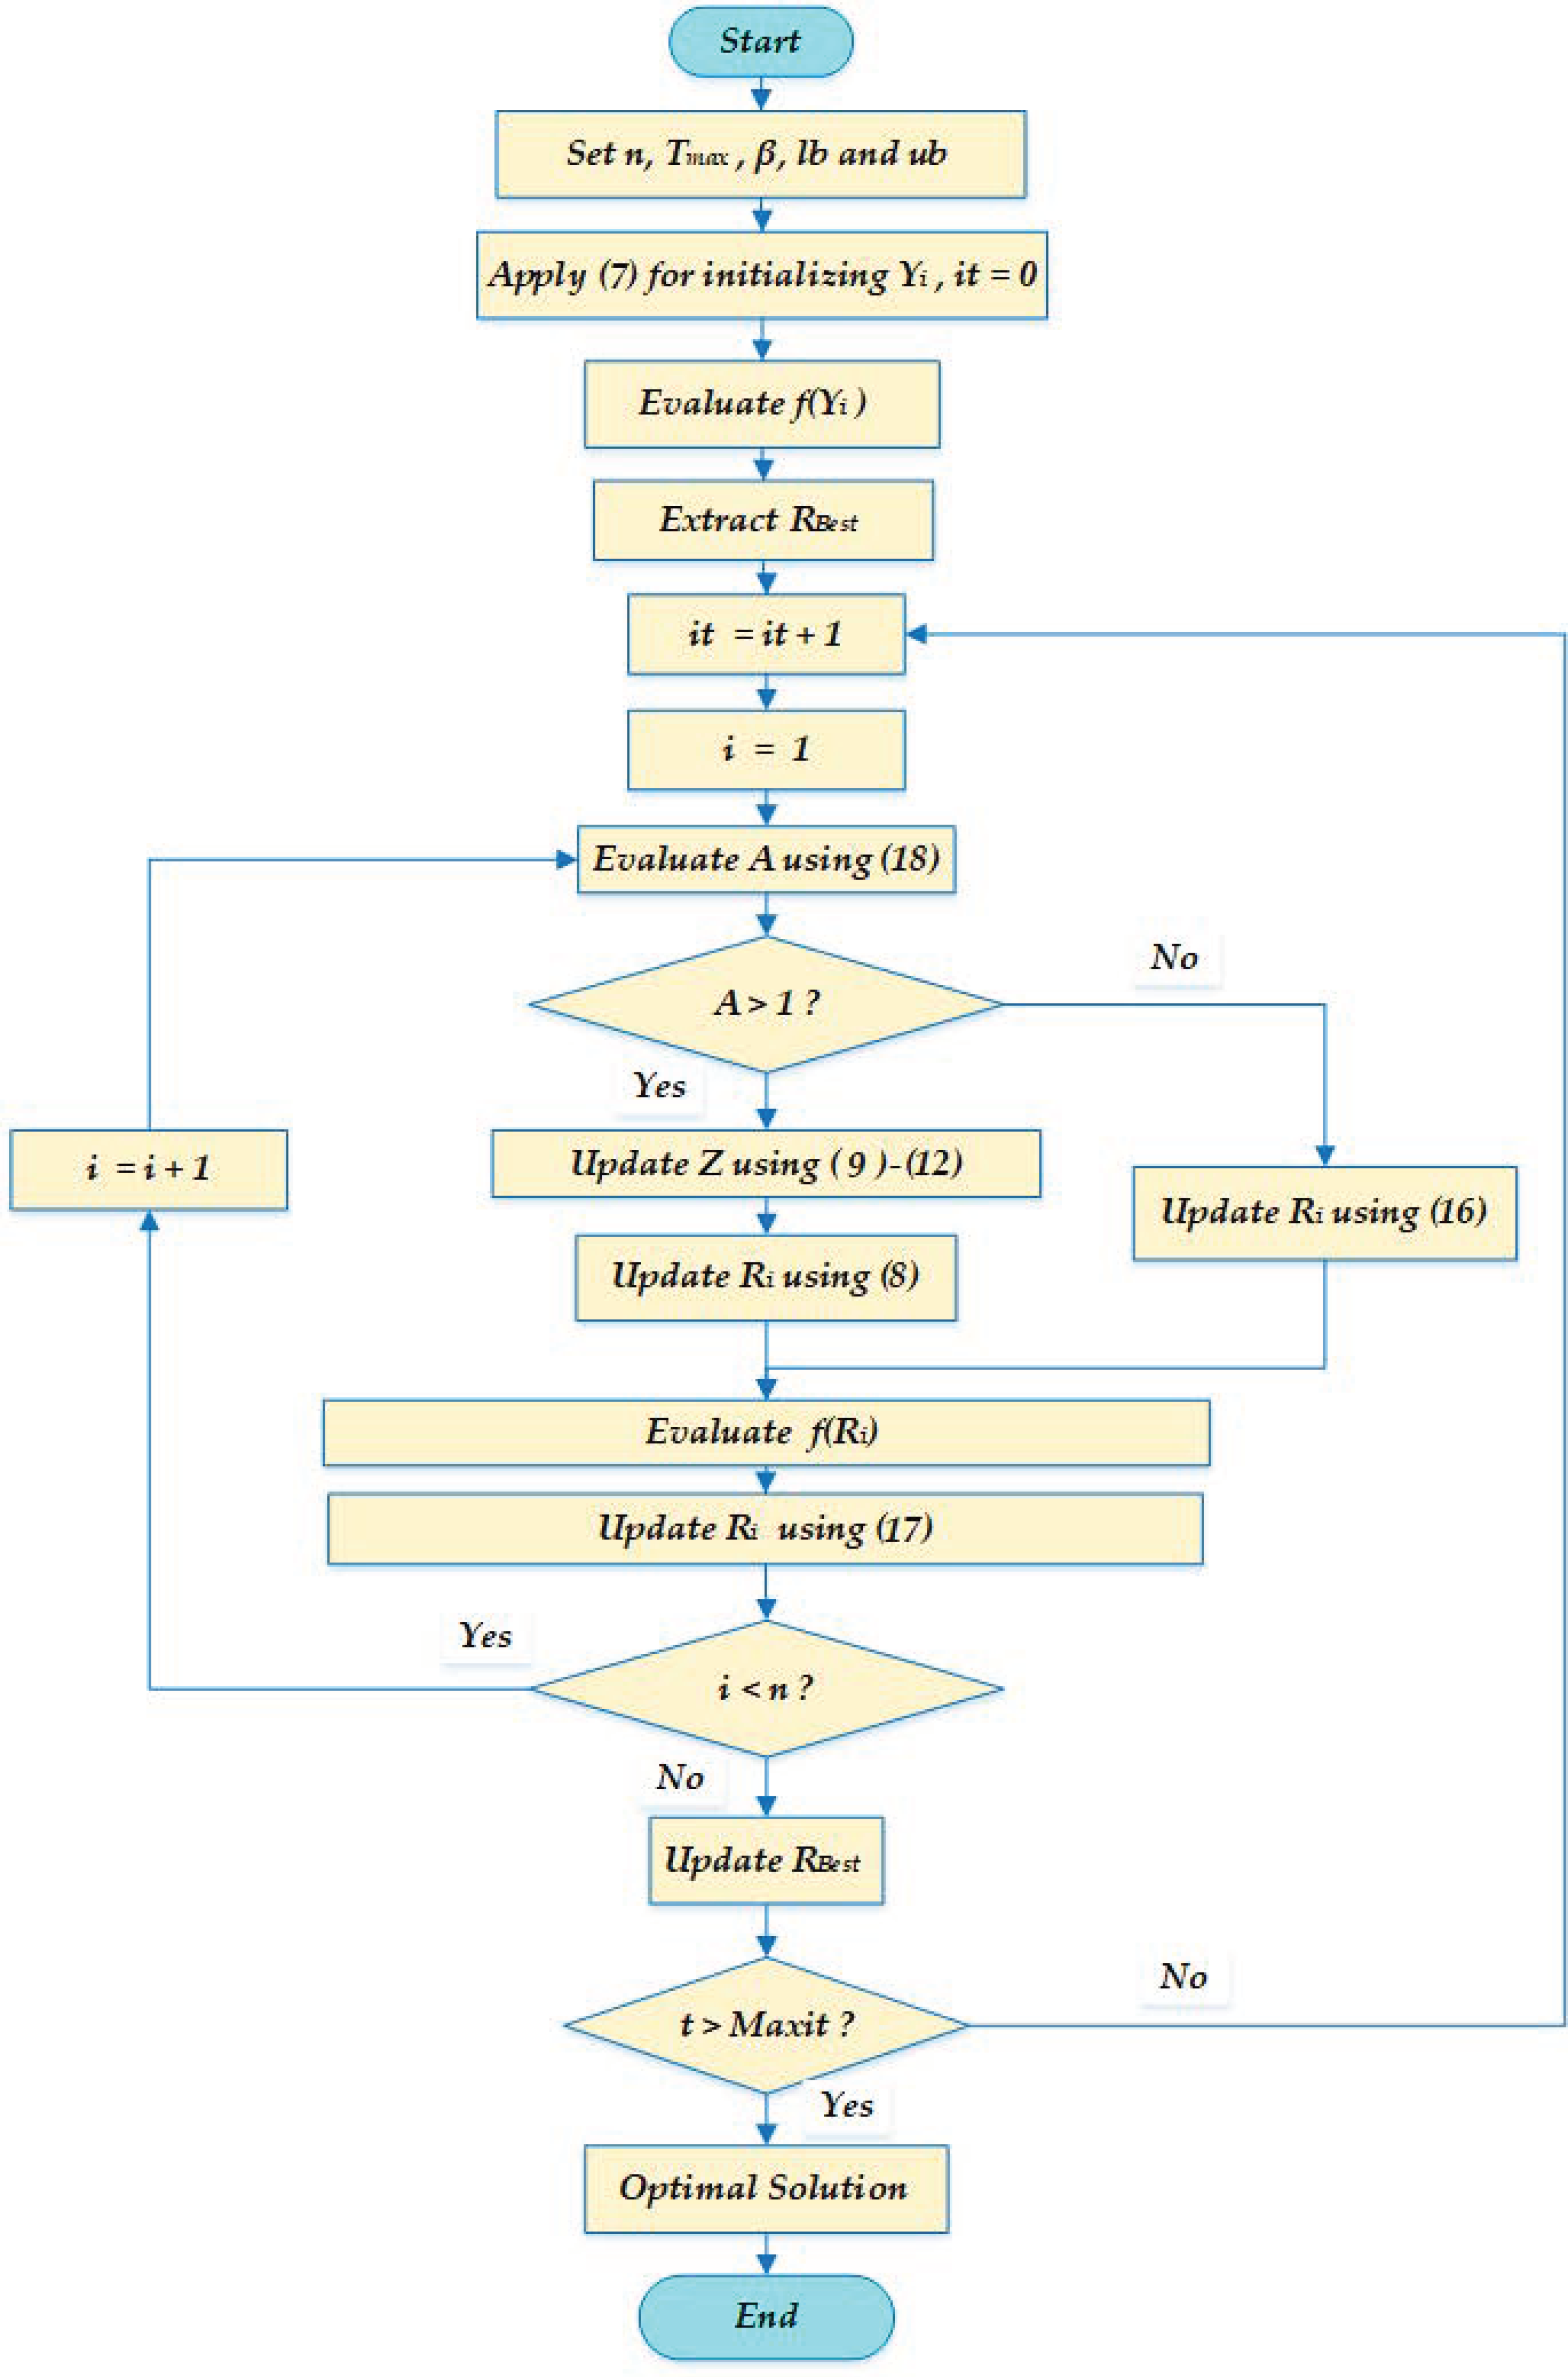
3. Mathematical Model of the Proposed Artificial Rabbits Algorithm (ARA)
3.1. Detour Foraging
3.2. Randomized Hiding
3.3. Energy Shrink (Switch from Exploration to Exploitation)
4. Simulation Results and Discussions
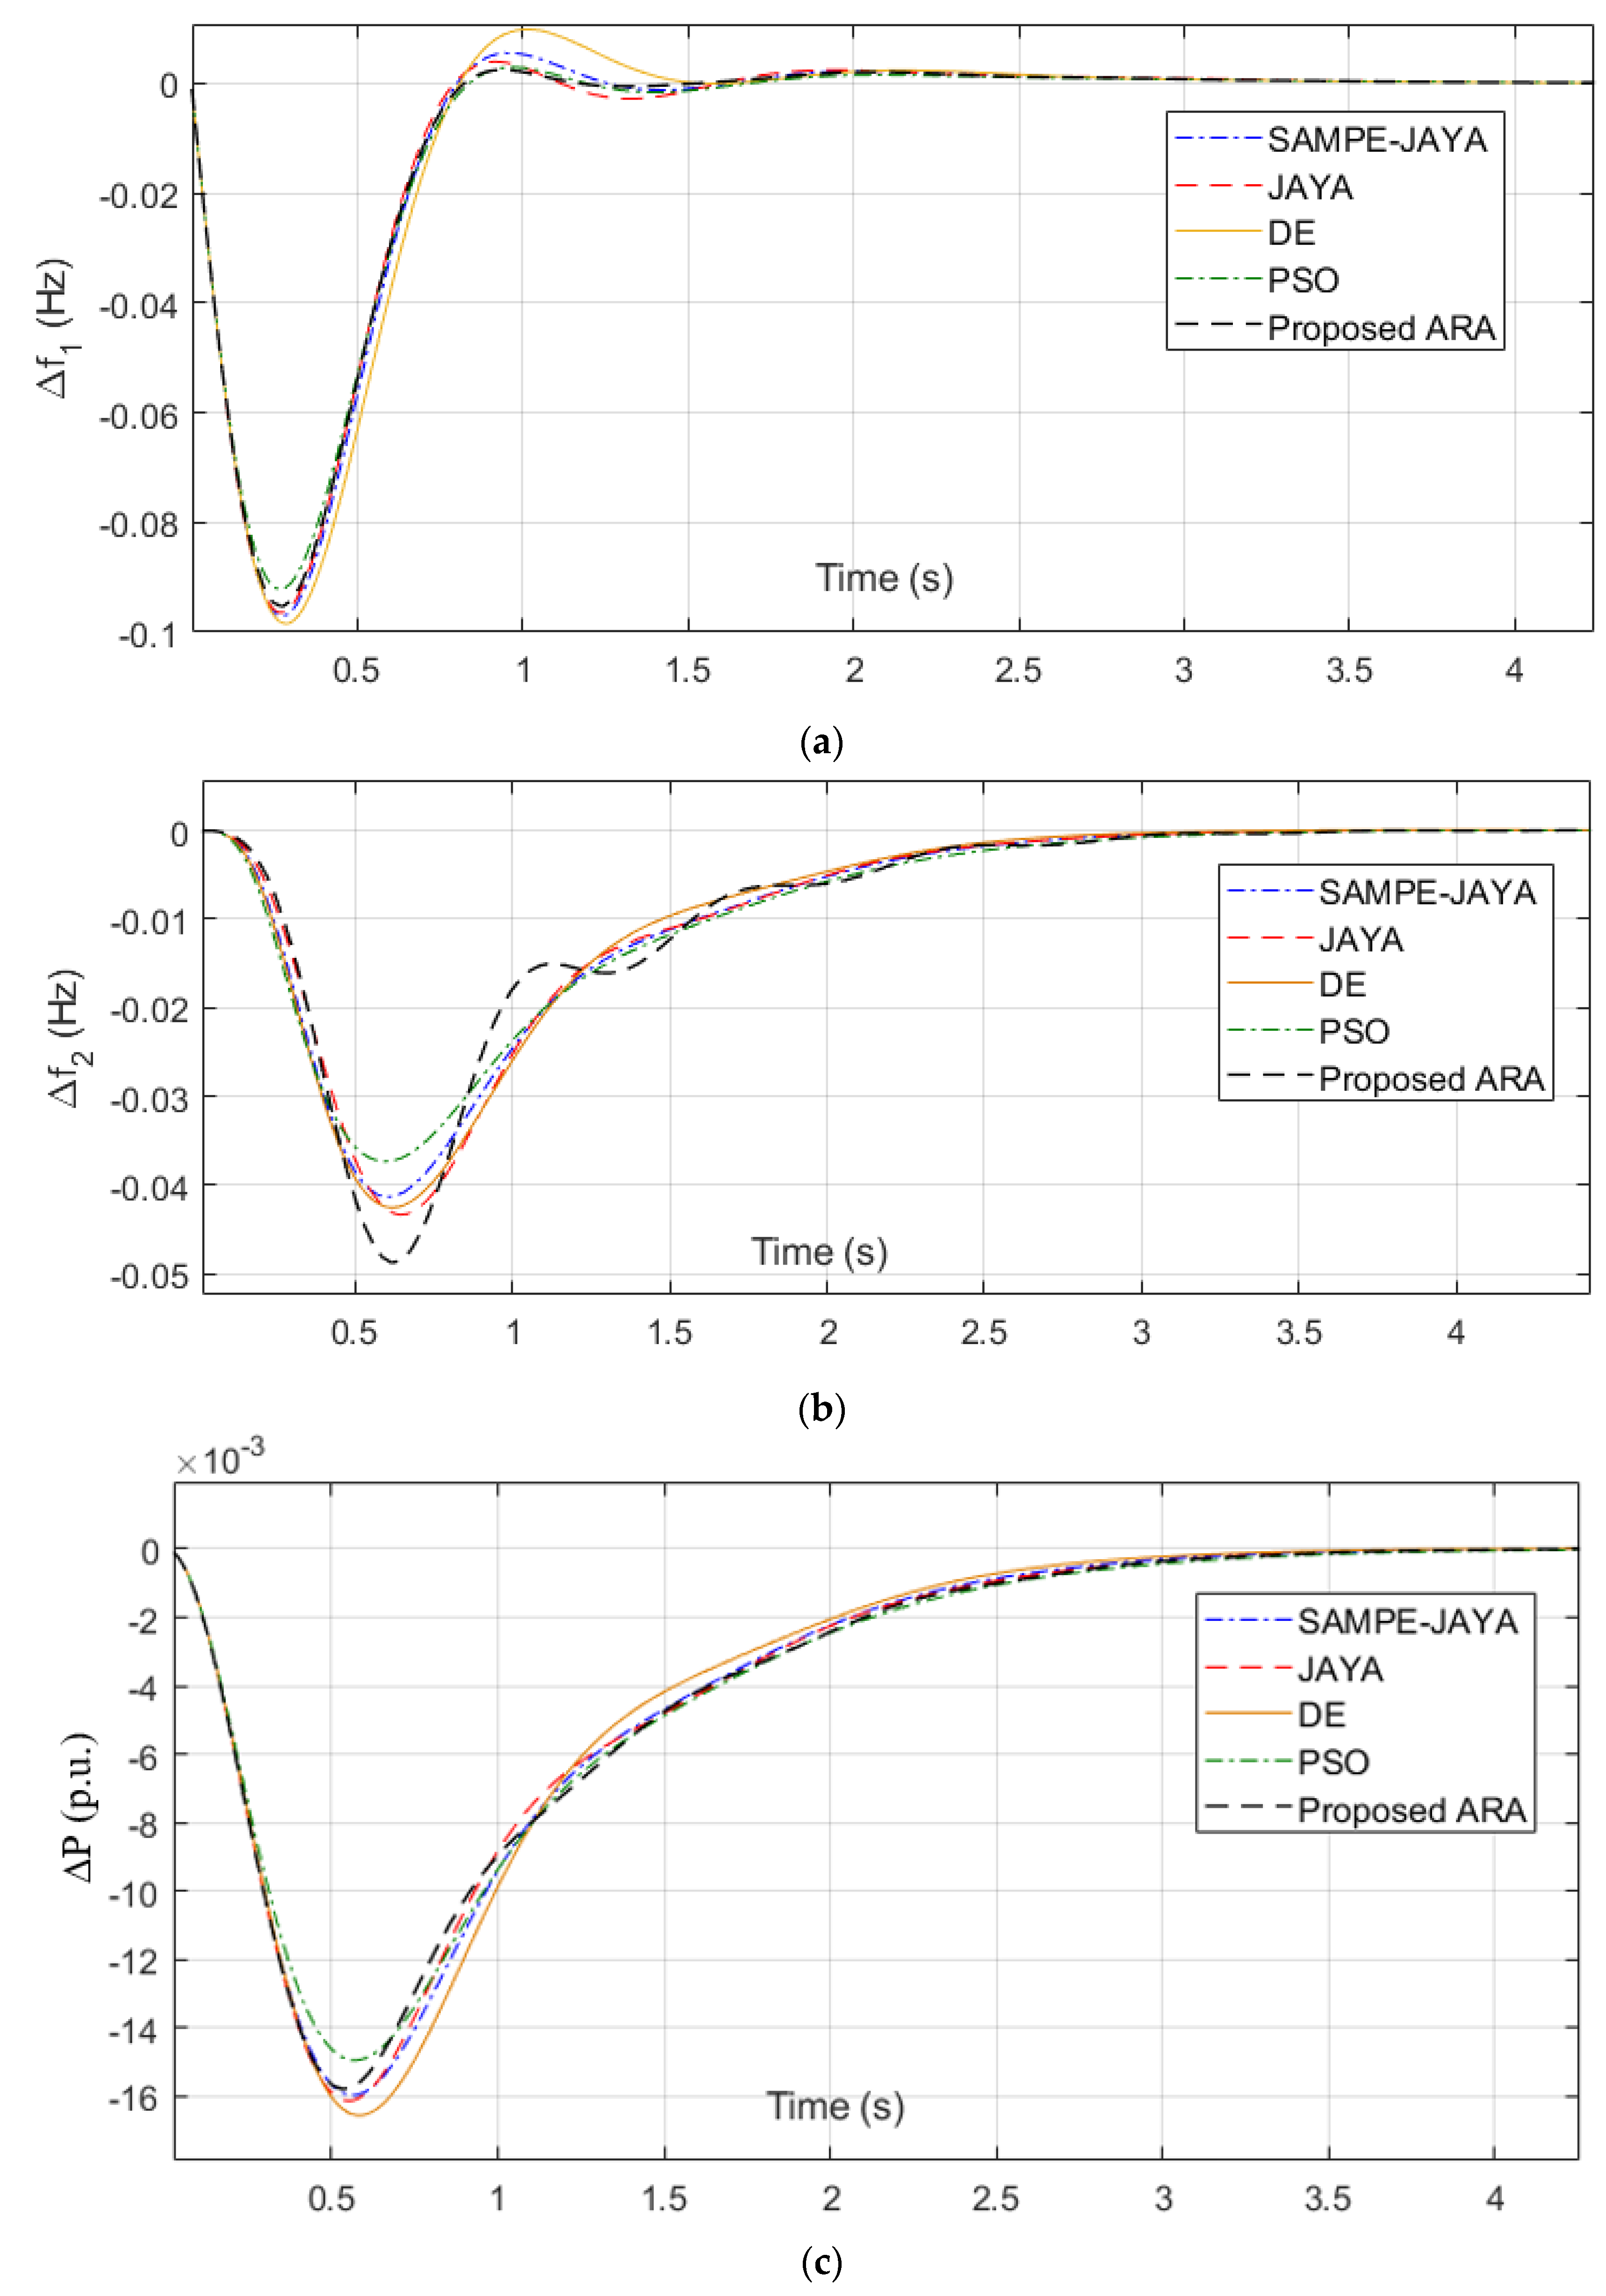
- Case study 1: Step load perturbation in area 1 only.
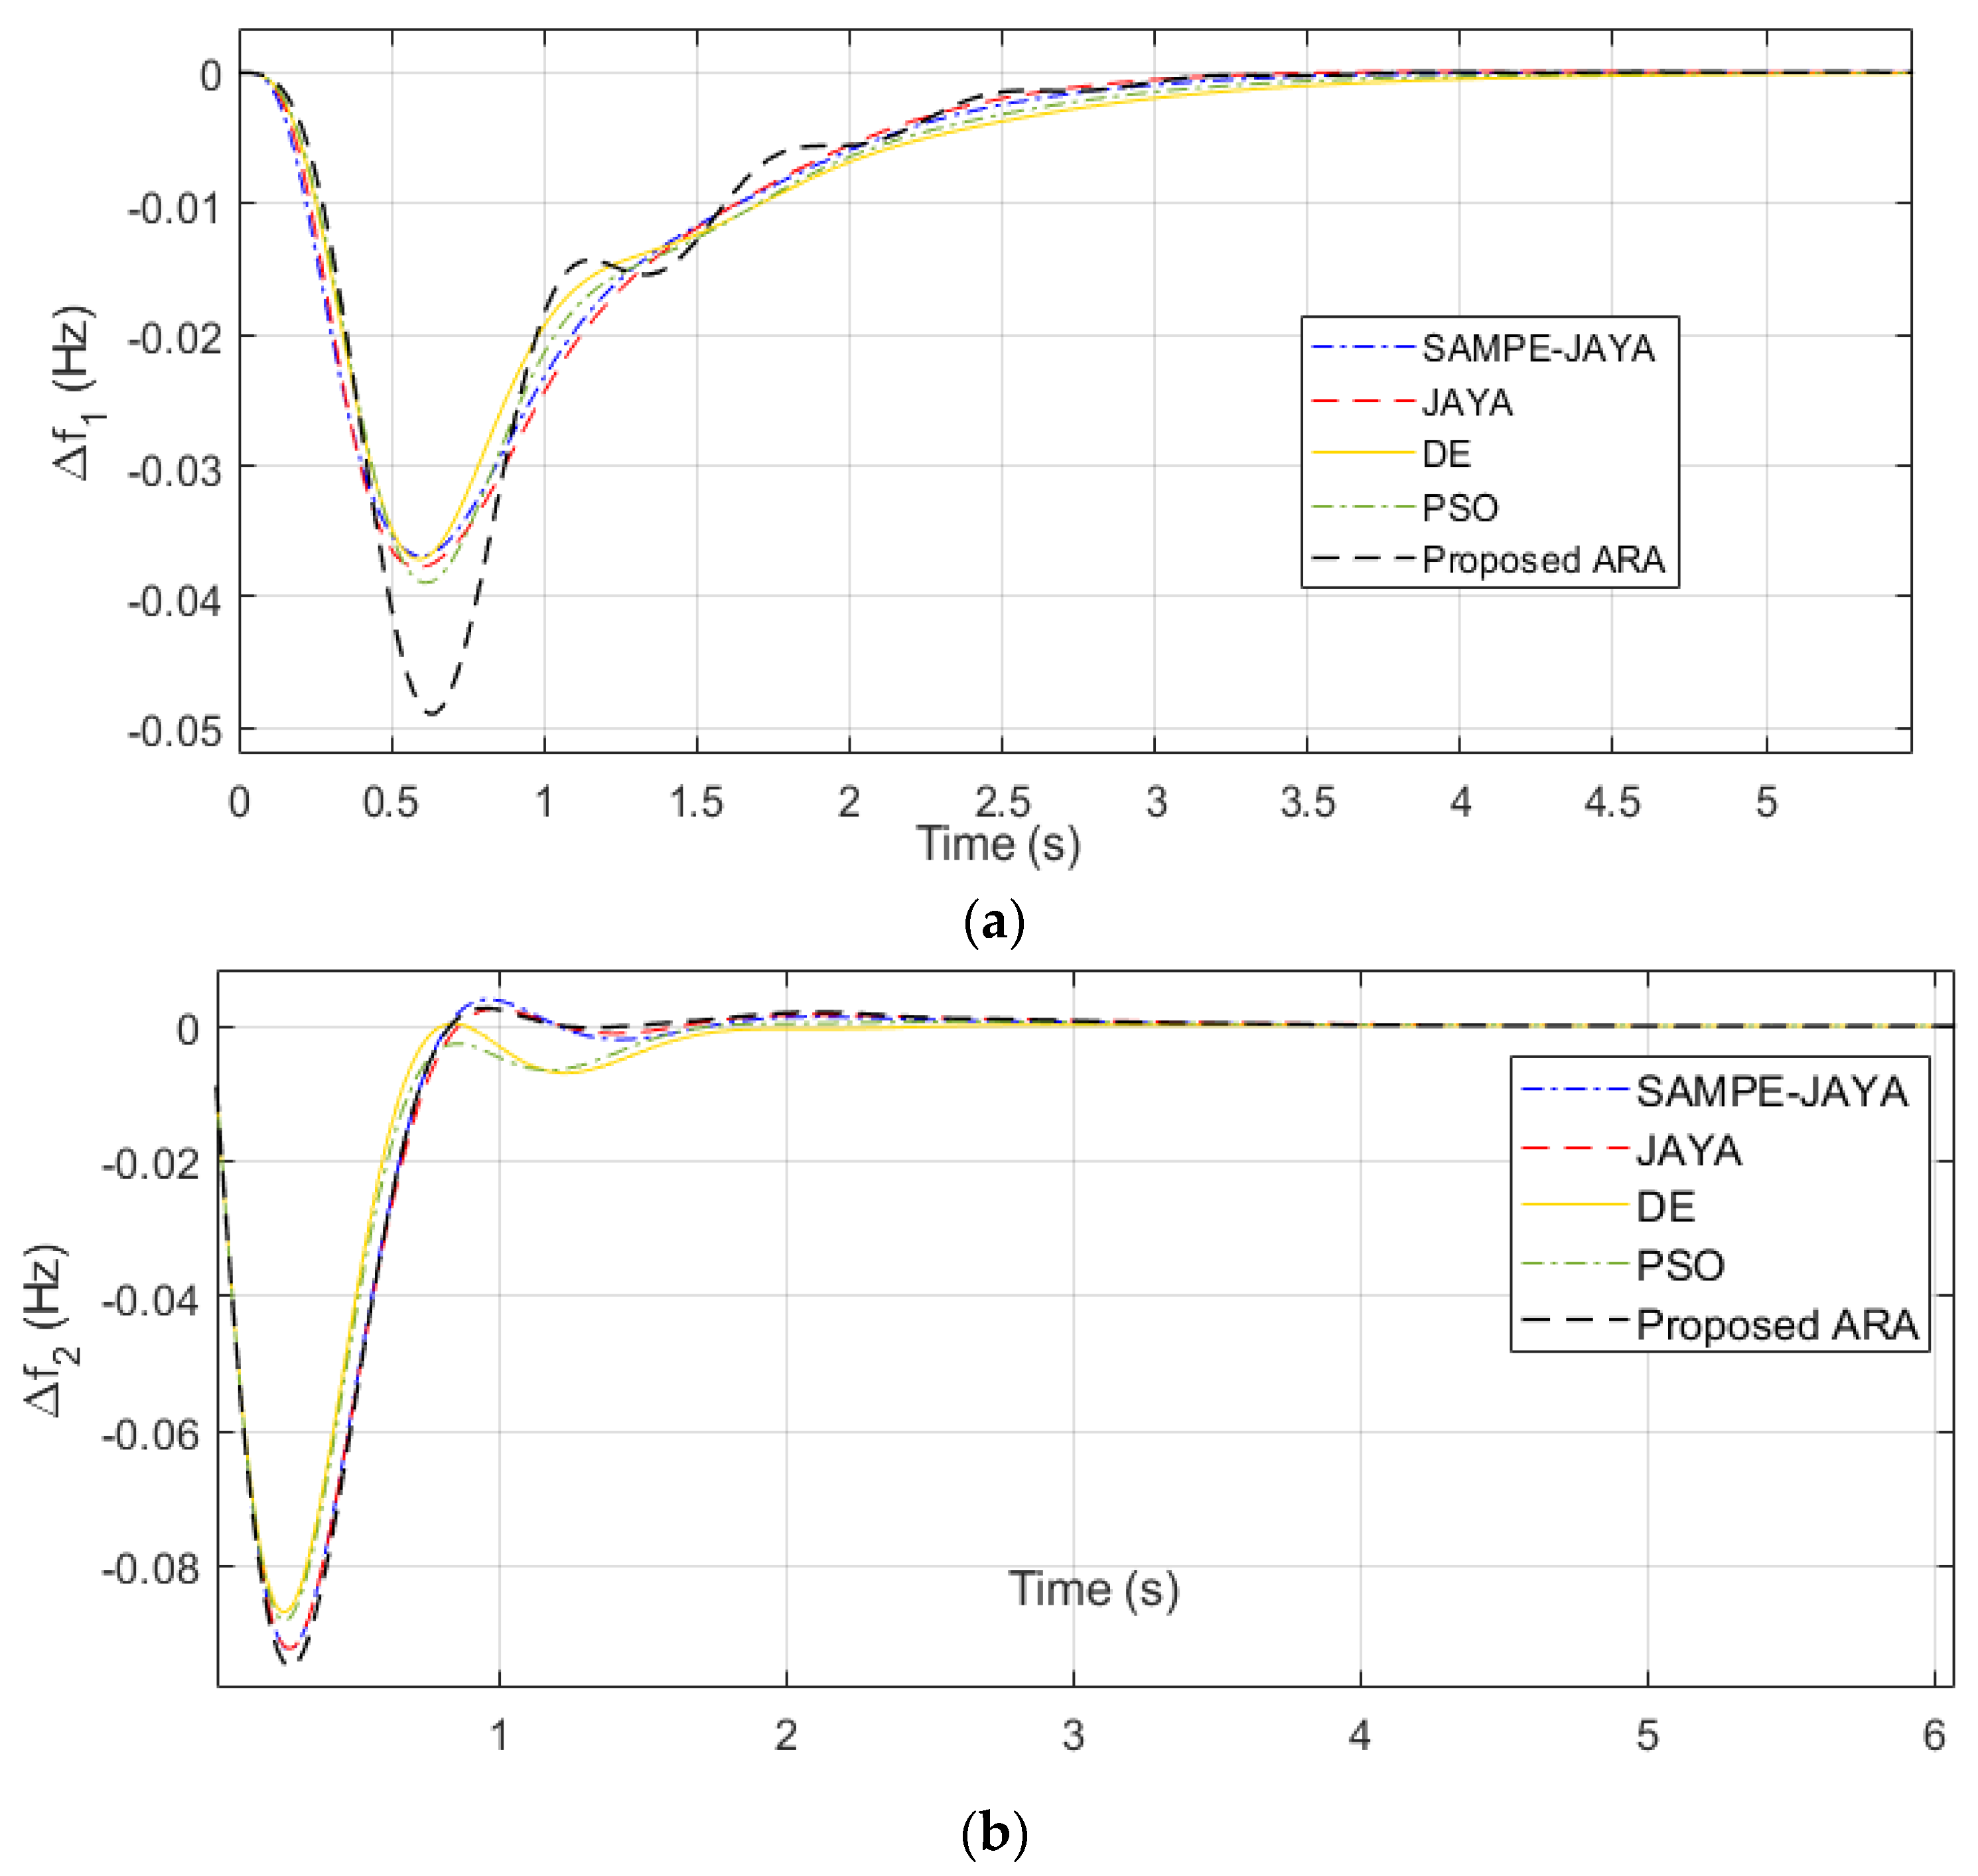
- Case study 2: Step load perturbation in area 2 only.
- Case study 3: Step load perturbation in area 1 and area 2.
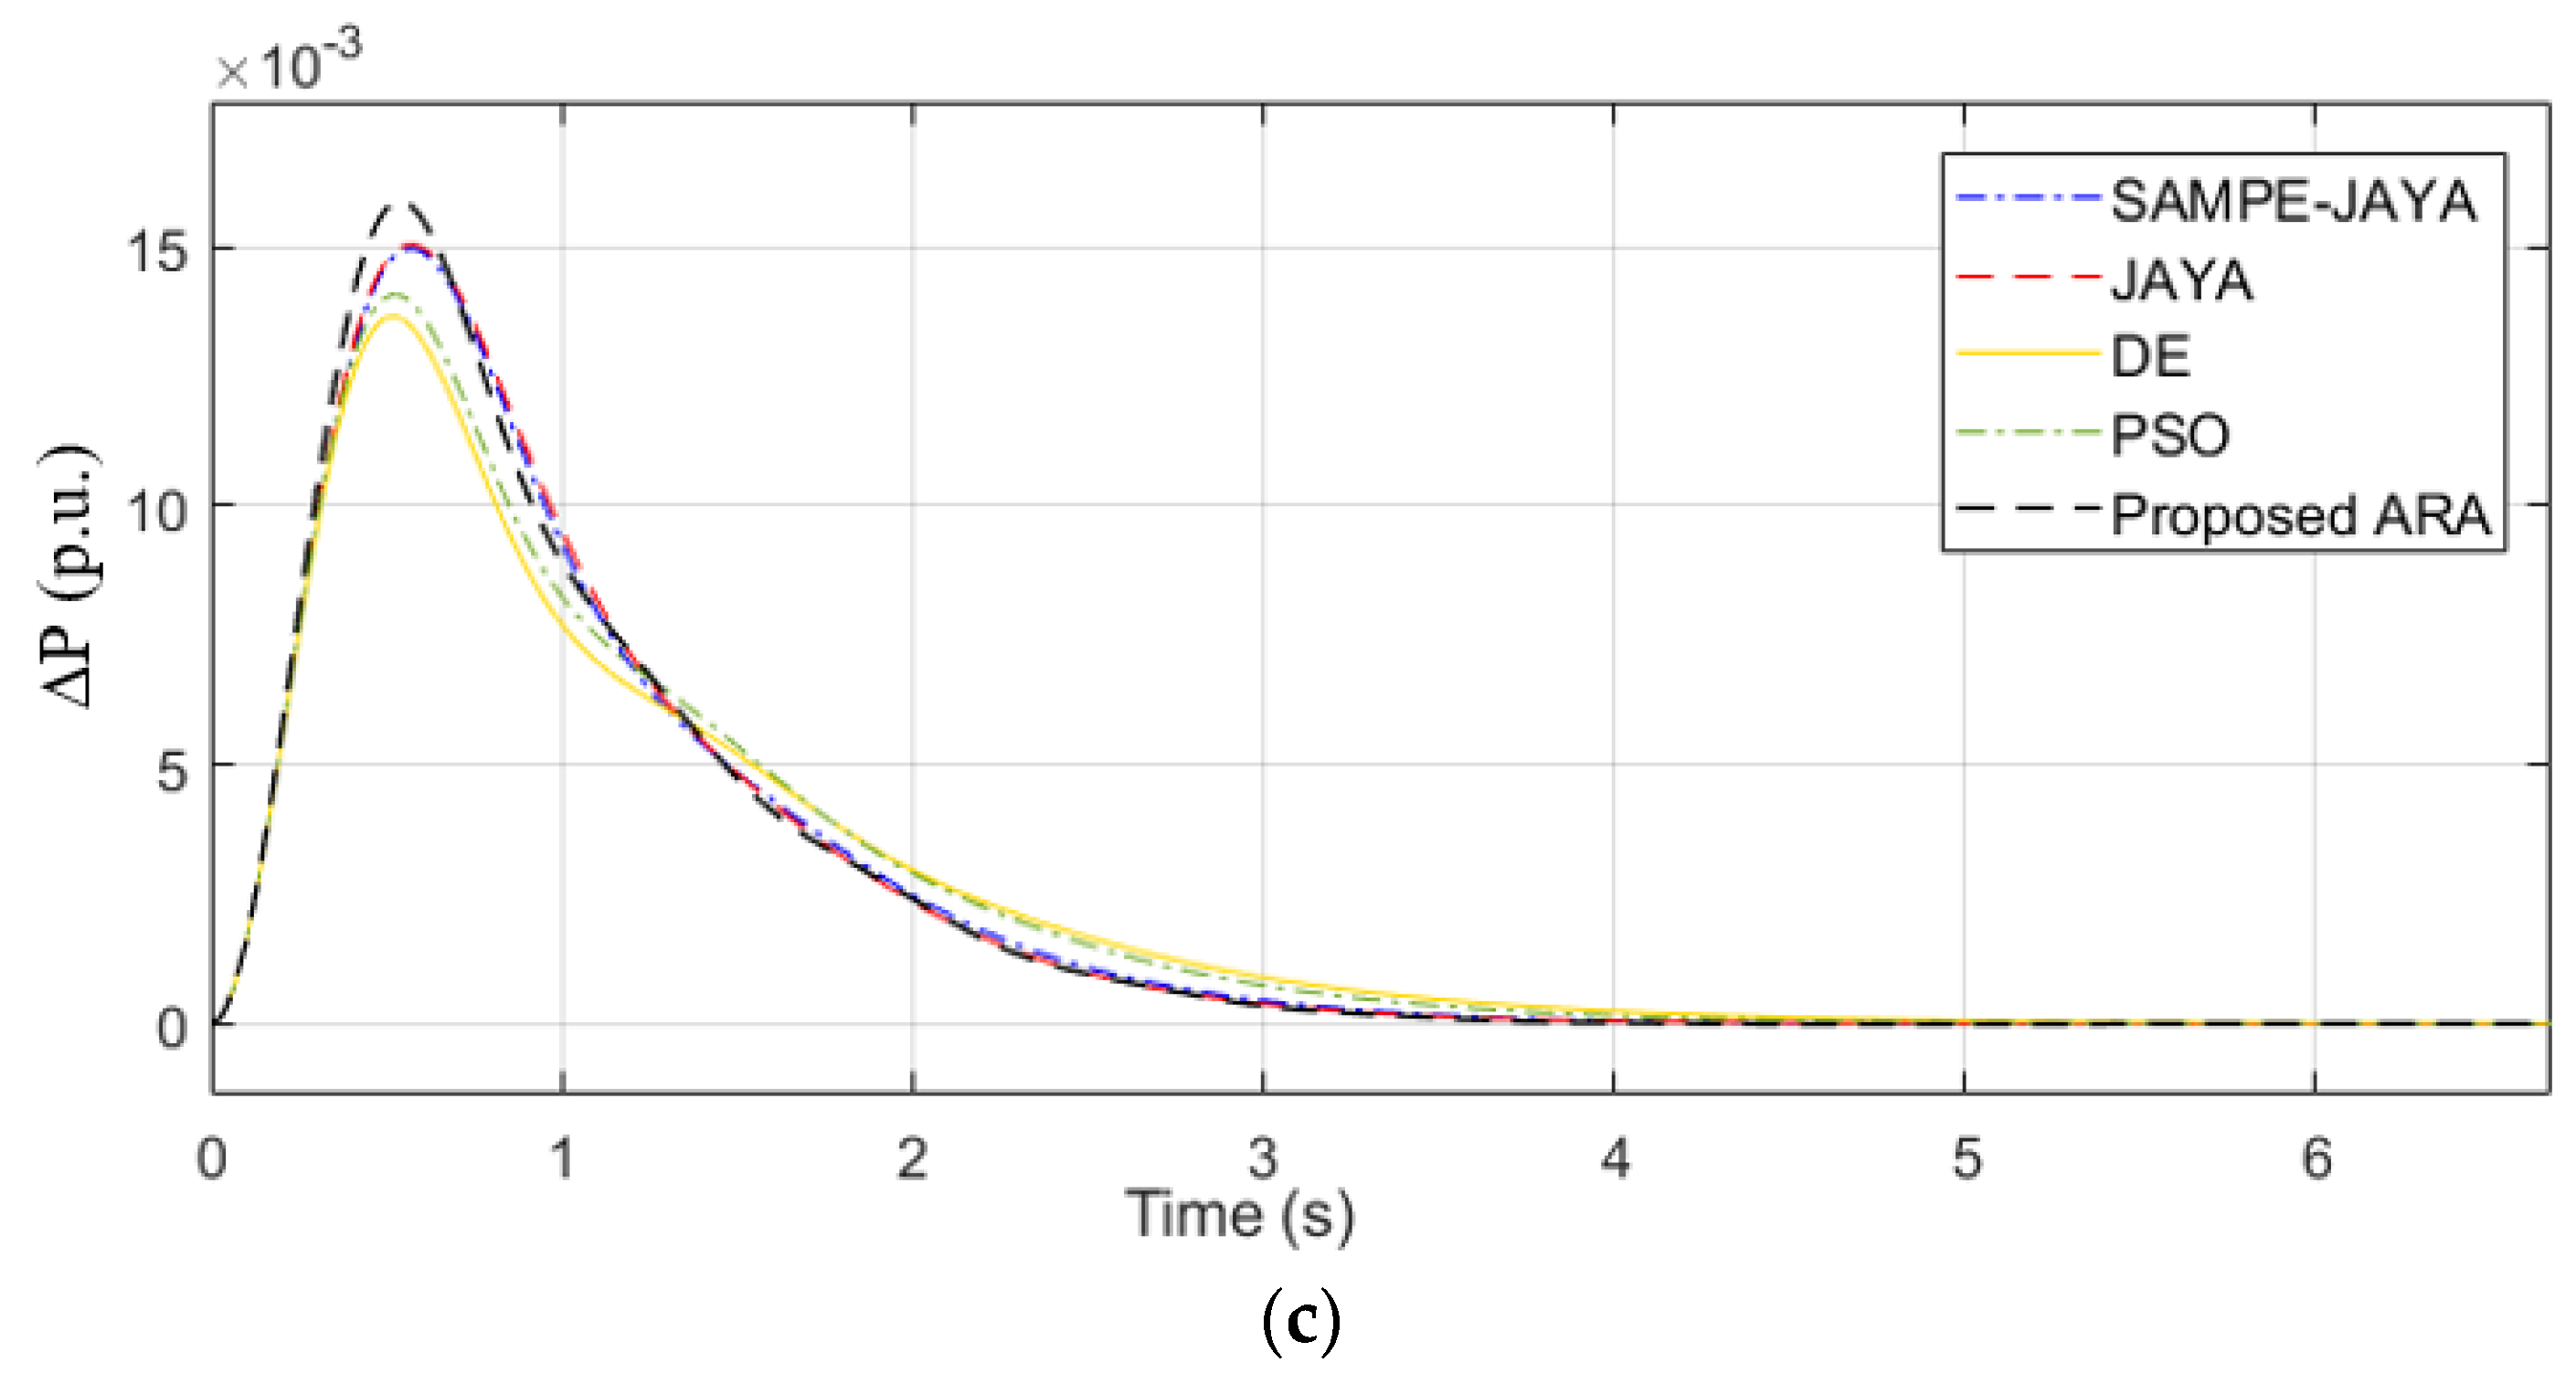
4.1. Simulation of Case Study 1
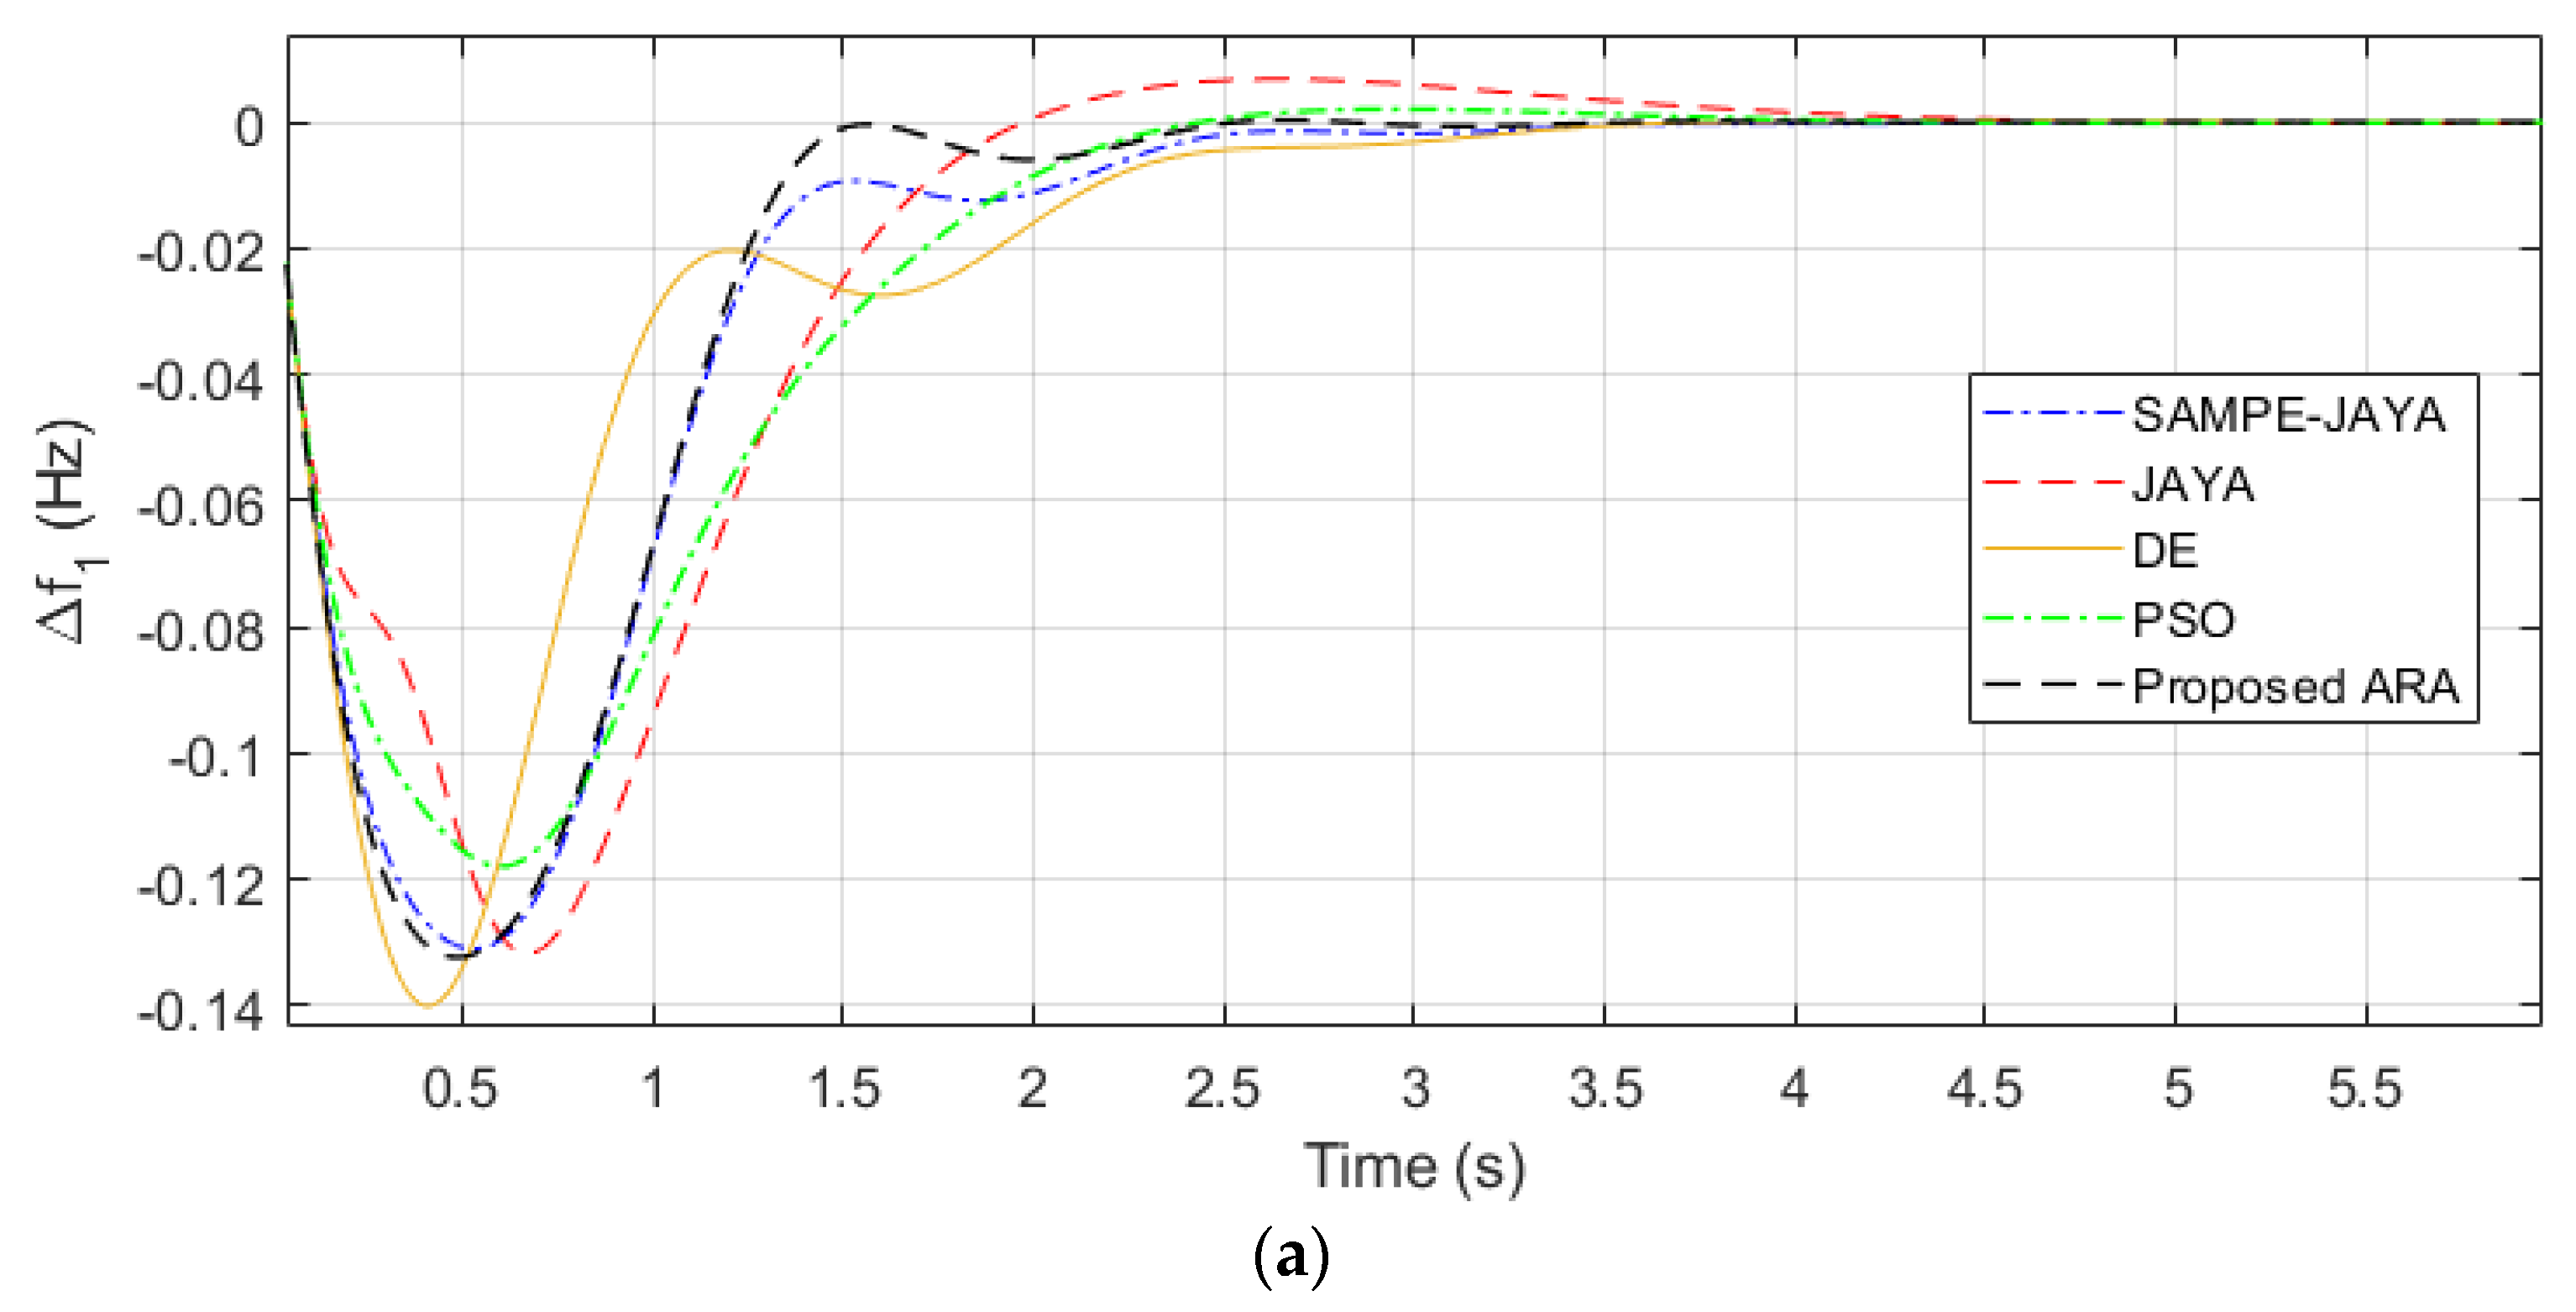
4.2. Simulation of Case Study 2
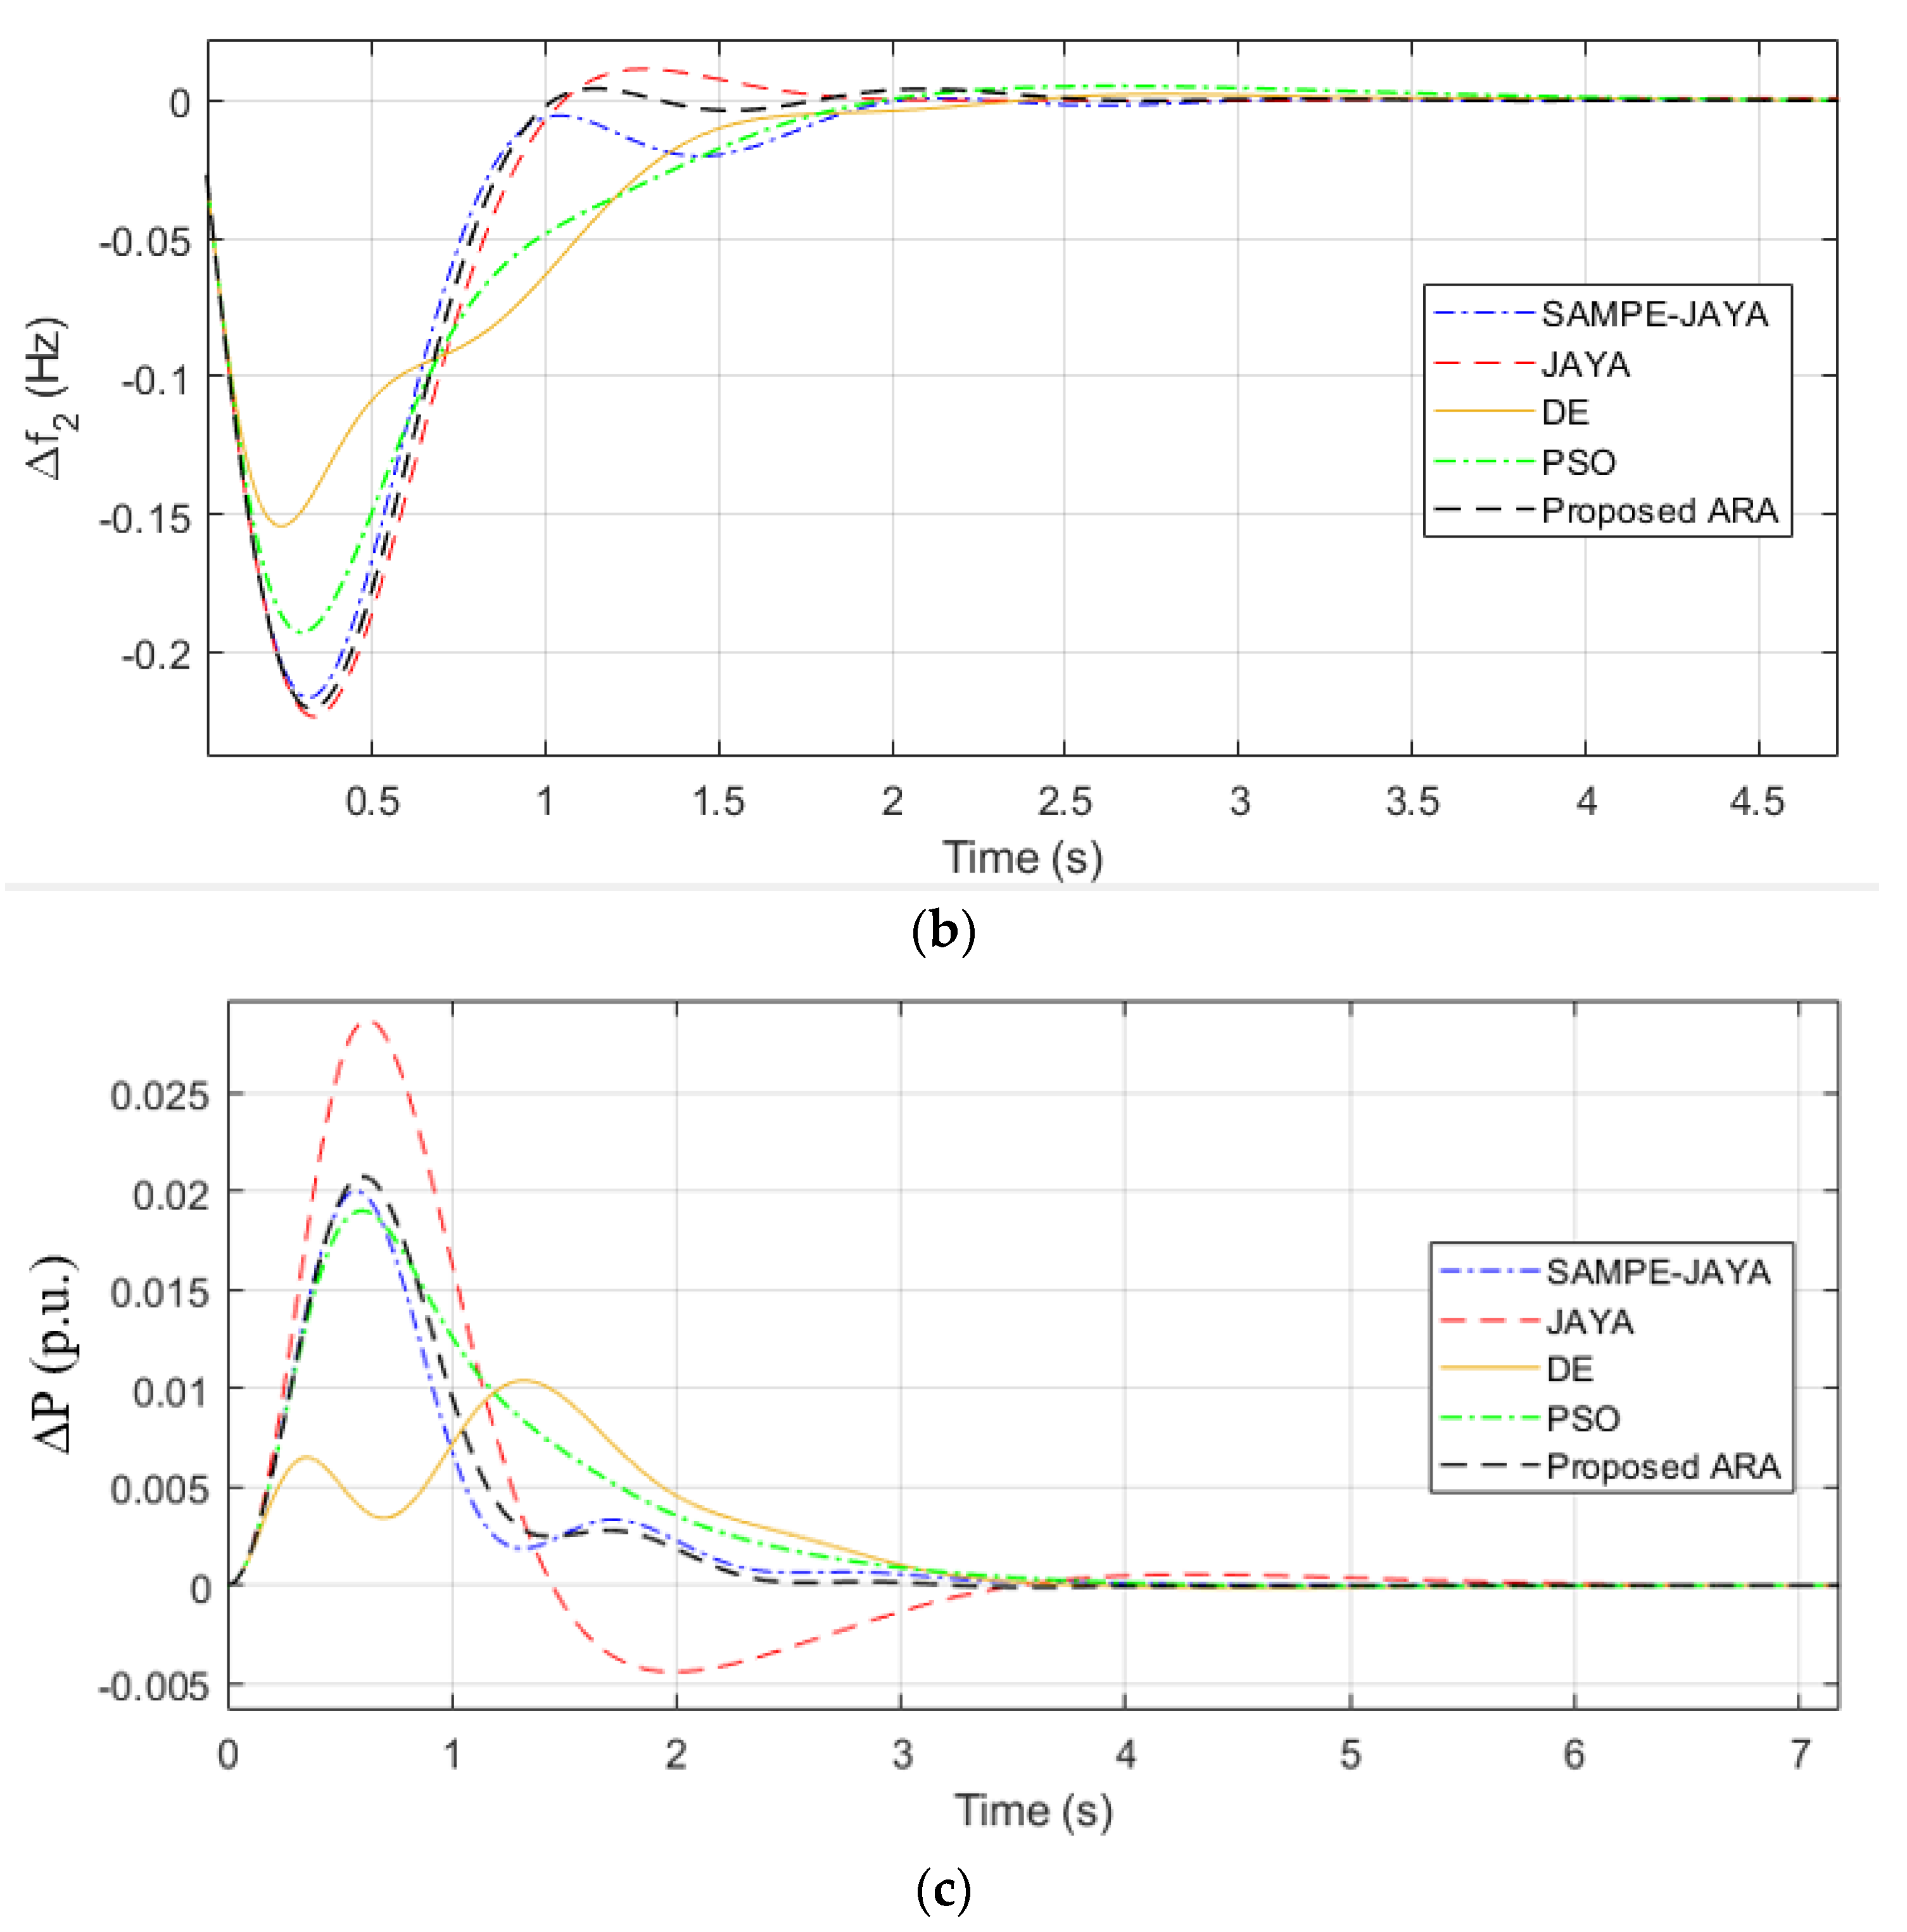
4.3. Simulation of Case Study 3
5. Conclusions
Author Contributions
Funding
Data Availability Statement
Conflicts of Interest
Nomenclature
| ACE | Area control error |
| R | Governor speed droop characteristics |
| B | Frequency bias factor |
| u | Governor control inputs |
| Tg | Governor time constants (seconds) |
| ∆Pg | Changes in valve position of the governor (per unit (p.u.)) |
| Tt | Turbine time constants (seconds) |
| ∆Pt | Power changes in turbine output (p.u.) |
| kp | Gain |
| Tp | Power system time constants (seconds) |
| ∆PD | Power demand changes |
| ∆PTIE | Tie-line power change (p.u.), |
| T12 | Synchronization coefficient between areas 1 and 2 |
| ∆f | Power system frequency change (Hz), |
| PRg | MW capacity of area g (g = 1, 2) |
| a12 | Constant |
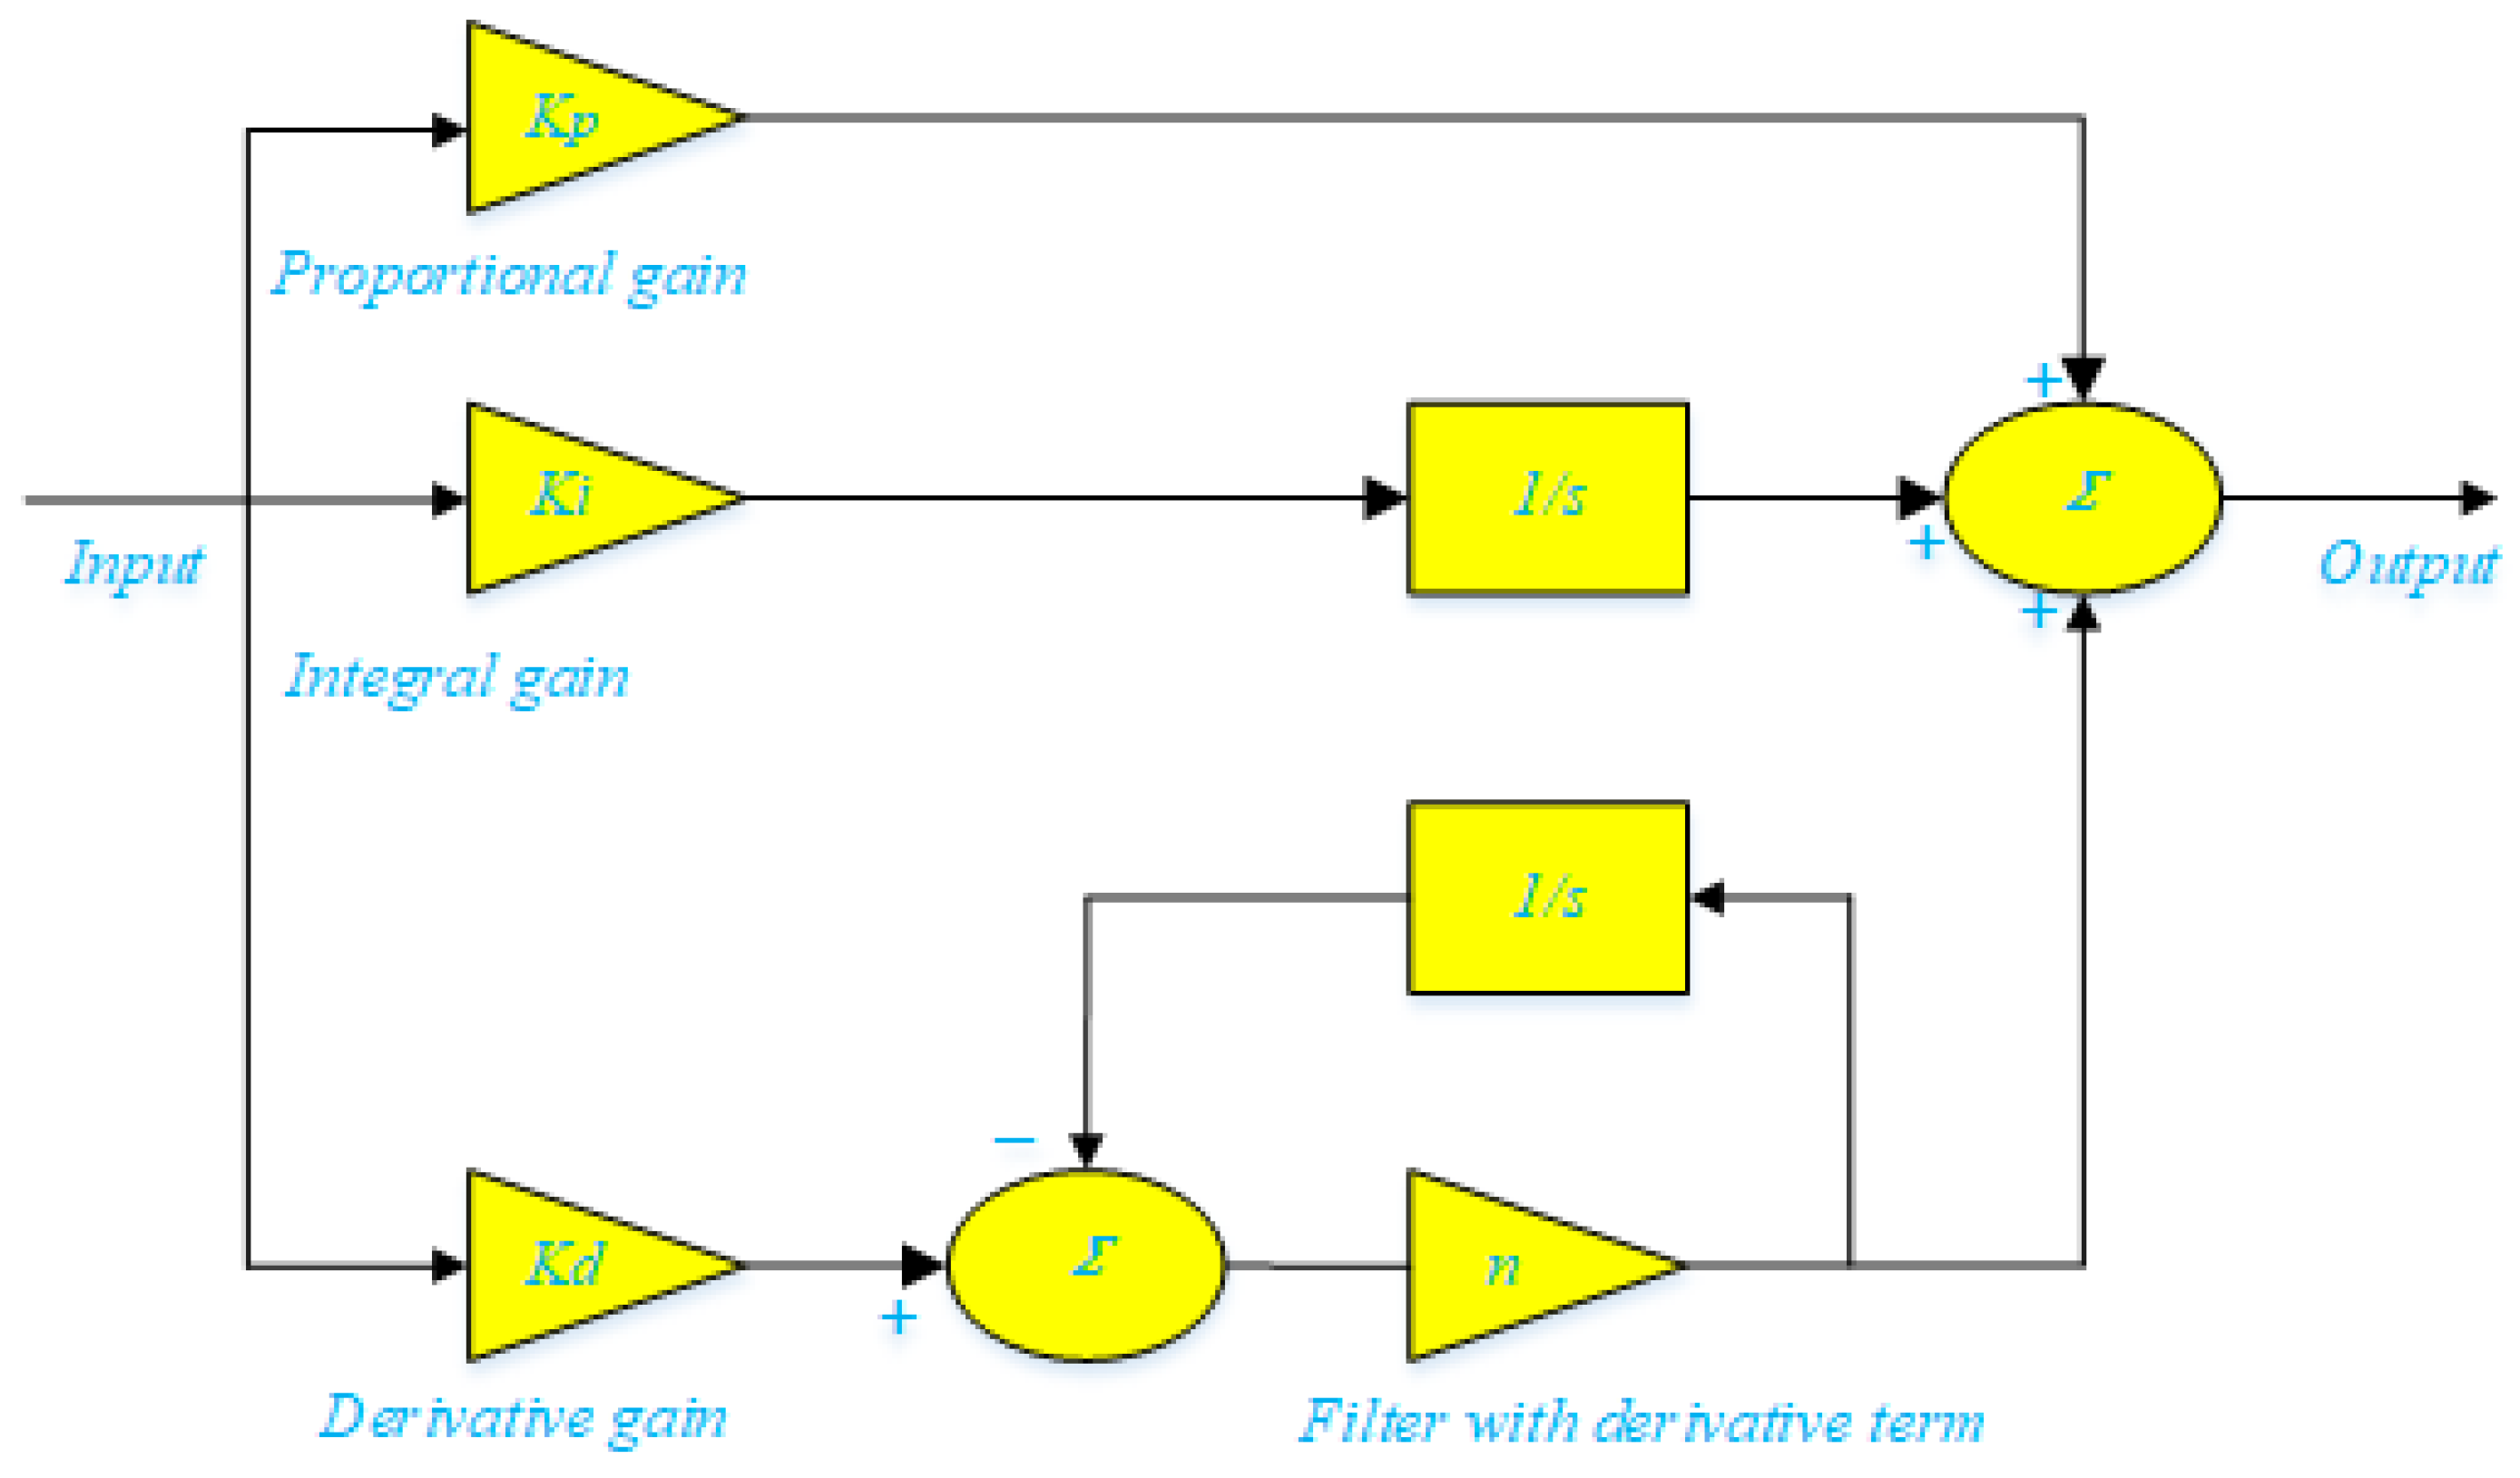
| Kp, Ki and Kd | Gains of PID controller of proportional, integral and derivative, respectively |
| ITAE | Integral time-multiplied absolute value of the error |
| tsim | Simulation time |
| J | Objective function to be considered |
Appendix A
Appendix B
References
- Hassan, A.; Aly, M.; Elmelegi, A.; Nasrat, L.; Watanabe, M.; Mohamed, E.A. Optimal Frequency Control of Multi-Area Hybrid Power System Using New Cascaded TID-PIλDμN Controller Incorporating Electric Vehicles. Fractal Fract. 2022, 6, 548. [Google Scholar] [CrossRef]
- Elkasem, A.H.A.; Khamies, M.; Hassan, M.H.; Agwa, A.M.; Kamel, S. Optimal Design of TD-TI Controller for LFC Considering Renewables Penetration by an Improved Chaos Game Optimizer. Fractal Fract. 2022, 6, 220. [Google Scholar] [CrossRef]
- Sarhan, S.; Shaheen, A.; El-Sehiemy, R.; Gafar, M. A Multi-Objective Teaching–Learning Studying-Based Algorithm for Large-Scale Dispatching of Combined Electrical Power and Heat Energies. Mathematics 2022, 10, 2278. [Google Scholar] [CrossRef]
- Hasan, N.; Nasirudin, I.; Farooq, S. Hybrid Taguchi Genetic Algorithm-Based AGC Controller for Multisource Interconnected Power System. Electr. Power Components Syst. 2019, 47, 101–112. [Google Scholar] [CrossRef]
- Jagatheesan, K.; Anand, B.; Samanta, S.; Dey, N.; Santhi, V.; Ashour, A.S.; Balas, V.E. Application of flower pollination algorithm in load frequency control of multi-area interconnected power system with nonlinearity. Neural Comput. Appl. 2016, 28, 475–488. [Google Scholar] [CrossRef]
- Bhatt, P.; Roy, R.; Ghoshal, S. GA/particle swarm intelligence based optimization of two specific varieties of controller devices applied to two-area multi-units automatic generation control. Int. J. Electr. Power Energy Syst. 2010, 32, 299–310. [Google Scholar] [CrossRef]
- Rout, U.K.; Sahu, R.K.; Panda, S. Design and analysis of differential evolution algorithm based automatic generation control for interconnected power system. Ain Shams Eng. J. 2013, 4, 409–421. [Google Scholar] [CrossRef] [Green Version]
- Panda, S.; Mohanty, B.; Hota, P. Hybrid BFOA–PSO algorithm for automatic generation control of linear and nonlinear interconnected power systems. Appl. Soft Comput. 2013, 13, 4718–4730. [Google Scholar] [CrossRef]
- El Ela, A.A.A.; El-Sehiemy, R.A.; Shaheen, A.M.; Diab, A.E.G. Optimal Design of PID Controller Based Sampe-Jaya Algorithm for Load Frequency Control of Linear and Nonlinear Multi-Area Thermal Power Systems. Int. J. Eng. Res. Afr. 2020, 50, 79–93. [Google Scholar] [CrossRef]
- Ali, E.; Abd-Elazim, S. BFOA based design of PID controller for two area Load Frequency Control with nonlinearities. Int. J. Electr. Power Energy Syst. 2013, 51, 224–231. [Google Scholar] [CrossRef]
- Saikia, L.C.; Nanda, J.; Mishra, S. Performance comparison of several classical controllers in AGC for multi-area interconnected thermal system. Int. J. Electr. Power Energy Syst. 2011, 33, 394–401. [Google Scholar] [CrossRef]
- Padhan, S.; Sahu, R.K.; Panda, S. Application of Firefly Algorithm for Load Frequency Control of Multi-area Interconnected Power System. Electr. Power Components Syst. 2014, 42, 1419–1430. [Google Scholar] [CrossRef]
- Saikia, L.C.; Sahu, S.K. Automatic generation control of a combined cycle gas turbine plant with classical controllers using Firefly Algorithm. Int. J. Electr. Power Energy Syst. 2013, 53, 27–33. [Google Scholar] [CrossRef]
- Naidu, K.; Mokhlis, H.; Bakar, A. Multiobjective optimization using weighted sum Artificial Bee Colony algorithm for Load Frequency Control. Int. J. Electr. Power Energy Syst. 2014, 55, 657–667. [Google Scholar] [CrossRef]
- Singh, S.P.; Prakash, T.; Singh, V.; Babu, M.G. Analytic hierarchy process based automatic generation control of multi-area interconnected power system using Jaya algorithm. Eng. Appl. Artif. Intell. 2017, 60, 35–44. [Google Scholar] [CrossRef]
- Pati, T.K.; Nayak, J.R.; Sahu, B.K. Application of TLBO algorithm to study the performance of automatic generation control of a two-area multi-units interconnected power system. IEEE Xplore 2015, 1–5. [Google Scholar] [CrossRef]
- Sharma, Y.; Saikia, L.C. Automatic generation control of a multi-area ST—Thermal power system using Grey Wolf Optimizer algorithm based classical controllers. Int. J. Electr. Power Energy Syst. 2015, 73, 853–862. [Google Scholar] [CrossRef]
- Abdelaziz, A.; Ali, E. Cuckoo Search algorithm based load frequency controller design for nonlinear interconnected power system. Int. J. Electr. Power Energy Syst. 2015, 73, 632–643. [Google Scholar] [CrossRef]
- Dash, P.; Saikia, L.C.; Sinha, N. Comparison of performances of several Cuckoo search algorithm based 2DOF controllers in AGC of multi-area thermal system. Int. J. Electr. Power Energy Syst. 2014, 55, 429–436. [Google Scholar] [CrossRef]
- Yang, H.; Jiang, Y.; Yin, S. Adaptive Fuzzy Fault-Tolerant Control for Markov Jump Systems With Additive and Multiplicative Actuator Faults. IEEE Trans. Fuzzy Syst. 2020, 29, 772–785. [Google Scholar] [CrossRef]
- Yang, H.; Yin, S.; Kaynak, O. Neural Network-Based Adaptive Fault-Tolerant Control for Markovian Jump Systems with Nonlinearity and Actuator Faults. IEEE Trans. Syst. Man Cybern. Syst. 2020, 51, 3687–3698. [Google Scholar] [CrossRef]
- Ginidi, A.; Elattar, E.; Shaheen, A.; Elsayed, A.; El-Sehiemy, R.; Dorrah, H. Optimal Power Flow Incorporating Thyristor-Controlled Series Capacitors Using the Gorilla Troops Algorithm. Int. Trans. Electr. Energy Syst. 2022, 2022, 1–23. [Google Scholar] [CrossRef]
- El-Ela, A.A.A.; El-Sehiemy, R.A.; Shaheen, A.M.; Diab, A.E.-G. Enhanced coyote optimizer-based cascaded load frequency controllers in multi-area power systems with renewable. Neural Comput. Appl. 2021, 33, 8459–8477. [Google Scholar] [CrossRef]
- Kalyan, C.N.S.; Goud, B.S.; Reddy, C.R.; Ramadan, H.S.; Bajaj, M.; Ali, Z.M. Water Cycle Algorithm Optimized Type II Fuzzy Controller for Load Frequency Control of a Multi-Area, Multi-Fuel System with Communication Time Delays. Energies 2021, 14, 5387. [Google Scholar] [CrossRef]
- Elkasem, A.H.A.; Khamies, M.; Magdy, G.; Taha, I.B.M.; Kamel, S. Frequency Stability of AC/DC Interconnected Power Systems with Wind Energy Using Arithmetic Optimization Algorithm-Based Fuzzy-PID Controller. Sustainability 2021, 13, 12095. [Google Scholar] [CrossRef]
- Gupta, D.; Soni, A.; Jha, A.; Mishra, S.; Appasani, B.; Srinivasulu, A.; Bizon, N.; Thounthong, P. Hybrid Gravitational–Firefly Algorithm-Based Load Frequency Control for Hydrothermal Two-Area System. Mathematics 2021, 9, 712. [Google Scholar] [CrossRef]
- Shouran, M.; Anayi, F.; Packianather, M.; Habil, M. Load Frequency Control Based on the Bees Algorithm for the Great Britain Power System. Designs 2021, 5, 50. [Google Scholar] [CrossRef]
- Wang, L.; Cao, Q.; Zhang, Z.; Mirjalili, S.; Zhao, W. Artificial rabbits optimization: A new bio-inspired meta-heuristic algorithm for solving engineering optimization problems. Eng. Appl. Artif. Intell. 2022, 114, 105082. [Google Scholar] [CrossRef]
- Xu, Y.; Li, C.; Wang, Z.; Zhang, N.; Peng, B. Load Frequency Control of a Novel Renewable Energy Integrated Micro-Grid Containing Pumped Hydropower Energy Storage. IEEE Access 2018, 6, 29067–29077. [Google Scholar] [CrossRef]
- Zhao, C.; Jiang, M.; Huang, Y. Formal Verification of Fractional-Order PID Control Systems Using Higher-Order Logic. Fractal Fract. 2022, 6, 485. [Google Scholar] [CrossRef]
- Filho, M.A.I.; Puchta, E.; Martins, M.S.R.; Alves, T.A.; Tadano, Y.D.S.; Corrêa, F.C.; Stevan, S.L.; Siqueira, H.V.; Kaster, M.D.S. Bio-Inspired Optimization Algorithms Applied to the GAPID Control of a Buck Converter. Energies 2022, 15, 6788. [Google Scholar] [CrossRef]
- Duca, O.; Minca, E.; Filipescu, A.; Cernega, D.; Solea, R.; Bidica, C. Event-Based PID Control of a Flexible Manufacturing Process. Inventions 2022, 7, 86. [Google Scholar] [CrossRef]
- El-Ela, A.A.A.; El-Sehiemy, R.A.; Shaheen, A.M.; Diab, A.E.-G. Design of cascaded controller based on coyote optimizer for load frequency control in multi-area power systems with renewable sources. Control. Eng. Pract. 2022, 121, 105058. [Google Scholar] [CrossRef]


| Algorithm | SAMPE-JAYA | JAYA | DE | PSO | Proposed ARA | |
|---|---|---|---|---|---|---|
| Controller parameters | KP1 | 1.8066 | 1.8394 | 1.7101 | 1.9602 | 1.875133 |
| Ki1 | 2.9895 | 3 | 3 | 3 | 2.997462 | |
| Kd1 | 0.5654 | 0.5806 | 0.5284 | 0.6083 | 0.578319 | |
| n1 | 88.111 | 72.985 | 372.86 | 385.58 | 115.132 | |
| KP2 | 2.1364 | 1.4843 | 2.8899 | 2.9756 | 2.979045 | |
| Ki2 | 0.4187 | 0.4306 | 1.0332 | 1.5561 | 0.729651 | |
| Kd2 | 1.7534 | 1.0095 | 1.9478 | 2.6638 | 1.050161 | |
| n2 | 146.04 | 425.37 | 332.02 | 497.92 | 15.40281 | |
| ITAE Value | 0.0769 | 0.077 | 0.0781 | 0.0769 | 0.075401 | |
| ITAE Improvement % compared to the proposed ARA | 1.949 | 2.077 | 3.455 | 1.949 | - | |
| Controller | Optimization Technique | Reference | Settling Times(s) | Objective Value | ||
|---|---|---|---|---|---|---|
| ∆PTIE | ∆F2 | ∆F1 | ITAE | |||
| PI | Conventional | [12] | 28.27 | 45.01 | 45 | 3.5795 |
| PI | GA | [12] | 9.37 | 11.39 | 10.59 | 2.7475 |
| PI | BFOA | [12] | 6.35 | 7.09 | 5.52 | 1.8379 |
| PI | DE | [7] | 5.75 | 8.16 | 8.96 | 0.9911 |
| PI | PSO | [8] | 5.0 | 7.82 | 7.37 | 1.2142 |
| PI | BFOA-PSO | [8] | 5.73 | 7.65 | 7.39 | 1.1865 |
| PI | FA | [12] | 5.62 | 7.22 | 7.11 | 0.8695 |
| PID | FA | [12] | 4.78 | 5.49 | 4.25 | 0.4714 |
| PID | Proposed ARA | Presented | 3.059294 | 2.901341 | 2.195834 | 0.075401 |
| Algorithm | SAMPE-JAYA | JAYA | DE | PSO | Proposed ARA | |
|---|---|---|---|---|---|---|
| Controller parameters | KP1 | 2.7421 | 2.017 | 2.5822 | 2.2948 | 2.794512 |
| Ki1 | 0.3762 | 1.9978 | 0.4092 | 1.1983 | 0.509808 | |
| Kd1 | 3 | 2.403 | 1.2792 | 1.0794 | 0.995084 | |
| n1 | 307.57 | 57.928 | 409.97 | 500 | 15.03582 | |
| KP2 | 1.9881 | 1.9102 | 2.4546 | 2.2328 | 1.865161 | |
| Ki2 | 2.9963 | 3 | 3 | 2.9705 | 2.997782 | |
| Kd2 | 0.5997 | 0.6106 | 0.6618 | 0.6757 | 0.576527 | |
| n2 | 500 | 372.48 | 410.78 | 136.77 | 166.8088 | |
| ITAE Value | 0.077 | 0.078 | 0.082 | 0.0816 | 0.075409 | |
| ITAE Improvement % compared to the proposed ARA | 2.066566 | 3.322123 | 8.038117 | 7.587323 | - | |
| Algorithm | SAMPE-JAYA | JAYA | DE | PSO | Proposed ARA | |
|---|---|---|---|---|---|---|
| Controller parameters | KP1 | 1.8022 | 2.1068 | 1.5717 | 1.7764 | 1.820495 |
| Ki1 | 2.6685 | 2.9333 | 2.7589 | 3 | 2.994891 | |
| Kd1 | 0.6436 | 1.4944 | 0.3809 | 0.9385 | 0.577278 | |
| n1 | 138.3 | 85.067 | 147.82 | 392.86 | 67.01898 | |
| KP2 | 1.7795 | 1.1472 | 2.3342 | 1.562 | 1.565437 | |
| Ki2 | 2.859 | 2.9487 | 2.9998 | 2.5835 | 2.989529 | |
| Kd2 | 0.4627 | 0.4789 | 0.9962 | 0.6575 | 0.462035 | |
| n2 | 340.75 | 489.58 | 332.55 | 500 | 448.9027 | |
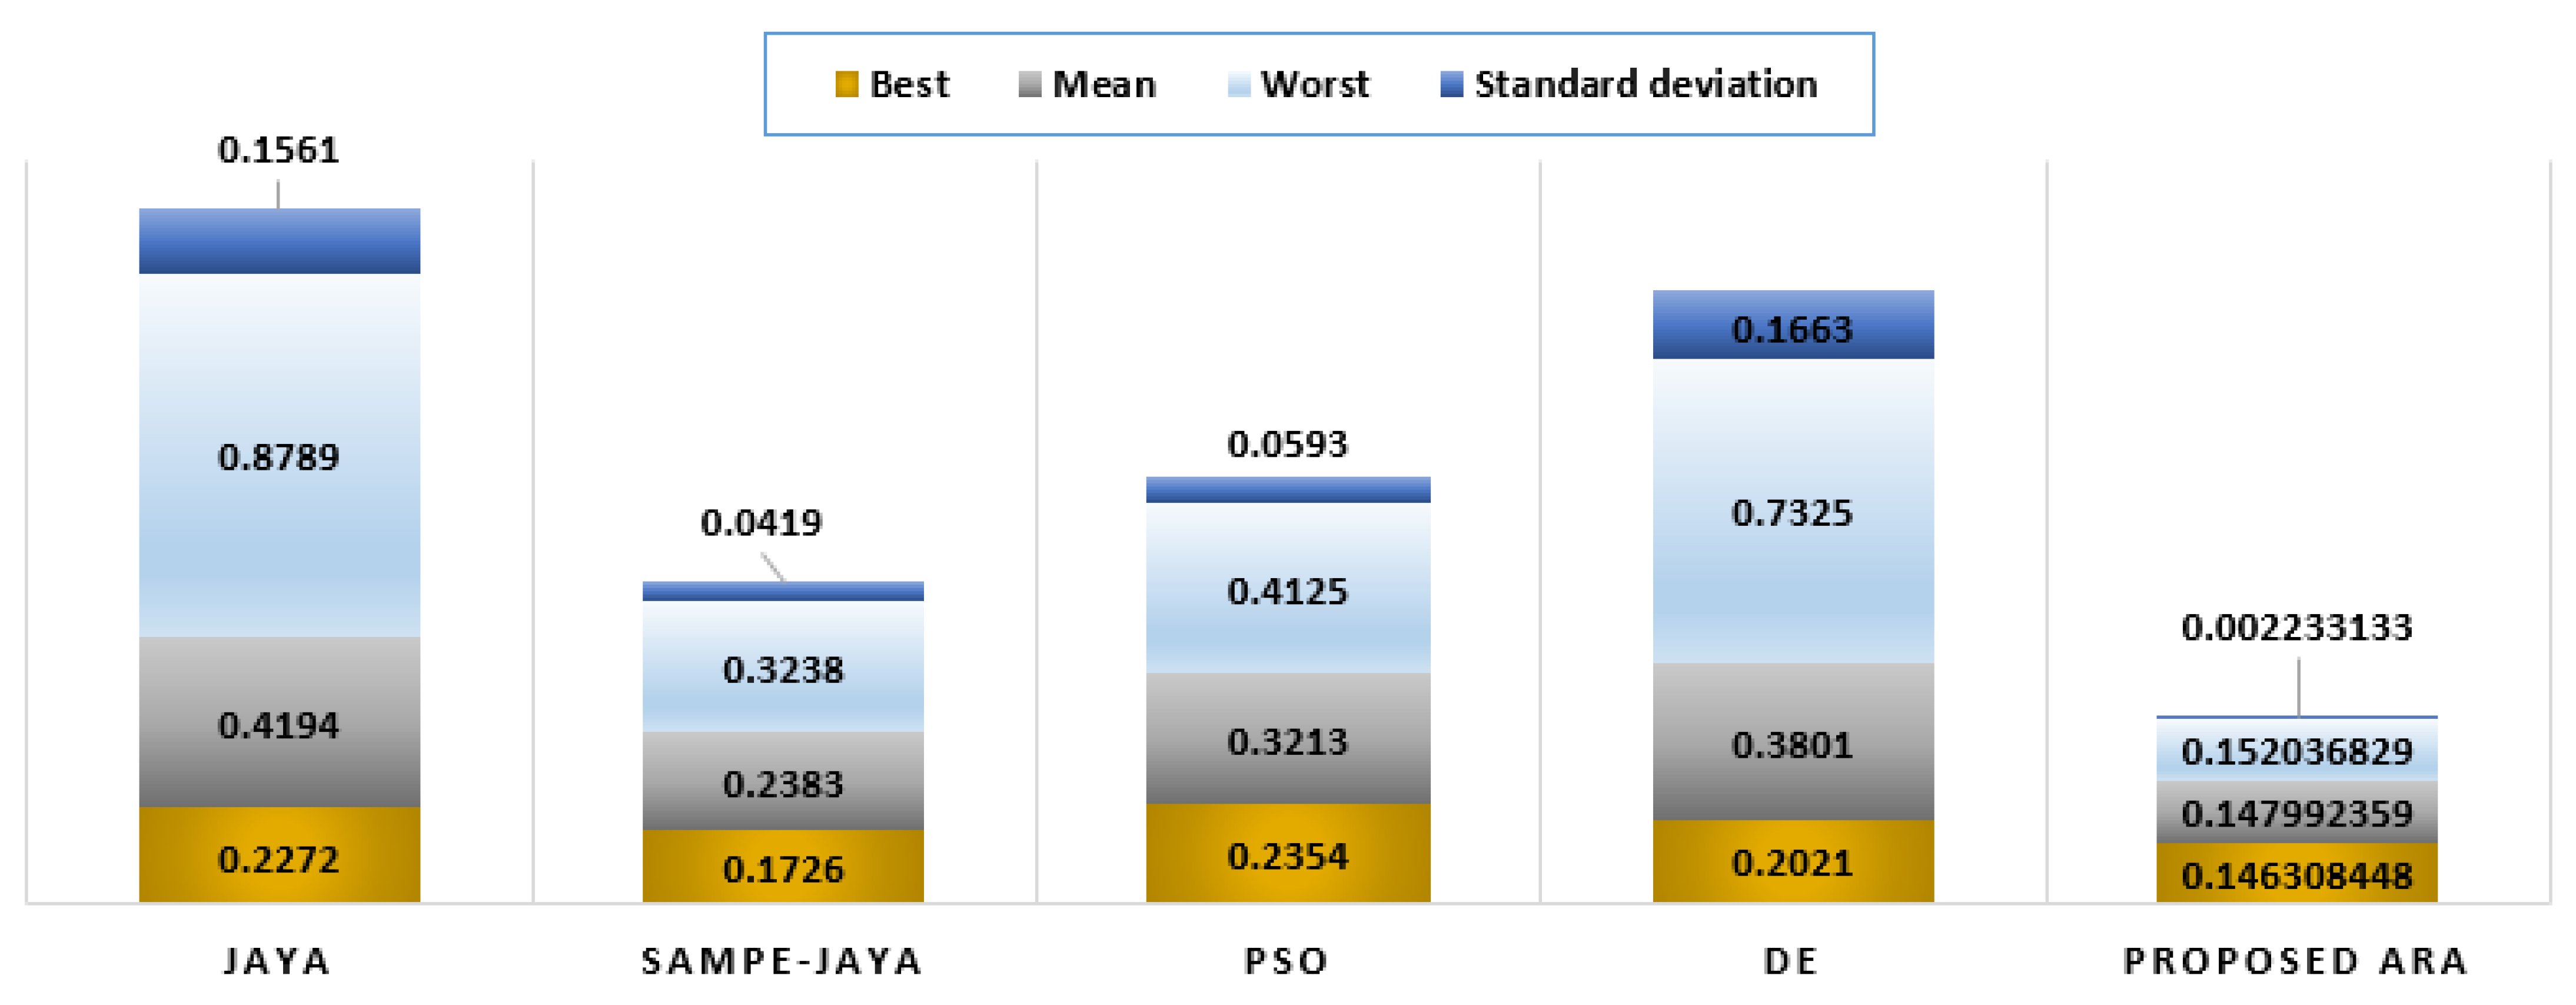
| ITAE Value | 0.1726 | 0.2272 | 0.2021 | 0.2354 | 0.146308 | |
| ITAE Improvement % compared to the proposed ARA | 17.97 | 55.29 | 38.13 | 60.89 | - | |
| Change | SAMPE-JAYA | JAYA | DE | PSO | Proposed ARA |
|---|---|---|---|---|---|
| ∆F1 | 2.4343 | 3.6834 | 3.0722 | 2.2596 | 2.2967 |
| ∆F2 | 1.8693 | 1.6293 | 2.0993 | 3.1665 | 0.9804 |
| ∆PTIE | 3.1625 | 3.2571 | 3.4722 | 3.5186 | 2.2305 |
Disclaimer/Publisher’s Note: The statements, opinions and data contained in all publications are solely those of the individual author(s) and contributor(s) and not of MDPI and/or the editor(s). MDPI and/or the editor(s) disclaim responsibility for any injury to people or property resulting from any ideas, methods, instructions or products referred to in the content. |
© 2023 by the authors. Licensee MDPI, Basel, Switzerland. This article is an open access article distributed under the terms and conditions of the Creative Commons Attribution (CC BY) license (https://creativecommons.org/licenses/by/4.0/).
Share and Cite
El-Sehiemy, R.; Shaheen, A.; Ginidi, A.; Al-Gahtani, S.F. Proportional-Integral-Derivative Controller Based-Artificial Rabbits Algorithm for Load Frequency Control in Multi-Area Power Systems. Fractal Fract. 2023, 7, 97. https://doi.org/10.3390/fractalfract7010097
El-Sehiemy R, Shaheen A, Ginidi A, Al-Gahtani SF. Proportional-Integral-Derivative Controller Based-Artificial Rabbits Algorithm for Load Frequency Control in Multi-Area Power Systems. Fractal and Fractional. 2023; 7(1):97. https://doi.org/10.3390/fractalfract7010097
Chicago/Turabian StyleEl-Sehiemy, Ragab, Abdullah Shaheen, Ahmed Ginidi, and Saad F. Al-Gahtani. 2023. "Proportional-Integral-Derivative Controller Based-Artificial Rabbits Algorithm for Load Frequency Control in Multi-Area Power Systems" Fractal and Fractional 7, no. 1: 97. https://doi.org/10.3390/fractalfract7010097