
Study on the Influence of Sample Size on the Mechanical and Integrity Characteristics of Coal Measure Sandstone under High Strain Rate

1
School of Energy Science and Engineering, Henan Polytechnic University, Jiaozuo 454003, China
2
China Coal Technology Engineering Group Chongqing Research Institute, Chongqing 400037, China
3
Collaborative Innovation Center of Coal Work Safety & Clean High Efficiency Utilization, Henan Polytechnic University, Jiaozuo 454150, China
*
Authors to whom correspondence should be addressed.
Fractal Fract. 2023, 7(12), 869; https://doi.org/10.3390/fractalfract7120869
Submission received: 7 November 2023
/
Revised: 1 December 2023
/
Accepted: 3 December 2023
/
Published: 6 December 2023
Abstract
:In order to explore the size effect of the mechanical and damage characteristics of coal measure sand stones under dynamic load, uniaxial impact compression tests were carried out on coal-bearing sand stones with a diameter of 50 mm and a length–diameter ratio of L/R = 0.5, 0.8, 1, 1.2, 1.5, 1.8, and 2 by using the Hopkinson pressure bar test system. The size effect law of the mechanical properties and energy dissipation of coal-bearing sandstone under a high strain rate were investigated. Then, the mercury injection test was carried out on the fragments at different positions, and the electron microscope scanning test was carried out on the fragments near the end of the transmission rod. Based on the area damage definition method and normalization treatment, the integrity model of coal measure sandstone, considering the influence of the length–diameter ratio, was established. The results showed that the peak strength and dynamic elastic modulus of coal measure sandstone increased first and then decreased with the increase in length–diameter ratio under impact compression load, and they reached the maximum when the length–diameter ratio was 1.2. The dynamic peak strain increased gradually with the increase in length–diameter ratio. The energy of coal-bearing sandstone showed strong size effect, that is, the total absorbed energy, elastic energy, and dissipated energy increased with the increase in length–diameter ratio, and the size effect of total absorbed energy was the most obvious. Under the same impact pressure, the porosity of coal-bearing sand stones with seven kinds of length–diameter ratios near the incident end was roughly the same. But when the length–diameter ratio was greater than 0.5, the porosity decreased gradually with the increase in the distance from the incident end. And the larger the length–diameter ratio, the more obvious the decreasing trend. When the length–diameter ratio was smaller, the size of the holes and cracks and the cluster density were larger. The integrity model of coal measure sandstone, considering the influence of the length–diameter ratio, showed that the larger the length–diameter ratio, the better the relative integrity of coal-bearing sandstone.
1. Introduction
At present, there is increasingly more research on the mechanical properties of rock in underground engineering, and most of the research involves the dynamic analysis of rock blasting and cutting. In actual engineering, the size of rock in the face of construction is often irregular, which leads to strong size effects on physical and mechanical properties [1,2] and macroscopic failure forms [3]. Therefore, it is particularly important to study the size effect of the mechanical properties of sandstone under impact load.
To date, scholars have carried out a lot of research on rock dynamics. However, the early studies usually ignored the change of rock size, that is, they simply believed that the difference in rock mechanical properties caused by the change in rock size was only caused by the cracks in the rock and the uneven distribution of crystals [4], while the strength and elastic modulus of the rock had no significant relationship with the change in size. A large number of studies have shown that the size effect of rocks is mainly manifested by the heterogeneity of rocks [5] and the end effect [6,7], and it is believed that the size change has an important impact on the mechanical properties and energy dissipation of rocks. For example, ref. [8], based on the weakest chain model and the Poisson distribution hypothesis of defects, combined volume and material factors, and established statistical models and general expressions for the failure probability and strength size effects of quasi-brittle materials. Ref. [9] pointed out that with the increase in rock size, the bulk elastic modulus decreases, and its curve is an exponential function. Ref. [10] conducted true triaxial compression tests on rectangular rock samples with different sizes but the same ratio of length to height, and found that damage stress (SCD) and peak strength (Sp) have obvious size effects, that is, the smaller the sample size, the higher the strength.
However, the rock was usually regarded as a whole in current studies, and the mechanical properties [11,12,13,14,15,16], energy dissipation [17,18], damage [19], fractal [20], and other characteristics of the rock were also analyzed by obtaining the data results of the whole rock. It ignored the propagation and attenuation of stress in the overall porous structure of rock and the macroscopic isotropic damage [21,22,23] caused by the imbalance of energy dissipation [24] due to the change in aspect ratio [25]. The imbalance of rocks was mainly manifested by the difference in damage degree of the whole structure inside rocks, and its change had an obvious size effect [26]. For example, ref. [27] conducted a Hopkinson impact compression test on granite samples with an aspect ratio of 0.5, 0.6, 0.8, 1, 1.2, 1.6, and 2, and conducted a statistical analysis of the sample fragments, finding that with the increase in the aspect ratio, the damage degree of the sample weakened gradually and the number of fragments decreased. Ref. [28] showed that the stress waves have reflection and transmission effects in the propagation process of open joints inside rocks, resulting in energy attenuation after stress wave propagation. Ref. [29] conducted a series of point bending tests on granite specimens of the same diameter and different heights, and found that the ratio of height to diameter determined the failure mode of granite specimens. When H/D was less than 0.4, the specimen was mainly broken by bending. But when H/D exceeded 0.4, the failure mode changed to split mode.
A large number of studies had shown that the change in length–diameter ratio has an important effect on the physical and mechanical parameters, macroscopic failure, and damage characteristics of rocks, and the changes are the same or similar under static load and dynamic load. In order to better describe the physical and mechanical properties of rock and the size effects of damage characteristics of rock, this paper firstly conducted the Hopkinson compression test on coal-bearing sandstones with seven kinds of length–diameter ratios, and studied the influence of the change in length–diameter ratio on the physical and mechanical properties and energy dissipation of coal-bearing sandstones under the same pressure. A mercury injection test was used to measure the porosity of the fragments in different parts of the rock, and the influence of length–diameter ratio on the pore distribution of coal-bearing sandstone was studied. At the same time, SEM was used to scan the coal-bearing sandstone fragments in the area with large porosity difference, and the change in the pore structure of coal-bearing sandstone was observed. The damage of rock was defined by the change in porosity, and the rock integrity model with pore damage as variable was established by the normalization method, and then the influence of the change in length–diameter ratio on the damage of coal-bearing sandstone was studied. The research results have a good guiding significance for the overall damage of rock mass in areas involving dynamics such as blasting and cutting.
2. Experiment
2.1. Experiment Design
The coal-bearing sandstone of cylindrical shape with seven different length-diameter (L/D) ratios was subjected to an impact compression test, mercury injection test, and scanning electron microscope (SEM) test. The specific test scheme is as follows:
- (a)
- Impact compression test
The impact compression tests of coal-bearing sandstone samples were carried out by using Hopkinson pressure bar test system. The diameter of the sample was 50 mm, and the length–diameter ratio (L/D = γ) was 0.5, 0.8, 1, 1.2, 1.5, 1.8, and 2. Test impact pressure remained the same at 0.35 MPa.
- (b)
- Mercury injection test
After the impact compression test under the same length–diameter ratio, the mercury injection test was carried out on the broken samples at the contact position with the end of the incident rod, the middle position of the sample and the contact position with the end of the transmission rod. Therefore, seven groups of mercury injection tests with different length–diameter ratios were completed.
- (c)
- Scanning electron microscope (SEM) test
A mercury injection test was used to obtain the changes in the porosity of broken samples at different positions under different length–diameter ratio, and the electron microscope scanning test was carried out on the broken sample with large porosity difference.
2.2. Test Equipment
Three sets of test systems were used in this test: (a) the Hopkinson Pressure rod test system (SHPB) for impact compression test; (b) the mercury injection test system for porosity determination tests; (c) the electron microscope scanning system (SEM) for microscopic morphology observation.
- (a)
- The Hopkinson Pressure rod test system (SHPB)
The separated Hopkinson Pressure rod test system (SHPB) of the State Key Laboratory of Deep Geotechnical and Underground Engineering of China University of Mining and Technology was adopted as the test equipment, as shown in Figure 1. The system includes a gas control system (shown in part A of Figure 1), a launching system (shown in part B of Figure 1), an incident rod system (shown in part C of Figure 1), a transmission rod system (shown in part D of Figure 1), and a data acquisition system (shown in part E of Figure 1).
The specific operation process is as follows: a certain amount of petroleum jelly is evenly applied to both ends of the dry coal-bearing sandstone sample, and placed and tightened on the sample in the middle of the incident rod and the transmission rod; then, open the air valve, when the air pressure in the launching chamber rises to 0.33 MPa, close the air valve, open the launch chamber switch, and the bullet will hit the incident rod at a certain speed driven by the gas to complete the impact.
- (b)
- Mercury injection test system
The test equipment was a mercury injection meter introduced by a research institute in Taiyuan and produced by the Kanta Instrument Company of the United States. The equipment model is Poremaster 60.
The specific operation process is as follows:
As shown in Figure 2, the whole mercury injection test mainly includes several steps: opening the ventilation system, starting the instrument and computer, adding liquid nitrogen to the U-tube liquid nitrogen tank, sample loading, low pressure operation, high pressure operation, and sample unloading.
- (c)
- Electron microscope scanning test (SEM)
The treated samples were placed on the scanning electron microscope to observe the microscopic features. The test equipment used in this paper is the VGEA3 scanning electron microscope test system of Czech TESCAN company introduced by the civil structure laboratory of Xuzhou Institute of Technology, as shown in Figure 3.
2.3. Sample Preparation
- (a)
- Preparation of samples for impact compression tests
Coal-bearing sandstone is extracted from the top of a coal mine 300 m underground in Jincheng City, Shanxi Province. After coring, cutting, and grinding, the coal-bearing sandstone raw rock was prepared into cylinders with a diameter of 50 mm and a height of 25 mm, 40 mm, 50 mm, 60 mm, 75 mm, 90 mm, and 100 mm. The whole production process was in strict accordance with the “Engineering Rock Test Method Standard” (GB-T50266-2013 [30]), and only the height of the sample was adjusted and changed.
In order to reduce the influence of water content on the test results, the coal-bearing sandstone samples were placed in a drying oven and dried at 105 °C. Continuous drying was carried out several times along with repeated weighing until the mass difference between the test block and the front was less than 0.01 g, that is, the sample was considered to contain no moisture. The final prepared samples are shown in Figure 4.
Table 1 shows the physical and mechanical parameters obtained by a uniaxial compression test and longitudinal wave velocity test of standard samples of three groups of coal-bearing sandstones. It could be seen from the table that the dispersion of physical and mechanical parameters of the coal measure sandstone samples prepared in this test is small, and the overall uniformity meets the test requirements.
- (b)
- Preparation of samples for mercury injection test
According to the design requirements in the Section 2.2 test plan, the broken samples at different locations were made into standard test blocks of about 5 × 5 × 5 mm, and dried in a drying oven for 24 h.
- (c)
- Preparation of samples for scanning electron microscope (SEM) test
The fragments were made into cubes with a size of about 10 × 10 × 10 mm. the sample was placed in ethanol and dried at 105 °C for 12 h. The sample was pasted on the sample table with latex preparation, and the surface was gilded.
3. Results
3.1. Data Processing Method
Figure 5 was the original waveform diagram of the impact load test, from which it could be seen that the incident wave, reflected wave, and transmitted wave have a good rising edge, meeting the one-dimensional propagation characteristics of the stress wave.
According to the one-dimensional stress wave propagation hypothesis, the strain of the member under one-dimensional stress wave is ε(t), and the overall displacement of the bar is l, which can be expressed as follows [31,32]:
where l is the overall displacement of the bar, CS is the propagation speed of the stress wave in the bar, which is 5450 m/s, t is time, which is seconds, and the overall displacement l1 of the incident bar during the propagation of the stress wave in the incident bar can be obtained by using Formula (1) [31,32]:
where l1 represents the overall displacement of the incident bar, εi(t) represents the strain of the incident bar member under the action of the incident wave, and εr(t) represents the strain of the incident bar member under the action of the reflected wave.
Similarly, the displacement l2 [31,32] of the transmission rod can be obtained as
where l2 represents the overall displacement of the transmission rod, and εt(t) represents the strain of the transmission rod member under the action of the incident wave.
Combined with the overall displacement of the incident rod and the transmission rod, the average strain of the sample can be obtained [31,32]:
Combined with Formulas (1), (2), (3), and (4), the original waveform in the SHPB test was processed, that is, the three-wave method, and the formulas of strain rate, strain, and stress [31,32] were obtained as follows:
where represents the strain rate of coal-bearing sandstone, h represents the original length of the sample, Et represents the elastic modulus of the incident rod and transmission rod, which is 210 GPa, S1 represents the cross-sectional area of the incident rod and transmission rod, which is 1963.49 mm2, and S2 represents the cross-sectional area of the sample, which is 1963.49 mm2.
3.2. Stress–Strain Curve Characteristics
Using Formula (5) to process the waveforms in Figure 6, the stress–strain curves of coal-bearing sandstones with different length–diameter ratios could be obtained, which are shown in Figure 6.
Figure 7 shows the stress–strain curve of coal-bearing sandstone under the impact compression test. It could be seen from the figure that the stress–strain curve can be roughly divided into four stages: a compaction stage I (as shown in the O–A section of Figure 7); an approximate linear elastic stage II (as shown in A–B in Figure 7); an inelastic stage III (as shown in B–D in Figure 7, which could be subdivided into a micro-crack development stage and rapid crack expansion stage); a destruction stage IV (as shown in section D–C in Figure 7, also known as a strain-softening stage).
The compaction stage. Since there were a large number of micro-cracks in the coal-bearing sandstone samples at the initial state, the micro-cracks gradually closed under the impact load at the early stage. At this time, the stress–strain curve presented a slightly smaller upward trend. However, because the coal-bearing sandstone was a relatively dense rock, the proportion of compaction stage in the whole stress–strain curve change stage was not obvious.
The linear elastic stage. During this stage, the stress wave would propagate repeatedly in the sample until the stress–strain uniformity was achieved. The initial fissure was closed, the elastic energy accumulated, and the sample was at the state of elastic deformation. With the continuous increase in elastic energy, new cracks began to appear inside the sample and expand gradually. However, the slope of the stress–strain curve remained unchanged and showed a linear upward trend during this stage. The dynamic elastic modulus of coal-bearing sandstone could be calculated by using the slope of the curve.
The inelastic stage. With the continuous accumulation of energy in the sample, cracks expanded further in the sample, at the same time, more new cracks were generated. The sample mainly exhibited plastic deformation. The beginning point of this stage was the turning point between the elastic and inelastic stages. Later in this stage, the cracks spread rapidly to form cracks until the penetration leading to the failure of the specimen, that is, the specimen reached its peak stress. It was also believed that the early state of this stage was mainly the development stage of micro-cracks, and the late state was mainly the rapid expansion stage of cracks. However, due to the complex composition of rock materials, the results easily appeared discrete. And it was hard to find out the complete division point of the two states, which could not be judged independently by the stress–strain curve, and still need to be combined with acoustic emission and other technologies. Therefore, the two states were both represented as inelastic stages.
The destruction stage. The cracks spread and penetrated further, and the stress–strain curve reached the peak, that is, the specimen reached the maximum compressive strength. Then, the stress–strain curve began to decline. In this stage, the penetration of a large number of cracks intensified the failure of the sample, but the sample still maintained a certain integrity, that is, there was residual strength. This stage could also be called the strain-softening stage.
The dynamic stress–strain curves of coal-bearing sandstones with different length–diameter ratios were basically the same. But there were differences in the curves at each stage. The stress–strain curve of some samples had a long extended microfracture expansion stage, while the microfracture expansion stage of some samples was not obvious.
In order to study the influence of size effect on the stress–strain curve characteristics of coal-bearing sandstone, the characteristic curves of samples with different length–diameter ratios were compared, as shown in Figure 8.
It could be seen from the figure that the curve slope of the sample at the elastic stage increases first and then decreases with the increase in length–diameter ratio, that is, the dynamic elastic modulus increases and then decreases gradually, the peak stress also has the same trend of change, and the peak strain increases gradually. The compaction stage of samples with different length–diameter ratios was shorter, and the strain variation length of samples at the strain-softening stage increased gradually with the increase in length–diameter ratio.
3.3. The Influence of Size Effect on the Variation in Mechanical Property Parameters of Samples
Table 2 shows the values of mechanical property parameters such as the stress, strain, and dynamic elastic modulus of samples under different length–diameter ratios.
Figure 9 shows the variation in peak strength σd of coal measure sandstone with the length–diameter ratio under an impact compression test. It could be seen from the figure that the peak strength of coal-bearing sandstone increases first and then decreases with the change in length–diameter ratio. Specifically, when the length–diameter ratio was 0.5, the dynamic peak strength of coal-bearing sandstone was 64.04 MPa, while when the length–diameter ratio was increased to 1.2, the dynamic peak strength of coal measure sandstone was 172.76 MPa, with an increase of 170%. However, with the further increase in length–diameter ratio, the dynamic peak strength of coal-bearing sandstone decreased gradually. When the length–diameter ratio was 2, the dynamic peak strength of coal-bearing sandstone was 96.4 MPa, which decreased by 44.20% compared with the one with the length–diameter ratio of 1.2. The dynamic peak strength showed a quadratic function relationship in the interval range of the length–diameter ratio from 0.5 to 2, and the fitting formula was as follows:
The dynamic peak strength could represent the bearing capacity of rock under impact. It could be seen from this test that the dynamic peak strength of coal-bearing sandstone increases first and then decreases with the change in length–diameter ratio. This was caused by the fact that the stress homogenization conditions of rock materials under impact loads could not be met [27].
Figure 10 shows the variation in peak strain εd of coal-bearing sandstone with length–diameter ratio under impact compression test. It could be seen from the figure that the peak strain of coal-bearing sandstone increases gradually with the change in length–diameter ratio. Specifically, when the length–diameter ratio was 0.5, the dynamic peak strain of coal-bearing sandstone was 10.58 × 10⁻³, while when the length–diameter ratio was 2, the dynamic peak strain of coal-bearing sandstone was 23.76 × 10⁻³, with an increase of 124.57%. The dynamic peak strain presented an exponential function relationship in the length–diameter ratio range from 0.5 to 2, and the fitting formula was as follows:
Figure 11 shows the variation in the dynamic elastic modulus Ed of coal-bearing sandstone with a length–diameter ratio under impact compression test. It could be seen from the figure that the average dynamic elastic modulus of coal-bearing sandstone increases linearly with the change in length–diameter ratio. When the length–diameter ratio was 0.5, the dynamic elastic modulus of coal measure sandstone was 9.64 GPa, and when the length–diameter ratio was 1.2, the dynamic elastic modulus of coal measure sandstone was 16.21 GPa, an increase of 68%. However, the dynamic elastic modulus of coal-bearing sandstone decreased gradually with the further increase in length–diameter ratio. When the length–diameter ratio was 2, the dynamic elastic modulus of coal measure sandstone was 6.73 GPa, which decreased by 58.48% compared with the one with the length–diameter ratio of 1.2. The dynamic elastic modulus presented a quadratic function relationship in the range of length–diameter ratio from 0.5 to 2, and the fitting formula was as follows:
As one of the most critical and typical mechanical properties of materials, elastic modulus represented the difficulty of elastic deformation of objects. Generally, the elastic modulus under dynamic load was called the dynamic elastic modulus, which was an important parameter to measure rock stiffness characteristics. With the increase in length–diameter ratio, the dynamic elastic modulus of sandstone increased. It was because that the deformation area of coal-bearing sandstone increases gradually with the increase in length–diameter ratio, which makes the energy more dispersed.
4. Energy Dissipation Characteristics
4.1. The Calculation Principle of Energy
The process of deformation and destruction of coal-bearing sandstone after impact was a process of transforming mechanical energy into elastic energy and then into dissipative energy and kinetic energy of fragmentation. Therefore, the energy variation in coal-bearing sandstone under different length–diameter ratios was calculated and analyzed in this paper, which was meaningful to study the size effect of the energy dissipation of coal-bearing sandstone. According to the law of thermodynamics, energy transformation was the essential feature of a physical change in matter, and the destruction of matter was a state instability phenomenon driven by energy. Therefore, the energy carried by the stress wave was calculated by Equation (9) as follows [33]:
where A was the cross-sectional area of the incident rod and the transmission rod; E was the elastic modulus of the incident rod and the transmission rod; C was the one-dimensional stress wave velocity. In the elastic stage, C was related to the density ρ and the elastic modulus E of the incident rod, which could be expressed by Equation (10) [33]:
According to the above formulas, the incident energy WI, reflected energy WR, and transmitted energy WT during the dynamic impact of SHPB could be expressed as [33]
where WI, WR, and WT were incident energy, reflected energy, and transmitted energy, respectively.
According to the law of conservation of energy, the dissipative energy of coal measure sandstone could be obtained [33]:
where WL was the dissipated energy.
From the perspective of energy transformation, the deformation and failure of coal-bearing sandstone was a process of energy input, elastic deformation energy accumulation, energy dissipation, and energy release. Coal-bearing sandstone was driven by energy from initial damage to macro instability failure [32]. Energy dissipation was mainly used for crack initiation and propagation, while energy release was the internal cause of sudden rock failure [34]. For the actual engineering rock mass, the residual elastic strain energy after impact loading was eventually released, resulting in the failure of coal-bearing sandstone, and especially, the places with different porosity in the structure of coal-bearing sandstone were more likely to absorb or release energy [34].
Presently, the principle of energy analysis in the process of rock class loading has been developed to relatively mature, and a set of general theory has been formed. As shown in Figure 12, the work carried out by external forces could be obtained by using the stress–strain curve of coal-bearing sandstone [35]:
where Ue was the releasable strain energy, which was formed in the elastic strain stage of coal-bearing sandstone units. After unloading, this part of energy could restore the deformation of coal-bearing sandstone to a certain extent. Ud was the dissipated energy, which was used to form internal damage and the plastic deformation of coal-bearing sandstone units.
4.2. The Law of Energy Change
Combined with Formulas (11), (13), and (14), energy values of coal-bearing sandstone under different length–diameter ratios could be calculated, as shown in Table 3. Figure 13 shows the relationship between energy change and length–diameter ratio of coal-bearing sandstone. It could be seen from Table 3 and Figure 13 that the change in length–diameter ratio had an important influence on the change in energy of coal-bearing sandstone under the impact compression load. The energy increased gradually with the increase in length–diameter ratio, in which the phenomenon was obvious, particularly in the total absorbed energy.
It could be seen from Figure 13 and Table 3 that the total absorbed energy, releasable strain energy and dissipated energy of coal-bearing sandstone increase gradually with the increase in length–diameter ratio under the impact compression test. But the variation trend was different. This difference was mainly reflected in that the changes in released strain energy and dissipated energy increase slowly, but there was no abrupt increase with the increase in length–diameter ratio. When the length–diameter ratio increased from 1.0 to 1.2, the total absorbed energy increased abruptly, and the size effect changed significantly. This was because the cracks in coal-bearing sandstone are closed under the action of stress wave energy, resulting in the development of crack tips.
5. Size Effect of Intact Characteristics of Sandstone
5.1. Variation in Porosity of Coal-Bearing Sandstone under Different Length–Diameter Ratios
Through the mercury injection test, the porosity values of coal-bearing sandstone fragments at different positions were obtained under the impact compression test, as shown in Table 4.
Figure 14 shows the variation in porosity of coal-bearing sandstone under different length–diameter ratios. It could be seen from the figure that the porosity values of coal-bearing sandstones under seven different aspect ratios show significant differences under the uniaxial impact compression load. The main manifestations were as follows: (1) the porosity values at the incident end of coal-bearing sandstones were roughly the same under the same impact pressure; (2) except for the approximate linear variation trend of porosity when the length–diameter ratio λ was 0.5, the porosity values of coal-bearing sandstones with the other six kinds of length–diameter ratios (except λ = 0.5) showed a gradual downward trend, and the decreasing trend became more obvious with the increase in length–diameter ratio.
By studying the size effect of the porosity change in coal-bearing sandstone, it could be regarded as a rigid body full of cracks or joints. The one-dimensional stress wave propagated from the incident bar to the transmitted bar in the coal-bearing sandstone under the impact load. In the process of propagation, the open crack or joint could be regarded as a free plane, and there were certain pores in these cracks or joints. When the stress wave passed through these cracks or joints in the propagation process, the stress wave could not continue to propagate in the larger pores, that is, the function of the stress wave could not realize the closure of the pores. But when the stress wave passed through the small pores, the action of the stress wave would cause the closure of the pores, so that part of the stress wave would continue to transmit along the one-dimensional direction until it passed through the next crack or joint [28]. Therefore, under the same impact pressure, the larger the length–diameter ratio, the more obvious the variation difference in porosity of coal measure sandstone.
5.2. Micromorphologic Characteristics of Coal-Bearing Sandstone under Different Length–Diameter Ratio
Based on the mercury injection test results, the coal-bearing sandstone with the largest porosity difference under different aspect ratios, that is, the coal-bearing sandstone fragments at the end of the transmission rod, was chosen as the test object. The samples were scanned by SEM (electron microscope scanning system) to observe their microscopic features.
Figure 15 shows the microscopic morphology of coal-bearing sandstone fragments at the end of the transmission rod under different length–diameter ratios. The following could be seen from the figure: (1) The pores of the original coal-bearing sandstone are relatively independent, and there are many small and micro-cracks. Under the impact compression load, the diameter of the pores in the coal-bearing sandstone is enlarged, and the cluster phenomenon occurs between the different pores, and the micro-cracks expand and develop gradually. (2) In the case of small length–diameter ratio, the cracks in the microscopic section of coal-bearing sandstone are larger, and some cracks are interconnected to form a network distribution trend. But in the case of large length–diameter ratio, the size of the micro-cracks in the micro-section of coal-bearing sandstone is small, and the local cracks are connected with each other.
The development of cracks and pores in coal-bearing sandstone at the end of the transmission rod was different under different length–diameter ratios. Due to the initial micro-cracks and fissures in the rock itself, the energy input led to the fracture among particles in the rock under the impact load, which was accompanied by the generation and expansion of new cracks and pores [34,36]. However, with the increase in length–diameter ratio, the initiation and propagation of cracks in coal-bearing sandstone weaken gradually, but eventually, with the further penetration of cracks, the overall structure of the rock became unstable, which showed that the peak stress of the rock increased first and then decreased in terms of macro-mechanical properties, and the peak strain increased gradually.
5.3. Size Effect on Integrity of Coal-Bearing Sandstone
The above test results showed that length–diameter ratio was an important factor affecting the damage variation in each part of coal-bearing sandstone. The damage degree of coal-bearing sandstone varied with the length–diameter ratio. The effect of length–diameter ratio on rock damage could not be described quantitatively by macroscopic test alone. Therefore, in order to describe the size effect of damage to coal-bearing sandstone, it was necessary to adopt the research idea of local to whole, and accumulate the damage at each location of the rock as a whole, so as to realize the quantitative analysis of the impact of the length–diameter ratio on damage to coal-bearing sandstone.
When the coal-bearing sandstone was subjected to the impact load, there would be more pores in the rock on the basis of the original pores, which affected the rock properties. If these pores generated during the loading process were assumed to be spheres, then the pores in the local length of the coal-bearing sandstone within the range of could be equivalent to spheres [37,38]:
where was the pore diameter of the coal-bearing sandstone with a length–diameter ratio of γ from the incident rod end of L, m. was the porosity of the coal-bearing sandstone with a length–diameter ratio of γ from the incident rod end of L, %. R was the diameter of the coal-bearing sandstone, m. The radius of the equivalent sphere of the pore could be obtained by further simplification as follows:
Therefore, the pore area at the position where the length of the incident rod end was L was
where was the pore plane area of coal-bearing sandstone with the length–diameter ratio γ from the incident rod end of L, m2.
Under the impact load, the propagation of stress waves in the coal-bearing sandstone decreased gradually, and the pore changes in each part of the rock were different. It went roughly through the stages of compression, stabilization, and destruction of growth. However, when the length–diameter ratio was large, the pore structure inside the coal-bearing sandstone, especially the rock pore structure near the reflection dry end, had a slightly different degree of change, that is, it had not experienced the stage of pore failure. Therefore, in order to describe the damage degree of each part of the coal-bearing sandstone, the method of segmented point selection should be used to better describe the influence of length–diameter ratio on the pore change law of the coal-bearing sandstone, so as to reveal the size effect of rock damage. The damage here was defined on the basis of pore change, and the damage was defined as follows [39]:
where was the damage of the coal-bearing sandstone with a length–diameter ratio of γ from the incident rod end of L, m2. A0 was the original porosity plane area of the coal-bearing sandstone.
It was assumed that internal damage occurred only in the direction of principal stress after the compression load, and no damage occurred in other directions, that is, the load on coal-bearing sandstone was only shared together by the undamaged part and the damaged part, so the damage variable Dγ was defined as
where Dγ was the overall damage of the sample when the length–diameter ratio was γ.
Due to the length–diameter ratio error of coal-bearing sandstone in the same group of experiments, it was necessary to normalize the length and damage of coal measure sandstone in order to compare the influence of rock damage on the whole rock stability under different length–diameter ratios. When the length–diameter ratio was 0.5, the changes in the porosity of rock near the end of the incident rod and the end of the transmission rod were roughly the same. Therefore, the damage and length of the coal-bearing sandstone when the length–diameter ratio was 0.5 were set as the reference value. The damage after the normalized treatment was expressed as follows:
The normalized length was represented as follows:
The relationship of integrity of coal-bearing sandstone with length was as follows:
The relationship between the integrity of coal-bearing sandstone and length–diameter ratio could be obtained by calculating Formula (21). Figure 16 shows the change law of the overall damage degree of coal-bearing sandstone to length–diameter ratio. It could be seen from the figure that the overall damage degree of coal-bearing sandstone decreases gradually with the increase in length–diameter ratio under the impact pressure of 0.35 MPa. However, the higher the overall damage degree, the smaller its integrity and the weaker its compressive resistance in the next stage.
6. Conclusions
In this paper, impact compression tests were carried out on seven kinds of coal-bearing sandstones with different aspect ratios by using the Hopkinson pressure bar test system. The changes in physical and mechanical properties and energy dissipation of coal-bearing sandstones with aspect ratios were obtained. Based on the area damage definition method and normalization treatment, the integrity model of coal-bearing sandstone, considering the influence of the length–diameter ratio, was established. The following conclusions were reached:
(1) Under the impact load, the peak strength, peak strain, and dynamic elastic modulus of coal measure sandstone had strong dimensional effects. The peak strain increased with the increase in length–diameter ratio. The peak strength and dynamic elastic modulus first increased and then decreased with the increase in length–diameter ratio, and both of them were the maximum value when the length–diameter ratio was 1.2.
(2) In the impact compression test, the energy of coal measure sandstone showed a strong size effect, that is, the total absorbed energy, elastic energy, and dissipated energy increase with the increase in the aspect ratio, and especially, the size effect of the total absorbed energy was the most obvious. During the increase in length–diameter ratio from 1.0 to 1.2, the increase in the total absorbed energy of coal-bearing sandstone was significantly higher than that of other adjacent length–diameter ratios. This indicated that the coal-bearing sandstone can achieve good stress uniformity under the impact load with this range of length–diameter ratios, but the rock porosity change was not very obvious when the length–diameter ratio was 1.2.
(3) Under the same impact pressure, the porosity of coal-bearing sandstones with seven kinds of length–diameter ratios near the incident end was roughly the same. When the length–diameter ratio was 0.5, the variation in porosity showed an approximate linear trend. But when the length–diameter ratio was greater than 0.5, the porosity decreased gradually with the increase in the distance from the incident end. And the larger the length–diameter ratio, the more obvious the decreasing trend.
(4) By comparing the microscopic morphology of the fragments between the original coal-bearing sandstones and the one at the distance from the transmission end with different aspect ratios, it was found that the impact loading promotes the development and expansion of pores and cracks in the coal-bearing sandstones at the distance transmission rod end, and the fracture holes of the fragments present a large-scale cluster phenomenon. When the length–diameter ratio was smaller, the size of the holes and cracks and the cluster density were larger.
(5) Based on the area damage definition method and normalization treatment, the integrity model of coal measure sandstone, considering the influence of the length–diameter ratio, was established. It was found that under the impact pressure of 0.35 MPa, the larger the length–diameter ratio, the better the relative integrity of coal-bearing sandstone.
Author Contributions
Conceptualization, E.Y. and Z.L.; methodology, E.Y.; software, E.Y.; validation, E.Y. and Z.L.; formal analysis, E.Y.; investigation, E.Y.; resources, E.Y.; data curation, E.Y.; writing—original draft preparation, E.Y.; writing—review and editing, E.Y. and Z.L.; visualization, E.Y.; supervision, Z.L.; project administration, Z.L.; funding acquisition, Z.L. All authors have read and agreed to the published version of the manuscript.
Funding
This research was funded by the National Natural Science Foundation of China, grant number 52174175; National Natural Science Foundation of China, grant number 51774110; Program for Science and Technology Innovation Talents in the Universities of Henan Province, grant number 19HASTIT047; Natural Science Foundation of Henan Province, grant number 222300420007; National Natural Science Foundation of China, grant number 52174073.
Data Availability Statement
The data for the pictures and tables used to support the findings of this study are included within the article.
Conflicts of Interest
The authors declare no conflict of interest.
References
- Jackson, R.; Lau, J.S.O. The effect of specimen size on the laboratory mechanical properties of Lac du Bonnet grey granite. In Proceedings of the International Workshop on Scale Effects in Rock Masses, Loen, Norway, 7–8 June 1990; pp. 165–174. [Google Scholar]
- Yiouta–Mitra, P.; Dimitriadis, G.; Nomikos, P. Size effect on triaxial strength of randomly fractured rock mass with discrete fracture network. Bull. Eng. Geol. Environ. 2023, 82, 8. [Google Scholar] [CrossRef]
- Hudson John, A.; Crouch Steven, L.; Charles, F. Soft, stiff and servo-controlled testing machines: A review with reference to rock failure. Eng. Geol. 1972, 6, 155–189. [Google Scholar] [CrossRef]
- You, M.; Hua, A. The size effect of uniaxial compression of rock specimen and support capacity of ore pillar. J. China Coal Soc. 1997, 22, 37–41. (In Chinese) [Google Scholar]
- Lu, Z.; Feng, Z.; Zhao, Y. Influence of rock inhomogeneity on strength-size effect of rock materials. J. China Coal Soc. 2007, 32, 917–920. [Google Scholar]
- Sun, C.; Liu, F.; Jiang, M.; Chen, H. Size effect of compression strength and end constraint of rocks by distinct element simulation. Chin. J. Rock Mech. Eng. 2014, 33, 3421–3428. [Google Scholar]
- Yang, S.; Su, C.; Xu, W. Experimental and theoretical study of size effect of rock material. Eng. Mech. 2005, 22, 112–118. [Google Scholar] [CrossRef]
- Zhang, M.; Lu, Y.; Yang, Q. Failure probability and strength size effect of quasi-brittle materials. Chin. J. Rock Mech. Eng. 2010, 29, 1782–1789. [Google Scholar]
- Zhao, T.; Hu, G.; Wang, T.; Zhang, H. Influence of Parallel Joint Spacing and Rock Size on Rock Bulk Modulus. Adv. Civ. Eng. 2022. [Google Scholar] [CrossRef]
- Han, Q.; Gao, Y.; Zhang, Y. Experimental Study of Size Effects on the Deformation Strength and Failure Characteristics of Hard Rocks under True Triaxial Compression. Adv. Civ. Eng. 2021, 2021, 1–15. [Google Scholar] [CrossRef]
- You, M.; Zou, Y. Discussion on heterogeneity of rock material and size effect on specimen strength. Chin. J. Rock Mech. Eng. 2000, 19, 391–395. [Google Scholar]
- Liang, Z.; Zhang, Y.; Tang, S.; Li, L. Size effect of rock messes and associated representative element properties. Chin. J. Rock Mech. Eng. 2013, 32, 1157–1166. [Google Scholar]
- Su, H.; Jing, H.; Zhao, H.; Yin, Q. Study on tensile strength and size effect of red sandstone after high temperature treatment. Chin. J. Rock Mech. Eng. 2015, 34, 2879–2887. [Google Scholar]
- Yang, S.; Wen, S. Method for strength parameters of coal samples with different diameters. Chin. J. Geotech. Eng. 2010, 32, 881–891. [Google Scholar]
- Masoumi, H.; Roshan, H.; Hagan, P.C. Size-dependent Hoek-Brown failure criterion. Int. J. Geomech. 2017, 17, 04016048. [Google Scholar] [CrossRef]
- Chang-yu, L.; Xiao, L.I.; Shu-ren, W.U. Research on energy characteristics of size effect of granite under low/intermediate strain rates. Rock Soil Mech. 2016, 37, 3472–3480. [Google Scholar]
- Li, M.; Mao, X.; Lu, A.; Tao, J.; Zhang, G.; Zhang, L.; Li, C. Effect of specimen size on energy dissipation characteristics of red sandstone under high strain rate. Int. J. Min. Sci. Technol. 2014, 24, 151–156. [Google Scholar] [CrossRef]
- Meng, Q.B.; Han, L.J.; Pu, H.; Wen, S.-Y. Experimental on the effect of strain rate and size on the energy accumulation and dissipation of rock. J. China Coal Soc. 2015, 40, 2386–2398. [Google Scholar]
- Li, X.; Ni, X.; Sun, B.; Zhu, Z.; Du, S. Quantitative study on meso-damage characteristics of siltstone under triaxial compression. J. China Coal Soc. 2012, 37, 590–595. [Google Scholar]
- Xia, Y.-Y.; Lin, M.-Q.; Liao, L.; Xiong, W.; Wang, Z.D. Fractal characteristics analysis of fragments from rockburst tests of large-diameter specimens. Chin. J. Rock Mech. Eng. 2014, 33, 1358–1365. [Google Scholar]
- Zhou, J.; Zhao, G.; Meng, X.; Liu, C.; Ma, L.; Xu, W.; Cheng, X. Experimental Investigation of the Size Effect of Rock under Impact Load. Minerals 2022, 13, 43. [Google Scholar] [CrossRef]
- Li, K.; Yin, Z.-Y.; Han, D.; Fan, X.; Cao, R.; Lin, H. Size effect and anisotropy in a transversely isotropic rock under compressive conditions. Rock Mech. Rock Eng. 2021, 54, 4639–4662. [Google Scholar] [CrossRef]
- Li, K.; Cheng, Y.; Yin, Z.-Y.; Han, D.; Meng, J. Size effects in a transversely isotropic rock under brazilian tests: Laboratory testing. Rock Mech. Rock Eng. 2020, 53, 2623–2642. [Google Scholar] [CrossRef]
- Zhao, K.; Wang, X.J.; Liu, F.; Luo, W.-C. Propagation of stress wave in porous material. Explos. Shock. Waves 2011, 31, 107–112. [Google Scholar]
- Gong, F.Q.; Li, X.B.; Rao, Q.H.; Liu, X. Reference method for determining sample size in SHPB tests of rock materials. J. Vib. Shock. 2013, 32, 24–28. [Google Scholar]
- Jing, H.W.; Su, H.J.; Yang, D.L.; Meng, B. Study of strength degradation law of damaged rock sample and its size effect. Chin. J. Rock Mech. Eng. 2012, 31, 543–549. [Google Scholar]
- Li, D.; Xiao, P.; Xie, T.; Li, X. On the effect of length to diameter ratio of rock specimen subjected to dynamic and static compression. J. Exp. Mech. 2018, 33, 93–100. [Google Scholar]
- Wang, W.H.; Li, X.B.; Zhou, Z.L.; Zhang, Y.P. Energy-transmitted rule of various stress waves across open joint. J. Cent. South Univ. Sci. Technol. 2006, 37, 376–380. [Google Scholar]
- Ma, D.; Wang, J.; Cai, X.; Ma, X.; Zhang, J.; Zhou, Z.; Tao, M. Effects of height/diameter ratio on failure and damage properties of granite under coupled bending and splitting deformation. Eng. Fract. Mech. 2019, 220, 106640. [Google Scholar] [CrossRef]
- TB 10099-2017; Code for Design of Railway Station and Terminal. China Railway Publishing House: Beijing, China, 2017.
- Yi, E. The Influence of Fly Ash Contents on Mechanical Properties and Energy Response of Concrete at a High Strain Rate. Adv. Civ. Eng. 2023, 2023. [Google Scholar] [CrossRef]
- Lu, A.; Hu, S.; Li, M.; Duan, T.; Li, B.; Chang, X. Impact of Moisture Content on the Dynamic Failure Energy Dissipation Characteristics of Sandstone. Shock. Vib. 2019, 2019, 1–10. [Google Scholar] [CrossRef]
- Hu, Y.; Duan, T.; Xian, P.; Chen, L. Freeze-Thaw Cycle Effect on Sputtering Rate of Water-Saturated Yellow Sandstone under Impact Loading. Adv. Civ. Eng. 2019, 2019, 2549603. [Google Scholar] [CrossRef]
- Zhang, Z. Energy Evolution Mechanism during Rock Deformation and Failure. China University of Mining and Technology. Available online: https://kns.cnki.net/KCMS/detail/detail.aspx?dbname=CDFD1214&filename=1013030078.nh (accessed on 6 November 2023).
- Hu, S. Study on Mechanical Properties and Energy Response Characteristics of High-Porosity Concrete under Cyclic Loading and Unloading. China University of Mining and Technology. Available online: https://kns.cnki.net/KCMS/detail/detail.aspx?dbname=CMFD201901&filename=1018826818.nh (accessed on 6 November 2023).
- Belak, J. On the nucleation and growth of voids at high strain-rates. J. Comput. Aided Mater. Des. 1998, 5, 193–206. [Google Scholar] [CrossRef]
- Song, Y.; Yang, H.; Tan, H.; Reng, J. Study on damage evolution characteristics of sandstone with different saturations in freeze-thaw environment. Chin. J. Rock Mech. Eng. 2021, 40, 1513–1524. [Google Scholar]
- Song, Y.; Yang, H.; Tan, H. Research on Digital Core Pore-Level Network Modeling Based on Micro-CT Images; Jilin University: Changchun, China, 2015. [Google Scholar]
- Jia, H.L.; Liu, Q.B.; Xiang, W.; Zhang, W. Damage evolution model of saturated sandstone under freeze-thaw cycles. Chin. J. Rock Mech. Eng. 2013, 32, 3049–3055. [Google Scholar]
Figure 1.
The separated Hopkinson Pressure rod test system (SHPB).
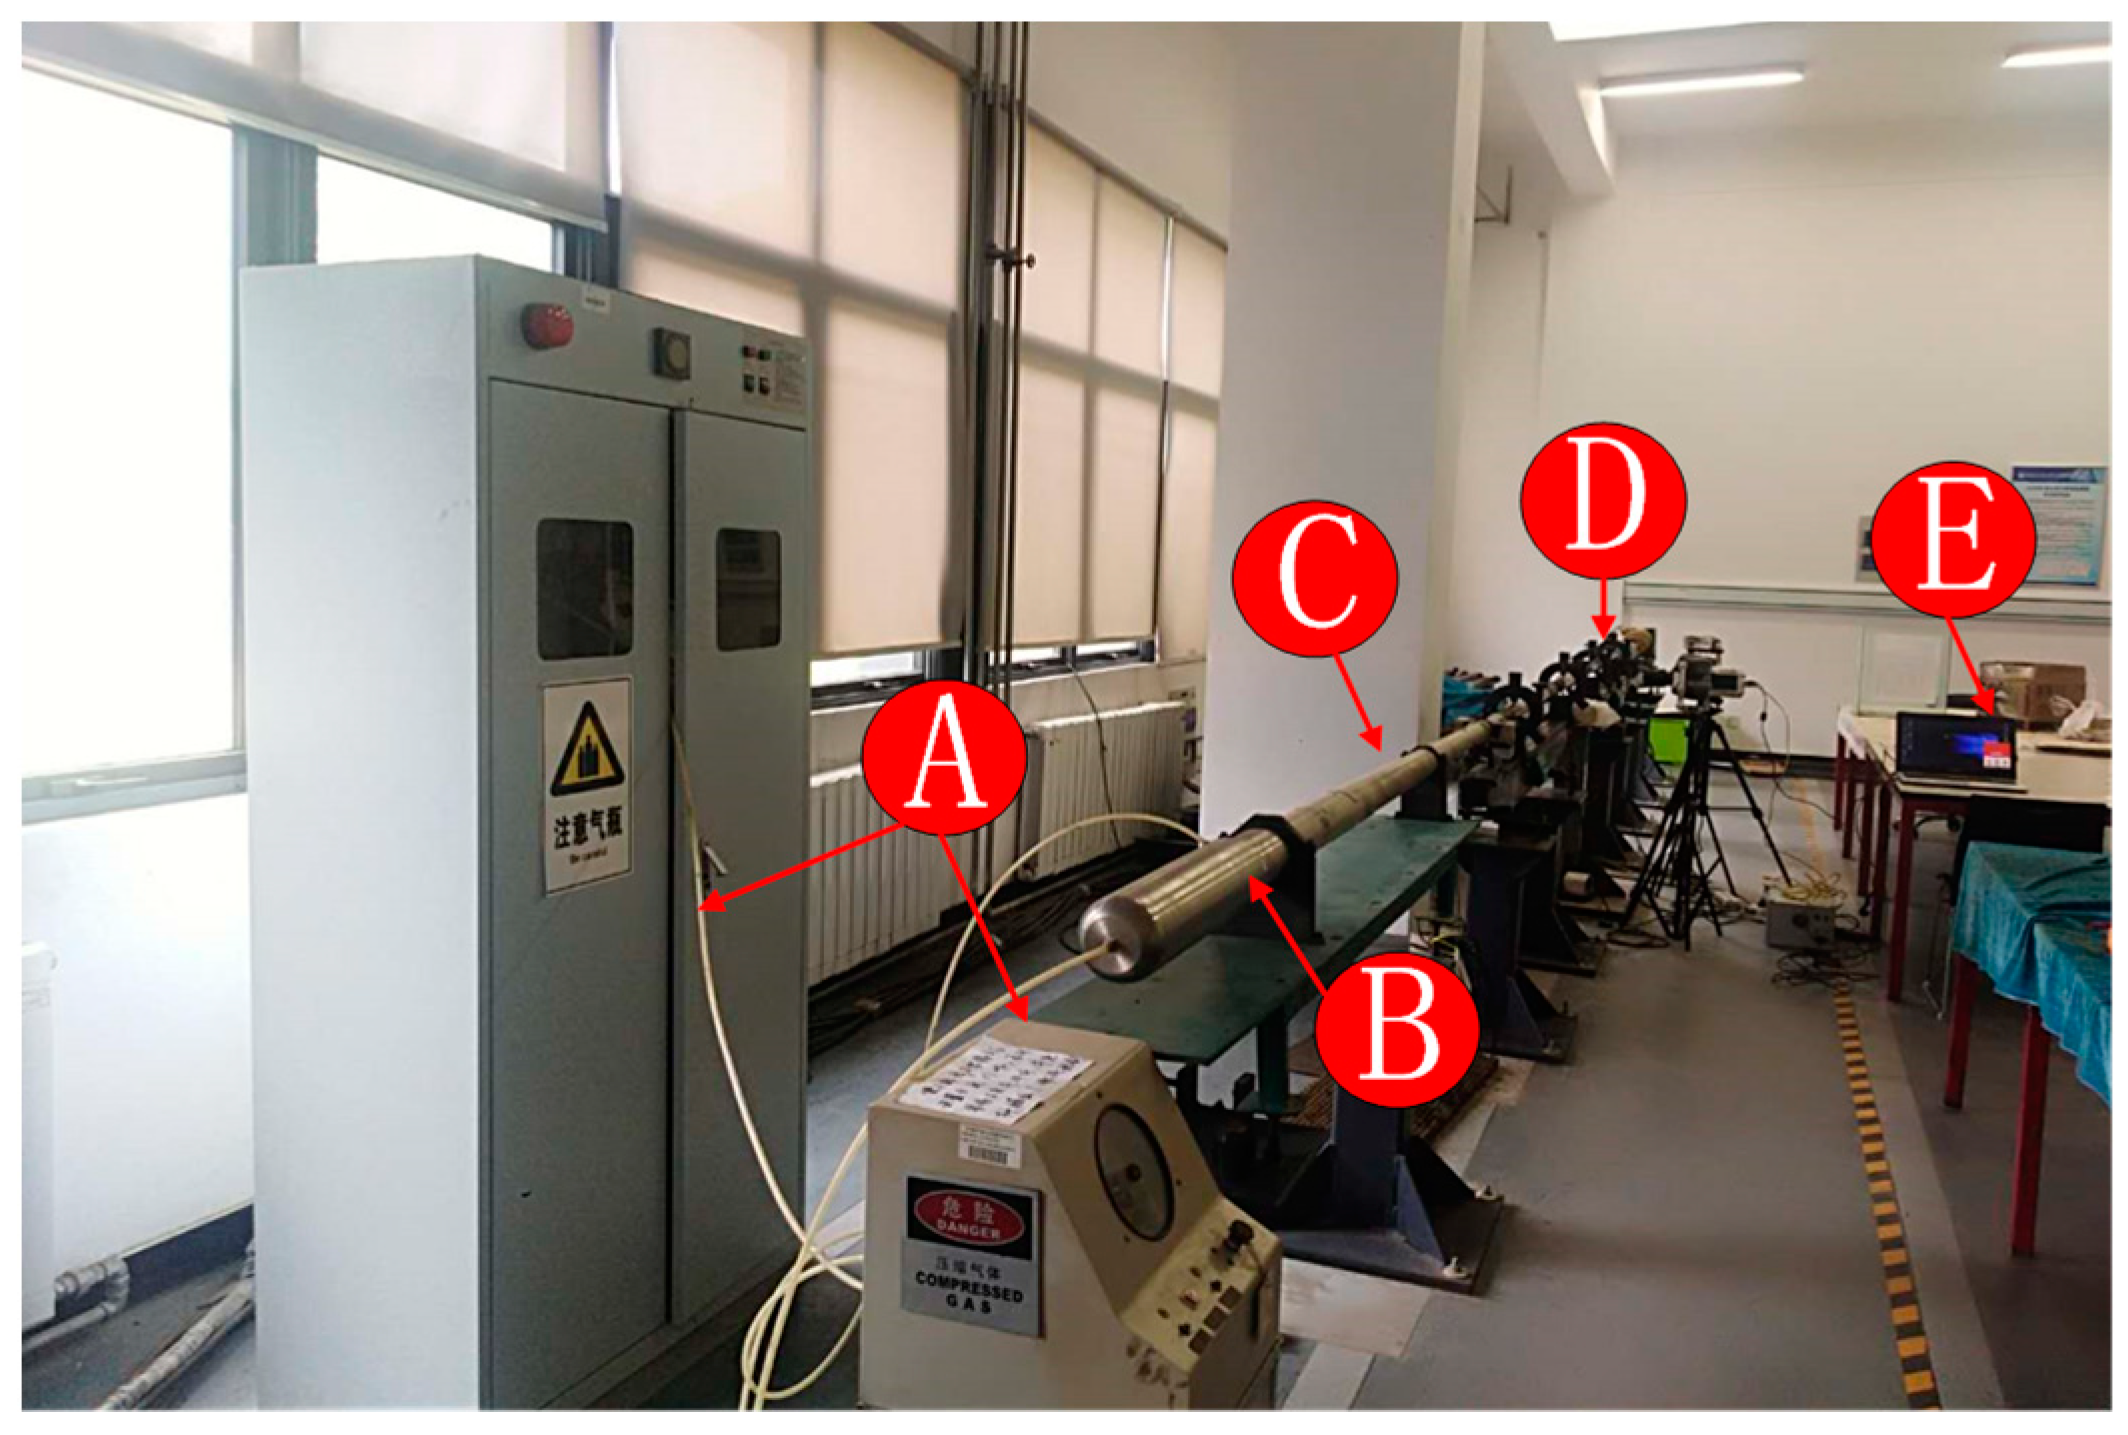
Figure 2.
Mercury injection experiment operation flow chart.
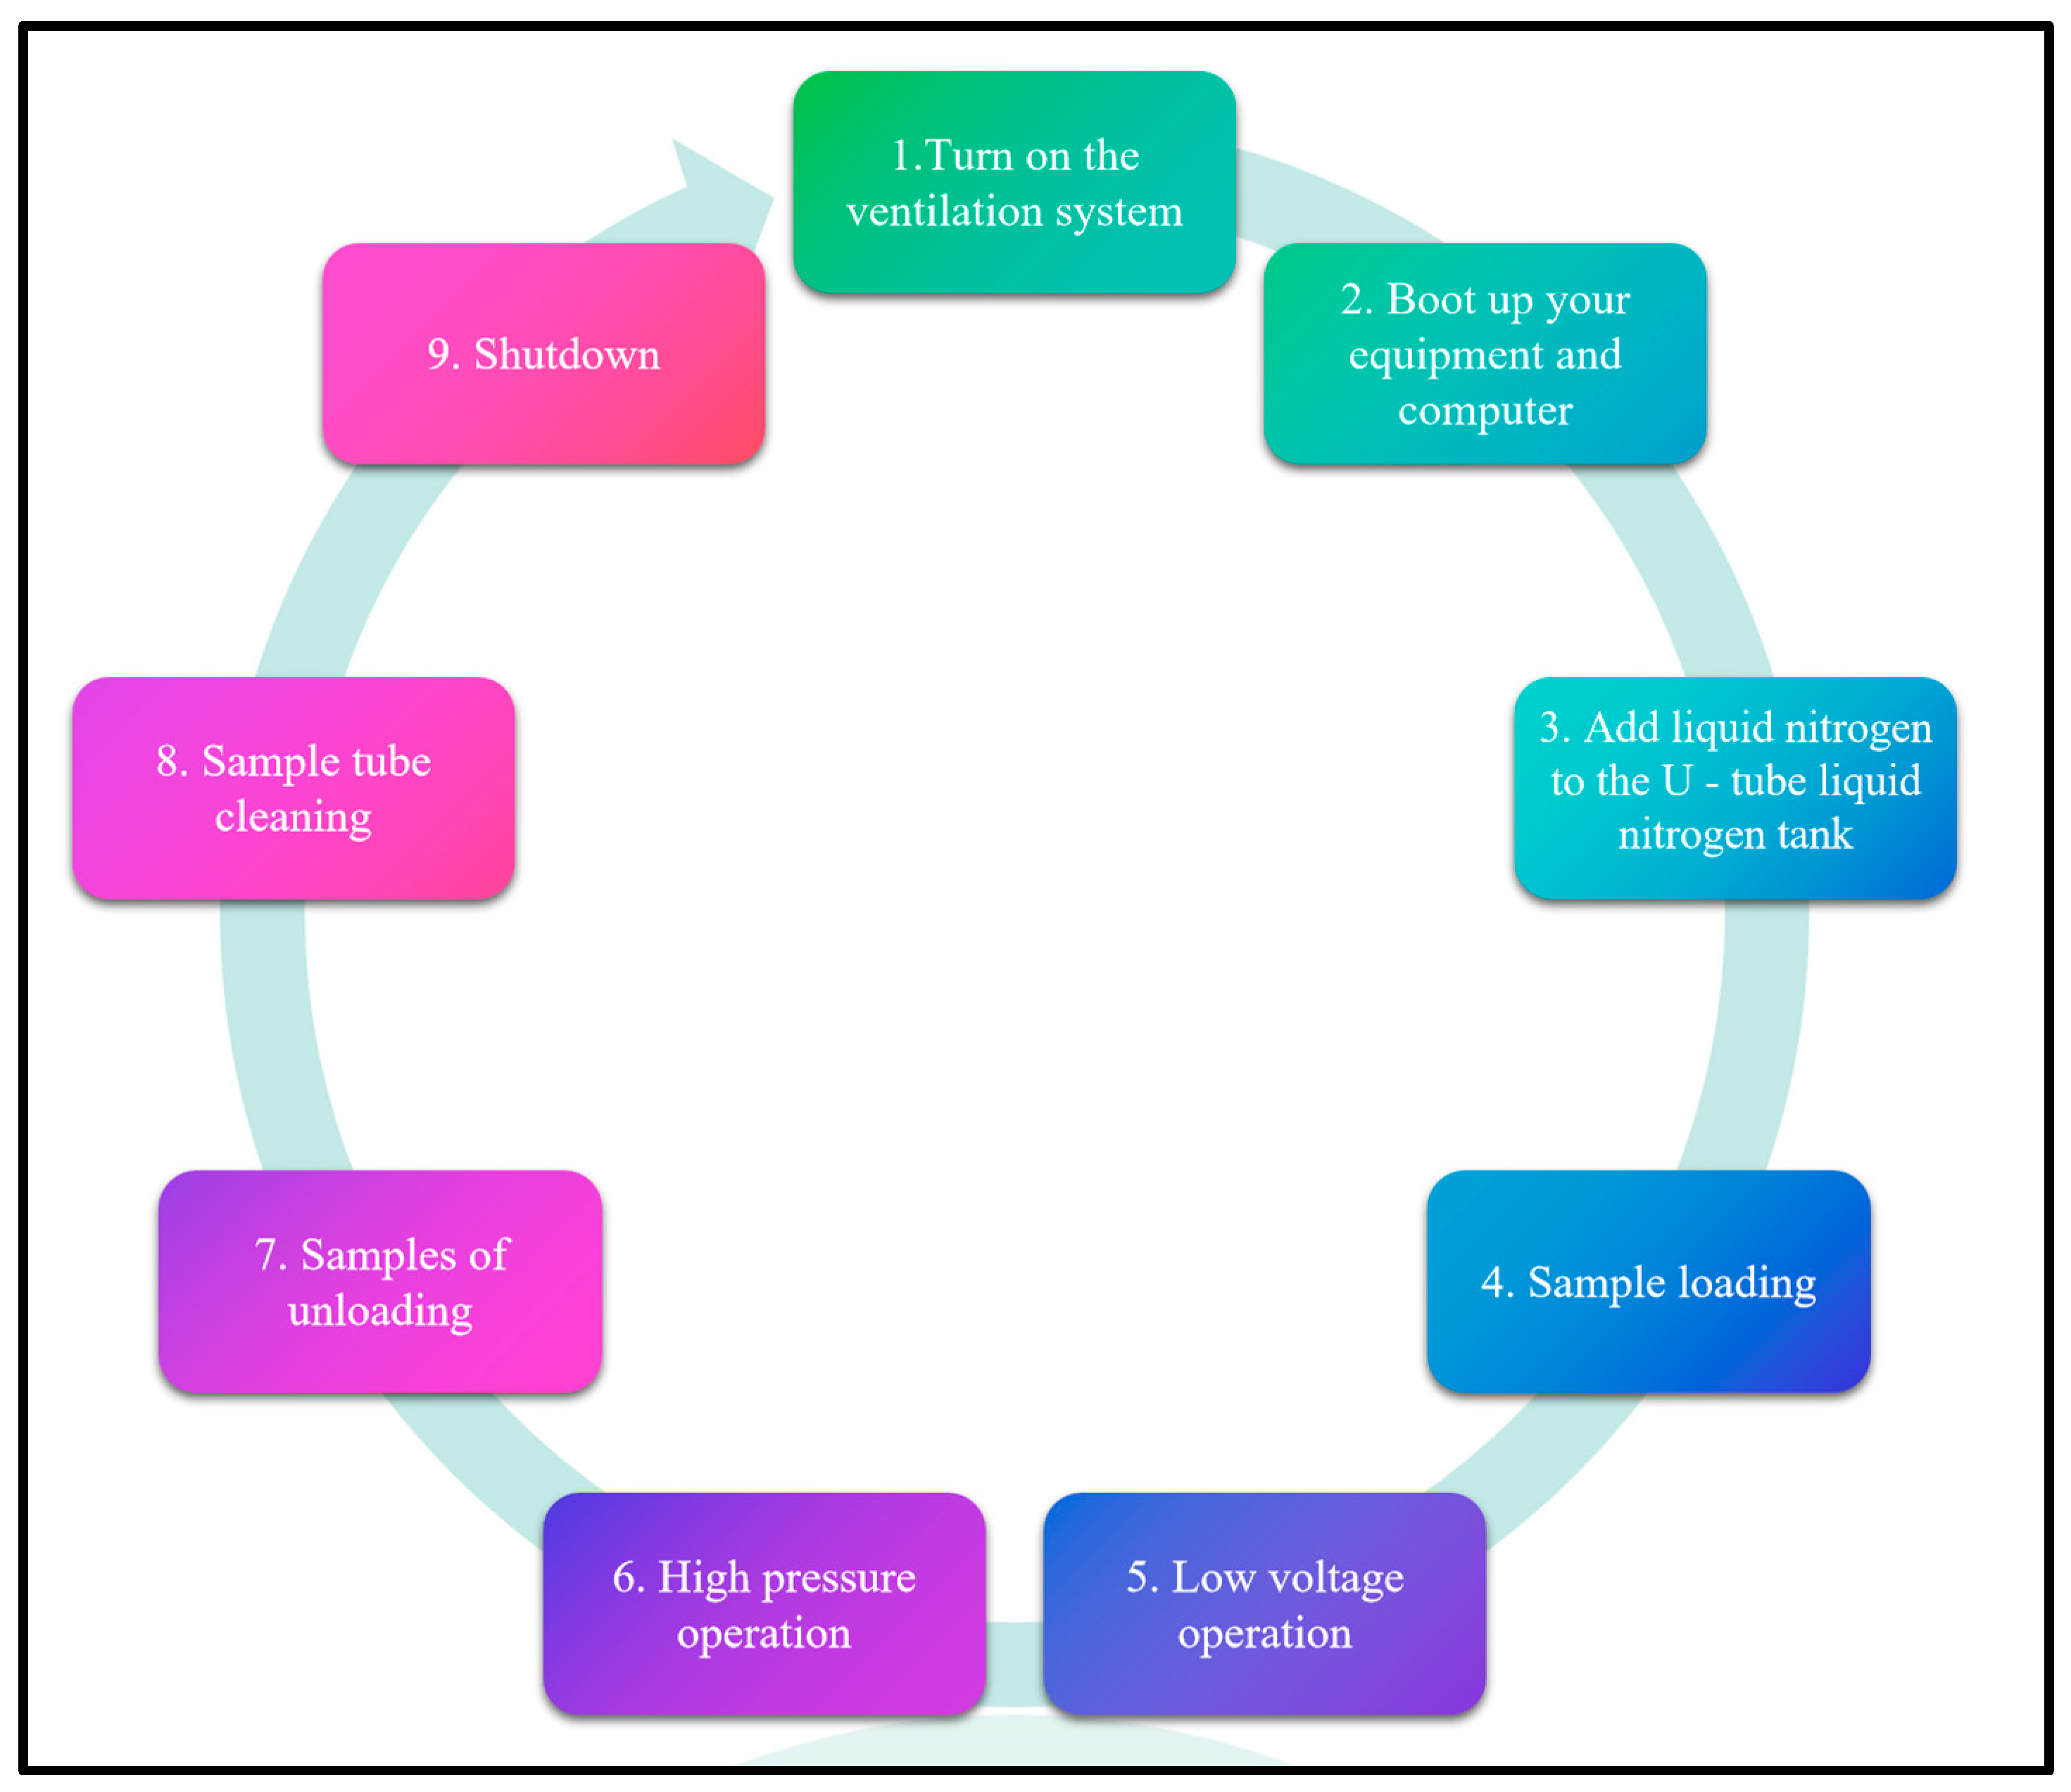
Figure 3.
Scanning electron microscope system.

Figure 4.
Samples of coal-bearing sandstone under different length–diameter ratios.
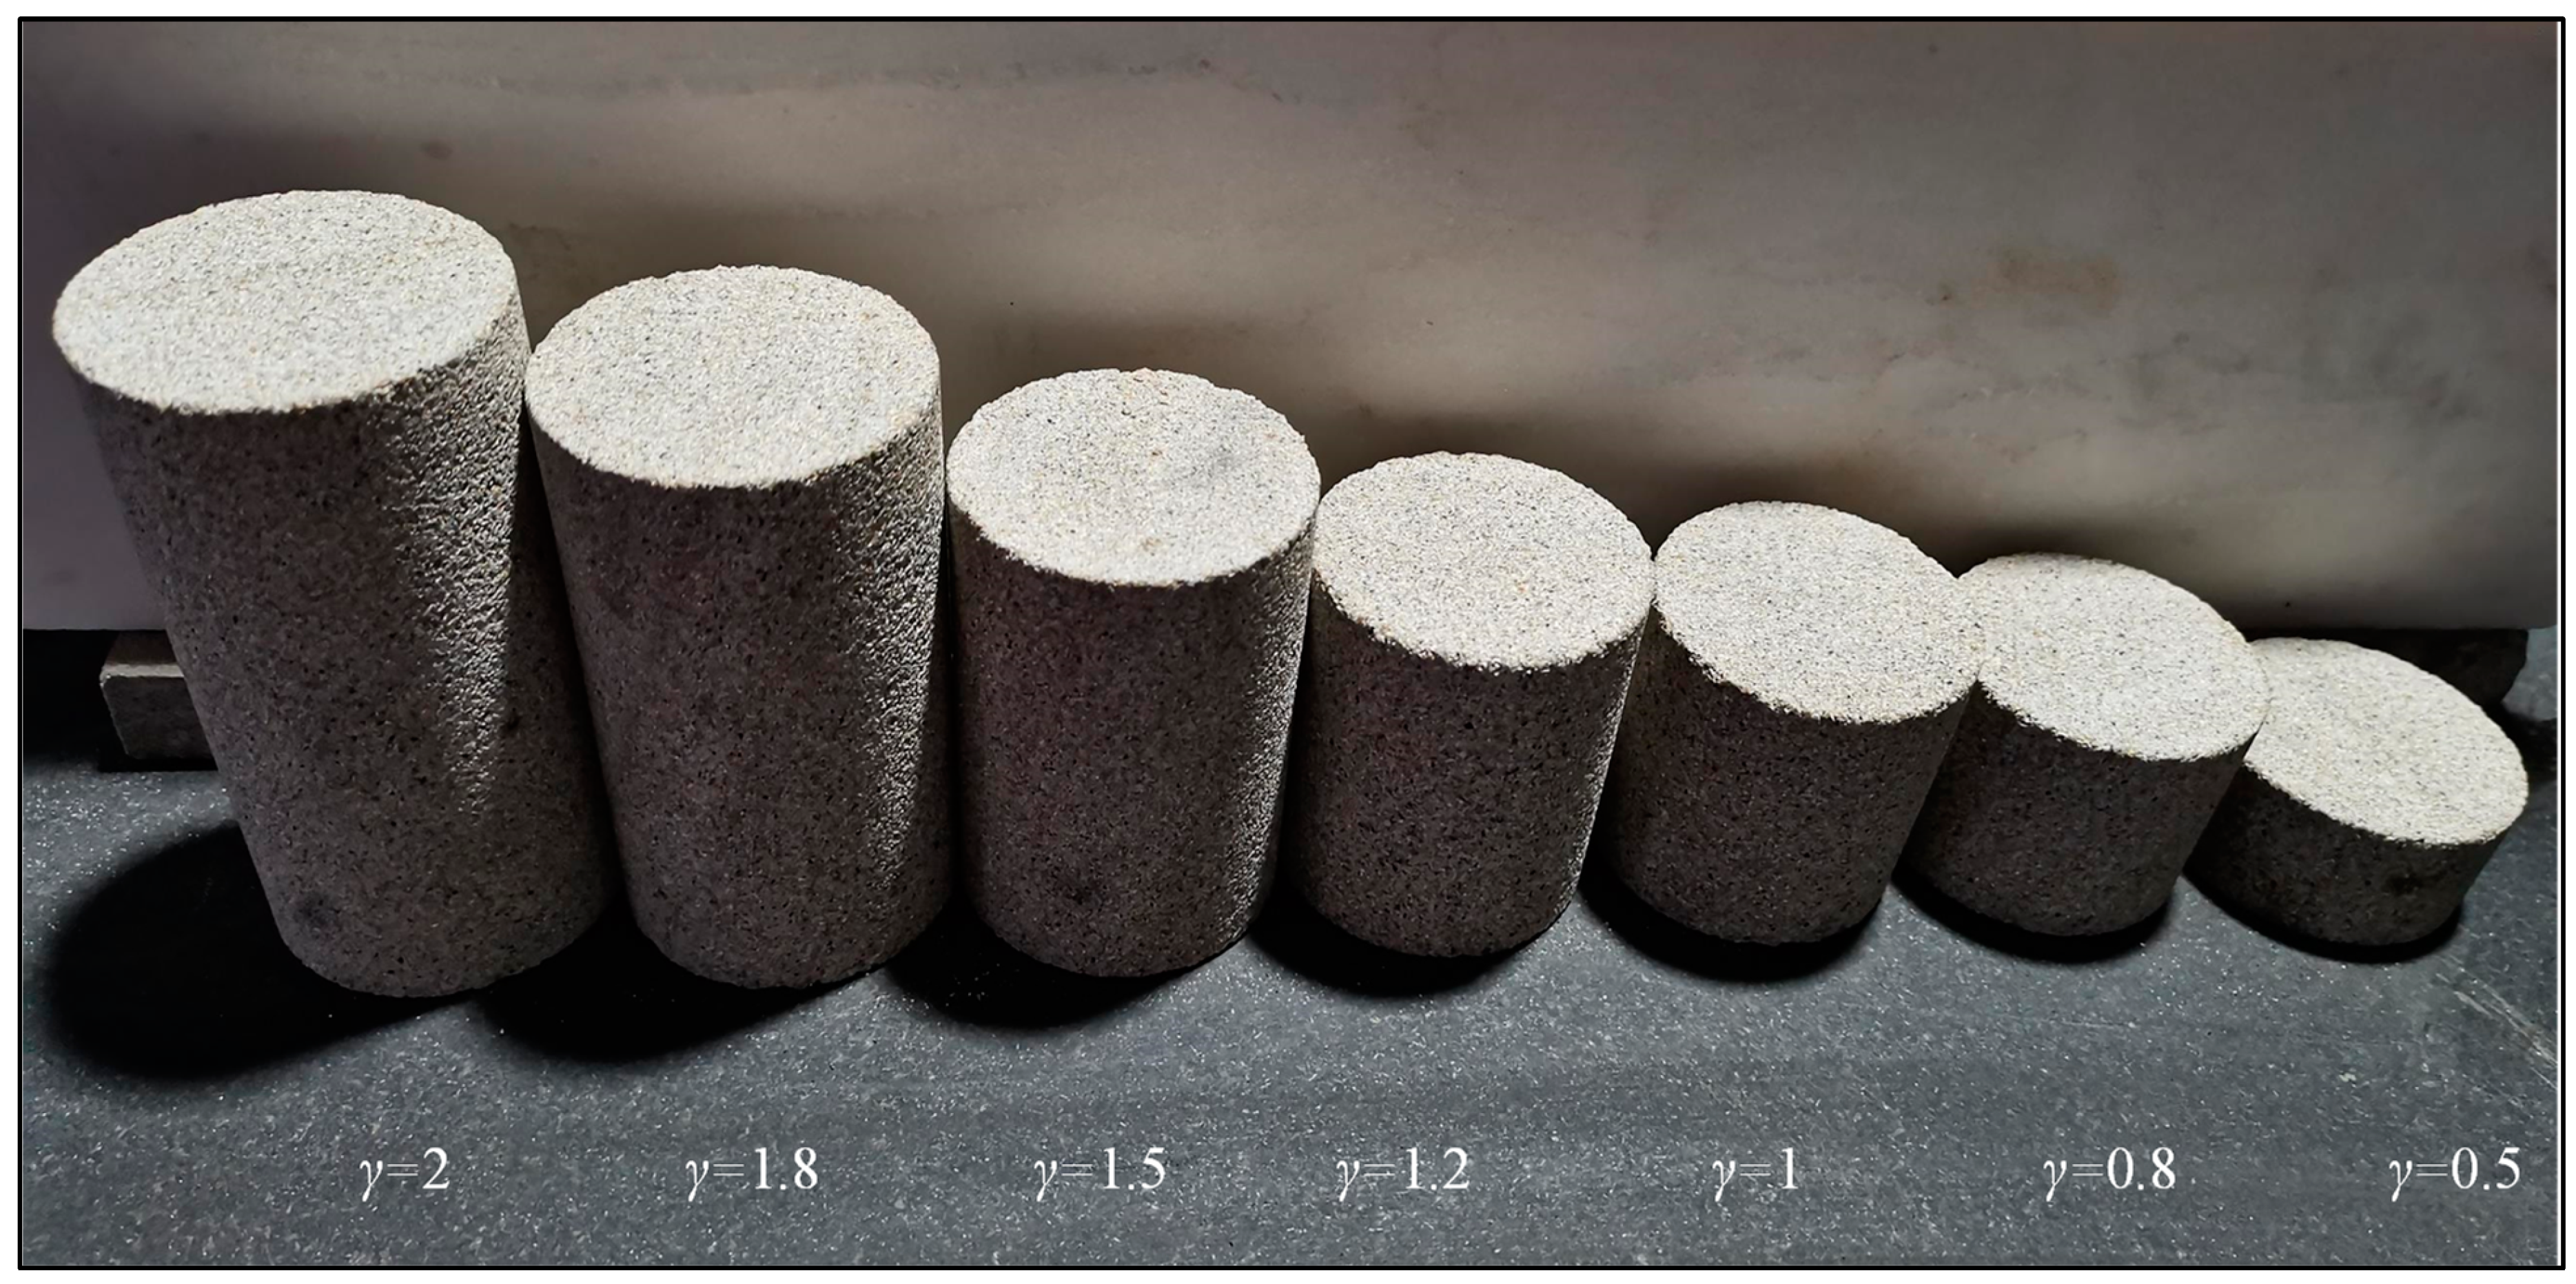
Figure 5.
The original waveform.

Figure 6.
The stress–strain curves of coal-bearing sandstones with different length–diameter ratios.
Figure 6.
The stress–strain curves of coal-bearing sandstones with different length–diameter ratios.
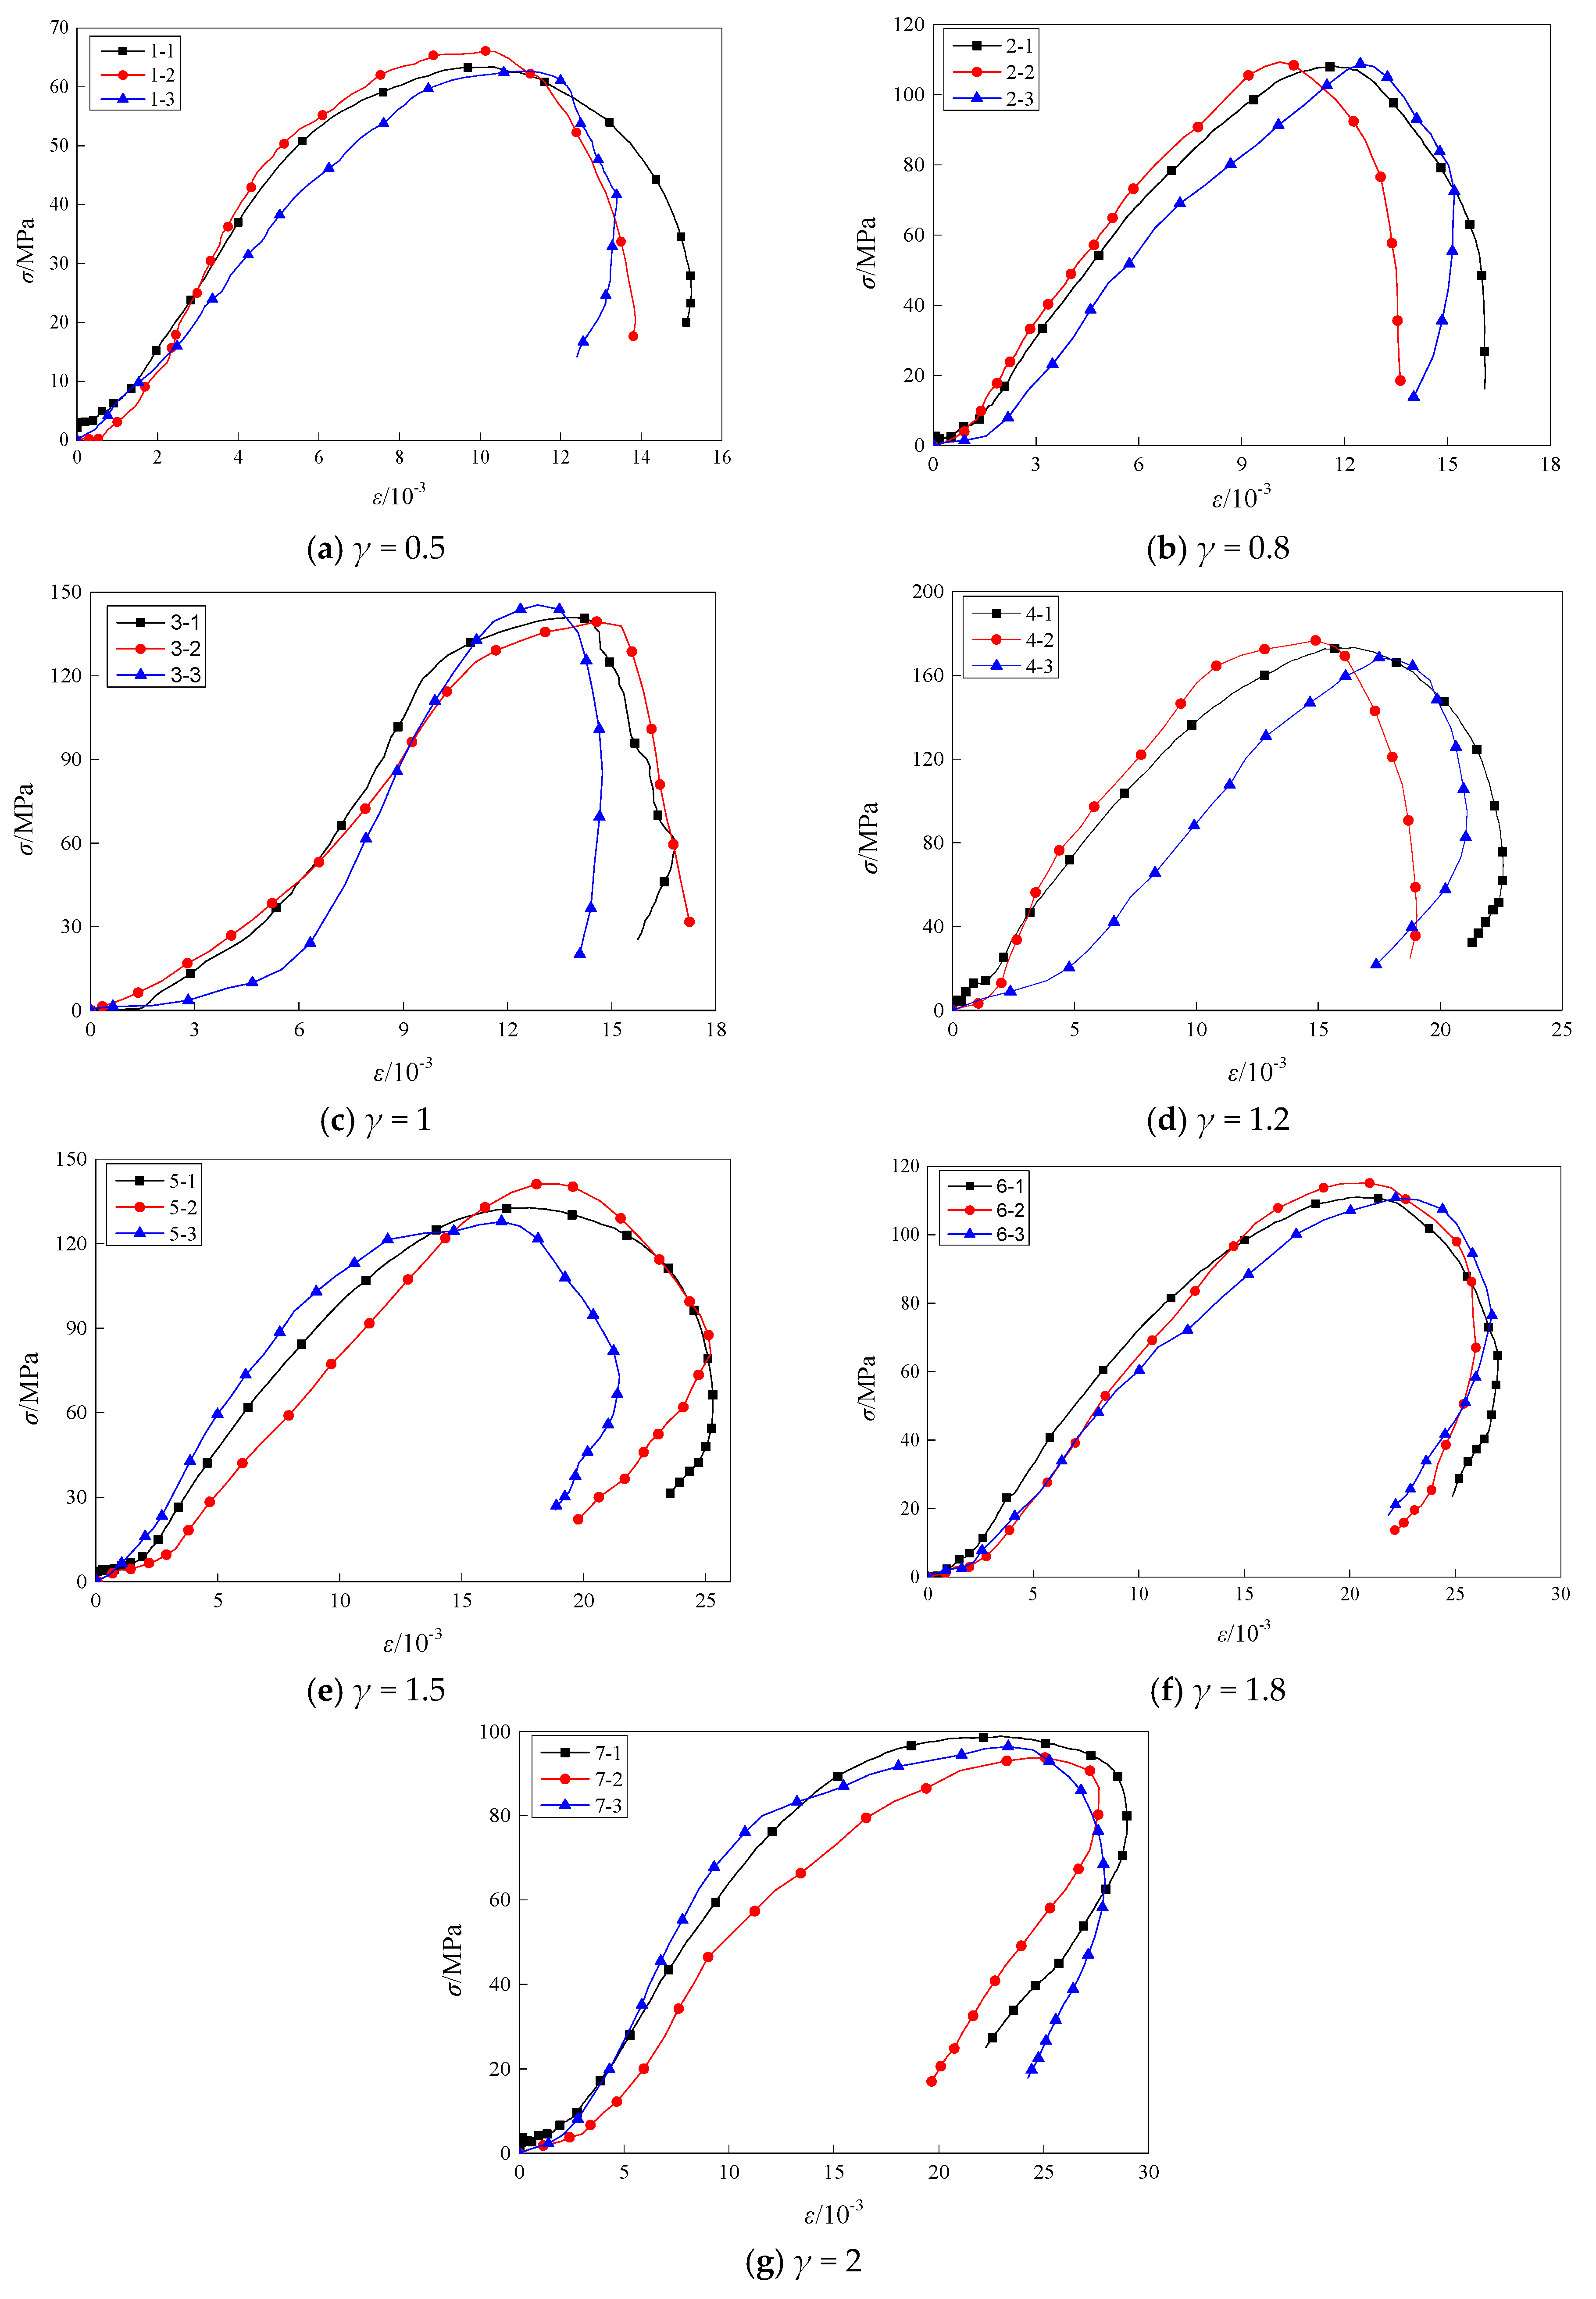
Figure 7.
Stress–strain curve of coal-bearing sandstone under impact compression test.
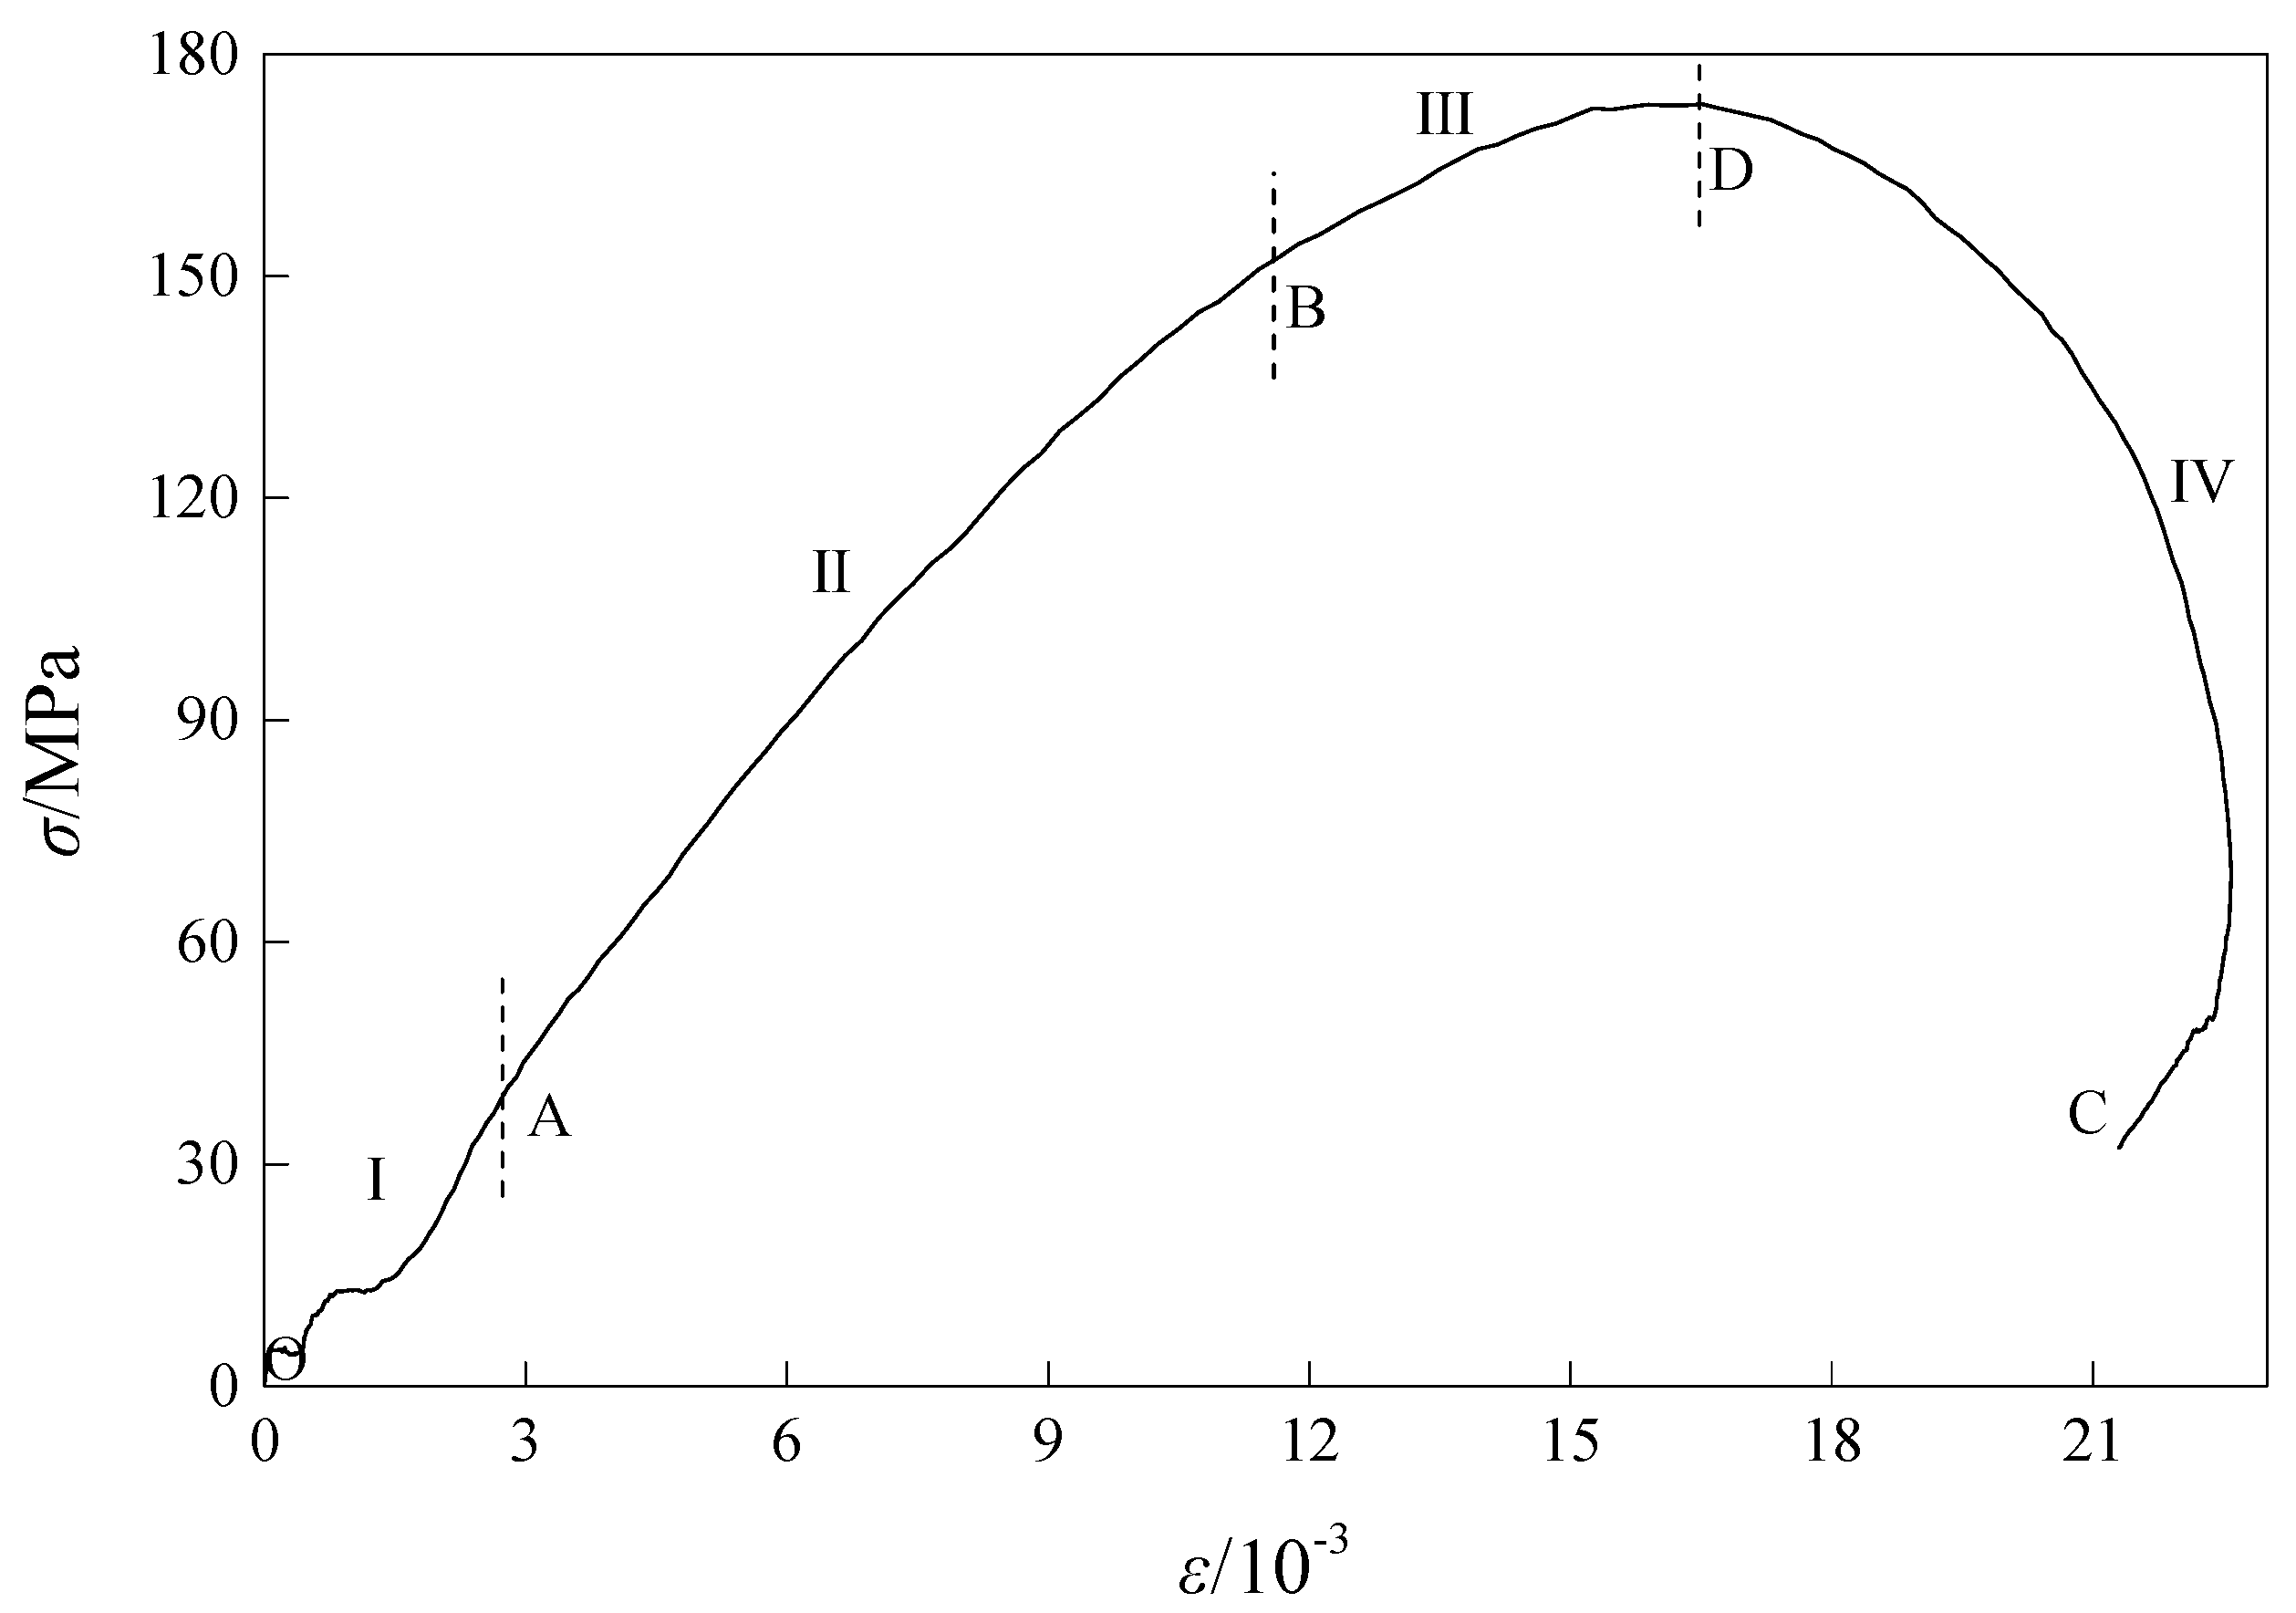
Figure 8.
Typical stress–strain curves of coal-bearing s–ndstones with different length–diameter ratios under impact compression test.
Figure 8.
Typical stress–strain curves of coal-bearing s–ndstones with different length–diameter ratios under impact compression test.
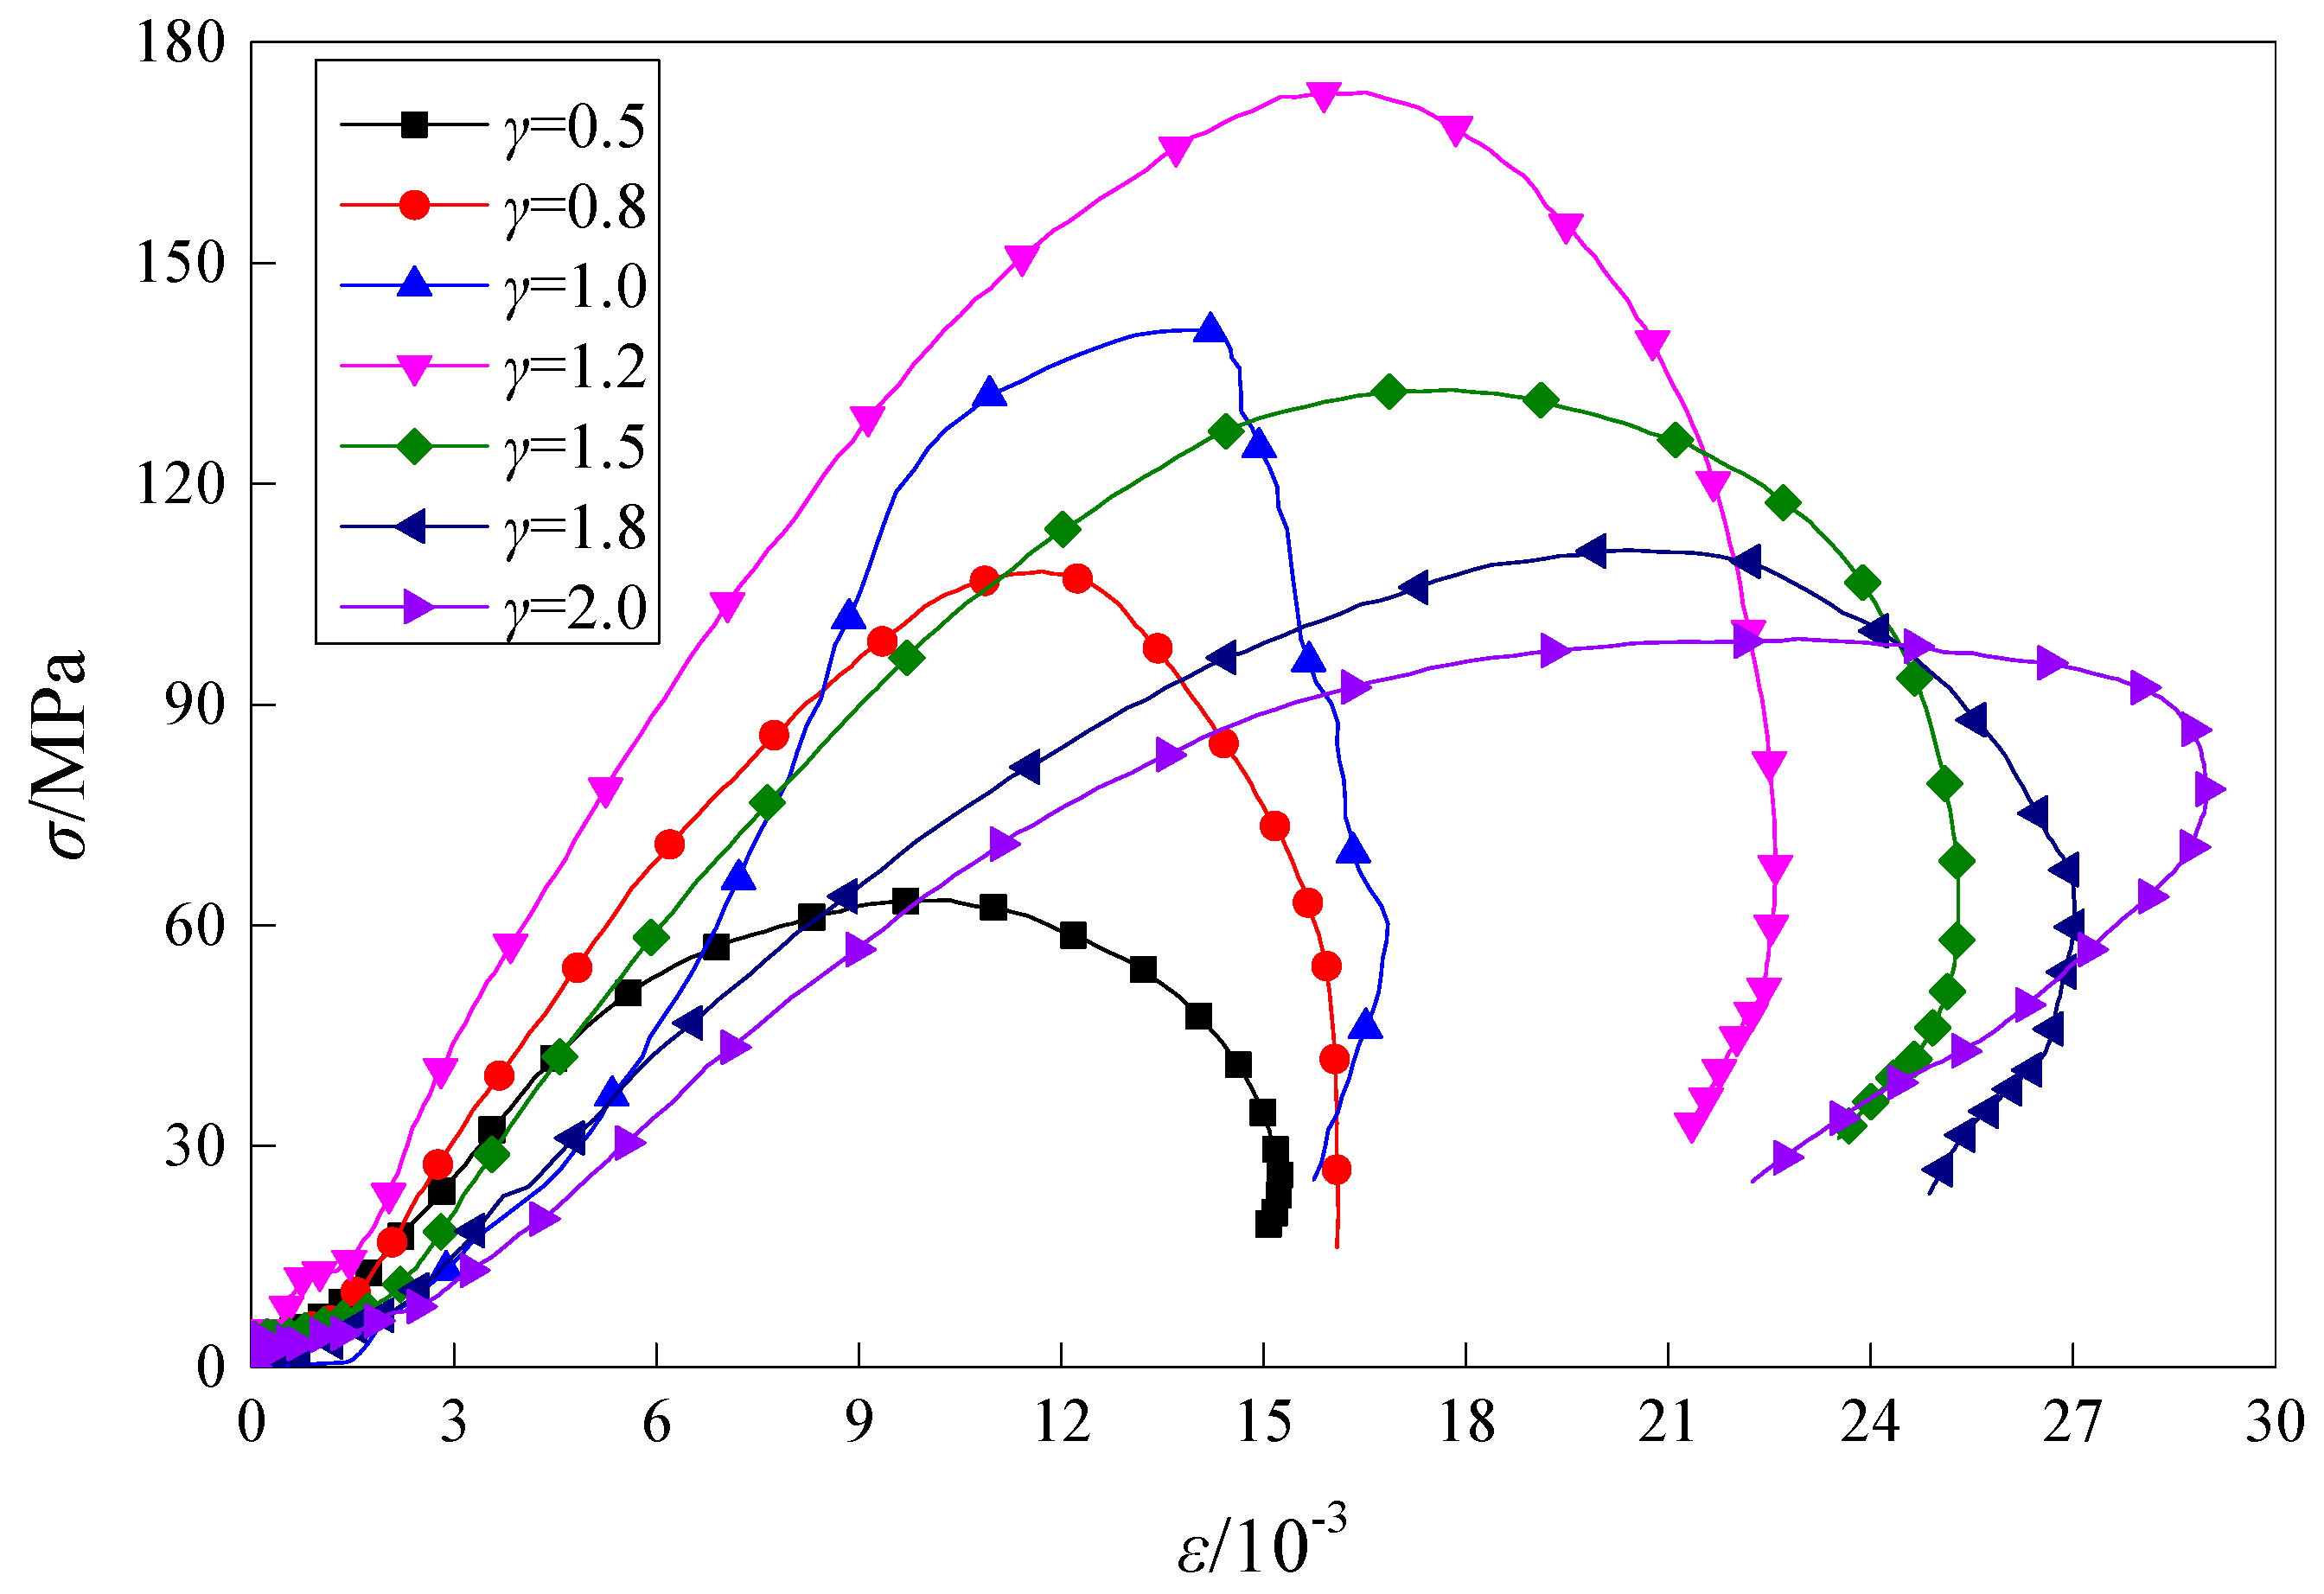
Figure 9.
Variation in peak strength of coal-bearing sandstone with length–diameter ratio under impact compression test.
Figure 9.
Variation in peak strength of coal-bearing sandstone with length–diameter ratio under impact compression test.

Figure 10.
Variation in peak strain of coal-bearing sandstone with length–diameter ratio under impact compression test.
Figure 10.
Variation in peak strain of coal-bearing sandstone with length–diameter ratio under impact compression test.
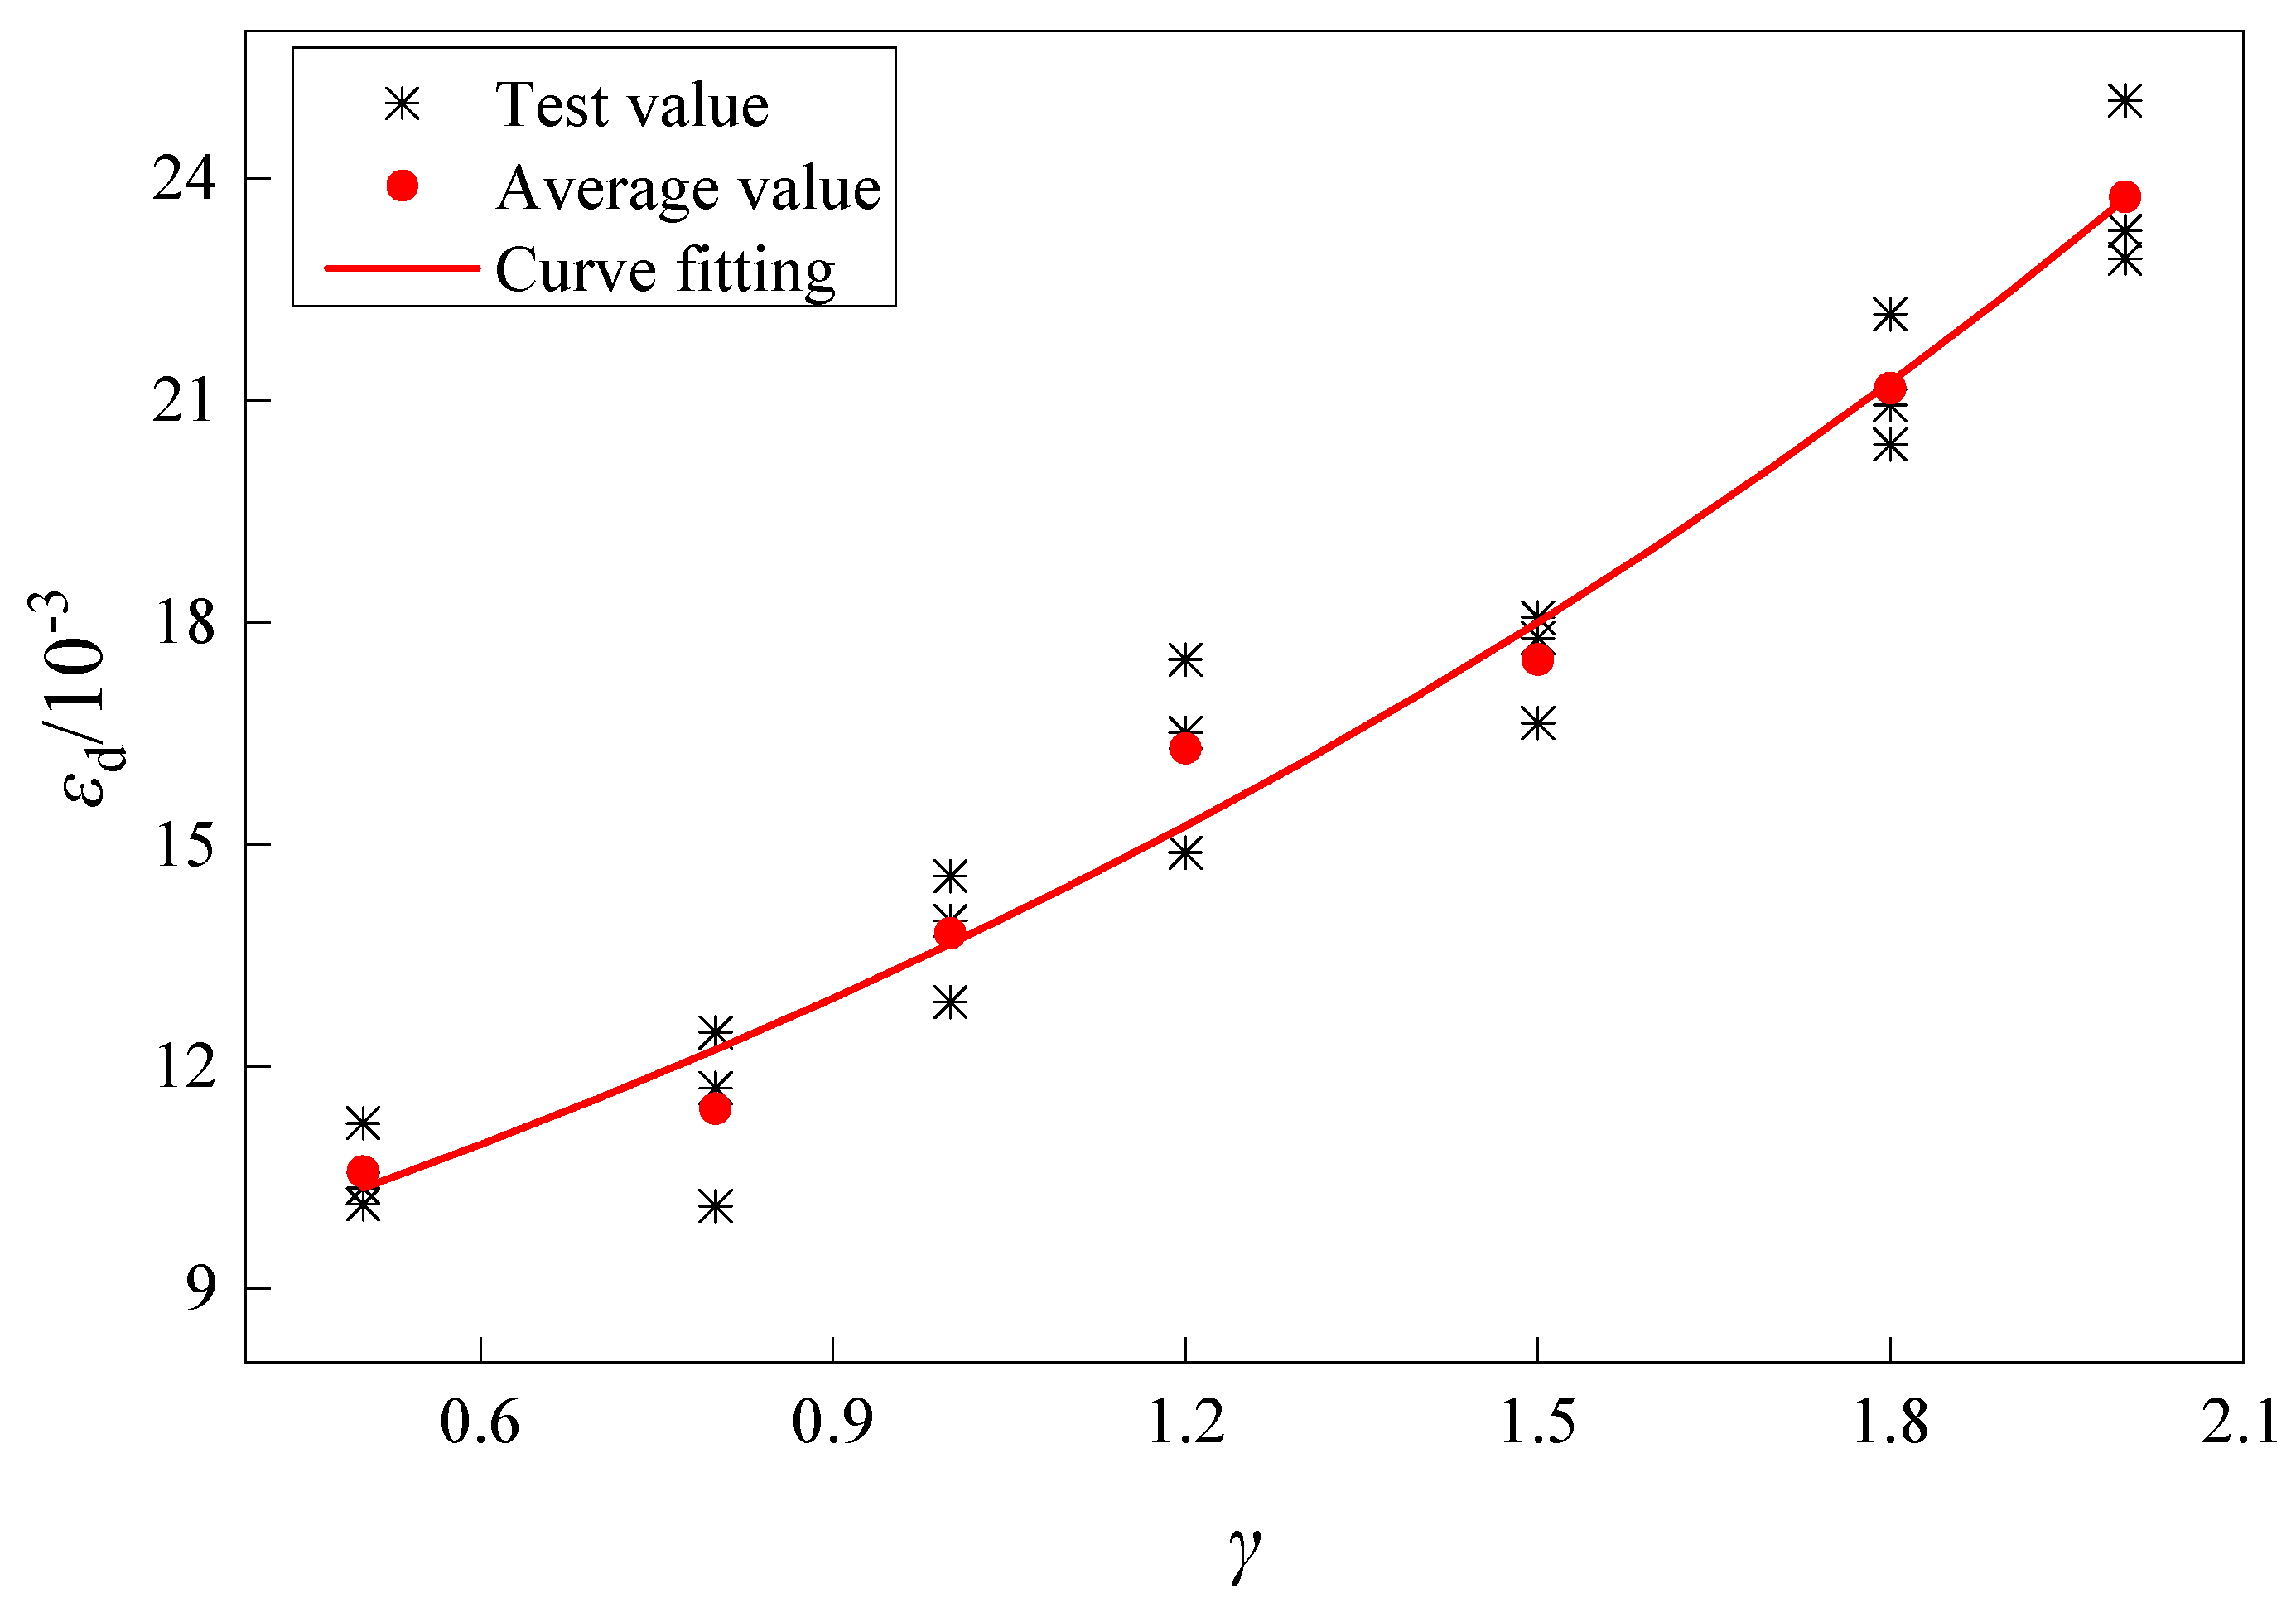
Figure 11.
Variation in dynamic elastic modulus of coal-bearing sandstone with length–diameter ratio under impact compression test.
Figure 11.
Variation in dynamic elastic modulus of coal-bearing sandstone with length–diameter ratio under impact compression test.
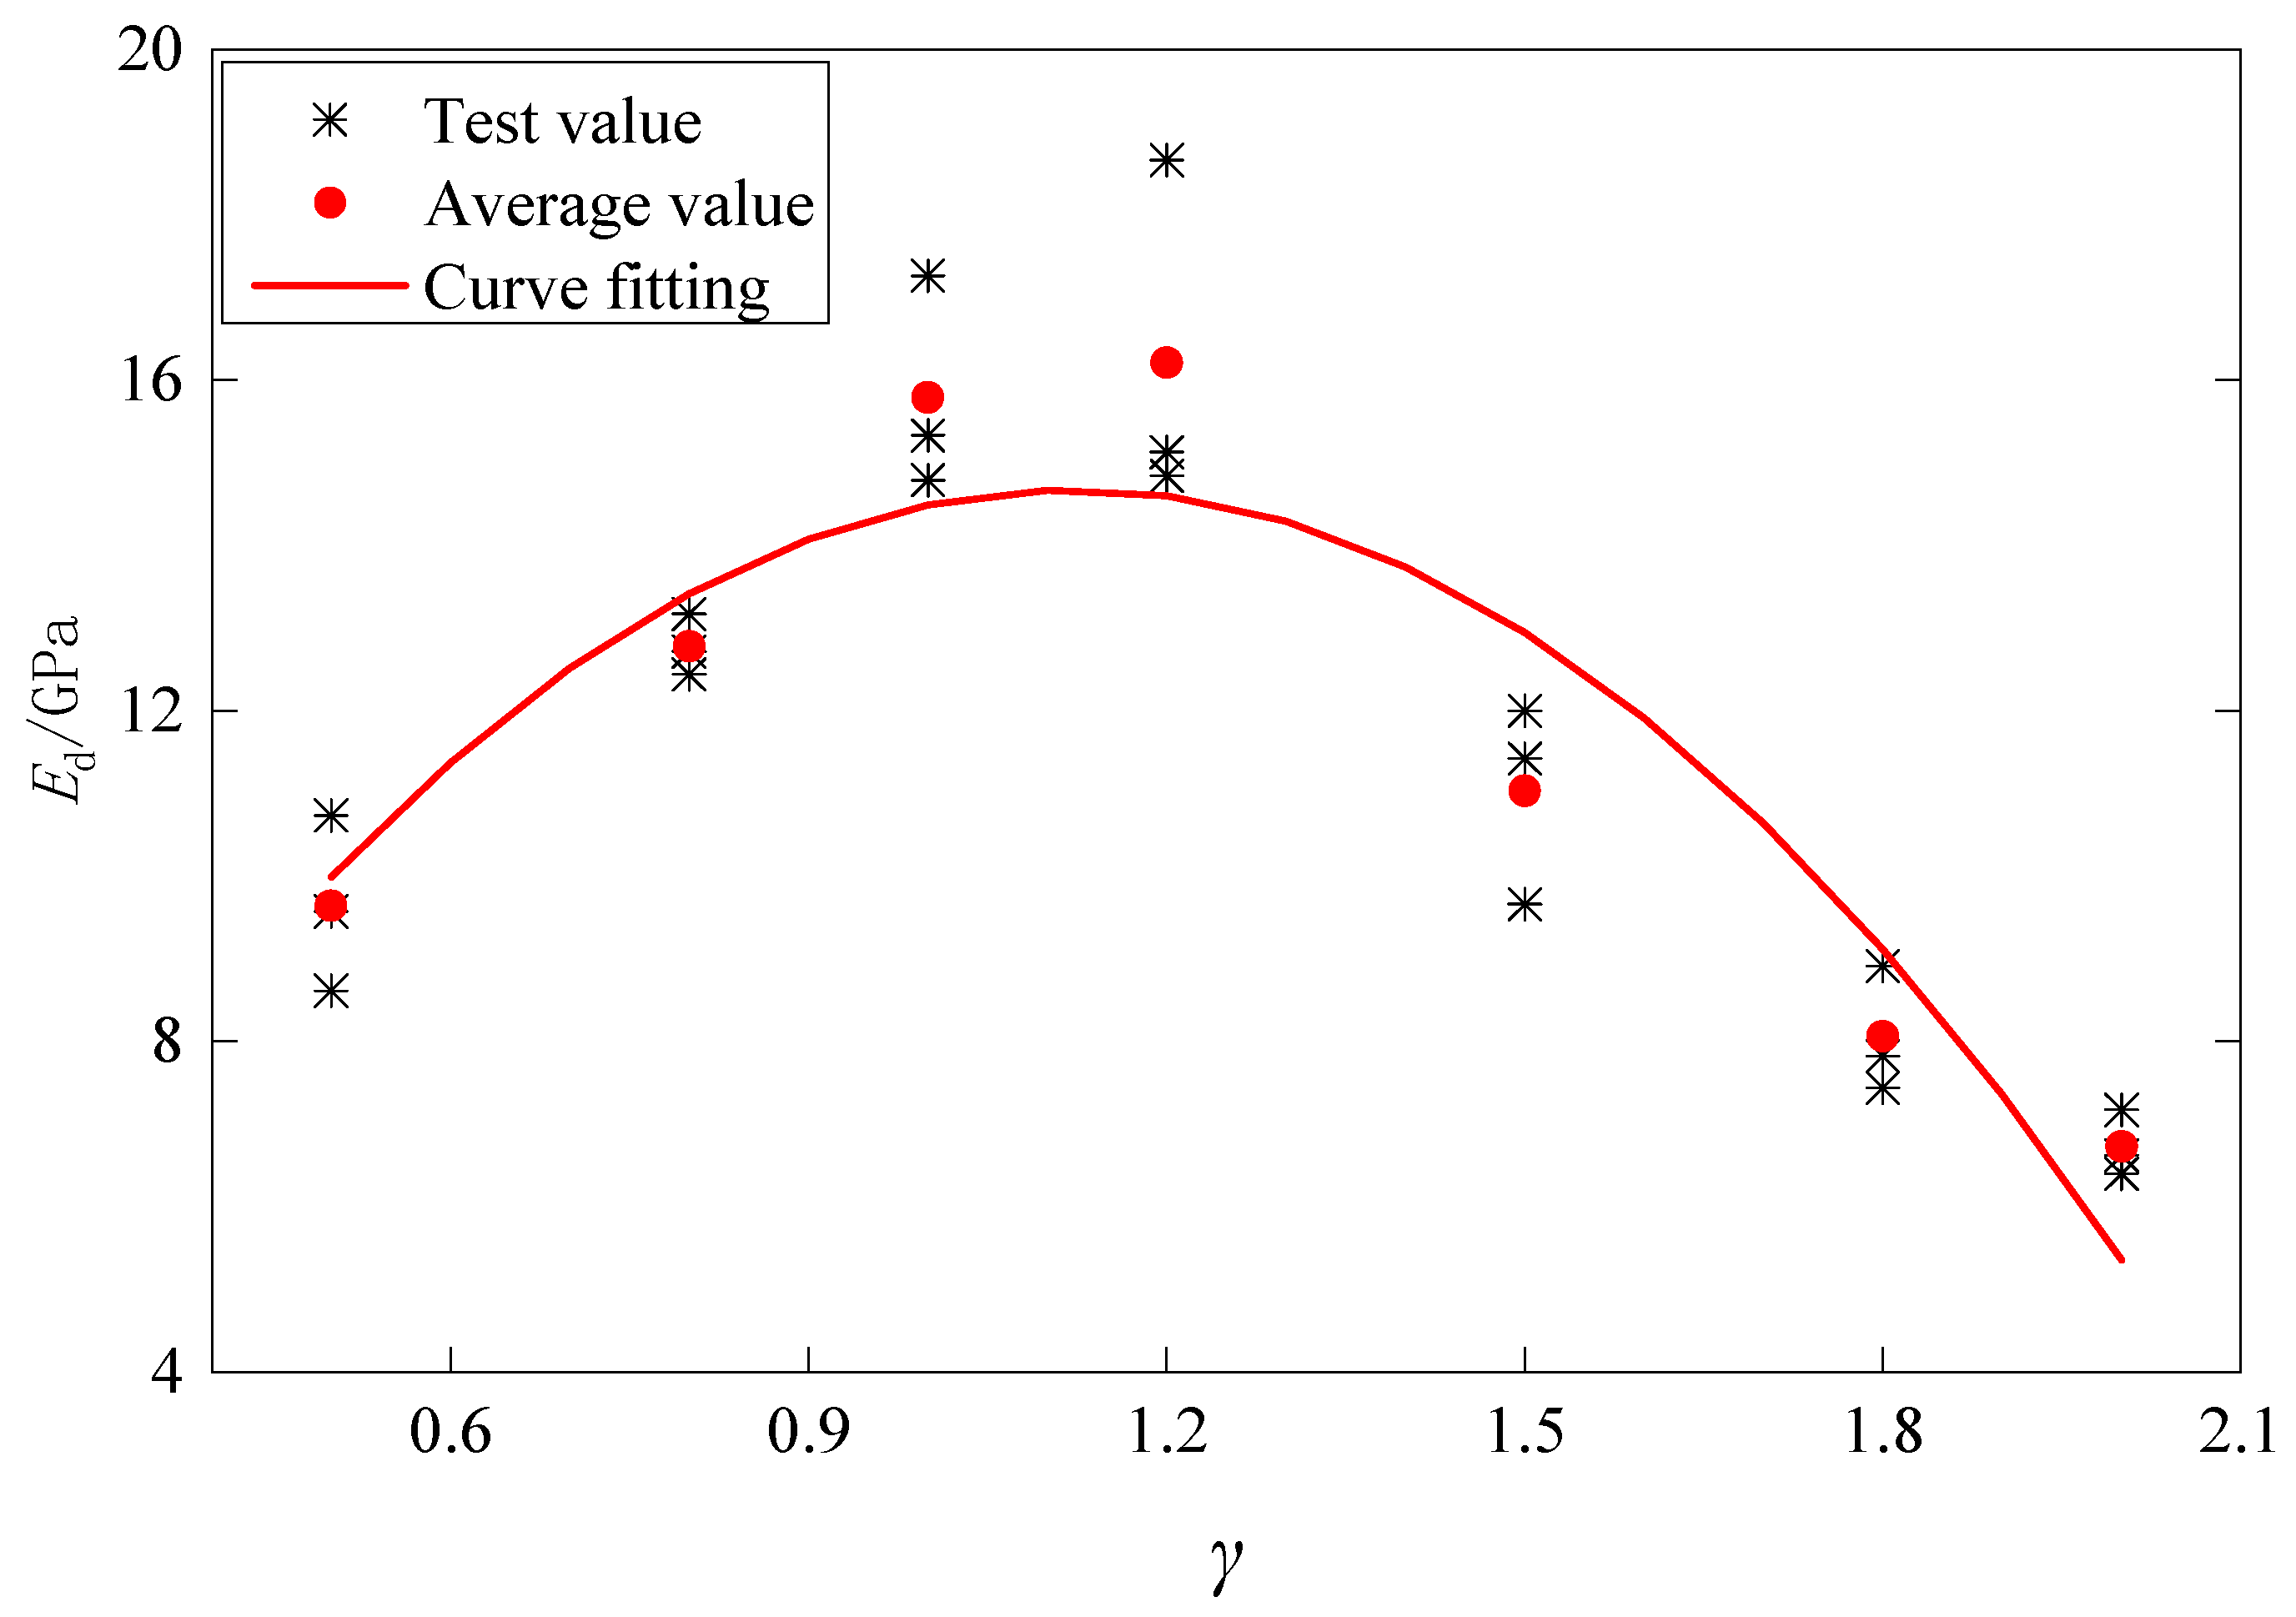
Figure 12.
The quantity–value relationship between energy dissipation and releasable strain energy in a rock mass element.
Figure 12.
The quantity–value relationship between energy dissipation and releasable strain energy in a rock mass element.
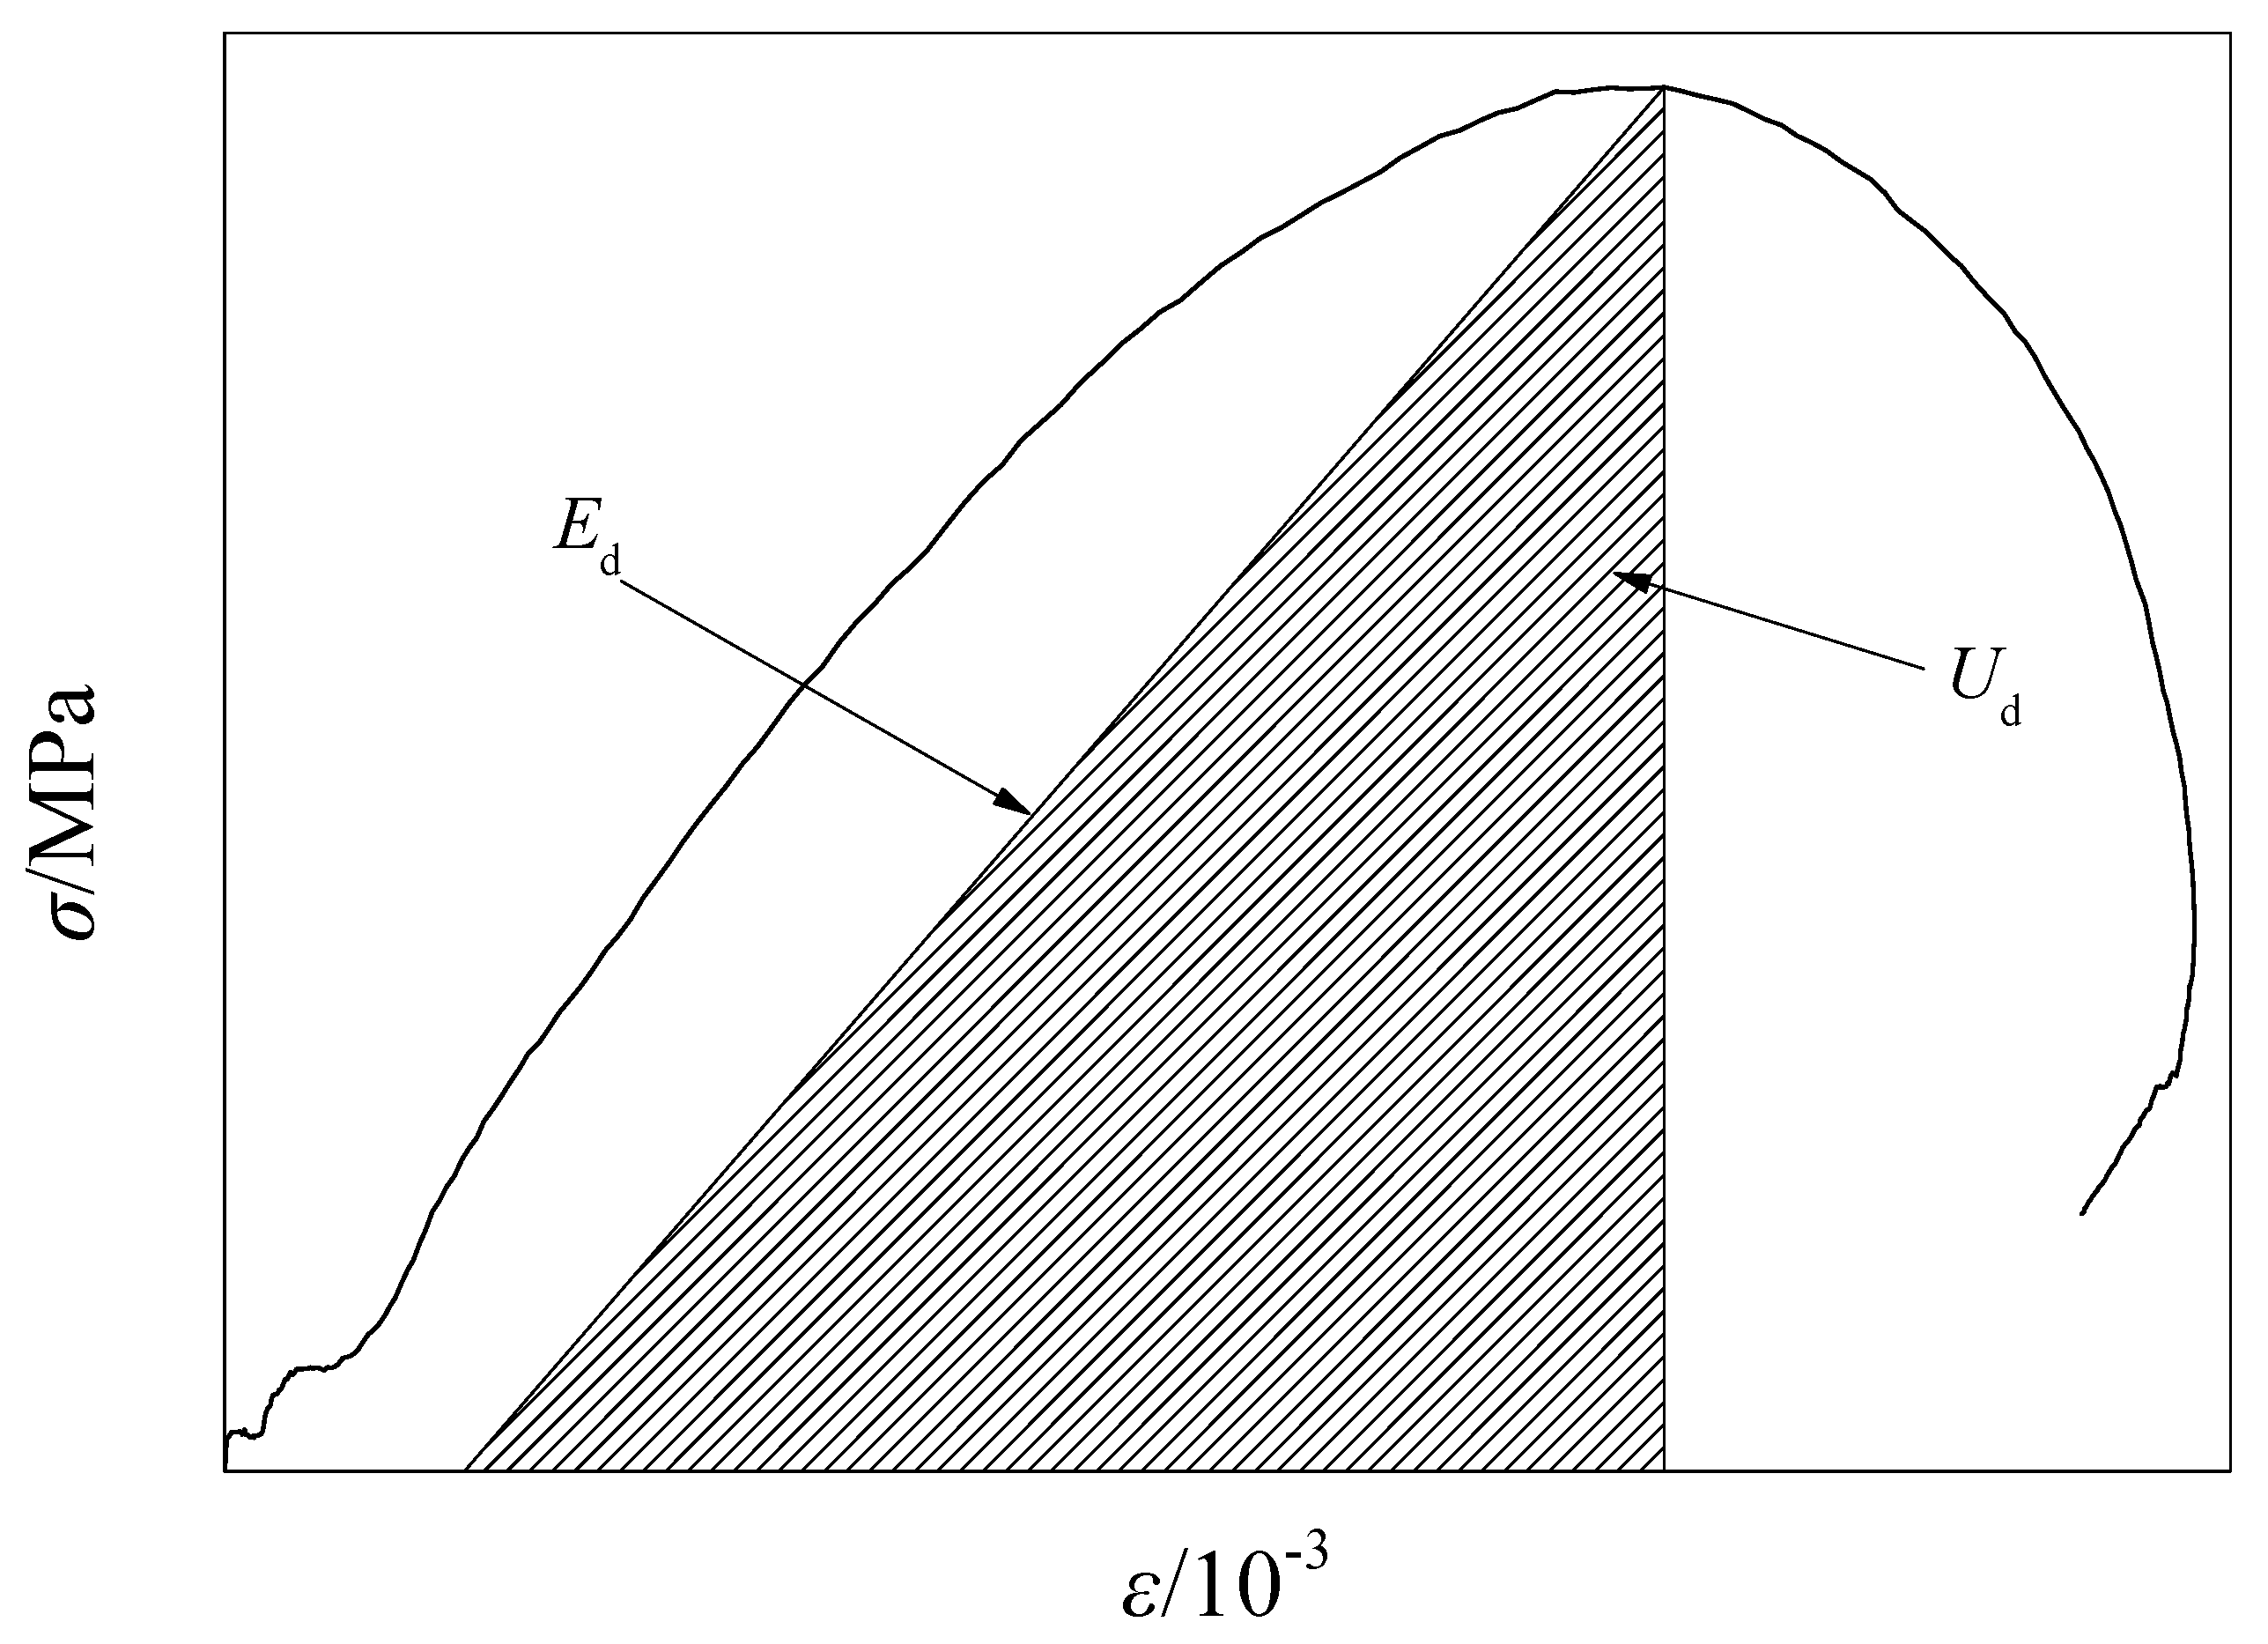
Figure 13.
Energy variation curve of coal-bearing sandstone with length–diameter ratio.
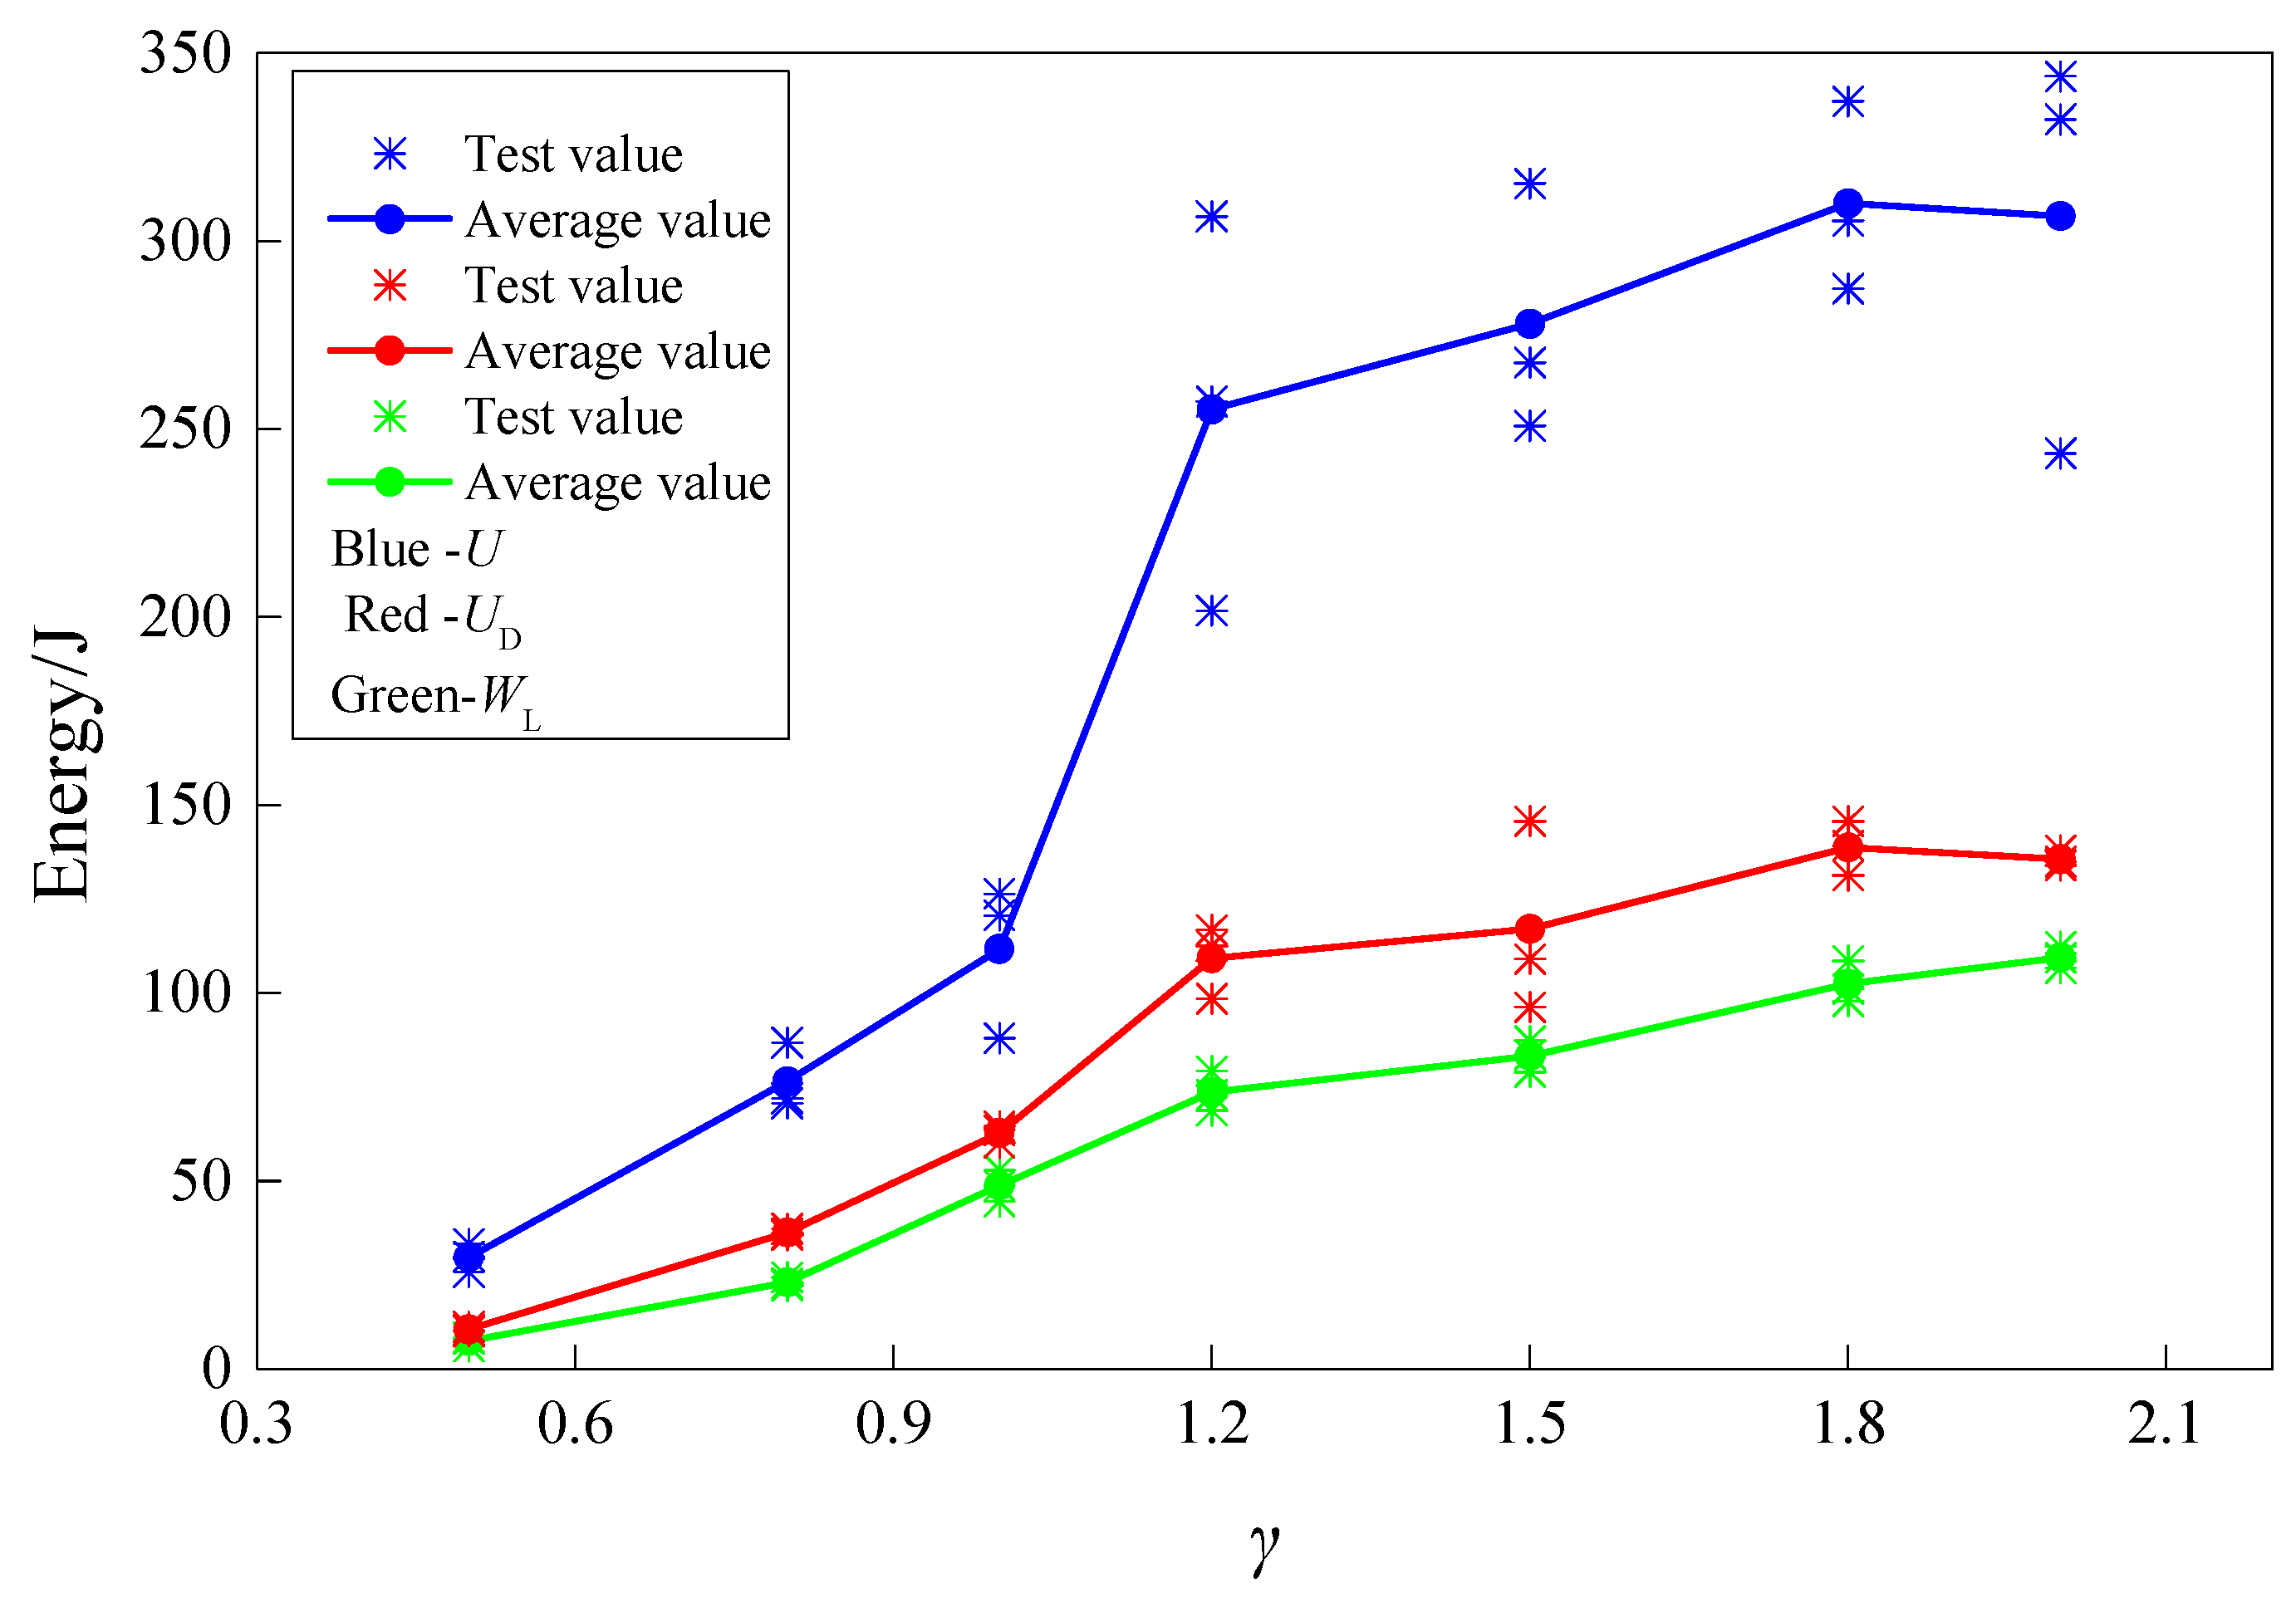
Figure 14.
Variation in porosity of coal-bearing sandstone under different length–diameter ratios.
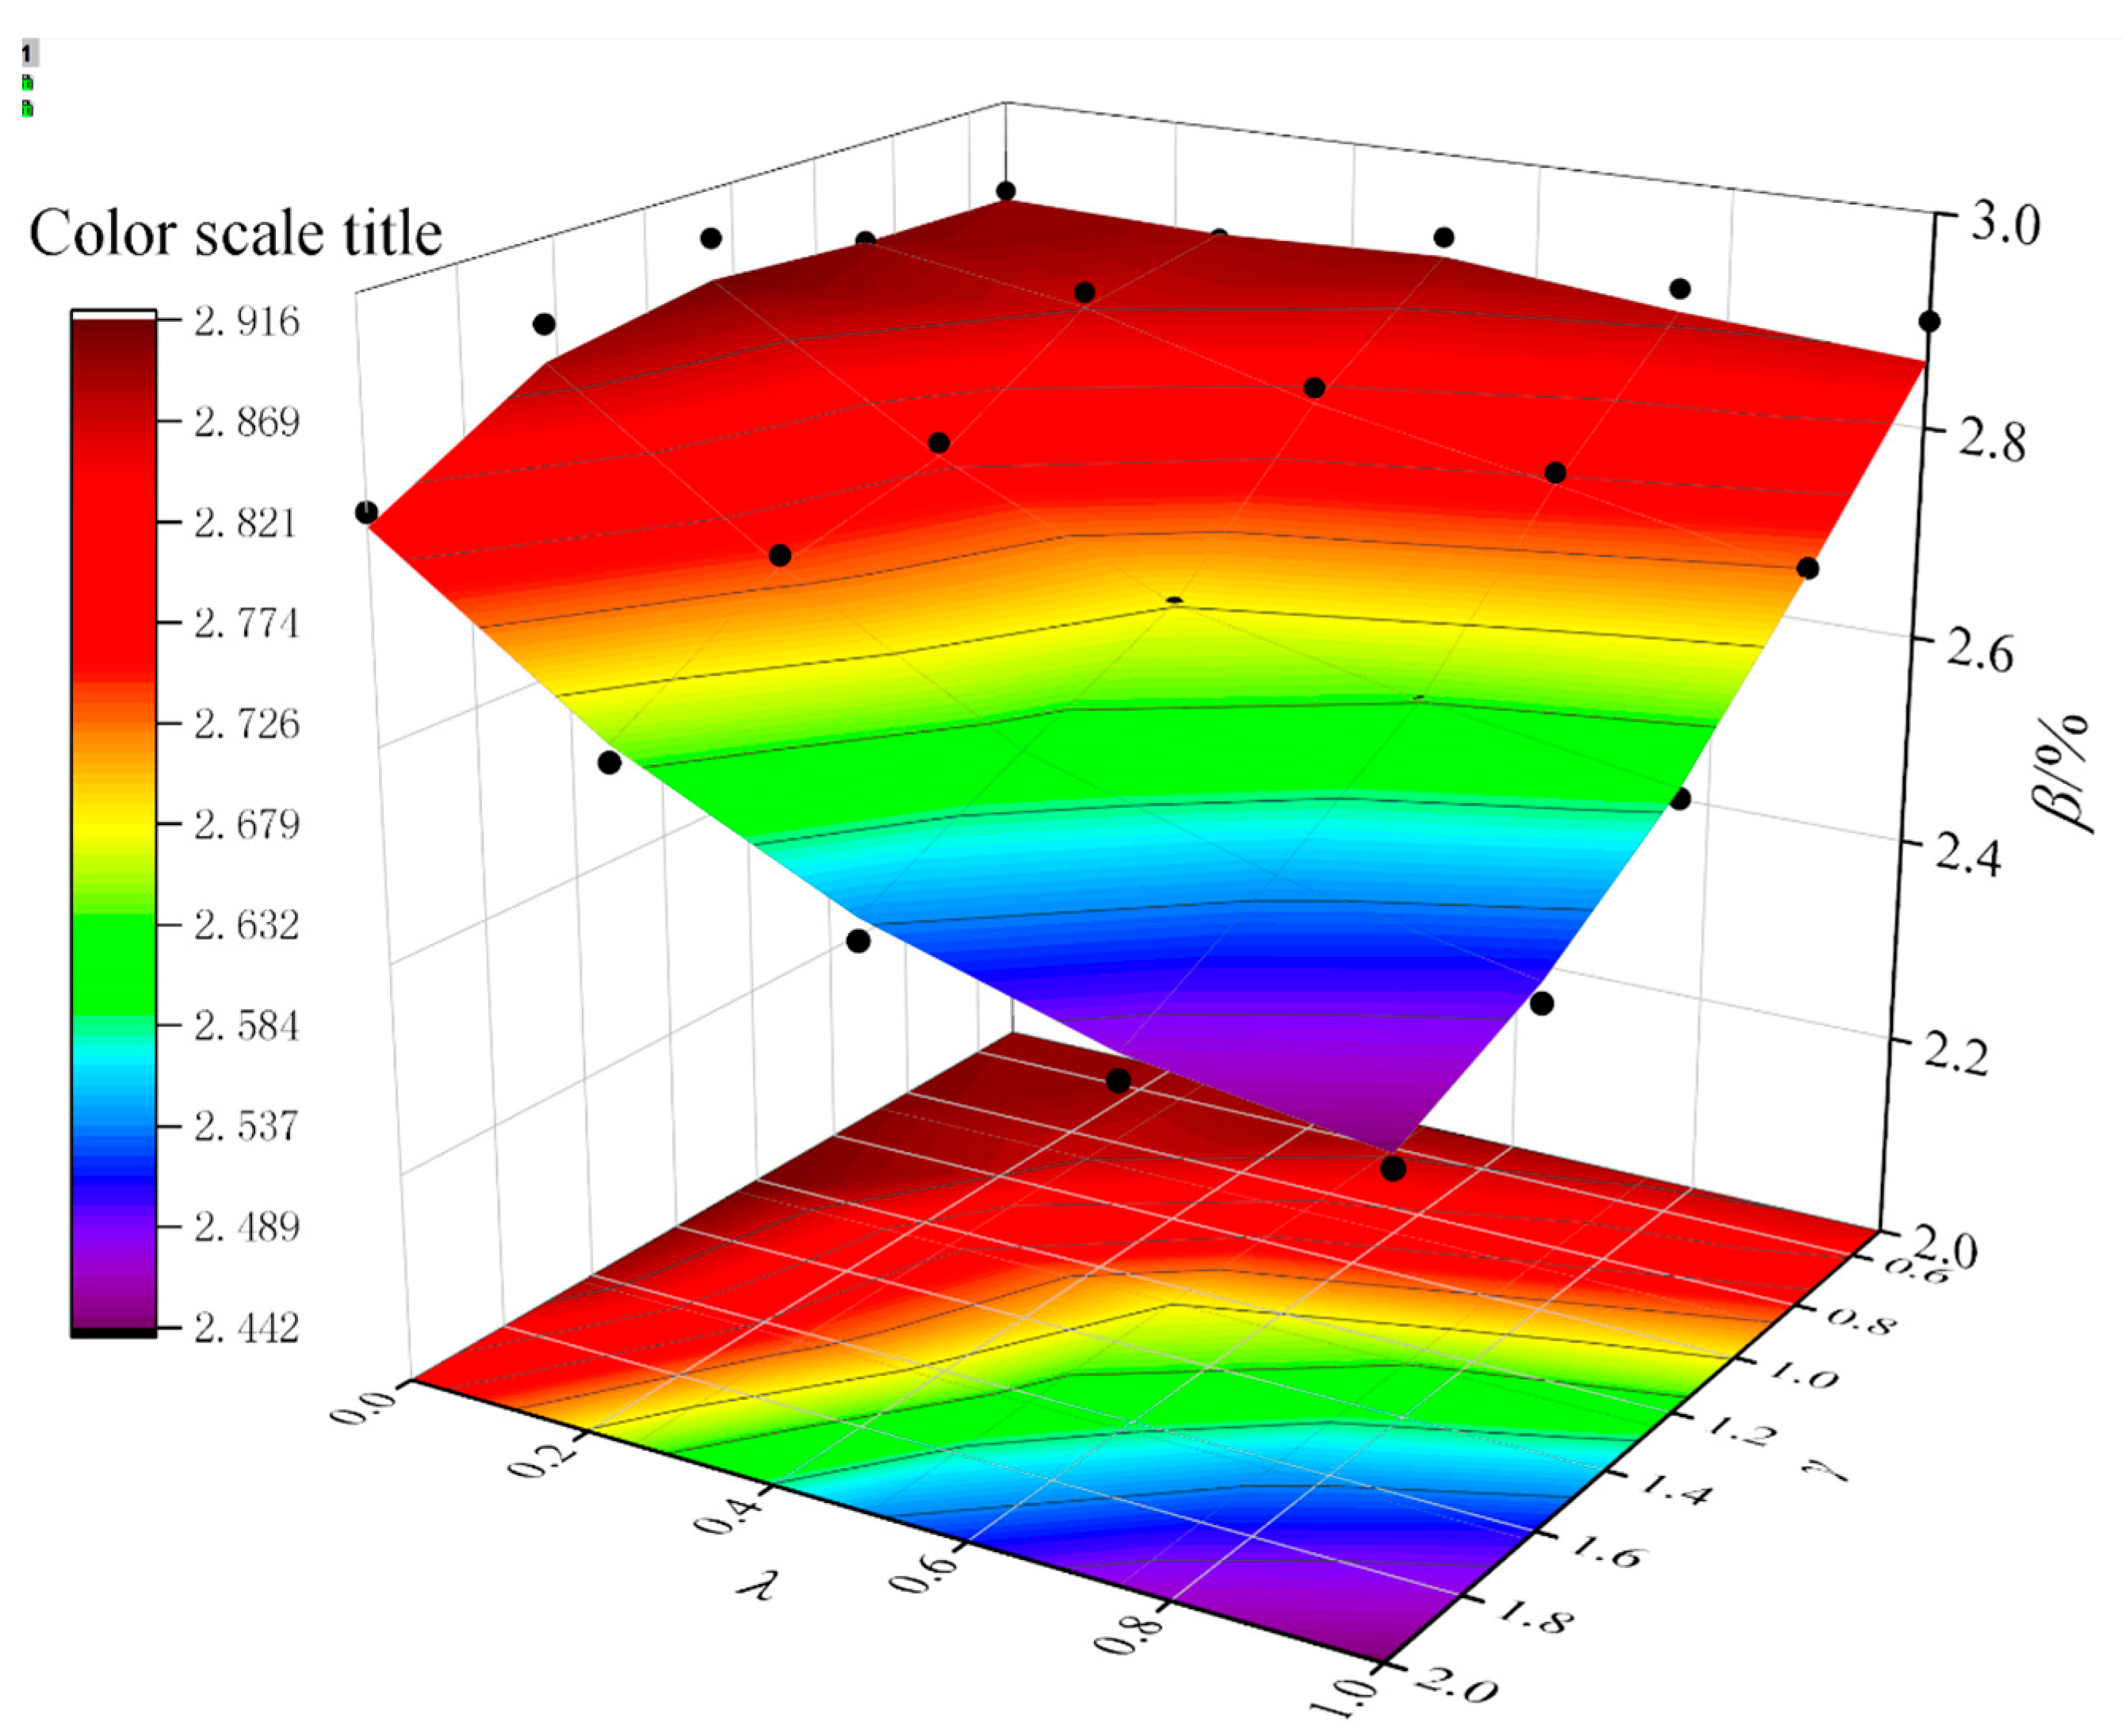
Figure 15.
The microscopic morphology of coal-bearing sandstone fragments at the end of the transmission rod under different length–diameter ratios.
Figure 15.
The microscopic morphology of coal-bearing sandstone fragments at the end of the transmission rod under different length–diameter ratios.
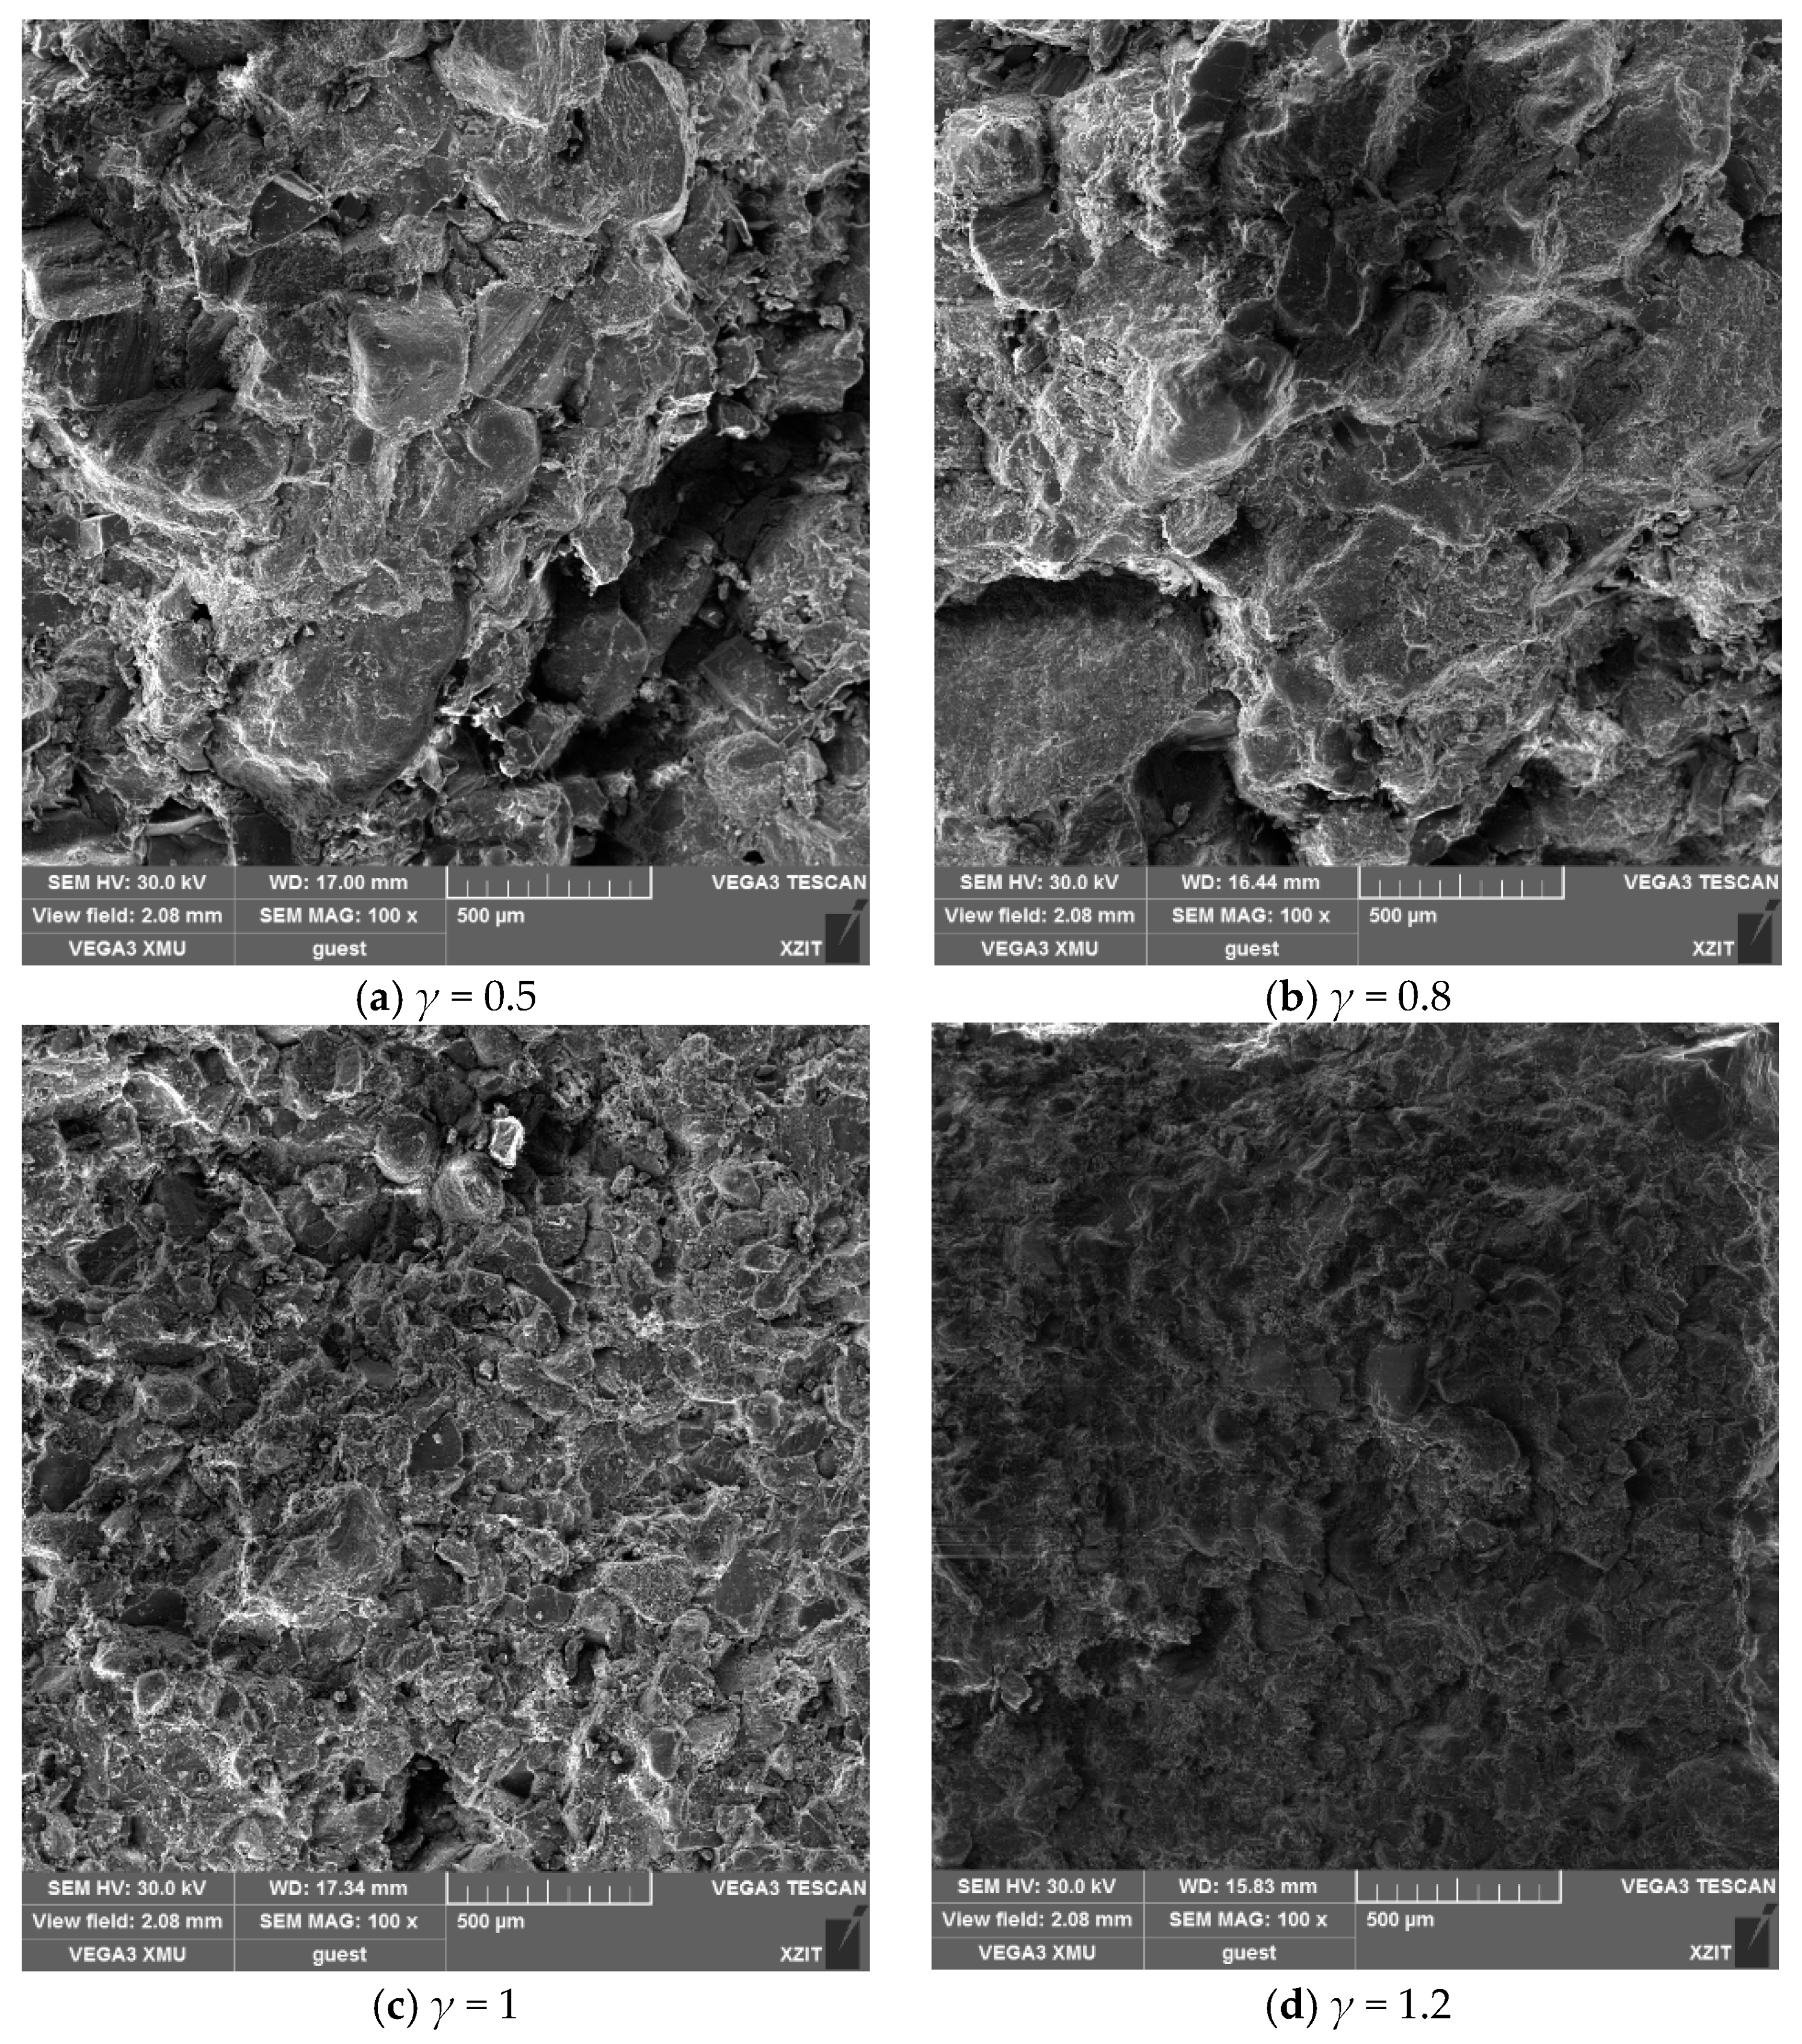

Figure 16.
Variation law of the overall damage degree of coal-bearing sandstone with the change in length–diameter ratio.
Figure 16.
Variation law of the overall damage degree of coal-bearing sandstone with the change in length–diameter ratio.


Table 1.
The physical and mechanical parameters of coal-bearing sandstones.
| NO. | Density/kg·m−3 | Longitudinal Wave Velocity/m·s−1 | Uniaxial Compressive Strength/MPa | Elasticity Modulus/GPa | Poisson’s Ratio | Porosity/% | ||||||
|---|---|---|---|---|---|---|---|---|---|---|---|---|
| Tv | Av | Tv | Av | Tv | Av | Tv | Av | Tv | Av | Tv | Av | |
| 1-1 | 2649 | 2629.33 | 3856 | 3873.76 | 117.24 | 112.85 | 7.05 | 7.15 | 0.22 | 0.21 | 2.35 | 2.31 |
| 1-2 | 2611 | 3942 | 109.36 | 7.30 | 0.20 | 2.27 | ||||||
| 1-3 | 2628 | 3823 | 111.95 | 7.11 | 0.21 | 2.32 | ||||||
Tv: test value, Av: average value.
Table 2.
Mechanical property parameters of coal-bearing sandstone with different length–diameter ratio under impact compression test.
Table 2.
Mechanical property parameters of coal-bearing sandstone with different length–diameter ratio under impact compression test.
| γ | σd/MPa | εd/10−3 | Ed/GPa | |||
|---|---|---|---|---|---|---|
| Tv | Av | Tv | Av | Tv | Av | |
| 0.5 | 66.11 | 64.04 | 10.14 | 10.58 | 10.73 | 9.64 |
| 62.64 | 11.23 | 8.61 | ||||
| 63.38 | 10.36 | 9.57 | ||||
| 0.8 | 108.09 | 108.70 | 11.71 | 11.43 | 12.72 | 12.78 |
| 109.28 | 10.11 | 13.17 | ||||
| 108.74 | 12.46 | 12.44 | ||||
| 1.0 | 140.86 | 141.91 | 13.97 | 13.80 | 15.33 | 15.79 |
| 139.44 | 14.57 | 14.79 | ||||
| 145.42 | 12.87 | 17.26 | ||||
| 1.2 | 173.20 | 172.76 | 16.51 | 16.30 | 15.13 | 16.21 |
| 176.65 | 14.89 | 18.66 | ||||
| 168.43 | 17.50 | 14.84 | ||||
| 1.5 | 132.78 | 133.93 | 17.79 | 17.50 | 11.42 | 11.03 |
| 141.14 | 18.07 | 9.66 | ||||
| 127.88 | 16.64 | 12.00 | ||||
| 1.8 | 111.01 | 112.30 | 20.41 | 21.17 | 7.82 | 8.06 |
| 115.10 | 20.94 | 8.91 | ||||
| 110.78 | 22.17 | 7.44 | ||||
| 2.0 | 98.91 | 96.40 | 22.92 | 23.76 | 7.17 | 6.73 |
| 93.83 | 25.06 | 6.40 | ||||
| 96.45 | 23.30 | 6.62 | ||||
Table 3.
Energy characteristics of coal-bearing sandstone with different length–diameter ratio under impact compression test.
Table 3.
Energy characteristics of coal-bearing sandstone with different length–diameter ratio under impact compression test.
| γ | Total Absorbed Energy | Elastic Energy | Dissipated Energy | |||
|---|---|---|---|---|---|---|
| Tv | Av | Tv | Av | Tv | Av | |
| 0.5 | 29.95 | 29.64 | 9.99 | 10.49 | 8.35 | 7.46 |
| 25.75 | 11.18 | 7.98 | ||||
| 33.21 | 10.30 | 6.04 | ||||
| 0.8 | 86.74 | 76.42 | 36.05 | 36.32 | 24.36 | 23.06 |
| 71.91 | 35.59 | 22.09 | ||||
| 70.62 | 37.31 | 22.72 | ||||
| 1.0 | 120.58 | 111.63 | 63.50 | 62.70 | 44.55 | 48.75 |
| 126.34 | 64.50 | 48.79 | ||||
| 87.96 | 60.11 | 52.91 | ||||
| 1.2 | 306.57 | 255.19 | 116.73 | 109.25 | 72.83 | 73.59 |
| 257.32 | 98.46 | 79.22 | ||||
| 201.69 | 112.55 | 68.73 | ||||
| 1.5 | 315.35 | 277.92 | 109.07 | 117.01 | 78.93 | 83.26 |
| 267.61 | 145.69 | 87.25 | ||||
| 250.81 | 96.28 | 83.61 | ||||
| 1.8 | 337.20 | 310.00 | 139.17 | 138.72 | 101.1 | 102.45 |
| 305.39 | 131.31 | 97.79 | ||||
| 287.41 | 145.67 | 108.47 | ||||
| 2.0 | 332.37 | 306.59 | 133.89 | 135.59 | 106.59 | 109.43 |
| 243.55 | 134.98 | 112.39 | ||||
| 343.84 | 137.89 | 109.3 | ||||
Table 4.
The porosity values of coal-bearing sandstone at each position under different length–diameter ratios.
Table 4.
The porosity values of coal-bearing sandstone at each position under different length–diameter ratios.
| Length–Diameter Ratio | The Porosity Values of Coal-Bearing Sandstone at Each Position F (%) | ||||
|---|---|---|---|---|---|
| The End of the Incident Bar | 1/4 Length of the Sample | 1/2 Length of Sample | 3/4 Length of Sample | The End of the Transmission Bar | |
| 0.5 | 2.91 | 2.89 | 2.92 | 2.9 | 2.9 |
| 0.8 | 2.92 | 2.9 | 2.86 | 2.82 | 2.78 |
| 1 | 2.89 | 2.85 | 2.76 | 2.71 | 2.65 |
| 1.2 | 2.95 | 2.8 | 2.69 | 2.64 | 2.6 |
| 1.5 | 2.92 | 2.78 | 2.62 | 2.56 | 2.51 |
| 1.8 | 2.91 | 2.69 | 2.58 | 2.49 | 2.46 |
| 2 | 2.81 | 2.63 | 2.52 | 2.45 | 2.43 |
Disclaimer/Publisher’s Note: The statements, opinions and data contained in all publications are solely those of the individual author(s) and contributor(s) and not of MDPI and/or the editor(s). MDPI and/or the editor(s) disclaim responsibility for any injury to people or property resulting from any ideas, methods, instructions or products referred to in the content. |
© 2023 by the authors. Licensee MDPI, Basel, Switzerland. This article is an open access article distributed under the terms and conditions of the Creative Commons Attribution (CC BY) license (https://creativecommons.org/licenses/by/4.0/).
Share and Cite
MDPI and ACS Style
Yi, E.; Li, Z. Study on the Influence of Sample Size on the Mechanical and Integrity Characteristics of Coal Measure Sandstone under High Strain Rate. Fractal Fract. 2023, 7, 869. https://doi.org/10.3390/fractalfract7120869
AMA Style
Yi E, Li Z. Study on the Influence of Sample Size on the Mechanical and Integrity Characteristics of Coal Measure Sandstone under High Strain Rate. Fractal and Fractional. 2023; 7(12):869. https://doi.org/10.3390/fractalfract7120869
Chicago/Turabian StyleYi, Enbing, and Zhenhua Li. 2023. "Study on the Influence of Sample Size on the Mechanical and Integrity Characteristics of Coal Measure Sandstone under High Strain Rate" Fractal and Fractional 7, no. 12: 869. https://doi.org/10.3390/fractalfract7120869