Article

Effects of Transverse Friction Massage on the Electromechanical Delay Components and Fractal Dimension of Surface Electromyography in Quadriceps Muscles

1
Department of Biophysics, Faculty of Medicine, Maltepe University, Istanbul 34857, Turkey
2
Department of Physical Therapy and Rehabilitation, Hacettepe University, Ankara 06230, Turkey
3
Department of Computer Technologies, Maritime Higher Vocational School, Piri Reis University, Istanbul 34940, Turkey
4
Department of Biophysics, Faculty of Medicine, Hacettepe University, Ankara 06230, Turkey
*
Author to whom correspondence should be addressed.
It is so sad that H.B passed away in 2018 and S.Y. passed away in 2017.
Fractal Fract. 2023, 7(8), 620; https://doi.org/10.3390/fractalfract7080620
Submission received: 11 June 2023 / Revised: 3 August 2023 / Accepted: 8 August 2023 / Published: 15 August 2023
(This article belongs to the Section Life Science, Biophysics)

Abstract

:
The purpose of this study was to assess the effects of transverse friction massage (TFM) on the electromechanical delay components and complexity of the surface electromechanical activity in the rectus femoris (RF) and vastus medialis (VM) muscles and to identify possible mechanisms behind TFM-induced alterations in the dynamics of RF and VM activity. Seven female and five male healthy subjects participated in this study. The subjects generated five maximal voluntary isometric contractions (MVICs) consecutively before and after TFM. Meanwhile, electromyography (EMG), mechanomyography (MMG), and force were recorded. The onset times of the recorded signals were detected offline by setting the threshold to three times the SD of the baseline. The delays between EMG and MMG (Δt(EMG–MMG)), MMG and force (Δt(MMG–Force)), and EMG and force (Δt(EMG–Force)) were computed from the detected onsets. The fractal dimension (FD) of the EMG time series was computed using the correlation dimension method. TFM increased Δt(MMG–Force) and Δt(EMG–Force) significantly in the RF but decreased Δt(EMG–MMG) and increased Δt(MMG–Force) in the VM. TFM decreased the FD in the RF and increased it in the VM. The results imply that TFM decreased the stiffness of both the RF and VM and decreased the duration of the electrochemical processes in the VM. It is proposed that the decrease in EMG complexity in the RF may be associated with the decreased stiffness of the RF, and the increase in EMG complexity in the VM may be associated with the decreased electrochemical processes in this muscle. It is also suggested that the opposite changes in EMG complexity in the RF and VM can be used as a discriminating parameter to search for the effects of an intervention in the quadriceps muscles. The present study also demonstrates how to discriminate the nonlinear dynamics of a complex muscle system from a noisy time series.

1. Introduction

Massage has been widely used by physical therapists to increase the joint range of motion and to decrease muscle stiffness in many orthopedic disorders such as patellofemoral pain, degenerative knee joints, and low back pain syndrome [1,2]. Massage has also been used in sports as part of a warm-up in order to stretch tendons and connective tissues, increase joint range of motion (ROM), reduce pain, and prevent injuries [3,4,5,6]. There are a number of studies that have been performed to identify the mechanisms behind the effects of massage on the musculoskeletal system. It has been proposed that massage produces its effects by decreasing the activity of Ia fibers due to the lengthened muscle–tendon unit, reducing the excitability of the motoneuron pool through Golgi tendon organs [7,8,9] and increasing passive muscle compliance through elongated connective tissue [10]. On the other hand, there are studies suggesting that massage introduces its effects by improving stretch tolerance rather than decreasing spinal motor neuron excitability [11]. Also, there are studies reporting that deep soft-tissue massage did not produce any effects on the mechanical properties of calf and ankle angular excursion [12], and that post-exercise massage had no effects on the stiffness of the quadriceps, hamstring and calf muscles [13]. As can be seen, diverse effects have been reported in different studies, and there is no agreement on the mechanisms behind the effects of massage.
Furthermore, in general, the Hoffman reflex (H-reflex) mechanism, changes in EMG parameters, and torque have been examined to identify the mechanisms behind the effects of massage [7,9,14,15]. Recently, Eriksson Crommert et al. [16] performed stiffness measurements by using ultrasound shear-wave elastography in the medial gastrocnemius muscle in order to identify whether the massage-induced increase in ROM is related to inhibition of the activity of the motor neuron pool or to stretch tolerance. They found that a 7 min massage decreased the stiffness of the medial gastrocnemius muscle. The electromechanical delay (EMD) analysis method has also been used to search for the role of the electrochemical- and biomechanical-related processes behind the effects of massage. It was found that the transverse friction massage (TFM) of the plantar flexors musculotendinous junction (MTJ) decreased the H-reflex/M-wave ratio in the soleus muscle without a change in the EMD [9]. Also, it was observed that deep TFM applied on the hamstring muscle did not affect the EMD and peak torque in the quadriceps muscles [17]. On the other hand, there are studies demonstrating that the electrochemical and biomechanical components of the EMD were altered with TFM in the rectus femoris muscle [8] or with pressure on the biceps brachii myotendinous junction [18]. As can be seen, there are contradictory observations on the effect of massage on this issue as well. Therefore, further studies are needed to determine the role of the electrochemical and biomechanical processes behind the massage-induced changes in the dynamics of the musculoskeletal system.
The fractal dimension (FD) of a signal is a quantitative value that implies the structure of the processes generating the signal and indicates the degree of freedom, i.e., the complexity of the system. Thus, the FD is used as a parameter to examine how complex the mechanism behind the generation of various physiological signals is. The characteristics of the electrical activity of muscles (electromyography, EMG) depend on the membrane properties of muscle fibers and the timing of motor unit action potentials (MUAPs). Therefore, surface EMG carries information about both the peripheral and central properties of the neuromuscular system. Numerous studies have shown that EMG recorded on the surface of the body has nonlinear properties [19,20,21,22,23]. The FD of an EMG signal changes depending on the firing frequency of motor neurons, the recruitment of motor units (MUs), and the conduction of MUAPs along muscle fibers and over tissues, as well as the form of each action potential of the muscle. Also, the FD of an EMG signal changes depending on the type of contraction, the task that the muscle performs and whether there is a disorder in the musculoskeletal system [24,25,26,27]. Therefore, FD analysis methods are frequently used in addition to time-domain analysis methods to identify how the dynamics of the musculotendon system change following an intervention, to understand the role of central and muscle-related mechanisms behind these changes and to examine whether the FD could be used as a discriminating parameter [28,29,30,31,32,33].
Therefore, the main purpose of the study was to identify the effects of TFM on the dynamics of the rectus femoris (RF) and vastus medialis (VM) muscles by means of the electromechanical delay and fractal dimension analysis methods. Specifically, this study focused on the following: (i) how TFM affects the processes related to the electromechanical delay components in the RF and VM; (ii) whether TFM alters the FD of EMG signals in the RF and VM; and (iii) the possible mechanisms behind the changes in the dynamics of the RF and VM muscles. The FD of EMG signals was tested by means of the correlation dimension method. The correlation dimension method allows researchers to examine the complexity of the attractor of the nonlinear system (EMG signal) as well as the source of the noise influencing the EMG measurement. To our knowledge, this is the only study that examines the effects of TFM on the FD of EMG signals in the RF and VM muscles and evaluates the results obtained from EMD and FD analysis to understand how the complexity of the RF and VM changes with TFM.

2. Materials and Methods

The present study was part of a research project exploring the effects of stretching and TFM on the EMD components and FD of EMG signals in the RF and VM muscles. The results of the study showed that, in the control group, a resting period of 20–30 min did not significantly alter the EMD components and FD values. The results obtained from the stretching and control groups have already been published [31,34,35]. However, the results on the effects of TFM on the RF and VM have not been previously published.

2.1. Subjects

Seven female and five male healthy volunteers participated in this study. The descriptive characteristics of the subjects are as follows: age, 25.1 ± 4.8 years; weight, 61.7 ± 6.5 kg; height, 1.69 ± 0.05 m; body mass index (BMI), 21.6 ± 1.8. All subjects had no neurological or knee problems and had not been involved in regular sports activity. The experimental procedure and the purpose of this study were explained to the subjects before the experiments.

2.2. Experimental Setup

The experimental setup and recording technique used in the present study were previously presented in detail [34,35]. All recordings were performed on the subject’s dominant leg. Initially, the skin was shaved and cleaned with ethyl alcohol to decrease the skin impedance to below 2 KΩ. A pair of surface electrodes (Ag/AgCl) with a distance of 2 cm between the centers was placed over the RF, at a distance of 50% between the anterior spina iliaca superior and the superior pole of the patella [34,35]. For the VM muscle, electrodes were placed at 80% of the line between the anterior spina iliaca superior and the joint space in front of the anterior border of the medial ligament [34,35]. A ground electrode was placed over the lateral line of the knee joint. Accelerometers (ADXL335-Small, Low-power, 3-Axis ± 3 g Accelerometer) were placed between the EMG electrodes to record MMG signals. The X-axis of the accelerometers was parallel to the fiber direction. EMG signals were amplified initially by 1000 times and then filtered with a bandwidth of 10–500 Hz. MMG signals were amplified by 200 times and then filtered with a bandwidth of 5–100 Hz [34,35].
The quadriceps force was recorded using a linearly operating load cell (CAS-500 N, between 0 and 250 N). The load cell was attached to the custom-made apparatus where subjects were seated, as described in detail previously [35]. The force signal was filtered with a low-pass filter (fc = 100 Hz).
A 16-bit USB-1608G data acquisition card (Measurement Computing, DAQ) was used to digitize the EMG, MMG, and force signals. The sampling frequency was adjusted to 5 KHz. The data were stored on a personal computer via a custom-written program in Matlab (R2014b).

2.3. Experimental Procedure

Subjects were seated on a specially constructed apparatus with their dominant leg at a 15° flexion knee angle, as described previously [34,35]. All familiarization sessions and experiments were conducted on the same day. Initially, each subject performed a familiarization session to become accustomed to the experimental procedure. In the experiments, first, the subjects were requested to perform 5 maximal voluntary isometric contractions (MVICs) consecutively as fast as possible, with each contraction lasting 5 s with a resting period of 10 s in between (pre-massage data). Afterwards, the subjects were subjected to transverse friction massage therapy. Thereafter, the subjects repeated the same experimental procedure as in the first series of experiments (post-massage data). Verbal encouragement was given to the subjects during the experiments to generate MVICs as quickly as possible. Visual feedback of the EMG, MMG, and force signals was also displayed on a screen to enable the subjects to control their contractions and resting period.

2.4. Transverse Friction Massage Therapy

Initially, a 20 min transverse friction massage was applied directly on the quadriceps tendon. Thereafter, 5 min patellar mobilization was applied in both the supero-inferior and medio-lateral directions.

2.5. Signal Processing

2.5.1. Time Delays

All EMG, MMG, and force data were real time series, digitized at 5 KHz. Two level conditions were used to determine the onset times of EMG, MMG, and force; one condition was the amplitude threshold, and the other was the time threshold. Initially, the band-pass filtered EMG signal was full-wave rectified. Following that, the standard deviations (SDs) of the baselines of each signal were calculated for a window of 200 ms. Three times the SD of the baseline was set as the amplitude threshold value for each signal [18,34]. The onset of a signal was computed as the point that the signal passed the amplitude threshold level of that signal the first time and remained above that level for at least 2 ms (time threshold). The time delay between EMG and MMG (Δt(EMG–MMG)) was calculated by subtracting the onset of EMG from the onset of MMG. Similarly, the time delay between MMG and force (Δt(MMG–Force)) was calculated by taking the difference between the onsets of MMG and force, and the time delay between EMG and force (Δt(EMG–Force)) was obtained by taking the difference between the onsets of EMG and force [18,34]. Time delays were computed for each contraction.

2.5.2. Root Mean Square

The root mean square (RMS) value was computed using Equation (1) to determine the amplitude of the EMG signals. The RMS value was computed over 10,000 data points, starting 500 ms after the onset of EMG. Fractal dimension analysis was also conducted on this EMG data region.
R M S = 1 N i = 1 N x i 2

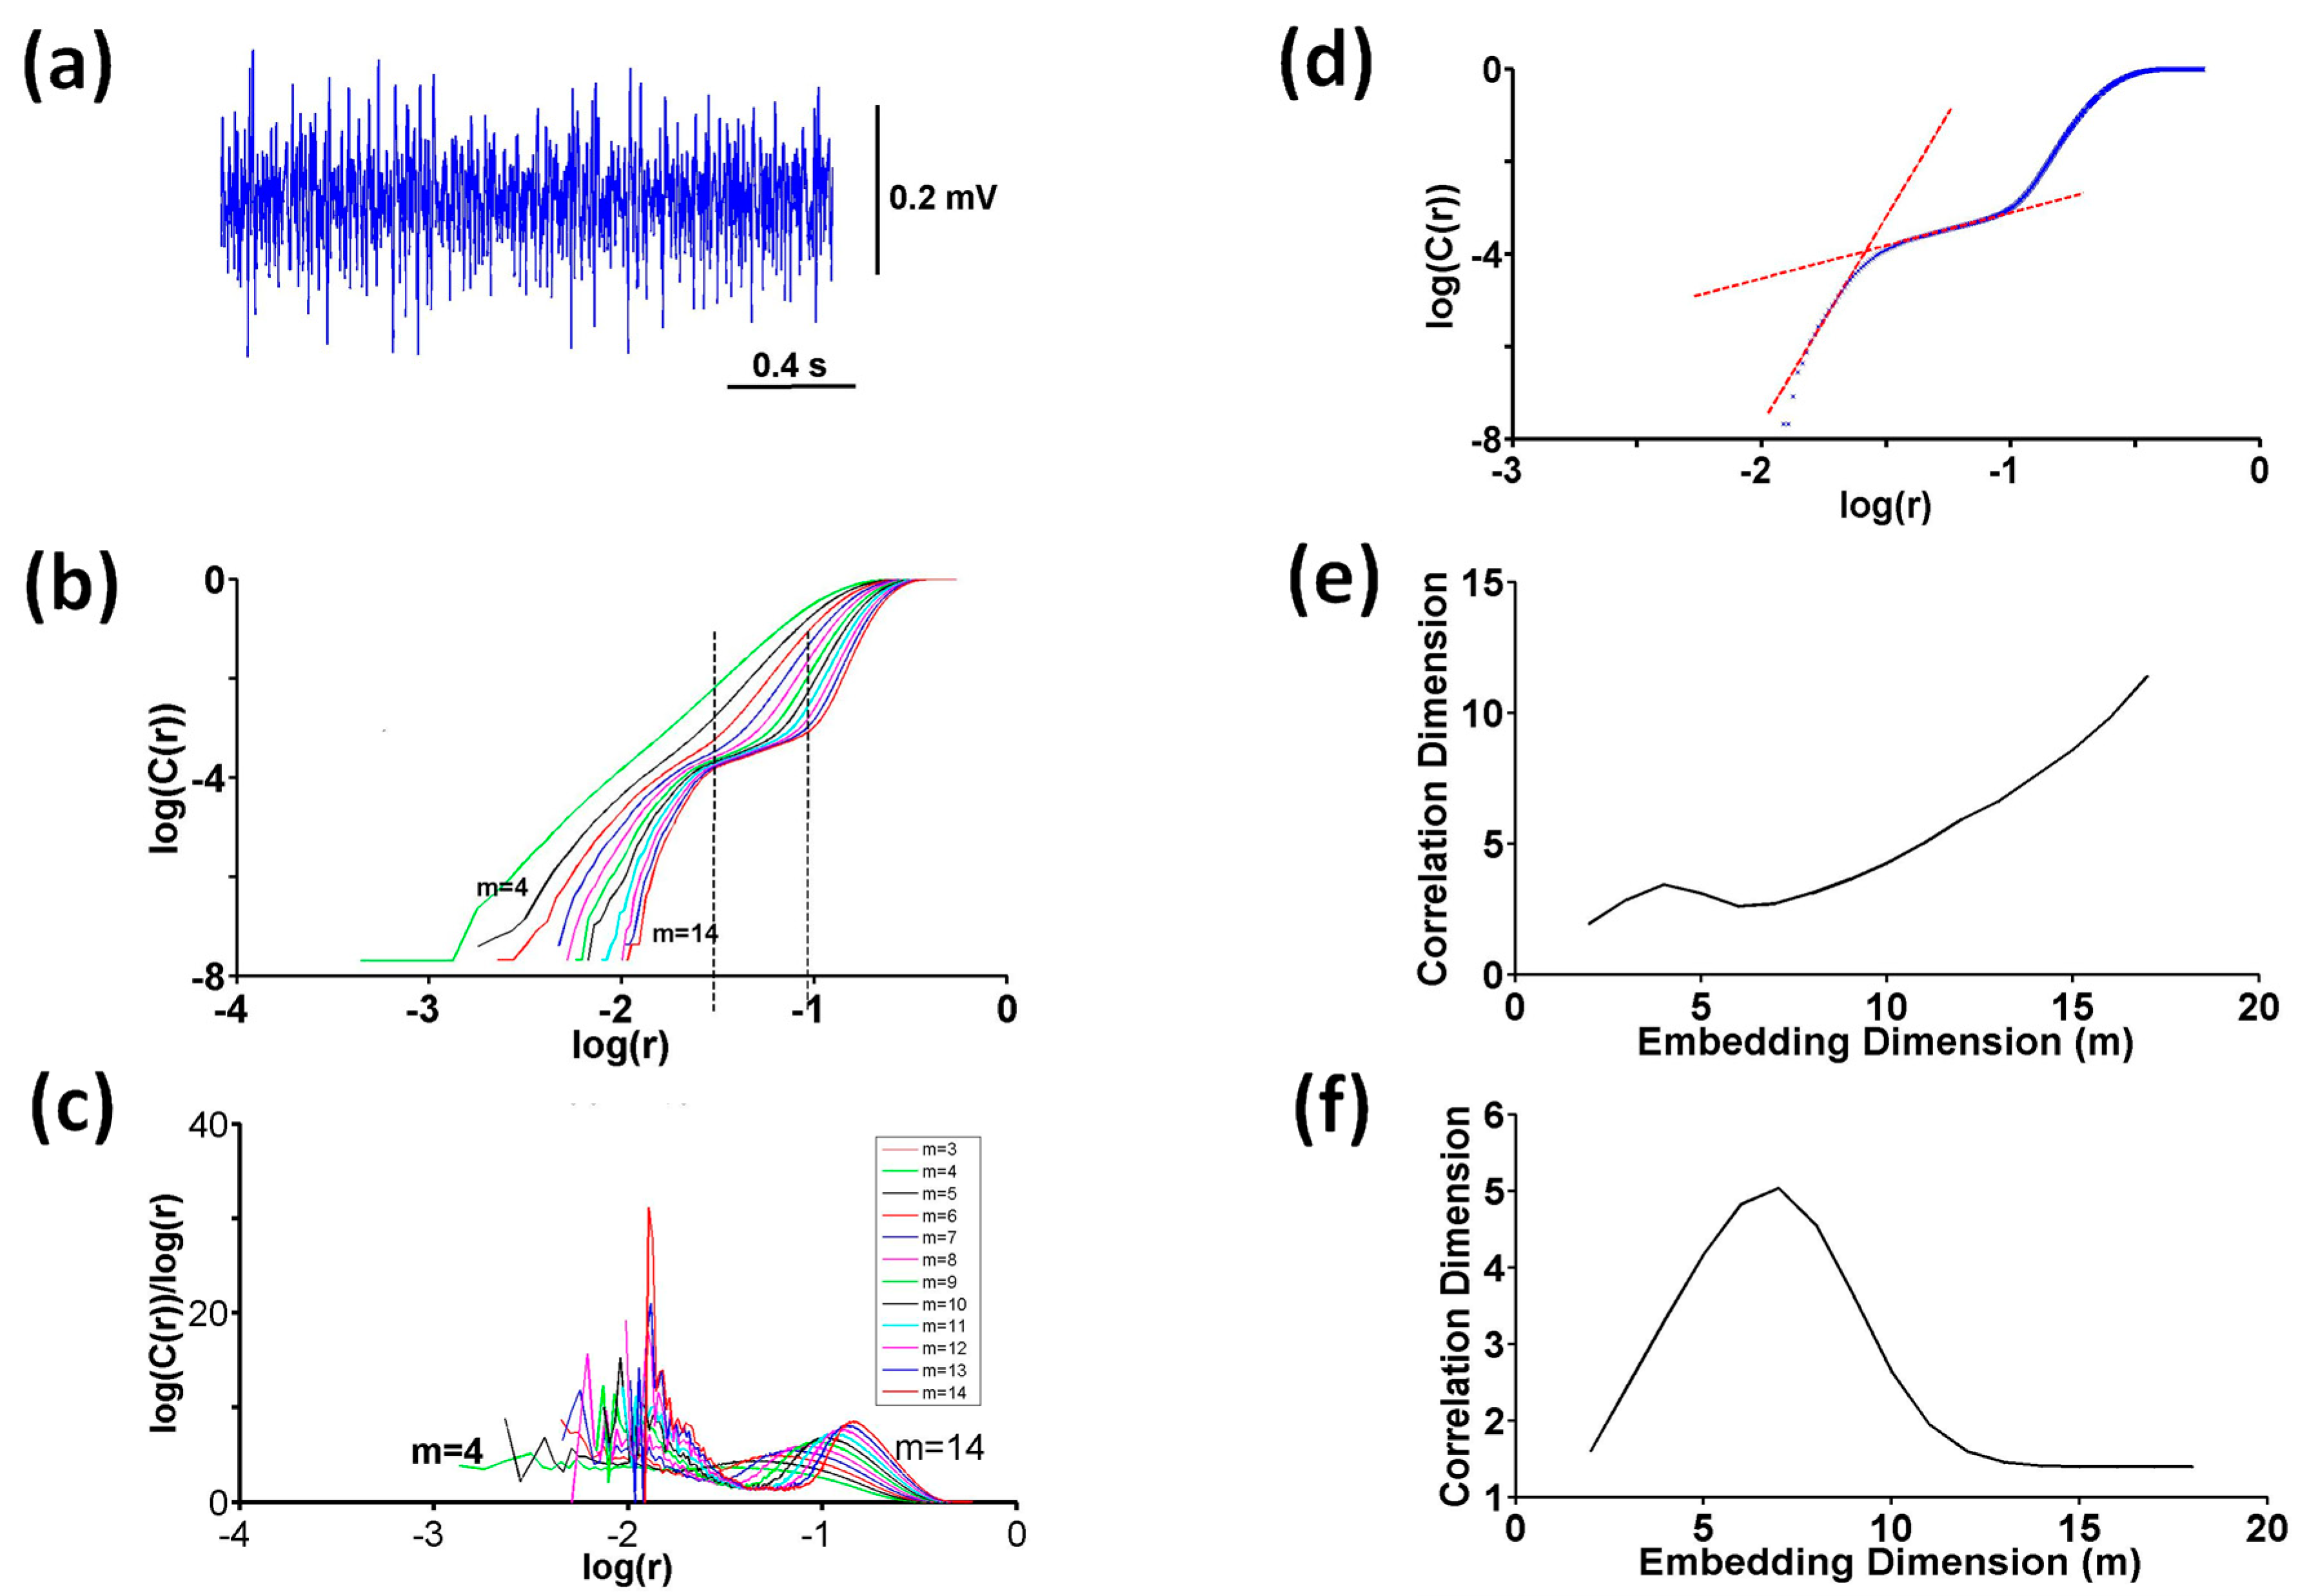
2.5.3. Correlation Dimension

The correlation dimension method was used in the present study to find the fractal dimension of the EMG time series. Some examples of the application of the correlation dimension method to EMG are presented in [19,23,25,27].
Computation of the correlation dimension is based on the implementation of a correlation integral. The correlation integral is defined as [36]
C r = 1 N N 1 i = 1 N j = 1 N Θ ( r X i X j )       ( i j )
where Θ is the Heaviside step function with Θ(x) = 1 if x > 0 and 0 if x ≤ 0; Xi is the state vector of point i; Xj is the state vector of point j; N is the number of constructed state vectors in the m dimension. The correlation integral describes the spatial correlation between the points on the attractor and returns a quantitative value concerning the number of pairs of points on the attractor where the distance between the pairs is less than a chosen r value [36,37,38].
Grassberger and Procaccia [36] proposed that the correlation integral is a function of the distance with a power law for small r values and defined the relationship as C(r) ~ rν, where ν is the dimension of the attractor. Thus, the correlation dimension is computed as the slope of the log(C(r)) vs. log(r) curve for small distances [36,37,38]. However, the method itself has some systematic errors because of the deviation of the curve from a straight line at very small distances and the presence of a few points in this region. To manage the systematic error, Grassberger and Procaccia [37] proposed to carry out the computation for increasing m values until a constant slope of the curve can be obtained. The constant slope is considered as the correlation dimension of the system.
The correlation dimension computation of the present study was implemented in accordance with the Grassberger and Procaccia [36] procedure by using a custom-written program coded in Matlab (R2014b). The procedure of the calculation was reported in detail previously [31,35]. Initially, state vectors (Xi) were constructed from the EMG time series data (xi, where i = 1…n) according to Takens’ theorem (Equation (3)) [39]:
Xi = {xi, xi+τxi+(m−1)τ}
where m is the embedding dimension and τ is the time delay. Following that, the correlation integral was computed for embedding dimensions between 4 and 14 using Equation (2). The correlation integral was calculated over 10,000 data points, starting 500 ms after the onset of the EMG signal. The time delay (τ) was calculated using the autocorrelation function as the first crossing point on the time axis.
Since EMG is a noisy signal, special care should be taken when determining the correlation dimension using the correlation integral curve (log(C(r)) vs. log(r) curve). For a noisy signal, the correlation integral curve is bounded below by the noise level [40]. It is proposed to use the middle third of the log(r) range to detect the region (true scaling region) that represents the actual dimension of the system attractor [40]. However, this might still cause misleading results because of the overlap of noise and the true dynamics of the attractor. In our study, the correlation integral curves had three distinct slope regions. Therefore, to extract the true dimension of the nonlinear behavior of the system, the slopes for the small- and middle-distance regions were calculated using the least squares linear regression method, and the variation in the slope with the embedding dimension was identified in each region.

Computation of Slope

The slopes of the correlation integral curve for the small- and middle-distance regions were obtained by computing the best-fitting line for the data using a least squares linear model. Initially, a linear range in the small-distance or middle-distance region was chosen on the correlation integral curve, and the data were arranged accordingly.
X 1 = l o g ( r L ) l o g ( r L + 1 ) l o g ( r H ) ;   i n d e p e n d e n t   v a l u e Y 1 = l o g ( C ( r L ) ) l o g ( C ( r L + 1 ) ) l o g ( C ( r H ) ) ;   d e p e n d e n t   v a l u e
where rL is the lower limit of the range, rH is the upper limit of the range, and N1 is the number of data between rH and rL.
The slope (b1) and intercept (b0) of the best-fitting line were determined using least squares estimation equations as [41]
b 0 = Y 1 b 1 X 1
b 1 = i = 1 N 1 X 1 i X 1 ¯ ( Y 1 i Y 1 ¯ ) i = 1 N 1 ( X 1 i X 1 ¯ ) 2 = i = r l r h X 1 i Y 1 i i = 1 N 1 Y 1 i i = 1 N 1 X 1 i N 1 i = 1 N 1 X 1 i 2 i = 1 N 1 X 1 i 2 N 1
where  Y 1 ¯ = 1 N 1 i = 1 N 1 Y 1 i   a n d   X 1 ¯ = 1 N 1 i = 1 N 1 X 1 i .
If Y2 is the equation of the best-fitting line with Y2 = b0 + b1X1, then the residual sum of squares is
R S S ( b 0 , b 1 ) = i = 1 N 1 Y 1 i Y 2 i 2
The coefficient of determination R2 is
R 2 = N 1 i = 1 N 1 X 1 i Y 1 i i = 1 N 1 X 1 i i = 1 N 1 Y 1 i N 1 i = 1 N 1 X 1 i 2 i = 1 N 1 X 1 i 2 N 1 i = 1 N 1 Y 1 i 2 i = 1 N 1 Y 1 i 2
In the present study, the slope, intercept, and coefficient of determination (R2) were computed using a program written in Matlab (R2014b) Toolbox codes. The computation was performed for different ranges in each region until the highest R2 value was obtained.
The slope of the small-distance region increased with m, which is a typical response of Gaussian noise. However, the slope of the middle-distance region (scaling region) saturated as m increased [19,35,36,37,38,40,42]. Therefore, only the slope obtained for the scaling region was evaluated in the present study. The FD values obtained by that means are presented in the Section 3. The slope obtained for the small-distance region was used to check whether it is related to a stochastic process (noise) or the nonlinear dynamics of the system.
In addition, the local slope of the integral curve was drawn using Equation (8) to observe how the local slope changes with the distance and m value.
L o c a l   S l o p e = Δ l o g ( C ( r ) ) Δ l o g ( r ) = l o g ( C r i + 1 l o g ( C r i ) log r i + 1 l o g ( r i )

Testing Nonlinearity

Through a phase randomization process, ten surrogate data were generated for each EMG signal to test the nonlinearity of the EMG signal for the middle-distance region according to Theiler et al. [43]. The statistical significance of the difference between the correlation dimension of the original signal and the average of the correlation dimensions of the 10 surrogate data was computed using the sigma value (Equation (9)).
S = Q o μ Q σ Q
where Qo is the correlation dimension of the original signal, μQ is the mean of the correlation dimensions of the 10 surrogate data, and σQ is the standard deviation of the correlation dimensions of the 10 surrogate data. A sigma value above 2 was used to indicate a significant difference [31,35,42,43,44].

2.6. Statistical Analysis

SPSS (IBM SPSS Statistics 25) analysis tools were used for statistical analysis. Initial analysis of the data via two-way analysis of variance (ANOVA) for repeated measures with two treatments (pre-massage and post-massage) and five time levels (five contractions) showed that there were no effects of time on any of the analyzed parameters (EMD components, FD, RMS, and force values). Therefore, the data were analyzed via one-way analysis of variance for repeated measures with two treatments over the averages of five contractions for each subject. Normality tests were performed using the Shapiro–Wilk test. The Greenhouse–Geisser correction was adopted when it was necessary. The Bonferroni test was applied for post hoc analysis. Changes in the amplitude of the EMG signals (RMS) and force with TFM are presented as a percentage of the pre-massage values. The level of significance was set to p < 0.05. Data are expressed as the mean ± SD. The magnitude of the effect was determined using the partial eta squared (ηp2) value.

3. Results

The effects of TFM on the electromechanical delay components in the RF and VM are illustrated in Figure 1. Δt(EMG–MMG) was 14.5 ± 4.1 ms before and 15.8 ± 3.8 ms after TFM in the RF. One-way analysis of variance for repeated measures showed that there was no significant effect of TFM on Δt(EMG–MMG). However, Δt(MMG–Force) and Δt(EMG–Force) were increased significantly from 49.1 ± 16.6 ms to 59.4 ± 16.5 ms (F = 5.668, p = 0.036, η2 = 0.340) and from 63.6 ± 16.0 ms to 73.8 ± 15.6 ms (F = 4.938, p = 0.048, η2 = 0.310), respectively, after TFM in the RF (Figure 1a).
In the VM, TFM decreased Δt(EMG–MMG) significantly from 19.9 ± 6.7 ms to 17.8 ± 5.0 ms (F = 4.957, p = 0.048, η2 = 0.311), while it increased Δt(MMG–Force) from 48.3 ± 11.2 ms to 57.4 ± 17.8 ms (F = 5.751, p = 0.035, η2 = 0.343) (Figure 1b). There was no significant effect of TFM on Δt(EMG–Force) in the VM. Δt(EMG–Force) was 71.9 ± 20.1 ms for the pre-massage group and 71.1 ± 13.7 ms for the post-massage group.
An EMG signal recorded from the RF muscle of a subject during an MVIC and a plot of the variation in the correlation integral with distance for embedding dimensions m = 4 – 14 computed from the same EMG signal are presented in Figure 2a,b, respectively. The local slope of the integral curve (Δlog(C(r))/Δlog(r)) is also illustrated in Figure 2c. Three distinct regions were recognized on the correlation integral (log(C(r)) vs. log(r)) curves (Figure 2b). These distinct regions were also reflected on the local slopes. The local slope of the integral curve had large variations in the very small distance region because of the low number of data points in this region. Following that, the local slope decreased steeply towards the middle-distance region where the local slope almost became flat. This flat region corresponded to the scaling region. The change in the local slope with distance showed a similar feature for all m values between 4 and 14, except that the curves and the flat region were shifted towards the right side. Figure 2d illustrates an example of the regression analysis for m = 14. The slope of the fitted line was 9.8 (R2 = 0.946) for the small-distance region and 1.41 (R2 = 0.997) for the middle-distance region. In addition, the slope of the fitted line (correlation dimension) for small distances below −1.5 increased constantly as the embedding dimension increased (Figure 2e); the slope almost reached the m value in a high embedding dimension, which indicates that the system generating the signal had a high dimension. In fact, for a noisy signal, the small-distance region is related to the dynamics of the noise, and the observed increase in the correlation dimension with the increasing embedding dimension reflects the characteristics of the noise. In the present case, the dynamics illustrated in Figure 2e indicate that Gaussian noise contributed to the EMG signal.
However, for the middle-distance region shown by the dashed lines in Figure 2b, the slope of the correlation integral curve computed via regression analysis reached a constant level as the embedding dimension increased (Figure 2f), which indicates that the structure of the reconstructed attractor did not change as m increased. Surrogate analysis revealed that the sigma values for this region were above 2, which implies that the EMG signal had deterministic nonlinear behavior within the middle-distance region. Thus, correlation dimension computations were performed for the middle-distance region, and the constant value of the correlation dimension vs. embedding dimension curve was accepted for the actual correlation dimension (D2, FD) of EMG.
The TFM application introduced significant effects on the FD in both the RF and VM. The FD decreased from 1.401 ± 0.030 to 1.384 ± 0.032 (F = 7.554, p = 0.023, η2 = 0.456) in the RF and increased from 1.383 ± 0.038 to 1.399 ± 0.047 (F = 6.046, p = 0.036, η2 = 0.402) in the VM after the massage (Figure 3).
There were no significant effects of TFM on the amplitude of the EMG signals in the RF and VM and force measured in the quadriceps muscle. The mean percentage RMS values of the EMG signals for the post-massage group were 109.3 ± 34.7% (p = 0.373) in the RF and 107.2 ± 20.1% (p = 0.237) in the VM with respect to the pre-massage values. The mean percentage force level for the post-massage group was 93.1 ± 26.4% (p = 0.431) with respect to the pre-massage values.

4. Discussion

The present study was designed to examine the effects of TFM on the dynamics of the RF and VM muscles during MVICs, and to explore the possible mechanisms behind the dynamic changes. In order to fulfill these aims, we applied EMD and fractal dimension analysis methods. The main findings were that TFM increased Δt(MMG–Force) and Δt(EMG–Force) and decreased the FD of the EMG signal in the RF. TFM did not influence Δt(EMG–MMG) in the RF. In contrast, in the VM, TFM decreased Δt(EMG–MMG), while it increased Δt(MMG–Force). In addition, the massage increased the FD of the EMG signal in the VM. TFM did not significantly affect the RMS values of the EMG signals in the RF and VM or the force generated in the quadriceps muscle. The main conclusion that can be derived from the results is that TFM affected the dynamics of the RF and VM differently; the complexity of the EMG signal decreased in the RF but increased in the VM with TFM. In that respect, to the authors’ knowledge, this is the first study demonstrating the distinct effect of TFM on the nonlinear dynamics of the EMG signals in the RF and VM during MVICs. Also, no previous study has examined the time-domain (EMD) parameters and nonlinear characteristics of the RF and VM, as conducted in the present study, or identified the possible mechanism responsible for the dynamic changes in these muscles.
The time delay between EMG and MMG is associated with processes related to the propagation of action potentials along muscle fibers and excitation–contraction coupling, while the time delay between MMG and force is associated with the biomechanical properties of the musculotendinous system [45,46,47,48]. Considering the mechanisms attributed to the components of the electromechanical delay, it can be deduced that TFM did not have an effect on the duration of the electrochemical processes in the RF but decreased the duration of the electrochemical processes in the VM. However, TFM affected the biomechanical properties of the RF and VM similarly; it decreased the stiffness of the muscle–tendon unit in both muscles.
The FD is a parameter used to detect the characteristics of the mechanisms generating a signal. Therefore, it is used to extract the characteristic features of physiological signals including EMG signals [32,33,49,50,51,52,53]. The FD analysis method has been utilized previously to study the dynamics of various muscles, including the biceps brachii [20,49,50], vastus lateralis [20,28], vastus medalis [28,31,35], rectus femoris [24,31,35], and flexor and extensor carpi radialis muscles [52]. It was suggested that the FD is related to MU recruitment [53], the firing frequency [53], and the level of synchronized activity of MUs [24,54]. Also, theoretical studies based on simulations of EMG have provided evidence that helps researchers understand how recruitment, the firing rate, and individual motor unit action potential characteristics affect the fractal dimensions of muscles [54,55]. Xu and Xiao [55] simulated the surface EMG for various durations of action potentials (APs), firing rates, and recruitment ratios. Their results showed that the fractal dimension was not very sensitive to variations in the amplitude of the APs. However, their results demonstrated that the fractal dimension was strongly affected by the duration of the APs; as the durations of the APs increased, the fractal dimension decreased. Their simulation results also demonstrated that the recruitment of motor units was the dominant parameter determining the fractal dimension of the EMG signal [55]. However, the FD increased steeply with a small recruitment number but reached a plateau with a large recruitment number. Simulation studies performed by Mesin et al. [54] showed that the fractal dimension was influenced by variations in the firing rate and the synchronization of MUAPs.
In light of the above-cited literature, and considering the processes attributed to the components of the electromechanical delay, as mentioned above [45,46,47,48], the decreased stiffness of the RF may account for the decrease in the FD in this muscle. The Hill model assumes that passive tissue elements of muscles and tendons, as well as the active component of muscles (i.e., attached cross-bridges), contribute to muscle stiffness. TFM was applied on the tendon in the present experiments. Therefore, the applied massage might lengthen the tendon and decrease its stiffness, which would initiate the presynaptic inhibition of the α-motor neuron pool through the Golgi organ pathway. Behm et al. [9] also noted that H-reflex depression induced by musculotendinous massage might be related to afferent inhibition via the Golgi system. Similarly, Huang et al. [10] reported the role of the Golgi organ in the MTJ-massage-induced increase in ROM. Thus, the suggestions proposed by Behm et al. [9] and Huang et al. [10] support our consideration. It is also likely that massage could produce pressure on the muscle, meaning that the attached cross-bridges would detach under that pressure and decrease the stiffness of the active component of the muscle. Therefore, the neural inputs to the motor neuron pool would decrease because of the decreased number of attachment sites, which would also lead to a decrease in EMG complexity. It is also probable that all MUs are recruited and synchronized during MVICs, and TFM might further increase the MU synchronization level.
In contrast, the increase in Δt(MMG–Force) leading to a decrease in the stiffness properties of the VM after TFM is contradictory to the increased complexity of the EMG signal in the VM. However, the massage decreased Δt(EMG–MMG) in the VM. Several factors may influence Δt(EMG–MMG), including AP propagation over muscle fibers and the rate of cross-bridge attachment, i.e., the excitation–contraction coupling process. If the decrease in the duration of the biochemical processes is related to an increase in the velocity of MUAP propagation along muscle fibers, then an increased conduction velocity could explain the increased EMG complexity in the VM. It is well known that EMG signals recorded from muscles with high conduction velocities also have a higher frequency content [54,56,57]. Conversely, slowing the conduction velocity compresses the power spectrum towards the lower frequencies (though the shift is not entirely due to the conduction velocity) [58,59,60]. Compression of the power spectrum occurs such that the logarithmic ratio of the power at high frequencies (H) to the power at low frequencies (L) decreases [61]. Furthermore, an increased conduction velocity would shorten the MUAP duration [62], which would increase the higher frequency content of its spectrum. Therefore, it could be expected that an increase in the conduction velocity would increase the complexity of the EMG signal. Also, there might be a trade-off between the reduced excitability of alpha motor neurons due to the biomechanical changes and the decreased duration of the electromechanical processes (Δt(EMG–MMG)).
Previous studies conducted on the effects of massage on the electromechanical delay have yielded controversial results. The electromechanical delay did not change in the soleus muscle with MTJ massage applied on the plantar flexors [9] or in the rectus femoris muscle with deep transverse friction massage [17]. The difference between the results of the cited studies and our results might be due to the differences between the experimental conditions. Behm et al. [9] performed their experiments using a 90° knee angle, while the experiments were conducted using a 15° angle in the present study. Also, the duration of the massage in [9] was shorter than the duration used in the present study. On the other hand, in [17], the massage was applied on the hamstring muscle, but the electromechanical delay was measured in the antagonist muscle. In contrast, Cè et al. [18] reported that a massage applied on the biceps brachii myotendinous junction increased the electrochemical and biomechanical processes in the elbow flexors. Begovic et al. [8] reported that TFM increased the time delays between EMG and ultrasound measurement (US) and between EMG and force in the RF. However, TFM decreased the time delay between US and force. In the present study, a significant change was not observed in Δt(EMG–MMG) in the RF after TFM. Also, in the present study, Δt(MMG–Force) increased after the massage, which contradicts the results obtained by Begovic et al. [8]. Our results support Begovic et al. [8] in that Δt(EMG–Force) increased after TFM in the RF. The difference between the results obtained by Begovic et al. [8] and our results might be due to the recording technique; they used ultrasound measurement to detect the electromechanical delay components, while accelerometers were used in the present study.
The electromechanical delay and FD analysis methods have been applied previously to identify the effect of stretching on the RF and VM muscles [31,34]. Stretching decreased the complexity (FD) of the EMG signal in the RF and increased it in the VM [31]. Moreover, stretching increased Δt(EMG–MMG) in the RF, while it decreased Δt(EMG–MMG) in the VM [34]. As can be seen, TFM and stretching affected the time delay parameters of the RF and VM differently. On the other hand, both TFM and stretching decreased the FD of the EMG signals in the RF but increased it in the VM. Ozturk et al. [31] proposed that the decreased complexity of EMG in the RF with stretching could be attributed to the increased duration of the electrochemical processes (Δt(EMG–MMG)), while the increased complexity in the VM could be related to the decreased duration of the electrochemical processes. Thus, when the results from stretching and TFM are compared, it can be argued that TFM and stretching alter the dynamics of EMG signals through different mechanisms.
The FD analysis method allows researchers to identify the distinct behaviors of the RF and VM after stretching and TFM. The RF and VM muscles of the quadriceps take a role in the extension and stability of the legs. Thus, the distinct behaviors of the RF and VM after an intervention could be a useful hint in detecting the cause of abnormalities in quadriceps functions, as well as for evaluating the development of a physiotherapy program.
In the present study, the FD of the EMG signals was calculated using the correlation dimension method. The correlation dimension is a measure concerning the correlation between points over the phase space of a system [63]. The recorded EMG signal is a real one-dimensional time series. Therefore, initially, the EMG time series was converted to state vectors in the embedding dimension m [36,39]. The state vectors of the system should be constructed such that the trajectory of the orbit constituting the phase space does not overlap. Since the dimension of the system generating the EMG signal is not known a priori, one of the methods to determine the required m value is to compute the correlation dimension for increasing m values and plot the correlation dimension against m [36,37]. The correlation dimension reaches a constant level as m increases. Therefore, the constant value of the curve is accepted as the actual correlation dimension (D2) of the attractor of the original system [40,42,64]. Once the correlation dimension saturates, increasing m above that level will not change the structure of the reconstructed attractor. For a sufficiently large m, there will be a one-to-one correspondence between the reconstructed and embedded spaces [39]. This approach was implemented to determine the correlation dimension in the present study.
Furthermore, the correlation dimension is defined as the slope of the log(c(r)) vs. log(r) curve for small distances [36]. Takens’ theorem [39] assumes that the signal originates from the dynamics of the system and is noise-free. However, since the recorded EMG signal is noisy, the correlation integral curve (log(C(r)) vs. log(r)) calculated from the reconstructed state vectors is contaminated by the noise depending on the signal-to-noise ratio [40,42,65,66]. Noise will affect the correlation integral curve at small r values. Therefore, for a noisy physiological signal, it is crucial to determine the actual correlation dimension of the system. The correlation integral curves in the present study had three distinct regions. For r values smaller than −1.5, the slope of the correlation integral curve increased as m increased (Figure 2e). In fact, the slope approached m for high m values, which indicates that the state vectors filled the whole available state space, and the attractor had a high dimension. This region is called the “noise regime” [65,66]. According to the present study, since the dimension increased with the same magnitude as m, the noise contributing to the EMG signal might have been Gaussian noise [65].
For the middle-distance region (−1.5 < r < −1), also called the scaling region, the slope of the correlation integral approached a constant value as m increased (Figure 2f). We accepted the constant value as the correlation dimension of the EMG signal [40,42,65,66]. However, m ≥ D2 is a necessary condition for the computed correlation dimension to represent the dimension of the original system attractor [40]. Also, the system should have nonlinear dynamics [40,43]. In the present study, these two conditions were satisfied, and the surrogate analysis method was performed to confirm whether the system had nonlinear dynamics within the region in which the correlation dimension was calculated.
Our study has some limitations. Firstly, the number of subjects included in the present study was 12; this number should be increased in order to obtain more significant results. Secondly, although the same physiotherapist applied TFM to all participants of the massage group, the pressure applied to each person might have varied. The experiments may have yielded more precise results if the applied TFM had the same pressure level for all subjects.

5. Conclusions

Determining the mechanisms behind the massage-induced changes in muscles is essential to obtaining a benefit from massage and developing treatment protocols. The present study is important in that it examined the acute effects of TFM on the time parameters and the complexity of the EMG signals of the RF and VM and proposed possible mechanisms behind the dynamic changes. The results showed that TFM induced diverse effects on the electromechanical delay components in the RF and VM. TFM did not have an effect on the electrochemical processes in the RF, while it decreased the duration of the electrochemical processes in the VM. However, TFM affected the biomechanical properties of the RF and VM similarly; it decreased the muscle–tendon stiffness in both muscles. In addition, TFM decreased the complexity of EMG in the RF and increased it in the VM. The decrease in the complexity of the EMG signal in the RF could be attributed to the decreased stiffness of the RF. On the other hand, the increase in the EMG complexity in the VM might be related to the decreased duration of the electrochemical processes in this muscle after TFM. A combined assessment of the electromechanical delay components along with the FD allowed us to identify the possible mechanisms contributing to the massage-induced alterations in the dynamics of the RF and VM. The muscle-specific changes in the FD with TFM imply that the FD can be a useful parameter to detect an abnormality in a functional muscle group. This study also emphasized the precautions that should be taken to discriminate the nonlinear dynamics of a complex muscle system from a noisy time series. In that respect, this study exemplifies the application of nonlinear analysis methods to noisy physiological signals.

Author Contributions

This study was part of the Ph.D. thesis of H.B. Conceptualization, N.O., H.B., P.D., F.C. and S.Y.; formal analysis, N.O., H.B. and P.D.; investigation, N.O., H.B., F.C. and S.Y.; methodology, N.O., H.B., P.D., F.C. and S.Y.; resources, N.O., H.B. and S.Y.; software, N.O.; visualization, P.D.; writing—original draft, N.O., P.D. and F.C.; writing—review and editing, N.O., P.D. and F.C. All authors have read and agreed to the published version of the manuscript.

Funding

This research received no external funding.

Institutional Review Board Statement

All procedures performed in this study were approved by the Ethical Review Board of Hacettepe University (Approval reference number: B.30.2.HAC.0.05.07.00/776; Project No: HEK12.81.) and were in accordance with the ethical standards of the institutional and/or national research committee and with the 1964 Helsinki Declaration and its later amendments or comparable ethical standards. Written informed consent was obtained from all participants for the collection and use of their data for research purposes.

Data Availability Statement

The data generated and/or analyzed during this study are available from the corresponding author on reasonable request.

Acknowledgments

Necla Ozturk, Filiz Can and Pinar Demir wrote this study in memory of Haris Begovic and Suha Yagcioglu. We are grateful to Haris Begovic and Suha Yagcioglu for conceptualization of the study and for their contributions to intense discussions. This study would not have been possible without the enormous affords of Haris Begovic and the technical support of Suha Yagcioglu.

Conflicts of Interest

The authors declare no conflict of interest.

Abbreviations

ANOVAAnalysis of variance
APAction potential
EMDElectromechanical delay
EMGElectromyography
FDFractal dimension
mEmbedding dimension
MMGMechanomyography
MTJMusculotendinous junction
MUAPsMotor unit action potentials
MUsMotor units
MVICMaximum voluntary isometric contraction
RFRectus femoris muscle
RMSRoot mean square
ROMJoint range of motion
TFMTransverse friction massage
VMVastus medialis muscle
Δt(EMG–MMG)Time delay between EMG and MMG
Δt(MMG–Force)Time delay between MMG and force
Δt(EMG–Force)Time delay between EMG and force

References

  1. Sobeck, C.; Lenk, L.; Knipper, S.; Rhoda, A.; Stickler, L.; Stephenson, P. The effectiveness of functional massage on pain and range of motion measurements in patients with orthopedic impairments of the extremities. Int. Musculoskelet. Med. 2016, 38, 21–25. [Google Scholar] [CrossRef]
  2. Hernandez-reif, M.; Field, T.; Krasnegor, J.; Theakston, H. Lower back pain is reduced and range of motion increased after massage therapy. Int. J. Neurosci. 2001, 106, 131–145. [Google Scholar] [CrossRef] [PubMed]
  3. Monteiro, E.R.; da Silva Novaes, J.; Cavanaugh, M.T.; Hoogenboom, B.J.; Steele, J.; Vingren, J.L.; Škarabot, J. Quadriceps foam rolling and rolling massage increases hip flexion and extension passive range-of-motion. J. Bodyw. Mov. Ther. 2019, 23, 575–580. [Google Scholar] [CrossRef] [PubMed]
  4. McKechnie, G.J.; Young, W.B.; Behm, D.G. Acute effects of two massage techniques on ankle joint flexibility and power of the plantar flexors. J. Sports Sci. Med. 2007, 6, 498–504. [Google Scholar] [PubMed]
  5. Boguszewski, D.; Szkoda, S.; Adamczyk, J.G.; Białoszewski, D. Sports massage therapy on the reduction of delayed onset muscle soreness of the quadriceps femoris. Hum. Mov. 2014, 15, 234–237. [Google Scholar] [CrossRef]
  6. Madoni, S.N.; Costa, P.B.; Coburn, J.W.; Galpin, A.J. Effects of foam rolling on range of motion, peak torque, muscle activation, and the hamstrings-to-quadriceps strength ratios. J. Strength Cond. Res. 2018, 32, 1821–1830. [Google Scholar] [CrossRef]
  7. Lee, H.M.; Wu, S.K.; You, J.Y. Quantitative application of transverse friction massage and its neurological effects on flexor carpi radialis. Man. Ther. 2009, 14, 501–507. [Google Scholar] [CrossRef]
  8. Begovic, H.; Zhou, G.Q.; Schuster, S.; Zheng, Y.P. The neuromotor effects of transverse friction massage. Man. Ther. 2016, 26, 70–76. [Google Scholar] [CrossRef]
  9. Behm, D.G.; Peach, A.; Maddigan, M.; Aboodarda, S.J.; DiSanto, M.C.; Button, D.C.; Maffiuletti, N.A. Massage and stretching reduce spinal reflex excitability without affecting twitch contractile properties. J. Electromyogr. Kinesiol. 2013, 23, 1215–1221. [Google Scholar] [CrossRef]
  10. Huang, S.Y.; Di Santo, M.; Wadden, K.P.; Cappa, D.F.; Alkanani, T.; Behm, D.G. Short duration massage at the hamstrings musculotendinous junction induces greater range of motion. J. Strength Cond. Res. 2010, 24, 1917–1924. [Google Scholar] [CrossRef]
  11. Akazawa, N.; Okawa, N.; Kishi, M.; Nakatani, K.; Nishikawa, K.; Tokumura, D.; Matsui, Y.; Moriyama, H. Effects of long-term self-massage at the musculotendinous junction on hamstring extensibility, stiffness, stretch tolerance, and structural indices: A randomized controlled trial. Phys. Ther. Sport 2016, 21, 38–45. [Google Scholar] [CrossRef] [Green Version]
  12. Thomson, D.; Gupta, A.; Arundell, J.; Crosbie, J. Deep soft-tissue massage applied to healthy calf muscle has no effect on passive mechanical properties: A randomized, single-blind, cross-over study. BMC. Sports Sci. Med. Rehabil. 2015, 7, 21. [Google Scholar] [CrossRef] [PubMed] [Green Version]
  13. Kong, P.W.; Chua, Y.H.; Kawabata, M.; Burns, S.F.; Cai, C. Effect of post-exercise massage on passive muscle stiffness measured using myotonometry—A Double-Blind Study. J. Sports Sci. Med. 2018, 17, 599–606. [Google Scholar] [PubMed]
  14. Weerapong, P.; Hume, P.A.; Kolt, G.S. The mechanisms of massage and effects on performance, muscle recovery and injury prevention. Sports Med. 2015, 35, 235–256. [Google Scholar] [CrossRef] [PubMed]
  15. Sefton, J.E.M.; Yarar, C.; Carpenter, D.M.; Berry, J.W. Physiological and clinical changes after therapeutic massage of the neck and shoulders. Man. Ther. 2011, 16, 487–494. [Google Scholar] [CrossRef] [PubMed]
  16. Eriksson Crommert, M.; Lacourpaille, L.; Heales, L.J.; Tucker, K.; Hug, F. Massage induces an immediate, albeit short-term, reduction in muscle stiffness. Scand. J. Med. Sci. Sports 2015, 25, e490–e496. [Google Scholar] [CrossRef] [PubMed]
  17. Arai, R.; Kuruma, H. Ineffectiveness of muscle reaction time and torque of quadriceps in treating hamstrings using deep transverse friction massage. Ann. Phys. Rehabil. Med. 2018, 61, e472. [Google Scholar] [CrossRef]
  18. Cè, E.; Longo, S.; McCoy, E.; Bisconti, A.V.; Tironi, D.; Limonta, E.; Rampichini, S.; Rabuffetti, M.; Esposito, F. Acute effects of direct inhibitory pressure over the biceps brachii myotendinous junction on skeletal muscle activation and force output. J. Electromyogr. Kinesiol. 2017, 37, 25–34. [Google Scholar] [CrossRef]
  19. Lei, M.; Wang, Z.; Feng, Z. Detecting nonlinearity of action surface EMG signal. Phys. Lett. A 2001, 290, 297–303. [Google Scholar] [CrossRef]
  20. Arjunan, S.P.; Kumar, D.K. Computation of fractal features based on the fractal analysis of surface Electromyogram to estimate force of contraction of different muscles. Comp. Method. Biomec. 2014, 17, 210–216. [Google Scholar] [CrossRef]
  21. Phinyomark, A.; Quaine, F.; Charbonnier, S.; Serviere, C.; Tarpin-Bernard, F.; Laurillau, Y. EMG feature evaluation for improving myoelectric pattern recognition robustness. Expert Syst. Appl. 2013, 40, 4832–4840. [Google Scholar] [CrossRef]
  22. Chen, W.; Zhuang, J.; Yu, W.; Wang, Z. Measuring complexity using FuzzyEn, ApEn, and SampEn. Med. Eng. Phys. 2009, 31, 61–68. [Google Scholar] [CrossRef] [PubMed]
  23. Wang, G.; Zhang, Y.; Wang, J. The analysis of surface EMG signals with the wavelet-based correlation dimension method. Comput. Math. Methods Med. 2014, 2014, 284308. [Google Scholar] [CrossRef] [Green Version]
  24. Ancillao, A.; Galli, M.; Rigoldi, C.; Albertini, G. Linear correlation between fractal dimension of surface EMG signal from Rectus Femoris and height of vertical jump. Chaos Soliton Fractals 2014, 66, 120–126. [Google Scholar] [CrossRef]
  25. Rissanen, S.M.; Kankaanpää, M.; Meigal, A.; Tarvainen, M.P.; Nuutinen, J.; Tarkka, I.M.; Airaksinen, O.; Karjalainen, P.A. Surface EMG and acceleration signals in Parkinson’s disease: Feature extraction and cluster analysis. Med. Biol. Eng. Comput. 2008, 46, 849–858. [Google Scholar] [CrossRef] [PubMed]
  26. Hernandez, L.R.; Camic, C.L. Fatigue-mediated loss of complexity is contraction-type dependent in vastus lateralis electromyographic signals. Sports 2019, 7, 78. [Google Scholar] [CrossRef] [Green Version]
  27. Meigal, A.I.; Rissanen, S.; Tarvainen, M.P.; Karjalainen, P.A.; Iudina-Vassel, I.A.; Airaksinen, O.; Kankaanpää, M. Novel parameters of surface EMG in patients with Parkinson’s disease and healthy young and old controls. J. Electromyogr. Kinesiol. 2009, 19, e206–e213. [Google Scholar] [CrossRef]
  28. Boccia, G.; Dardanello, D.; Beretta-Piccoli, M.; Cescon, C.; Coratella, G.; Rinaldo, N.; Barbero, M.; Lanza, M.; Schena, F.; Rainoldi, A. Muscle fiber conduction velocity and fractal dimension of EMG during fatiguing contraction of young and elderly active men. Physiol. Meas. 2016, 37, 162–174. [Google Scholar] [CrossRef] [PubMed] [Green Version]
  29. Beretta-Piccoli, M.; D’Antona, G.; Barbero, M.; Fisher, B.; Dieli-Conwright, C.M.; Clijsen, R.; Cescon, C. Evaluation of central and peripheral fatigue in the quadriceps using fractal dimension and conduction velocity in young females. PLoS ONE 2015, 4, e0123921. [Google Scholar] [CrossRef]
  30. Beretta-Piccoli, M.; Calanni, L.; Negro, M.; Ricci, G.; Bettio, C.; Barbero, M.; Berardinelli, A.; Siciliano, G.; Tupler, R.; Soldini, E.; et al. Increased resistance towards fatigability in patients with facioscapulohumeral muscular dystrophy. Eur. J. Appl. Physiol. 2021, 121, 1617–1629. [Google Scholar] [CrossRef]
  31. Ozturk, N.; Begovic, H.; Demir, P.; Yagcioglu, S.; Can, F. Effects of stretching on the fractal dimension of rectus femoris and vastus medialis muscles. In Proceedings of the 2020 IEEE International Symposium on Medical Measurements and Applications (MeMeA), Bari, Italy, 1–3 June 2020; pp. 1–6. [Google Scholar] [CrossRef]
  32. Rampichini, S.; Vieira, T.M.; Castiglioni, P.; Merati, G. Complexity analysis of surface electromyography for assessing the myoelectric manifestation of muscle fatigue: A review. Entropy 2020, 22, 529. [Google Scholar] [CrossRef]
  33. Arjunan, S.P.; Kumar, D.K. Fractals and electromyograms. In The Fractal Geometry of the Brain; Di Ieva, A., Ed.; Springer Series in Computational Neuroscience; Springer: New York, NY, USA, 2016; pp. 445–455. [Google Scholar] [CrossRef]
  34. Begovic, H.; Can, F.; Yagcioglu, S.; Ozturk, N. Passive stretching-induced changes detected during voluntary muscle contractions. Physiother. Theory Pract. 2020, 36, 731–740. [Google Scholar] [CrossRef]
  35. Ozturk, N.; Begovic, H.; Demir, P.; Yagcioglu, S.; Can, F. Rectus Femoris and Vastus Medialis Muscles Exhibit Different Dynamics in Processing of Isometric Voluntary Contractions: A Fractal Analysis Study. In Proceedings of the 2019 IEEE International Symposium on Medical Measurements and Applications (MeMeA), İstanbul, Turkey, 26–28 June 2019; pp. 1–6. [Google Scholar] [CrossRef]
  36. Grassberger, P.; Procaccia, I. Characterization of strange attractors. Phys. Rev. Lett. 1983, 50, 346–349. [Google Scholar] [CrossRef]
  37. Grassberger, P.; Procaccia, I. Measuring the strangeness of strange attractors. Phys. D 1983, 9, 189–208. [Google Scholar] [CrossRef]
  38. Grassberger, P. Grassberger-Procaccia algorithm. Scholarpedia 2007, 2, 3043. [Google Scholar] [CrossRef]
  39. Takens, F. Detecting strange attractors in turbulence. In Dynamical Systems and Turbulence, Warwick 1980: Proceedings of a Symposium Held at the University of Warwick 1979/80; Lecture Notes in Mathematics; Rand, D.A., Young, L.S., Eds.; Springer: Berlin/Heidelberg, Germany, 1980; Volume 898, pp. 366–381. [Google Scholar]
  40. Henry, B.; Lovell, N.; Camacho, F. Nonlinear dynamics time series analysis. Nonlinear Biomed. Signal Process. Dyn. Anal. Model. 2000, 2, 1–39. [Google Scholar]
  41. Montgomery, D.C.; Peck, E.A.; Vining, G.G. Introduction to Linear Regression Analysis, 4th ed.; John Wiley & Sons: Hoboken, NJ, USA, 2021; pp. 14–37. [Google Scholar]
  42. Lei, M.; Meng, G. Nonlinear analysis of surface EMG signals. In Computational Intelligence in Electromyography Analysis—A Perspective on Current Applications and Future Challenges; Naik, G.R., Ed.; InTech: Rijeka, Croatia, 2012; pp. 120–171. [Google Scholar] [CrossRef] [Green Version]
  43. Theiler, J.; Eubank, S.; Longtin, A.; Galdrikian, B.; Farmer, J. Testing for nonlinearity in time series: The method of surrogate data. Phys. D 1992, 58, 77–94. [Google Scholar] [CrossRef] [Green Version]
  44. Zunino, L.; Kulp, C.W. Detecting nonlinearity in short and noisy time series using the permutation entropy. Phys. Lett. A 2017, 381, 3627–3635. [Google Scholar] [CrossRef]
  45. Esposito, F.; Limonta, E.; Ce, E. Passive stretching effects on electromechanical delay and time course of recovery in human skeletal muscle: New insights from an electromyographic and mechanomyographic combined approach. Eur. J. Appl. Physiol. 2011, 111, 485–495. [Google Scholar] [CrossRef]
  46. Petitjean, M.; Maton, B.; Fourment, A. Summation of elementary phonomyograms during isometric twitches in humans. Eur. J. Appl. Physiol. Occup. Physiol. 1998, 77, 527–535. [Google Scholar] [CrossRef] [PubMed]
  47. Smith, C.M.; Housh, T.J.; Hill, E.C.; Keller, J.L.; Johnson, G.O.; Schmidt, R.J. Effects of intensity on muscle-specific voluntary electromechanical delay and relaxation electromechanical delay. J. Sports Sci. 2018, 36, 1196–1203. [Google Scholar] [CrossRef] [PubMed]
  48. Sözen, H.; Cè, E.; Bisconti, A.V.; Rampichini, S.; Longo, S.; Coratella, G.; Shokohyar, S.; Doria, C.; Borrelli, M.; Limonta, E.; et al. Differences in electromechanical delay components induced by sex, age and physical activity level: New insights from a combined electromyographic, mechanomyographic and force approach. Sport Sci. Health 2019, 15, 623–633. [Google Scholar] [CrossRef]
  49. Chakraborty, M.; Parbat, D. Fractals, chaos and entropy analysis to obtain parametric features of surface electromyography signals during dynamic contraction of biceps muscles under varying load. In Proceedings of the 2017 2nd International Conference for Convergence in Technology (I2CT), Mumbai, India, 21 December 2017; pp. 222–229. [Google Scholar] [CrossRef]
  50. Beretta-Piccoli, M.; Boccia, G.; Ponti, T.; Clijsen, R.; Barbero, M.; Cescon, C. Relationship between isometric muscle force and fractal dimension of surface electromyogram. Biomed. Res. Int. 2018, 2018, 5373846. [Google Scholar] [CrossRef] [Green Version]
  51. Marri, K.; Swaminathan, R. Analysis of Biceps Brachii Muscles in Dynamic Contraction Using sEMG Signals and Multifractal DMA Algorithm. Int. J. Signal Process. Syst. 2016, 4, 79–85. [Google Scholar] [CrossRef]
  52. Phinyomark, A.; Phukpattaranont, P.; Limsakul, C. Feature reduction and selection for EMG signal classification. Expert Syst. Appl. 2012, 39, 7420–7431. [Google Scholar] [CrossRef]
  53. Gitter, J.A.; Czerniecki, M.J. Fractal analysis of the electromyographic interference pattern. J. Neurosci. Meth. 1995, 58, 103–108. [Google Scholar] [CrossRef] [PubMed]
  54. Mesin, L.; Dardanello, D.; Rainoldi, A.; Boccia, G. Motor unit firing rates and synchronisation affect the fractal dimension of simulated surface electromyogram during isometric/isotonic contraction of vastus lateralis muscle. Med. Eng. Phys. 2016, 38, 1530–1533. [Google Scholar] [CrossRef] [Green Version]
  55. Xu, Z.; Xiao, S. Fractal dimension of surface emg and its determinants. In Proceedings of the 19th Annual International Conference of the IEEE Engineering in Medicine and Biology Society, ‘Magnificent Milestones and Emerging Opportunities in Medical Engineering’ (Cat. No.97CH36136). Chicago, IL, USA, 30 October–2 November 1997; Volume 4, pp. 1570–1573. [Google Scholar] [CrossRef]
  56. De Luca, C.J. Myoelectrical manifestations of localized muscular fatigue in humans. Crit. Rev. Biomed. Eng. 1984, 11, 251–279. [Google Scholar]
  57. Pincivero, D.M.; Green, R.C.; Mark, J.D.; Campy, R.M. Gender and muscle differences in EMG amplitude and median frequency, and variability during maximal voluntary contractions of the quadriceps femoris. J. Electromyogr. Kinesiol. 2000, 10, 189–196. [Google Scholar] [CrossRef]
  58. Lindstrom, L.H.; Magnusson, R.I. Interpretation of myoelectric power spectra: A model and its applications. Proc. IEEE 1977, 65, 653–662. [Google Scholar] [CrossRef]
  59. Stulen, F.B.; De Luca, C.J. Frequency parameters of the myoelectric signal as a measure of muscle conduction velocity. IEEE Trans. Biomed. Eng. 1981, 7, 515–523. [Google Scholar] [CrossRef] [PubMed] [Green Version]
  60. Arjunan, S.P.; Kumar, D.K.; Wheeler, K.; Shimada, H. Spectral properties of surface electromyogram signal and change in muscle conduction velocity during isometric muscle contraction. SIViP 2015, 9, 261–266. [Google Scholar] [CrossRef]
  61. Bigland-Ritchie, B.; Donovan, E.F.; Roussos, C.S. Conduction velocity and EMG power spectrum changes in fatigue of sustained maximal efforts. J. Appl. Physiol. 1981, 51, 1300–1305. [Google Scholar] [CrossRef] [PubMed]
  62. Lowery, M.M.; Vaughan, C.L.; Nolan, P.J.; O’Malley, M.J. Spectral compression of the electromyographic signal due to decreasing muscle fiber conduction velocity. IEEE Trans. Rehabil. Eng. 2000, 8, 353–361. [Google Scholar] [CrossRef]
  63. Filligoi, G. Chaos theory and sEMG. In Cyber Journals: Multidisciplinary Journals in Science and Technology, Journal of Selected Areas in Bioengineering (JSAB); January Edition; 2011; pp. 143–154. Available online: http://www.cyberjournals.com/Papers/Jan2011/13.pdf (accessed on 7 August 2023).
  64. Webber, C.L., Jr.; Zbilut, J.P. Recurrence quantification analysis of nonlinear dynamical systems. Tutor. Contemp. Nonlinear Methods Behav. Sci. 2005, 94, 26–94. [Google Scholar]
  65. Kantz, H.; Schreiber, T. Dimension estimates and physiological data. Chaos 1995, 5, 143–154. [Google Scholar] [CrossRef]
  66. Schreiber, T.; Kantz, H. Noise in chaotic data: Diagnosis and treatment. Chaos 1995, 5, 133–142. [Google Scholar] [CrossRef] [Green Version]
Figure 1. Effects of TFM on Δt(EMG–MMG), Δt(MMG–Force) and Δt(EMG–Force) in the RF (a) and VM (b). Values are expressed as the mean ± SD (n = 12). * indicates a significant difference between the pre- and post-massage groups at p < 0.05.
Fractalfract 07 00620 g001
Figure 2. Computation of the correlation dimension of an EMG signal. (a) An EMG signal recorded from the rectus femoris muscle (RF) of a subject during a maximal voluntary isometric contraction and (b) its correlation integral curves (log(C(r)) vs. log(r)) for embedding dimensions m = 4–14. The middle-distance (scaling) region is shown by two vertical dashed lines. (c) The variation in the local slope (Δlog(C(r))/Δlog(r)) of the correlation integral curve with distance. (d) The correlation integral curve for m = 14 and lines fitted to the data in the small- and middle-distance regions via regression analysis. The slope of the fitted line was 9.8 (R2 = 0.946) for the small-distance region (−1.90 < r < −1.65) and 1.41 (R2 = 0.997) for the middle-distance region (−1.40 < r < −1.10). (e) The variation in the correlation dimension (slope of the correlation integral curve) with m for the small-distance region below −1.5. (f) The variation in the correlation dimension with m for the middle-distance region. The sigma value was 3.269 for the middle-distance region.
Fractalfract 07 00620 g002
Figure 3. Effects of TFM on the FD of EMG signals for the RF (a) and VM (b). Values are expressed as the mean ± SD (n = 12). * indicates a significant difference between the pre- and post-massage groups at p < 0.05.
Fractalfract 07 00620 g003
Disclaimer/Publisher’s Note: The statements, opinions and data contained in all publications are solely those of the individual author(s) and contributor(s) and not of MDPI and/or the editor(s). MDPI and/or the editor(s) disclaim responsibility for any injury to people or property resulting from any ideas, methods, instructions or products referred to in the content.

