
Geomechanical Properties of Deep-Sea Pore-Filled Methane Hydrate-Bearing Soils at Critical State Using DEM Analysis
1
College of Civil Engineering, Tongji University, Shanghai 200092, China
2
State Key Laboratory for Disaster Reduction in Civil Engineering, Tongji University, Shanghai 200092, China
3
Key Laboratory of Geotechnical and Underground Engineering of Ministry of Education, Tongji University, Shanghai 200092, China
4
School of Transportation Science and Engineering, Civil Aviation University of China, Tianjin 300300, China
*
Author to whom correspondence should be addressed.
Fractal Fract. 2023, 7(9), 681; https://doi.org/10.3390/fractalfract7090681
Submission received: 30 July 2023
/
Revised: 30 August 2023
/
Accepted: 5 September 2023
/
Published: 12 September 2023
Abstract
:The recognition of the geomechanical properties of methane hydrate-bearing soil (MHBS) is crucial to exploring energy resources. The paper presents the mechanical properties of a pore-filled MHBS at a critical state using the distinct element method (DEM). The pore-filled MHBS was simulated as cemented MH agglomerates to fill the soil pores at varying levels of methane hydration (MH) saturation. A group of triaxial compression (TC) tests were conducted, subjecting MHBS samples to varying effective confining pressures (ECPs). The mechanical behaviors of a pore-filled MHBS were analyzed, as it experienced significant strains leading to a critical state. The findings reveal that the proposed DEM successfully captures the qualitative geomechanical properties of MHBS. As MH saturation increases, the shear strength of MHBS generally rises. Moreover, higher ECPs result in increased shear strength and volumetric contraction. The peak shear strength of MHBS increases with rising MH saturation, while the residual deviator stress remains mainly unchanged at a critical state. There is a good correlation between fabric changes of the MHBS with variations in principal stresses and principal strains. With increasing axial strain, the coordination number (CN) and mechanical coordination number (MCN) increase to peak values as the values of MH saturation and ECPs increase, and reach a stable value at a larger axial strain.
1. Introduction
Methane hydrate-bearing soil (MHBS) deposits are found abundantly in continental margins and permafrost regions, which contain MH within the pore spaces. MH is a promising resource to alleviate the current energy shortage ([1,2,3,4,5]). Therefore, there is a growing focus on surveying the physical, thermodynamic, chemical, and mechanical properties of MHBS, as well as developing technological methods for identifying and exploiting MHBS deposits ([6,7]). However, it is important to consider the potential hazards associated with safe mining, such as submarine landslides and tsunamis ([8,9,10,11,12,13,14,15]). Therefore, the geomechanical properties of MHBS are crucial to understanding from the view of geotechnique ([16,17,18,19]).
As a type of geotechnical material, when it comes to MHBS, our understanding of its mechanical properties mostly relies on conventional triaxial compression tests ([20,21,22]). Undeniably, triaxial tests are widely used and effective for investigating the macroscopic mechanical characteristics of geomaterials. However, as our understanding of geotechnical materials deepens, it has become evident that the microstructure within the material significantly influences its macroscopic mechanical properties ([23,24,25,26]). For certain specific macroscopic phenomena, such as shear bands and anisotropy in soil, it is necessary to investigate the microstructural aspects of specimens to obtain a more profound and reasonable explanation.
Nevertheless, due to limitations in experimental equipment, it is often challenging to directly observe mechanical responses at the particle level within the soil during conventional triaxial tests. Compared to traditional geotechnical materials, MHBS specimens possess more complex material compositions, typically consisting of soil particles, water, gas, and methane hydrates. These factors exert multiple influences on the mechanical properties, particularly the content, distribution of hydrates, and hydrate morphology within MHBS ([27,28,29,30,31,32]). Therefore, relying solely on conventional compression tests may not sufficiently illuminate the geomechanical behaviors of MHBS.
The difficulty in obtaining undisturbed MHBS samples and the requirement of specialized low-temperature and high-pressure testing apparatus in indoor triaxial tests significantly hinder the systematic investigation of MHBS mechanical properties. Additionally, their mechanical characteristics are relevant to the attributes and statuses of their constituent components, the interactions between solid hydrates and soil particles playing a prominent role in mechanical behavior. Thus, understanding the mechanical properties of MHBS necessitates considering the effects of different hydrate forms on the soil framework and the resulting diverse mechanical behaviors.
Consequently, the distinct element method (DEM) has garnered attention from researchers ([29,33,34,35,36,37,38,39,40]). The DEM allows for generating MHBS specimens with different microstructural distributions from a microscopic perspective, enabling numerical simulations to explore the macro-/micro-mechanical responses of particle assemblies under varying loading situations, thereby strengthening the understanding of the mechanical performances of MHBS. The DEM is instrumental in enhancing our comprehension of the geomechanical behavior of MHBS with different MH saturations in the critical state, thereby facilitating the establishment of a suitable constitutive model.
The sand-based MHBS specimens with a pore-filling type of MH, which are composed of a mixture of sand particles and hydrate particles, represent a special granular material with distinct discontinuities. A reproducible numerical specimen preparation method is firstly introduced. A group of drained triaxial compression (TC) tests were conducted to investigate the mechanical and deformation responses of a pore-filled MHBS, subjecting the MHBS samples to varying effective confining pressures (ECPs). The mechanical and deformation properties of the pore-filled MHBS were analyzed when the specimen was experienced to a significant strain, leading to a critical state. The qualitative properties of the pore-filling type of MHBS are then evaluated in different respects.
2. Materials and Methods
A cube with a side length of 5.44 mm was generated, which contained 10,000 soil particles, using a particle size distribution (PSD) illustrated in Figure 1a.
A novel numerical fabrication method for preparing the pore-filled MHBS was introduced in a previous study ([18]). The main idea of the approach to generate a pore-filled MHBS is as follows: Firstly, the MH cluster is regarded as a whole cluster entity formed by the agglomeration of granular bonding. This implies that the hydrate deposits are modeled as assemblies consisting of numerous small particles that are interconnected through bonding interactions. Next, these hydrate clusters are randomly filled within the pores of soil particles, creating MHBS samples with the corresponding MH saturation. This technique aims to simulate and understand the formation process of porous filling hydrate deposits. Here is just a brief description of this method. Detailed information can be referred to in the previous reference ([18]).
MH saturation is calculated by the following equation:
where is the MH’s volume of MH and is the total pore volume containing MH.
Four MHBS samples were generated with MH saturations ( = 0%, 5%, 10%, and 20%), in which the numbers of MH clusters (N = 0, 540, 1080, and 2160) were filled in the soil skeleton. One MH cluster with a void ratio = 0.82 and a radius = 0.024 m was produced which contained 60 MH particles cemented by the parallel bond model (PBM) ([41,42]). The parameters of the PBM used were as follows: the normal bond strength was , and the shear parallel bond strength was . The normal parallel bond stiffness was to be = 9.244 × 10¹² . The shear parallel bond stiffness was to be = 6.163 × 10¹² . The ratio of parallel bond radius to ball radius was . The schematic diagram after sample preparation with a specified MH saturation is shown in Figure 1b, in which MH particles are highlighted in red. Three ECPs ( = 2, 4, and 6 MPa) were chosen and were constant with the stress boundary to conduct the simulation of drained triaxial compression tests. The major principal stress was loaded at a compression strain rate of 1%/min.
The deviatoric shear stress, , can be obtained as follows:
The volumetric strain, , is calculated as follows ([43]):
where , , and are the major, intermediate, and minor principal strain, respectively.
The void ratio is calculated as follows:
where is the volume of the voids, is the volume of the soil, and V is the total volume of the MHBS.
The parameters used were listed in Table 1 as follows.
3. Results
The contact model ([32]) was chosen to simulate the mixed type of MHBS, in which part of the MHBS is in the bonding state. If readers need detailed information, the reference ([32]) can be referred to. Here is just a brief introduction to the basic mechanical properties of the model. As shown in Figure 1, the mechanical behaviors include tension, compression, shearing, bending, and twisting modes of loading. The solid lines represent the mechanical responses with cementation, while the dashed lines represent mechanical responses without cementation. These actions lead to two failure mechanisms: one involving the breakage and fracture of the hydrate itself, and the other involving the cementation failure of the hydrate particles with the skeleton particles.
3.1. Macro-Mechanical Properties of the Pore-Filling Type of MHBS
3.1.1. Stress–Strain Response
Four MH saturations ( = 0%, 5%, 10%, and 20%) and three ECPs ( = 2, 4, and 6 MPa) were selected to study the macro-/microscopic mechanical properties of the pore-filling type of MHBS. Figure 2a–d presents the stress–strain relationship () of the pore-filled MHBS under different MH saturations and effective confining pressures. At a given MH saturation level, the deviatoric stress of the MHBS increases as the ECP increases. Increasing the ECP enhances the contact forces between soil particles, resulting in a denser soil structure and increased shear strength. As the ECP increases, the MHBS sample reaches its peak strength, and with the increasing axial strain, the deviatoric strain gradually stabilizes, eventually reaching a critical state.
Figure 3a–c presents the deviatoric stress–axial strain curves of the MHBS obtained from TC tests with different MH saturations at the same ECP. It can be observed that the variation in MH saturation had a minimal influence on the initial stiffness of the MHBS sample. The peak deviatoric stress strengths of the pore-filled MHBS increased with an increase in MH saturation.
Figure 4a–c shows the relationship between stress ratio and axial strain at different MH saturations ( = 0%, 5%, 10%, and 20%) under different ECPs ( =2.0 MPa, 4.0 MPa, and 6.0 MPa). Based on the simulated observations, the peak stress ratio of the MHBS increases gradually with increasing MH saturation. The formation of hydrates in the soil enhances its shear strength. The presence of hydrates reduces the contact area between soil particles, thereby increasing the cohesion of the soil and consequently its strength.
Figure 5 presents the peak strength envelopes on the plane for the pore-filled MHBS samples at different MH saturations. With an increase in hydrate saturation, the slope of the peak strength envelope of the MHBS samples tends to increase. Based on the stress–strain relationships obtained from TC tests on the MHBS samples, the internal friction angle and cohesion of the MHBS samples at different MH saturations could be determined, as shown in Figure 6. The internal friction angle of the pore-filled MHBS samples approximately increased linearly with an increase in MH saturation. However, the trend of cohesion variation for the pore-filling type of MHBS samples with increasing MH saturation is not clear. This is because the hydrate clusters act as a whole to fill the pores of the soil skeleton, where the soil skeleton primarily carries the load. This is consistent with the characteristics of the pore-filled MHBS observed by the reference ([28]), indicating that the contribution of hydrates to the mechanical properties of the pore-filled MHBS samples was mainly in terms of frictional characteristics rather than cementation characteristics.
3.1.2. Volumetric–Axial Strain Response
Figure 7a–e presents the volumetric strain–axial strain curves of MHBS samples with different MH saturations ( = 0%, 5%, 10%, and 20%) under different ECPs ( = 2, 4, and 6 MPa). It can be observed that in Figure 7a–d, at the same MH saturation, the volumetric shrinkage of the MHBS samples becomes more pronounced with increasing ECP. This volume change behavior is qualitatively consistent with previous results ([28]). The sediment endures initially volumetric contraction then volumetric dilatancy. The volumetric strain shows less dilation with increasing ECP at a given axial strain. A higher ECP will strengthen the breakage of MH bonds, then the particles move into the pore space during deformation, decreasing the MHBS dilation.
As shown in Figure 7e, volumetric strain shows marked dilation after an early shear contraction. Under the same axial strain, the phenomenon of shear dilation becomes more pronounced with increasing MH saturation. The presence of MH thus enhances dilation. As the MH saturation increases, this results in an increase in the contact area between soil particles and an increase in the interparticle contact forces. Additionally, the presence of hydrate clusters provides resistance to shear deformation. Therefore, as the hydrate saturation increases, the soil becomes more resistant to deformation under shear stress, leading to a more pronounced shear dilation phenomenon.
3.1.3. Critical State
Figure 8 shows the relations between the deviatoric stress and the mean principal stress of MHBS. It can be seen that as the MH saturation increases, the slope of the critical state line of the MHBS specimen also increases. By fitting the data from Figure 8, the variation of the critical-state stress ratio of the MHBS specimen with MH saturation can be plotted, as illustrated in Figure 9. It can be observed that as the MH saturations increase, the critical-state stress ratio of the MHBS also increases.
The critical-state shear stress ratio is expressed in a nonlinear relationship with MH saturation, as shown in the following equation:
where is the critical stress ratio of the MHBS at a given MH saturation, is the critical-state stress ratio of the MHBS sample indicating zero hydrate saturation, and are the model parameters, and is the parameter that considers the presence of MH in the MHBS and the influence of the mechanical properties of the critical state of the soil sample. , , and can be obtained based on Equation (5).
Figure 10 shows the critical state lines of the MHBS specimens on a plane of at different MH saturations ( = 0%, 5%, 10%, and 20%). It can be observed that the critical state lines of the MHBS specimens slightly shift upward with increasing MH saturation. The following equation was used for fitting:
where is the standard atmospheric pressure, 1.01 × 10⁵ Pa, and .
When the average principal stress is taken at the standard atmospheric pressure, the reference pore ratio at the critical state under different MH saturations can be obtained, as shown in Figure 11. The relations between the critical-state void ratio and MH saturation are fitted using the following formula:
where , , and represent the model parameters, taking , , and , respectively. considers the influence of MH presence on the critical-state mechanical properties of the MHBS specimens.
3.1.4. Dilatancy
The dilatancy index is stated as follows ([44,45]):
where is the change in volumetric strain and is the increment in the equivalent deviatoric strain.
Figure 12a–d represents the stress ratio and dilatancy of the pore-filled MHBS samples with MH saturation under different ECPs. The stress ratio increases nonlinearly with increasing dilatancy, and then the growth rate gradually decreases. Under the same hydrate saturation, it increases with the increase in ECP. When the peak intensity is reached, the stress ratio is reduced and still maintains a certain growth. Subsequently, the stress ratio is reduced and ultimately fluctuates in the critical state.
3.2. Micro-Mechanical Properties of the Pore-Filled MHBS
3.2.1. Fabric Component
A unit normal contact, , is defined as the normal to the tangent plane of the contact. When the diagonal elements, i.e., , , and , are equal, this indicates isotropy in the spatial distribution of contact directions. A higher value indicates a greater tendency for the contact directions to be distributed in that specific direction. The strong normal contact force, , is stated as those forces equal to and larger than the average on every particle, with the respective contacts indexed as , isolating the response of the strong and weak force network. The unit normal vector for the strong contacts is calculated as follows ([40,45]):
where is the number of the strong contacts and is the component of the unit vector at a strong contact.
The mean strong contact is used to calculate using the following equation:
Then, the anisotropic enhancement coefficient, , is used as follows:
Figure 13 shows three principal values of fabric components (, , and ), strong fabric components (, and ), and of the pore-filled MHBS plotted against axial strain under = 2.0 MPa and with the growth of axial strain.
.
In Figure 13a, the major principal value, , of the contact fabric tensor initially increases with the growth of axial strain. As the axial strain increases, slightly decreases and gradually approaches a stable value. On the other hand, the intermediate principal value, , and the minor principal value, , of the contact fabric tensor decrease initially with the increase in axial strain and then slightly increase towards a stable state. For the strong contact fabric tensor illustrated in Figure 13b, the trend of the major principal value with axial strain development is qualitatively similar to that of the regular contact fabric tensor. However, the variation of is more pronounced, and the stable value of the major principal value in the strong contact fabric tensor is significantly higher than that of the regular contact fabric tensor. The values of and decrease initially with the increase in axial strain and then increase slightly with further axial strain development, approaching a stable state. Figure 13c illustrates the variation of the anisotropic enhancement coefficient, , for the strong contact fabric with axial strain. The value of initially increases to a peak value with the increase in axial strain and then decreases gradually with further axial strain, indicating a softening behavior in the anisotropic enhancement coefficient. The observed pattern of the anisotropic enhancement coefficient aligns with the increases in deviatoric stress and axial strain in the MHBS specimen, illustrated in Figure 3, demonstrating a strain-softening characteristic.
3.2.2. Contact Rose Diagram
Figure 14, Figure 15 and Figure 16 show the distribution of contact normal vectors and strong contact normal vectors projected on the x–y, x–z, and y–z planes with = 2.0 MPa and under different axial strains (, , and ). In the x–y plane, the contact point fabric of the specimen is relatively uniformly distributed. However, in the x–z and y–z planes, the proportion of horizontally oriented strong contact fabric decreases, while the proportion of vertically oriented contact points significantly increases. The strong contact fabric exhibits a higher proportion of vertical contact points in the x–z and y–z planes, while the proportion of horizontal contact points decreases. The major principal value of the strong contact fabric tensor in the MHBS specimen is significantly greater than that of the regular contact fabric tensor.
3.2.3. Coordination and Mechanical Coordination Number
The coordination number (CN) of a particle represents the number of contacts it has with surrounding particles. The average coordination number is usually calculated as follows ([46]):
where C is the number of contacts and N is the number of particles.
During the shearing process of granular material specimens, there may exist particles that have only one contact or no contacts. These contacts do not contribute to the load transfer within the particle system and do not contribute to the resistance against external forces. Therefore, a mechanical coordination number (MCN) is defined as:
where and are the numbers of particles with only one or no contacts, respectively.
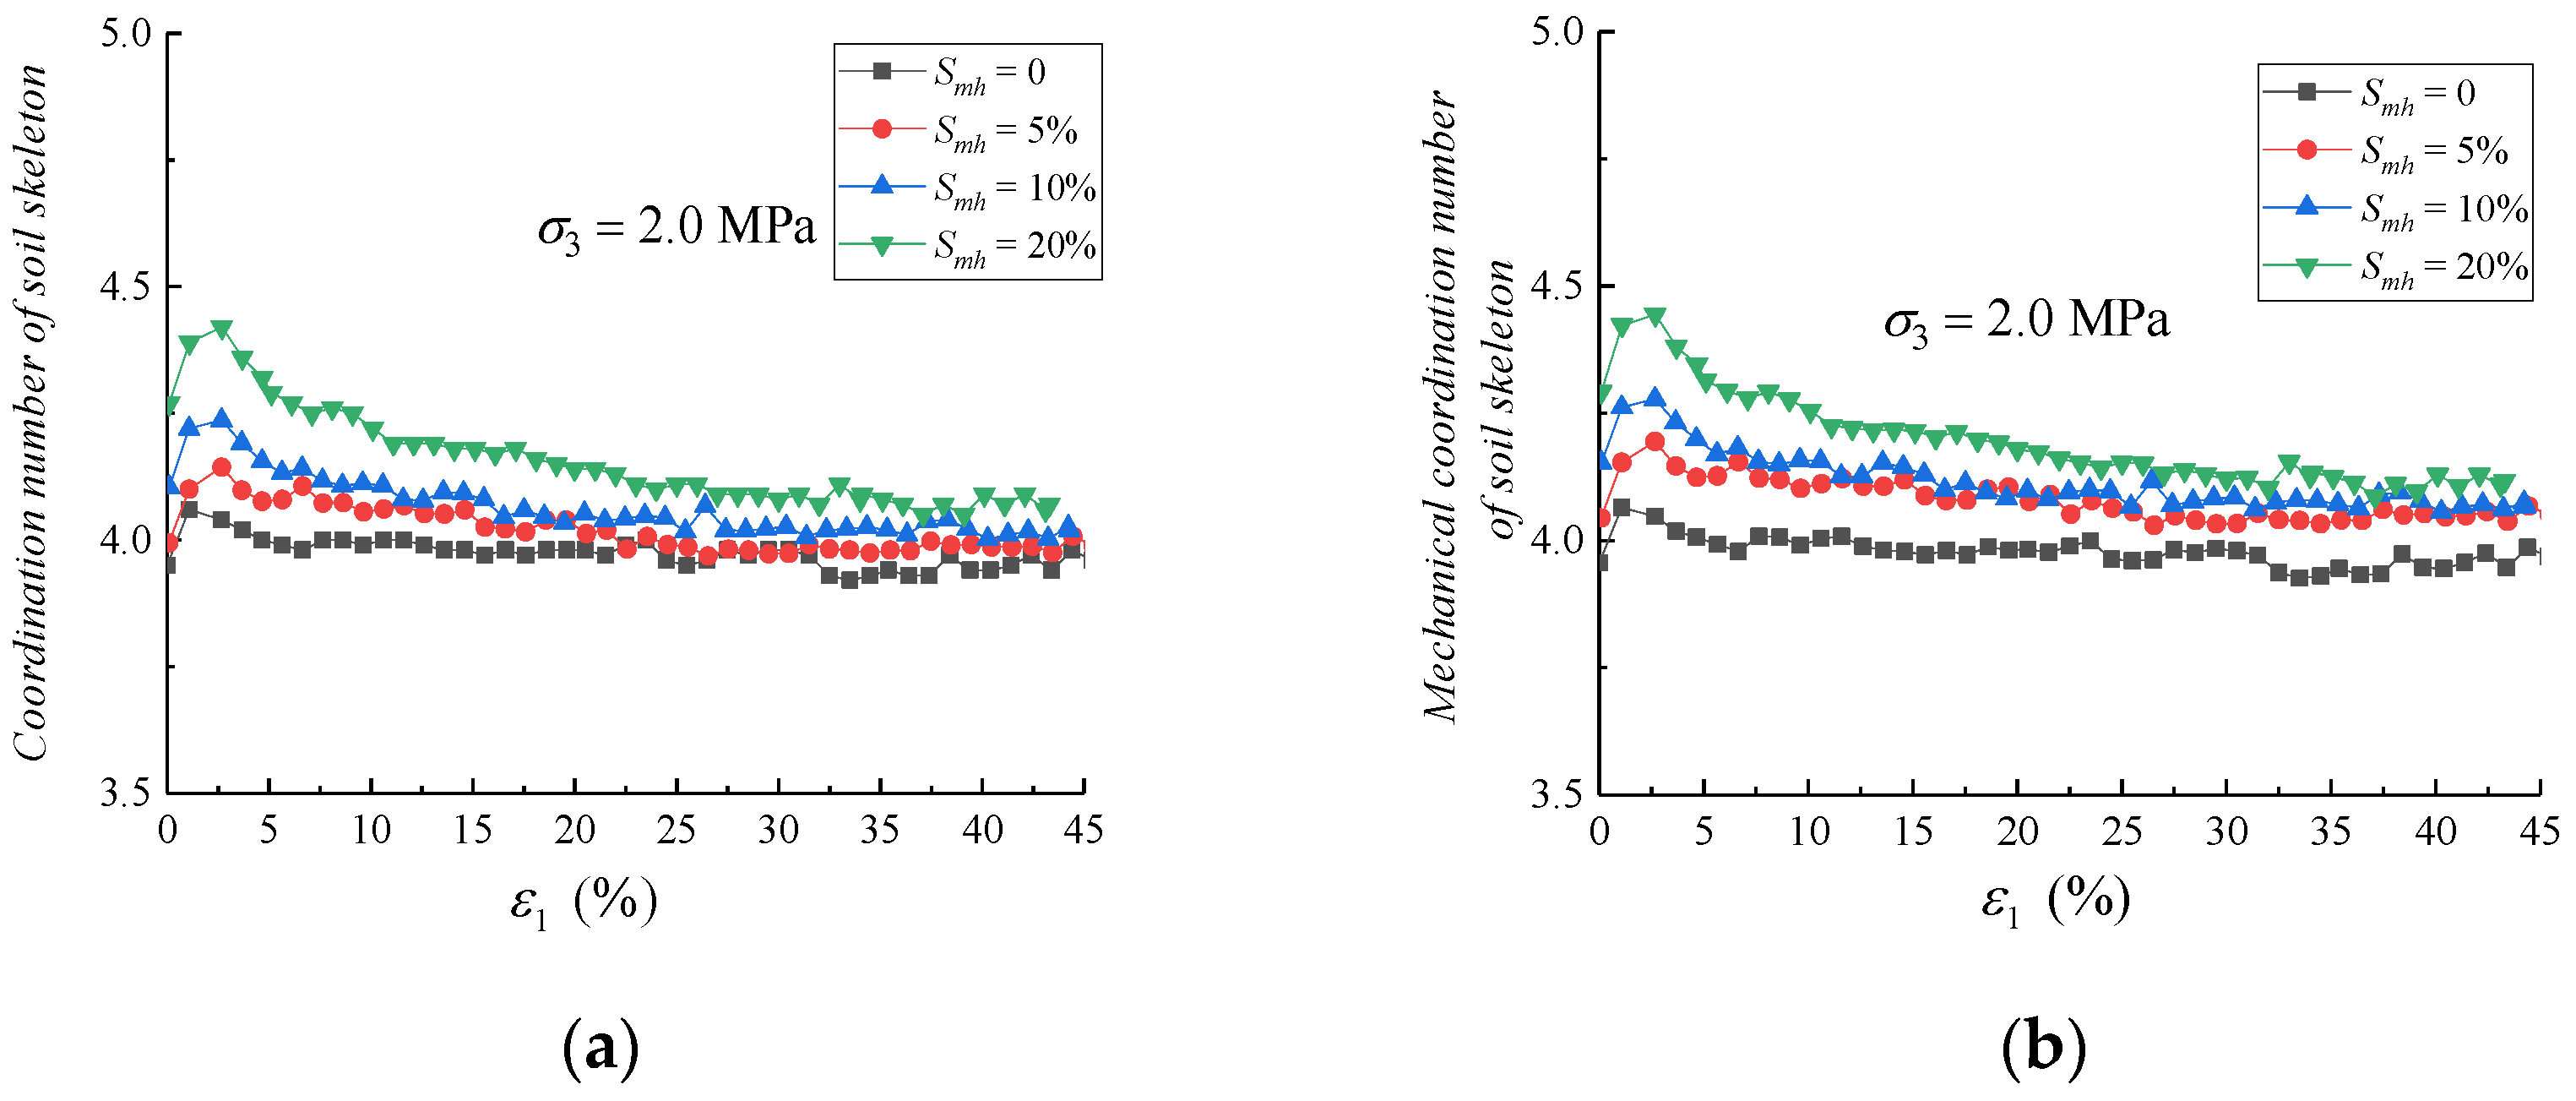
Figure 17a,b shows the CN and MCN of the soil skeleton in the pore-filling type of MHBS with under different confining pressures. As the axial strain increases, the CN and MCN of the soil skeleton initially increase to a peak value, then decrease and gradually reach a stable state. The values of and increase as the value of ECPs increases. Figure 18a,b shows the CN and MCN of the soil skeleton in the pore-filling type of MHBS under different MH saturations. The CN and MCN of the soil skeleton initially increase to a peak value, then decrease and gradually lead to a stable state. The values of and increase with an increase in the value of MH saturations.
4. Discussion
Gas hydrates have different occurrence modes, i.e., pore-filling type, supporting matrix, cementation, coating, etc. Thus, different occurrence modes will have different influences on the mechanical and deformation properties of MHBS. This paper only studies one of the modes, i.e., pore-filled MHBS. Other modes and the existence of mixtures of different modes still need further research. This is a work of basic research, and its future application lies in the formulation of a constitutive theory of MHBS and large-scale boundary issues.
5. Conclusions
A series of TC tests was carried out using the DEM under different ECPs and MH saturations. The macro-/micro-mechanical properties of the pore-filling type of MHBS were analyzed by linking the evolution of micro-mechanical parameters to the macro-scale behavior of the granular material. The main conclusions are as follows:
(1) There is a good correlation between fabric changes of the MHBS with the variations in principal stresses and principal strains.
(2) The slope of the critical lines of the pore-filled MHBS increases as the MH saturation increases.
(3) The stress ratio increases nonlinearly with increasing dilatancy, and then the growth rate gradually decreases.
(4) The deviator stress causes anisotropy as the proportion of vertical contact points tends to increase and produce a vertical deflection.
(5) The CN and MCN of MHBS increase as the ECPs and MH saturations increase.
Author Contributions
Writing—original draft, J.H.; Writing—review & editing, T.L. and Y.R. All authors have read and agreed to the published version of the manuscript.
Funding
The research was funded by the China Postdoctoral fund (No. 2019M651580).
Data Availability Statement
Data associated with this research are available from the corresponding author upon reasonable request.
Conflicts of Interest
The authors declare that they have no known competing financial interests or personal relationships that could have appeared to influence the work reported in this paper.
References
- Kvenvolden, K.A.; Lorenson, T.D. The global occurrence of natural gas hydrate. Geophys. Monogr. 2001, 124, 3–18. [Google Scholar]
- Kim, H.S.; Cho, G.C.; Lee, J.Y.; Kim, S.J. Geotechnical and geophysical properties of deep marine fine-grained sediments recovered during the second Ulleung Basin Gas Hydrate expedition, East Sea, Korea. Mar. Pet. Geol. 2013, 47, 56–65. [Google Scholar] [CrossRef]
- Konno, Y.; Fujii, T.; Sato, A.; Akamine, K.; Naiki, M.; Masuda, Y.; Yamamoto, K.; Nagao, J. Key findings of the world’s first offshore methane hydrate production test off the coast of Japan: Toward future commercial production. Energy Fuels 2017, 31, 2607–2616. [Google Scholar] [CrossRef]
- Bazaluk, O.; Sai, K.; Lozynskyi, V.; Petlovanyi, M.; Saik, P. Research into Dissociation Zones of Gas Hydrate Deposits with a Heterogeneous Structure in the Black Sea. Energies 2021, 14, 1345. [Google Scholar] [CrossRef]
- Chibura, P.E.; Zhang, W.; Luo, A.; Wang, J. A review on gas hydrate production feasibility for permafrost and marine hydrates. J. Nat. Gas Sci. Eng. 2022, 100, 104441. [Google Scholar] [CrossRef]
- Pedchenko, M.; Pedchenko, L.; Nesterenko, T.; Dyczko, A. Technological solutions for the realization of NGH-technology for gas transportation and storage in gas hydrate form. Solid State Phenom. 2018, 277, 123–136. [Google Scholar] [CrossRef]
- Klymenko, V.; Ovetskyi, S.; Martynenko, V.; Vytiaz, O.; Uhrynovskyi, A. An alternative method of methane production from deposits of subaquatic gas hydrates. Min. Miner. Depos. 2022, 16, 11–17. [Google Scholar] [CrossRef]
- Aladko, E.Y.; Dyadin, Y.A.; Fenelonov, V.B.; Larionov, E.G.; Mel’Gunov, M.S.; Manakov, A.Y.; Nesterov, A.N.; Zhurko, F.V. Dissociation conditions of methane hydrate in mesoporous silica gels in wide ranges of pressure and water content. J. Phys. Chem. B 2004, 108, 16540–16547. [Google Scholar] [CrossRef]
- Hyodo, M.; Yoneda, J.; Yoshimoto, N.; Nakata, Y. Mechanical and dissociation properties of methane hydrate-bearing sand in deep seabed. Soils Found. 2013, 53, 299–314. [Google Scholar] [CrossRef]
- Hyodo, M.; Li, Y.; Yoneda, J.; Nakata, Y.; Yoshimoto, N.; Nishimura, A. Effects of dissociation on the shear strength and deformation behavior of methane hydrate-bearing sediments. Mar. Pet. Geol. 2014, 51, 52–62. [Google Scholar] [CrossRef]
- Priest, J.A.; Clayton, C.R.I.; Rees, E.V.L. Potential impact of gas hydrate and its dissociation on the strength of host sediment in the Krishna–Godavari Basin. Mar. Pet. Geol. 2014, 58, 187–198. [Google Scholar] [CrossRef]
- Handwerger, A.L.; Rempel, A.W.; Skarbek, R.M. Submarine landslides triggered by destabilization of high-saturation hydrate anomalies. Geochem. Geophys. Geosyst. 2017, 18, 2429–2445. [Google Scholar] [CrossRef]
- Song, B.; Cheng, Y.; Yan, C.; Han, Z.; Ding, J.; Li, Y.; Wei, J. Influences of hydrate decomposition on submarine landslide. Landslides 2019, 16, 2127–2150. [Google Scholar] [CrossRef]
- Nian, T.K.; Song, X.L.; Zhao, W.; Jiao, H.B.; Guo, X.S. Submarine slope failure due to overpressure fluid associated with gas hydrate dissociation. Environ. Geotech. 2020, 9, 108–123. [Google Scholar] [CrossRef]
- Zhao, Y.; Kong, L.; Liu, L.; Liu, J. Influence of hydrate exploitation on stability of submarine slopes. Nat. Hazards 2022, 113, 719–743. [Google Scholar] [CrossRef]
- Waite, W.F.; Santamarina, J.C.; Cortes, D.D.; Dugan, B.; Espinoza, D.N.; Germaine, J.; Jang, J.; Jung, J.W.; Kneafsey, T.J.; Shin, H.; et al. Physical properties of hydrate-bearing sediments. Rev. Geophys. 2009, 47. [Google Scholar] [CrossRef]
- He, J.; Blumenfeld, R.; Zhu, H. Mechanical Behaviors of Sandy Sediments Bearing Pore-Filling Methane Hydrate under Different Intermediate Principal Stress. Int. J. Geomech. 2021, 21, 04021043. [Google Scholar] [CrossRef]
- He, J.; Zhu, H.; Zhou, M. DEM-Based Study on the Mechanical Behaviors of Pore-Filling MHBS under Drained True Triaxial Conditions Varying the Intermediate Stress Ratio of Constant Mean Effective Stresses. Int. J. Geomech. 2022, 22, 04022132. [Google Scholar] [CrossRef]
- Cohen, E.; Klar, A. Micromechanical modeling of the effect of dissociation on the mechanical response of hydrate-bearing sediments. Granul. Matter 2022, 24, 84. [Google Scholar] [CrossRef]
- Miyazaki, K.; Masui, A.; Sakamoto, Y.; Aoki, K.; Tenma, N.; Yamaguchi, T. Triaxial compressive properties of artificial methane-hydrate-bearing sediment. J. Geophys. Res. 2011, 116, B06102. [Google Scholar] [CrossRef]
- Choi, J.H.; Dai, S.; Lin, J.S.; Seol, Y. Multistage Triaxial Tests on Laboratory-Formed Methane Hydrate-Bearing Sediments. J. Geophy. Res. Solid Earth 2018, 123, 3347–3357. [Google Scholar] [CrossRef]
- Wang, L.; Sun, X.; Shen, S.; Wu, P.; Liu, T.; Liu, W.; Zhao, J.; Li, Y. Undrained triaxial tests on water-saturated methane hydrate–bearing clayey-silty sediments of the South China Sea. Can. Geotech. J. 2021, 58, 351–366. [Google Scholar] [CrossRef]
- Desrues, J.; Viggiani, G. Strain localization in sand: An overview of the experimental results obtained in Grenoble using stereophotogrammetry. Int. J. Numer. Anal. Methods Geomech. 2004, 28, 279–321. [Google Scholar] [CrossRef]
- Thornton, C.; Zhang, L. A numerical examination of shear banding and simple shear non-coaxial flow rules. Philos. Mag. 2006, 86, 3425–3452. [Google Scholar] [CrossRef]
- Jin, S.; Nagao, J.; Takeya, S.; Jin, Y.; Hayashi, J.; Kamata, Y.; Ebinuma, T.; Narita, H. Structure investigation of methane hydrate sediments by microfocus X-ray computed tomography technique under high-pressure conditions. J. Appl. Phys. 2006, 45, L714. [Google Scholar] [CrossRef]
- Kerkar, P.B.; Horvat, K.; Jones, K.W.; Mahajan, D. Imaging methane hydrates growth dynamics in porous media using synchrotron X-ray computed microtomography. Geochem. Geophys. Geosyst. 2014, 15, 4759–4768. [Google Scholar] [CrossRef]
- Priest, J.A.; Rees, E.V.L.; Clayton, C.R.I. Influence of gas hydrate morphology on the seismic velocities of sands. J. Geophys. Res. 2009, 114, B11205. [Google Scholar] [CrossRef]
- Brugada, J.; Cheng, Y.P.; Soga, K.; Santamarina, J.C. Discrete element modelling of geomechanical behaviour of methane hydrate soils with pore-filling hydrate distribution. Granul. Matter 2010, 12, 517–525. [Google Scholar] [CrossRef]
- Dai, S.; Santamarina, J.C.; Waite, W.F.; Kneafsey, T.J. Hydrate morphology: Physical properties of sands with patchy hydrate saturation. J. Geophy. Res. Solid Earth 2012, 117. [Google Scholar] [CrossRef]
- Katagiri, J.; Konno, Y.; Yoneda, J.; Tenma, N. Pore-scale modeling of flow in particle packs containing grain-coating and pore-filling hydrates: Verification of a Kozeny–Carman-based permeability reduction model. J. Nat. Gas Sci. Eng. 2017, 45, 537–551. [Google Scholar] [CrossRef]
- Yan, R.; Yan, M.; Yu, H.; Yang, D. Influence of Temperature and Pore Pressure on Geomechanical Behavior of Methane Hydrate-Bearing Sand. Int. J. Geomech. 2022, 22, 04022201. [Google Scholar] [CrossRef]
- Li, T.; Li, L.; Liu, J.; Zhou, H. Influence of hydrate participation on the mechanical behaviour of fine-grained sediments under one-dimensional compression: A DEM study. Granul. Matter 2022, 24, 32. [Google Scholar] [CrossRef]
- Cundall, P.A.; Strack, O.D.L. The distinct numerical model for granular assemblies. Géotechnique 1979, 29, 47–65. [Google Scholar] [CrossRef]
- Wang, J.; Gutierrez, M.S. Discrete element simulation of direct shear specimen scale effects. Géotechnique 2010, 60, 395–409. [Google Scholar] [CrossRef]
- Estrada, N.; Taboada, A. Yield surfaces and plastic potentials of cemented granular materials from discrete element simulations. Comput. Geotech. 2013, 49, 62–69. [Google Scholar] [CrossRef]
- Ding, Y.; Qian, A.; Lu, H.; Li, Y.; Zhang, Y. DEM investigation of the effect of hydrate morphology on the mechanical properties of hydrate-bearing sands. Comput. Geotech. 2022, 143, 104603. [Google Scholar] [CrossRef]
- Huang, X.; Hanley, K.J.; O’Sullivan, C.; Kwok, C.Y. Exploring the influence of interparticle friction on critical state behaviour using DEM. Int. J. Numer. Anal. Methods Geomech. 2014, 38, 1276–1297. [Google Scholar] [CrossRef]
- Tziachris, P.; Aschonitis, V.; Chatzistathis, T.; Papadopoulou, M. Assessment of spatial hybrid methods for predicting soil organic matter using DEM derivatives and soil parameters. Catena 2019, 174, 206–216. [Google Scholar] [CrossRef]
- Khosravi, A.; Martinez, A.; DeJong, J.T. Discrete element model (DEM) simulations of cone penetration test (CPT) measurements and soil classification. Can. Geotech. J. 2020, 57, 1369–1387. [Google Scholar] [CrossRef]
- Li, Y.; Song, Y.; Liu, W.; Yu, F. Experimental research on the mechanical properties of methane hydrate-ice mixtures. Energies 2012, 5, 181–192. [Google Scholar] [CrossRef]
- Potyondy, D.O.; Cundall, P.A. A bonded-particle model for rock. Int. J. Rock. Mech. Min. 2004, 41, 1329–1364. [Google Scholar] [CrossRef]
- Wang, J.; Yan, H. On the role of particle breakage in the shear failure behavior of granular soils by DEM. Int. J. Numer. Anal. Methods Geomech. 2011, 37, 832–854. [Google Scholar] [CrossRef]
- Sun, D.A.; Huang, W.X.; Yao, Y.P. An experimental study of failure and softening in sand under three-dimensional stress condition. Granul. Matter 2008, 10, 187–195. [Google Scholar] [CrossRef]
- Roscoe, K.H. The influence of strains in soil mechanics. Geotechnique 1970, 20, 129–170. [Google Scholar] [CrossRef]
- Li, X.S.; Dafalias, Y.F. Dilatancy for cohesionless soils. Géotechnique 2000, 50, 449–460. [Google Scholar] [CrossRef]
- Thornton, C. Numerical simulations of deviatoric shear deformation of granular media. Géotechnique 2000, 50, 43–53. [Google Scholar] [CrossRef]
Figure 1.
A DEM specimen of MHBS with PSD ([37]) (a) PSD (b) MHBS specimen.
Figure 1.
A DEM specimen of MHBS with PSD ([37]) (a) PSD (b) MHBS specimen.
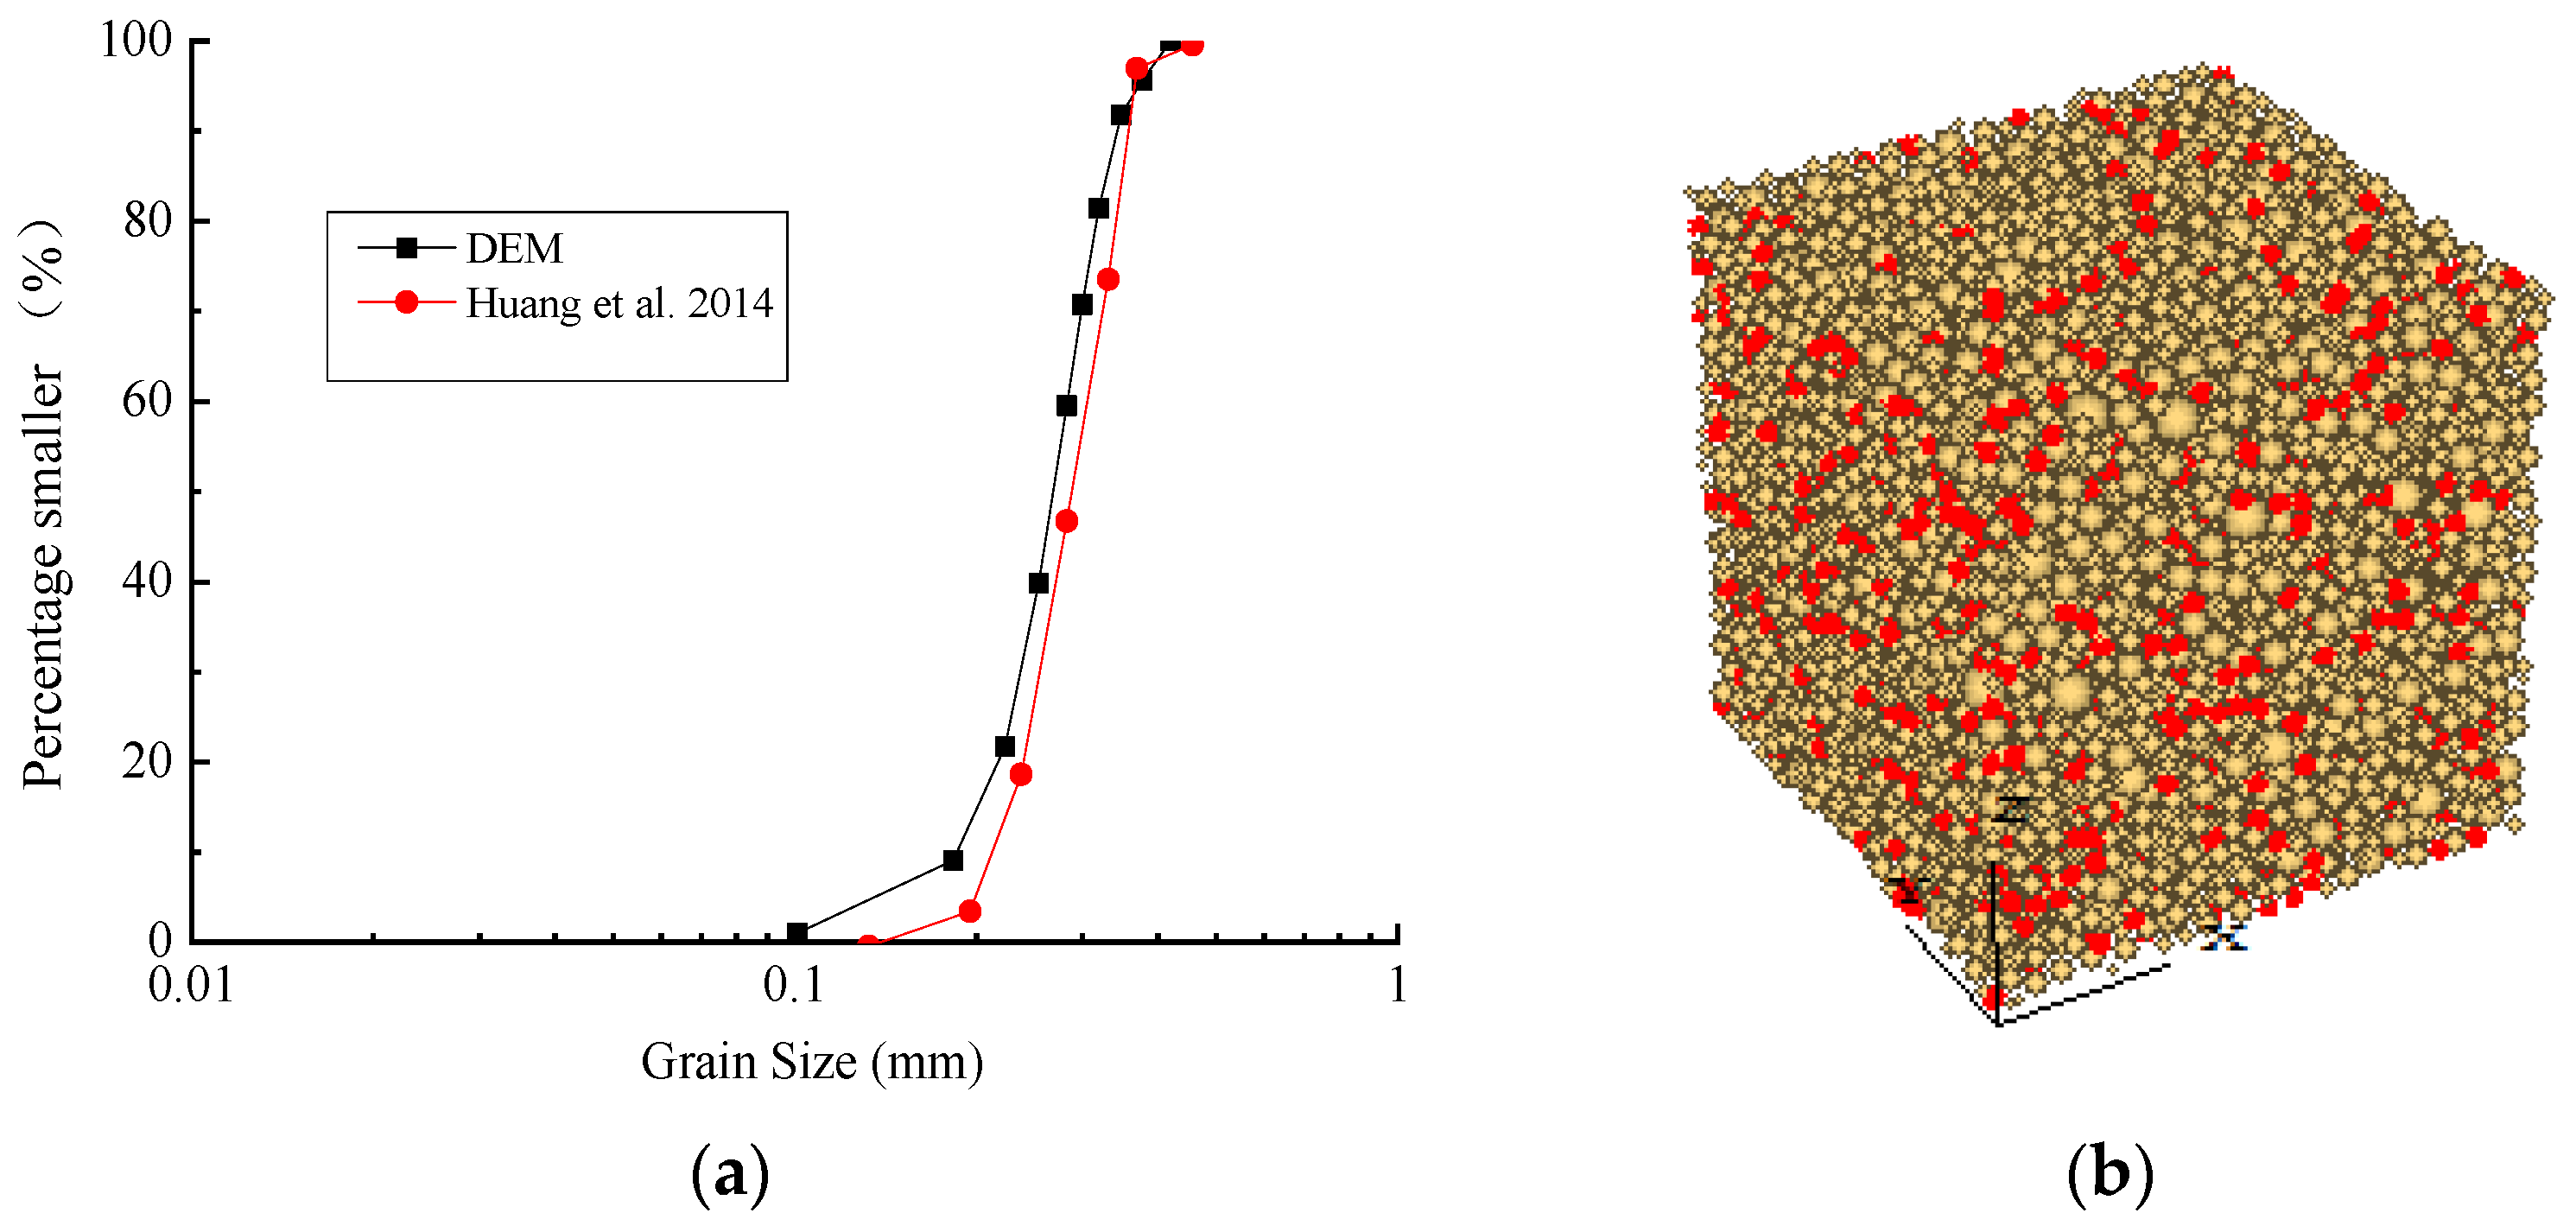
Figure 2.
Deviator stress–axial strain of the pore-filled MHBS with MH saturations under different ECPs in the DEM simulations (a) = 0 (b) = 5% (c) = 10% (d) = 20%.
Figure 2.
Deviator stress–axial strain of the pore-filled MHBS with MH saturations under different ECPs in the DEM simulations (a) = 0 (b) = 5% (c) = 10% (d) = 20%.
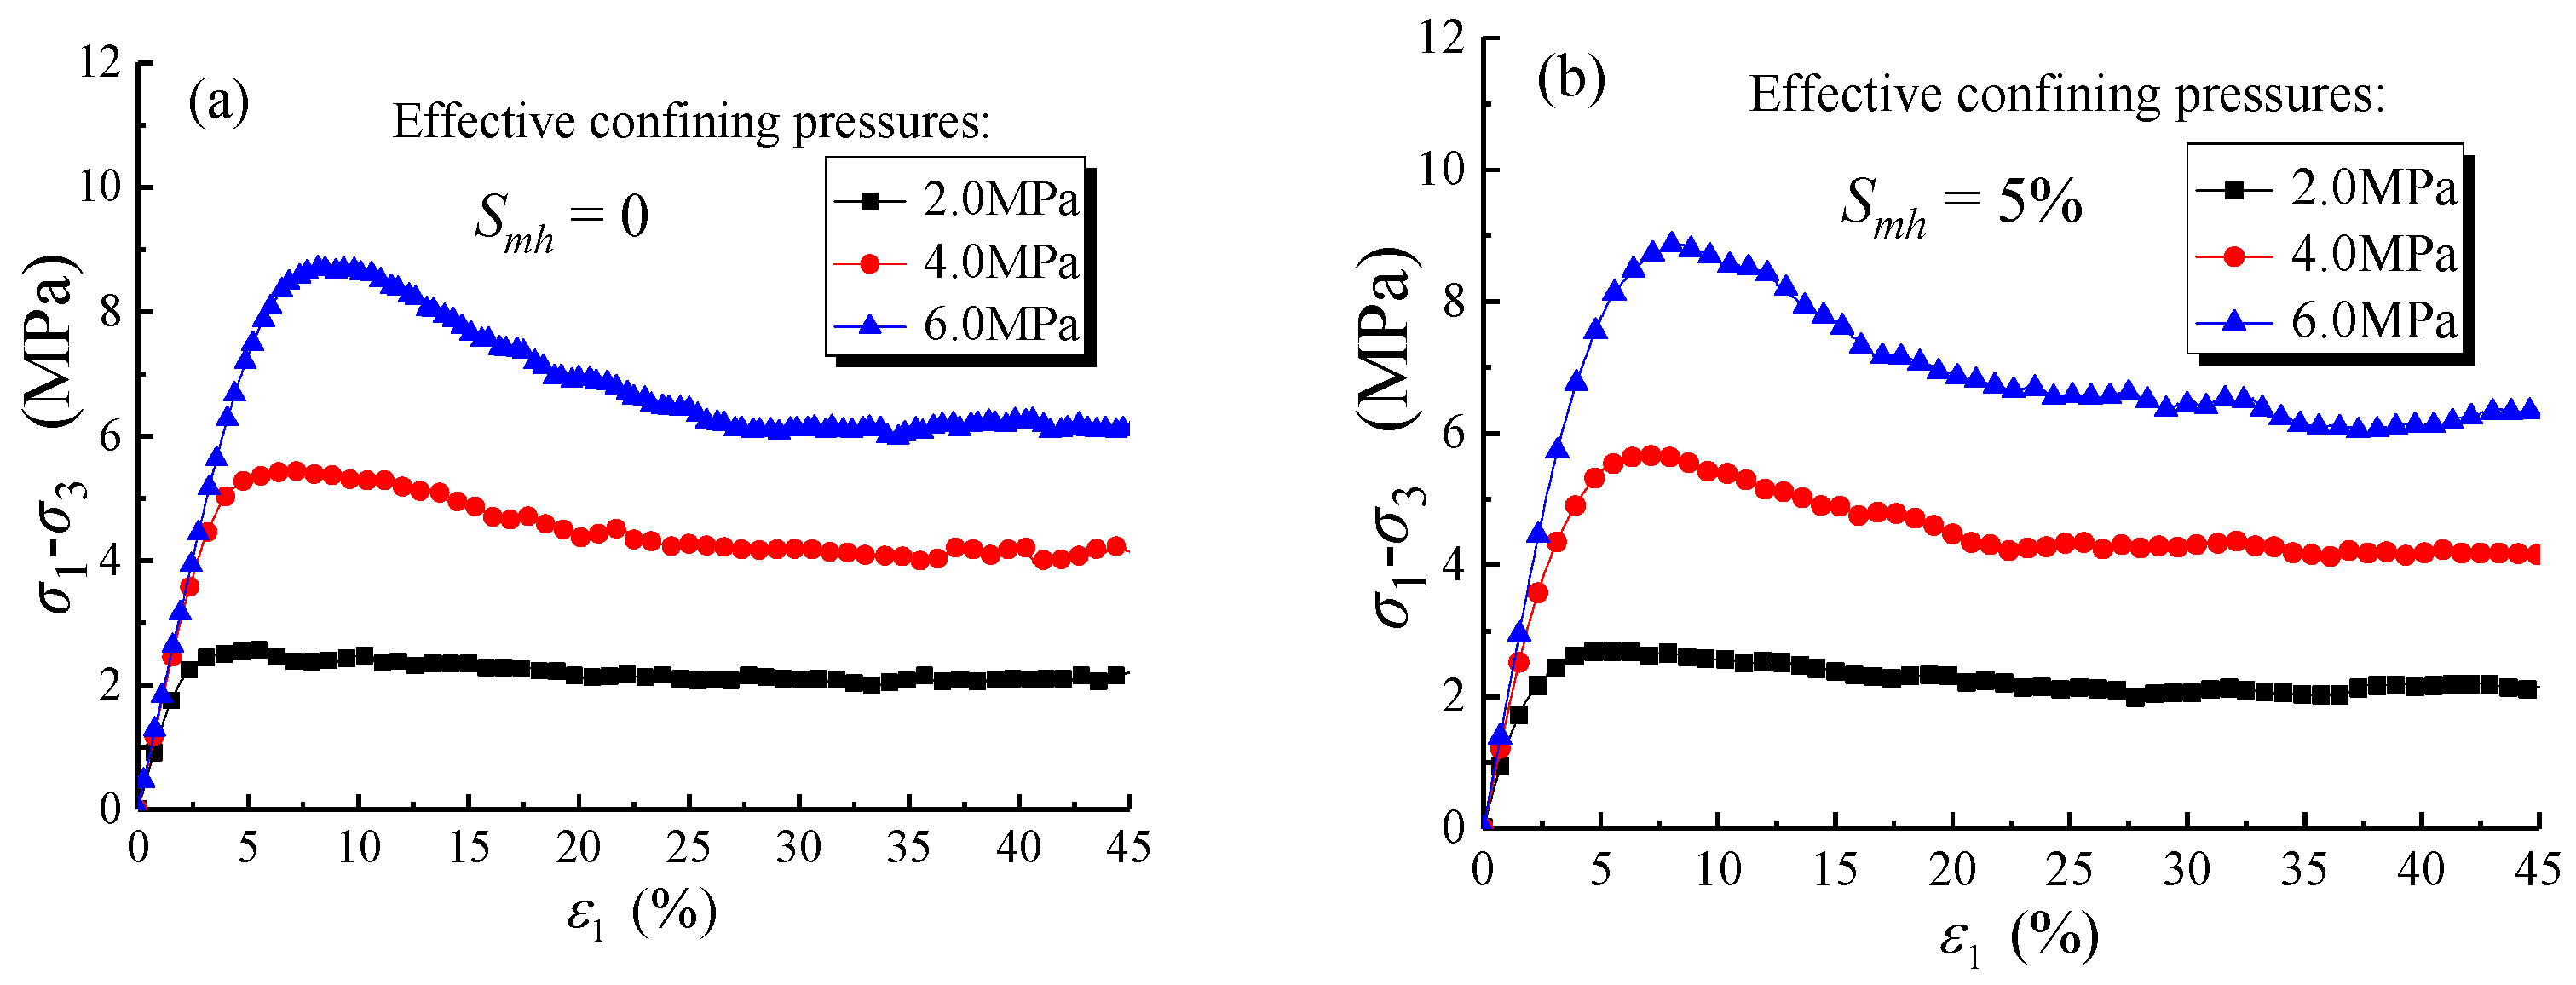
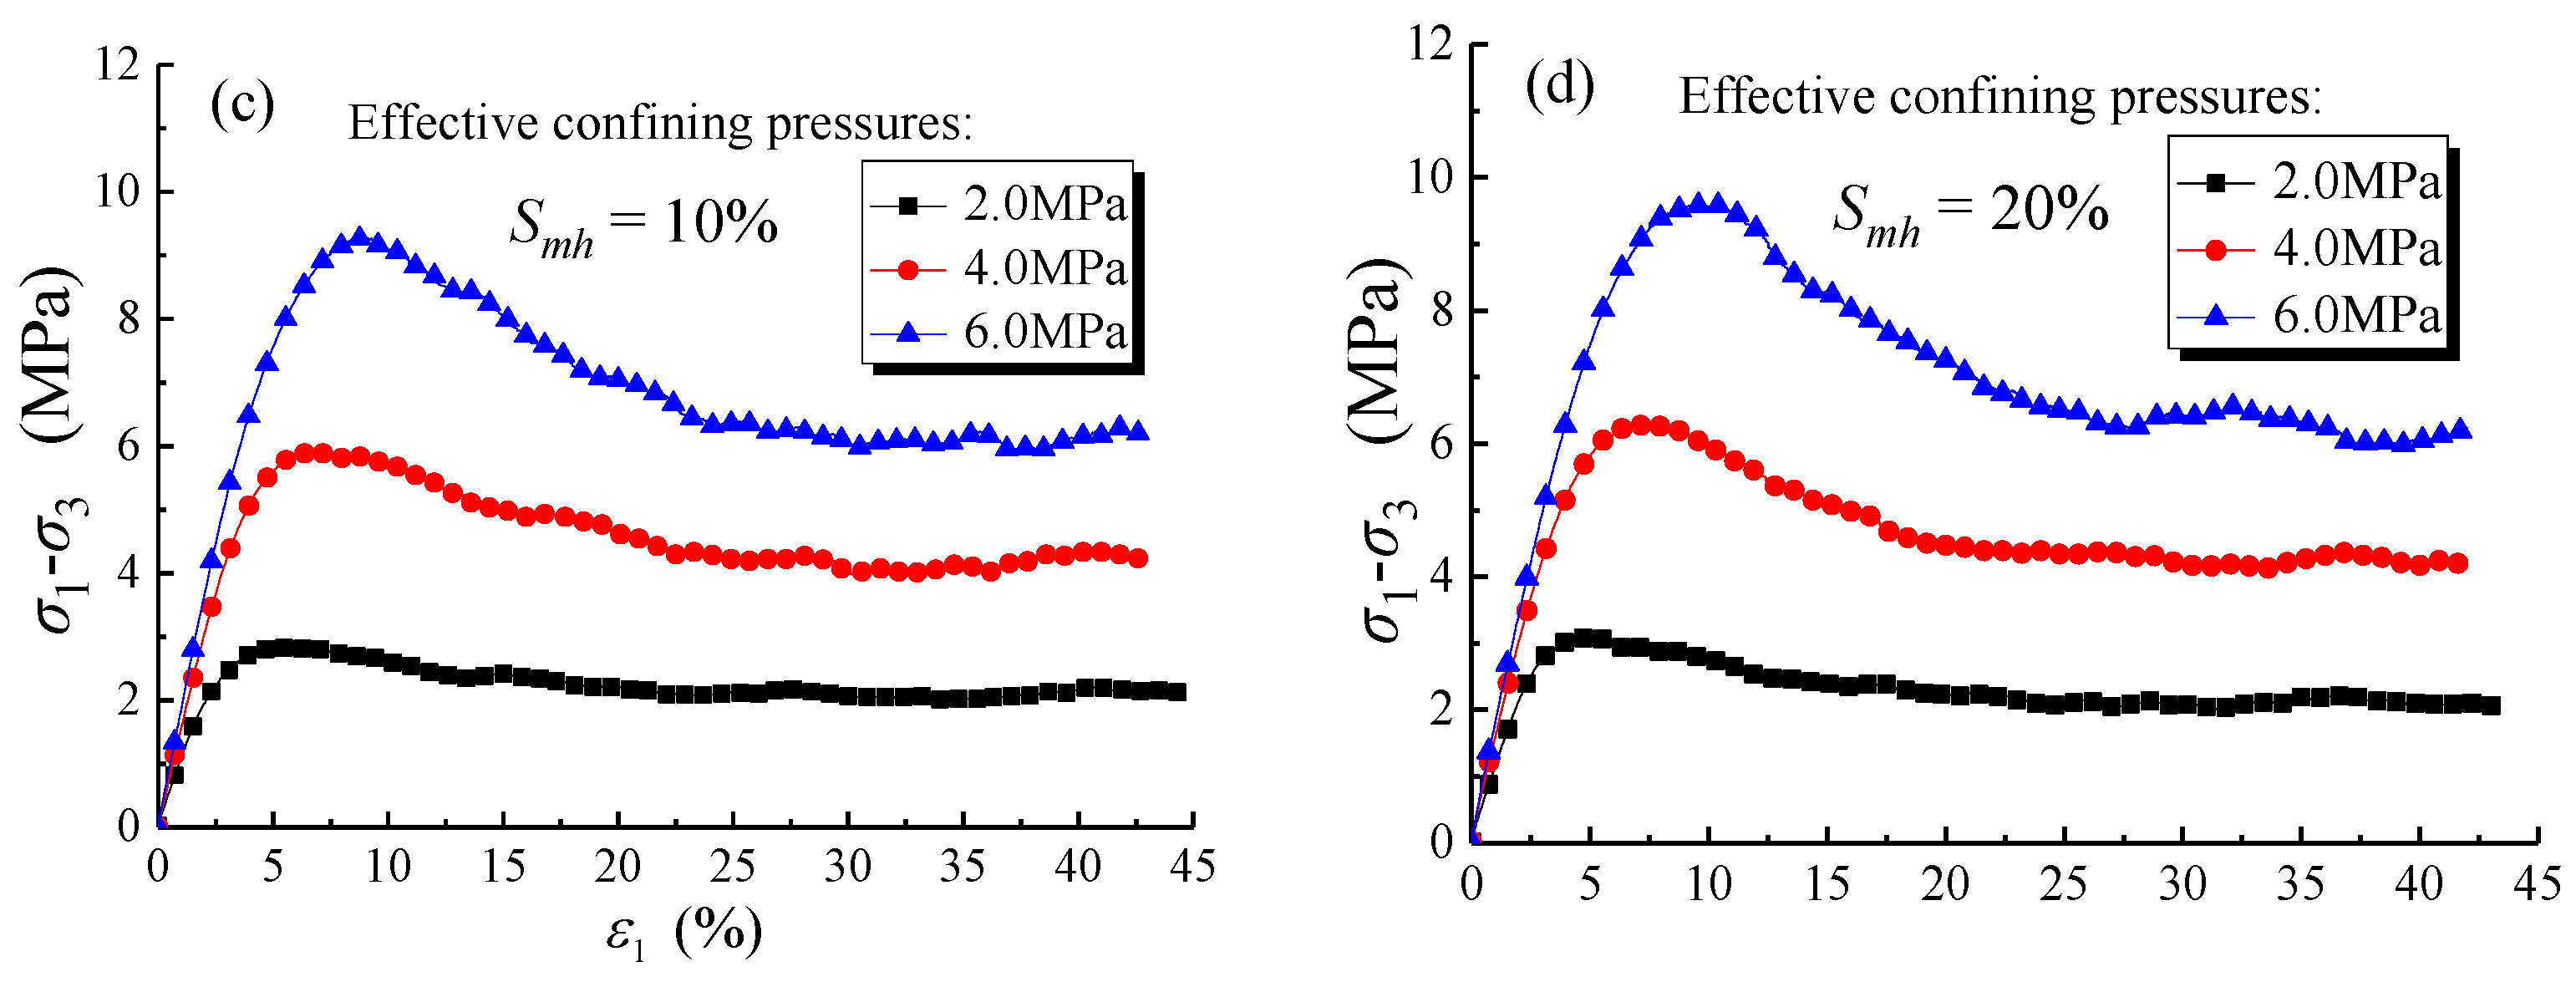
Figure 3.
Deviator stress–axial strain of the pore-filled MHBS with different ECPs in the DEM simulations (a) (b) (c) .
Figure 3.
Deviator stress–axial strain of the pore-filled MHBS with different ECPs in the DEM simulations (a) (b) (c) .
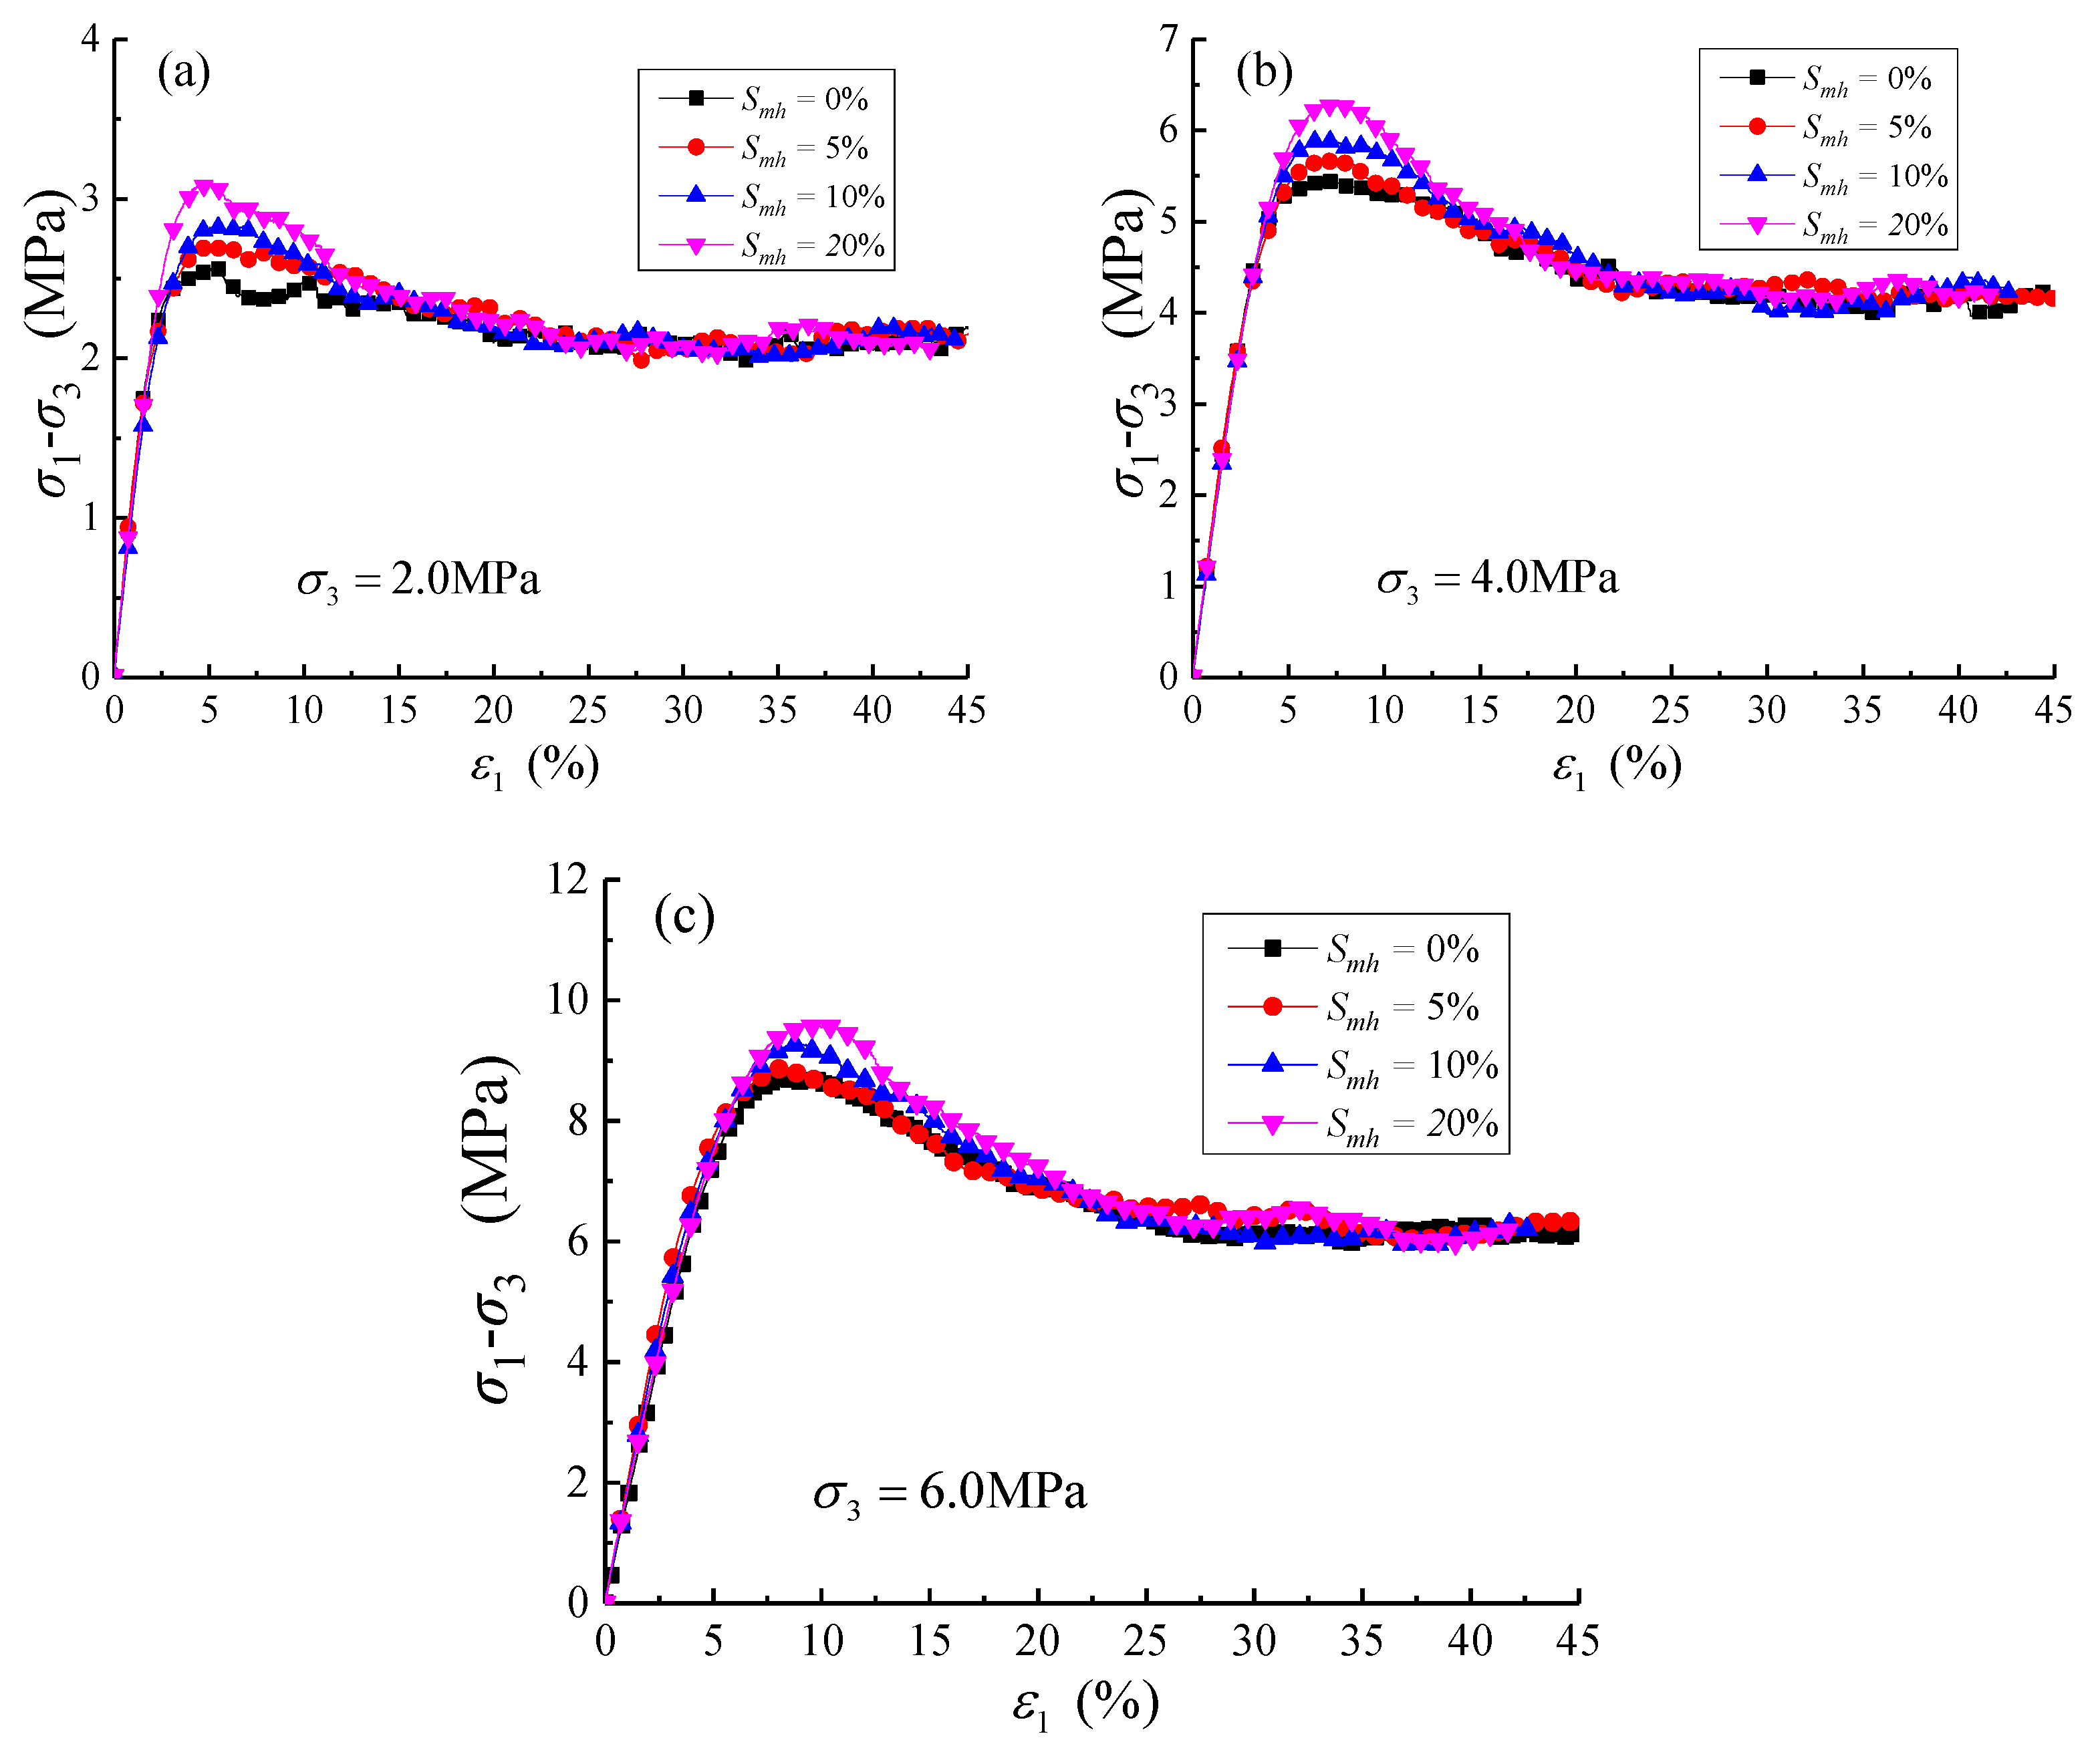
Figure 4.
Stress ratio–axial strain of the pore-filled MHBS with different ECPs in the DEM simulations (a) (b) (c) .
Figure 4.
Stress ratio–axial strain of the pore-filled MHBS with different ECPs in the DEM simulations (a) (b) (c) .
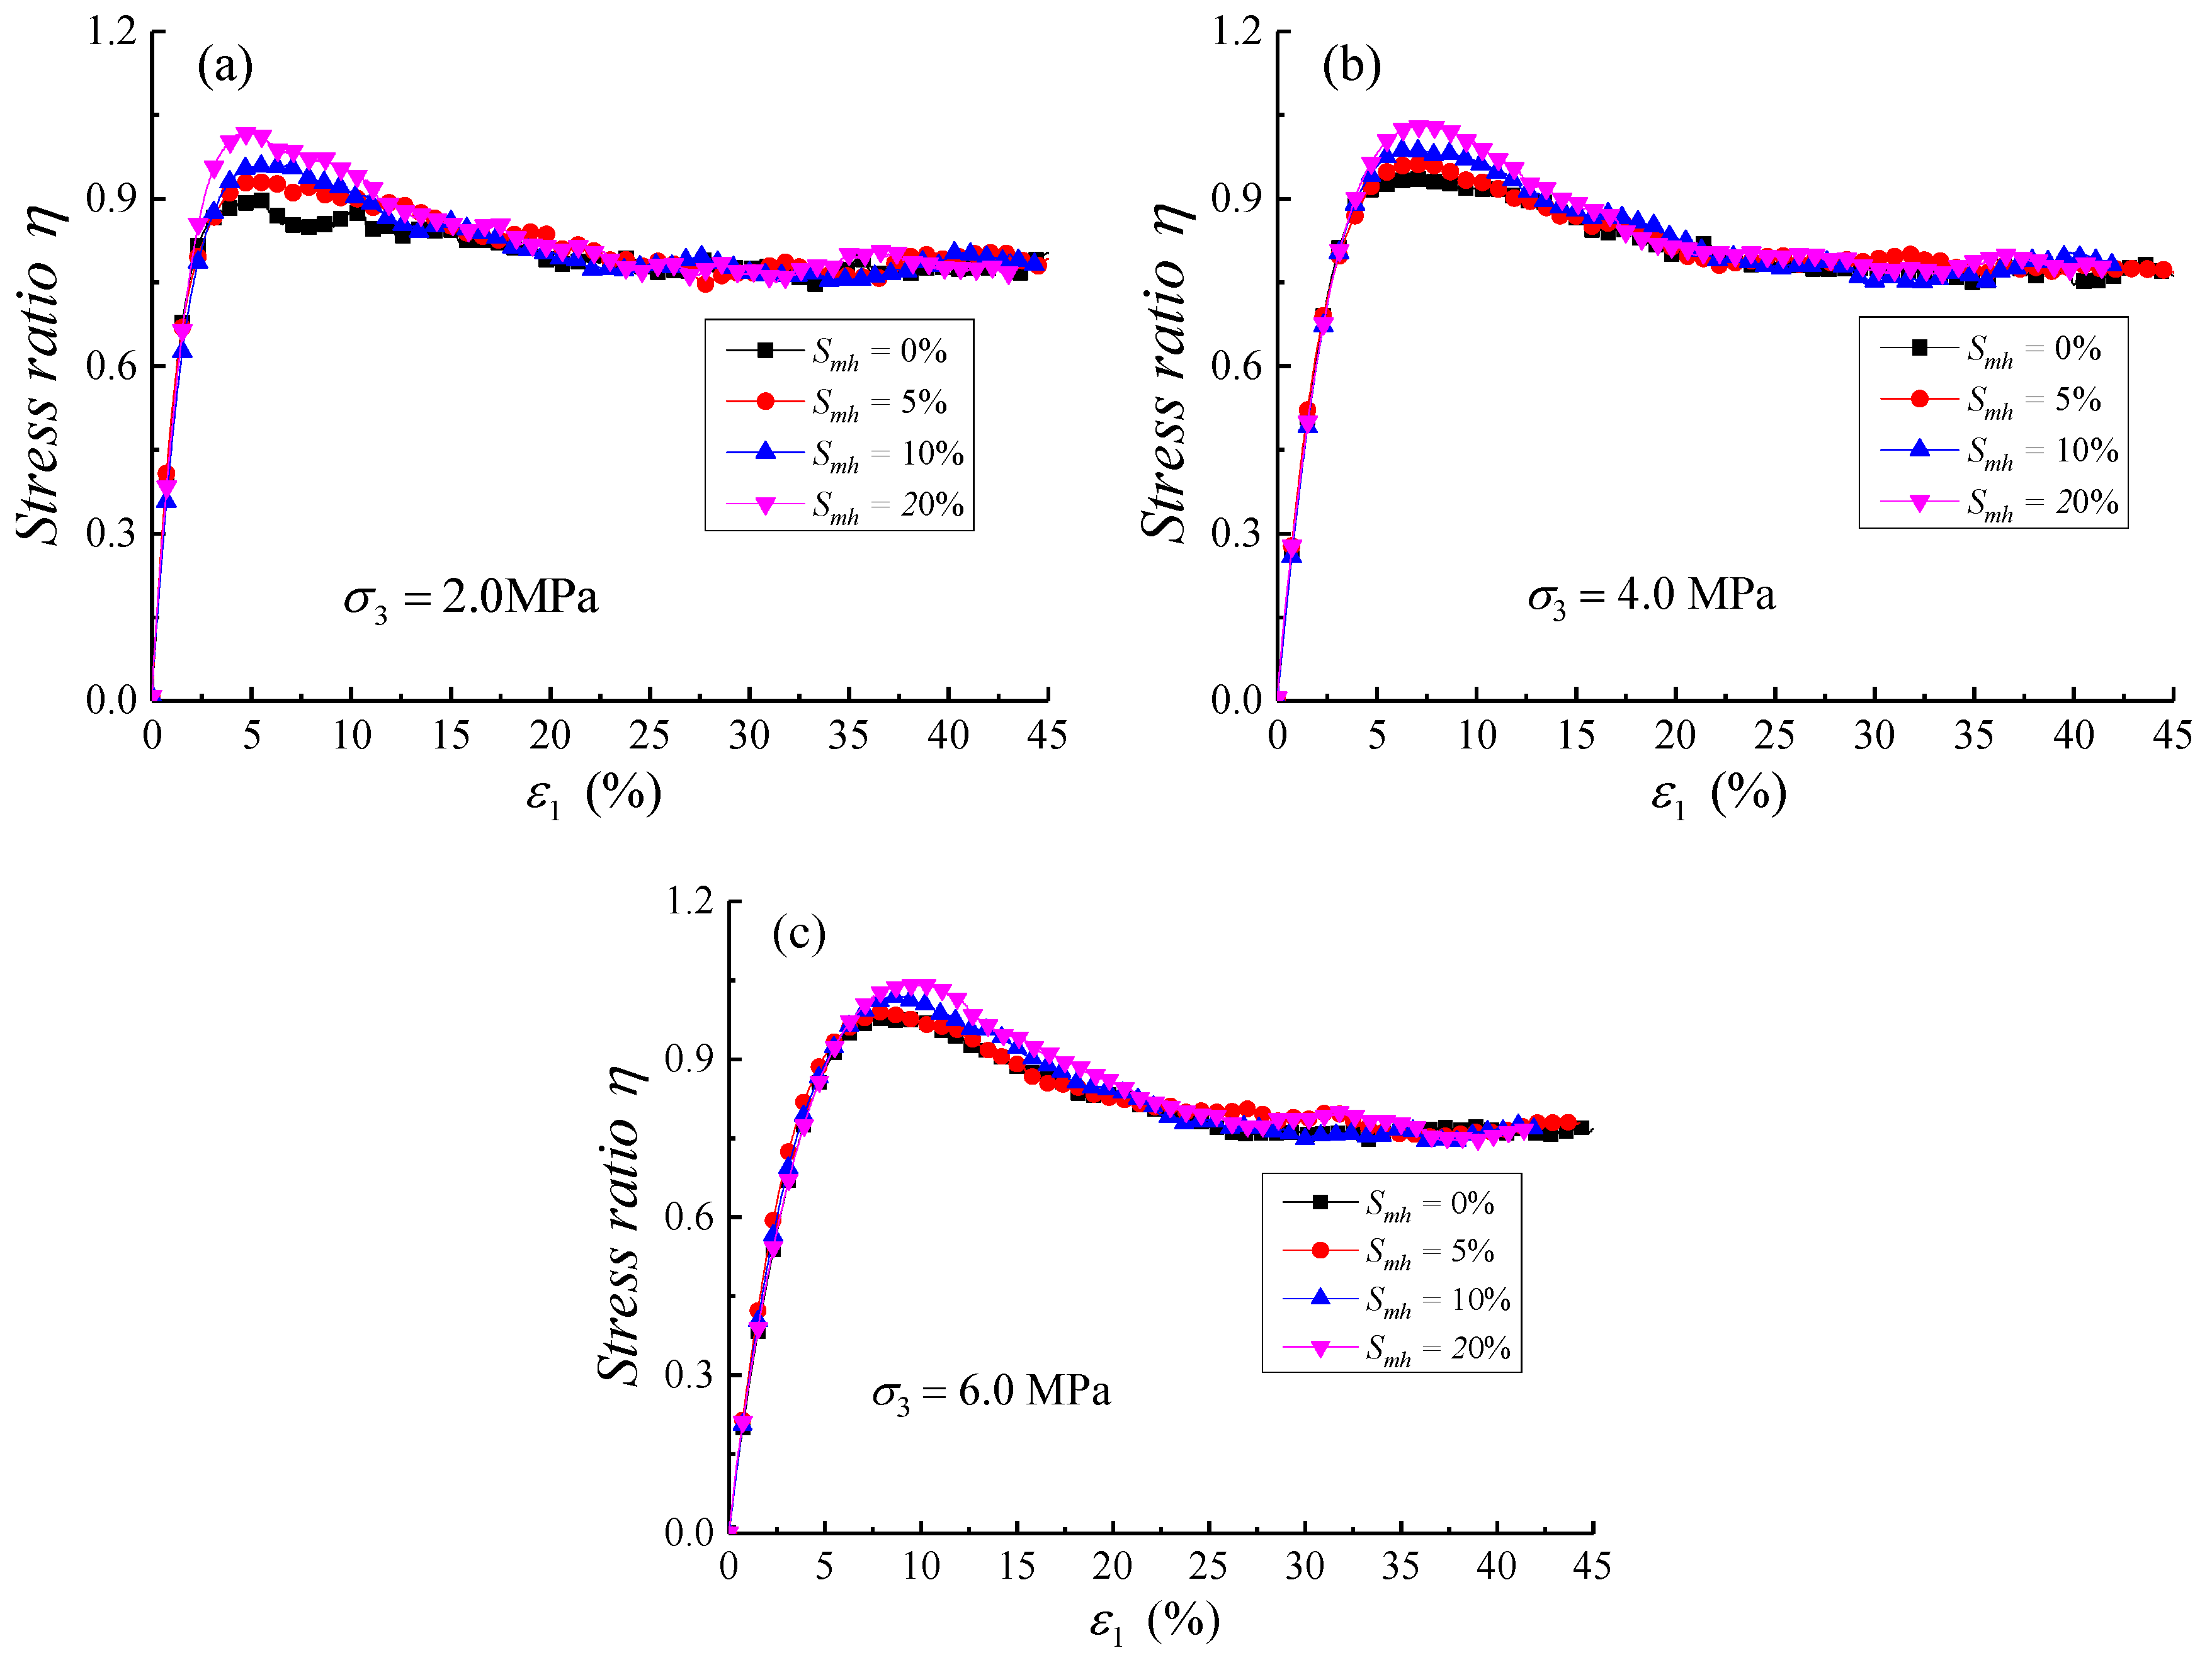
Figure 5.
Peak strength envelope of the pore-filled MHBS in the q − p plane.

Figure 6.
Friction angle and cohesion of the pore-filled MHBS with different MH saturations in the DEM simulations.
Figure 6.
Friction angle and cohesion of the pore-filled MHBS with different MH saturations in the DEM simulations.

Figure 7.
Volumetric strain–axial strain of the pore-filled MHBS with MH saturations under different ECPs in the DEM simulations (a) = 0. (b) = 5%. (c) = 10%. (d) = 20%. (e) = 2.0 MPa.
Figure 7.
Volumetric strain–axial strain of the pore-filled MHBS with MH saturations under different ECPs in the DEM simulations (a) = 0. (b) = 5%. (c) = 10%. (d) = 20%. (e) = 2.0 MPa.

Figure 8.
Critical state line of the pore-filled MHBS in the q − p plane in the DEM simulations.
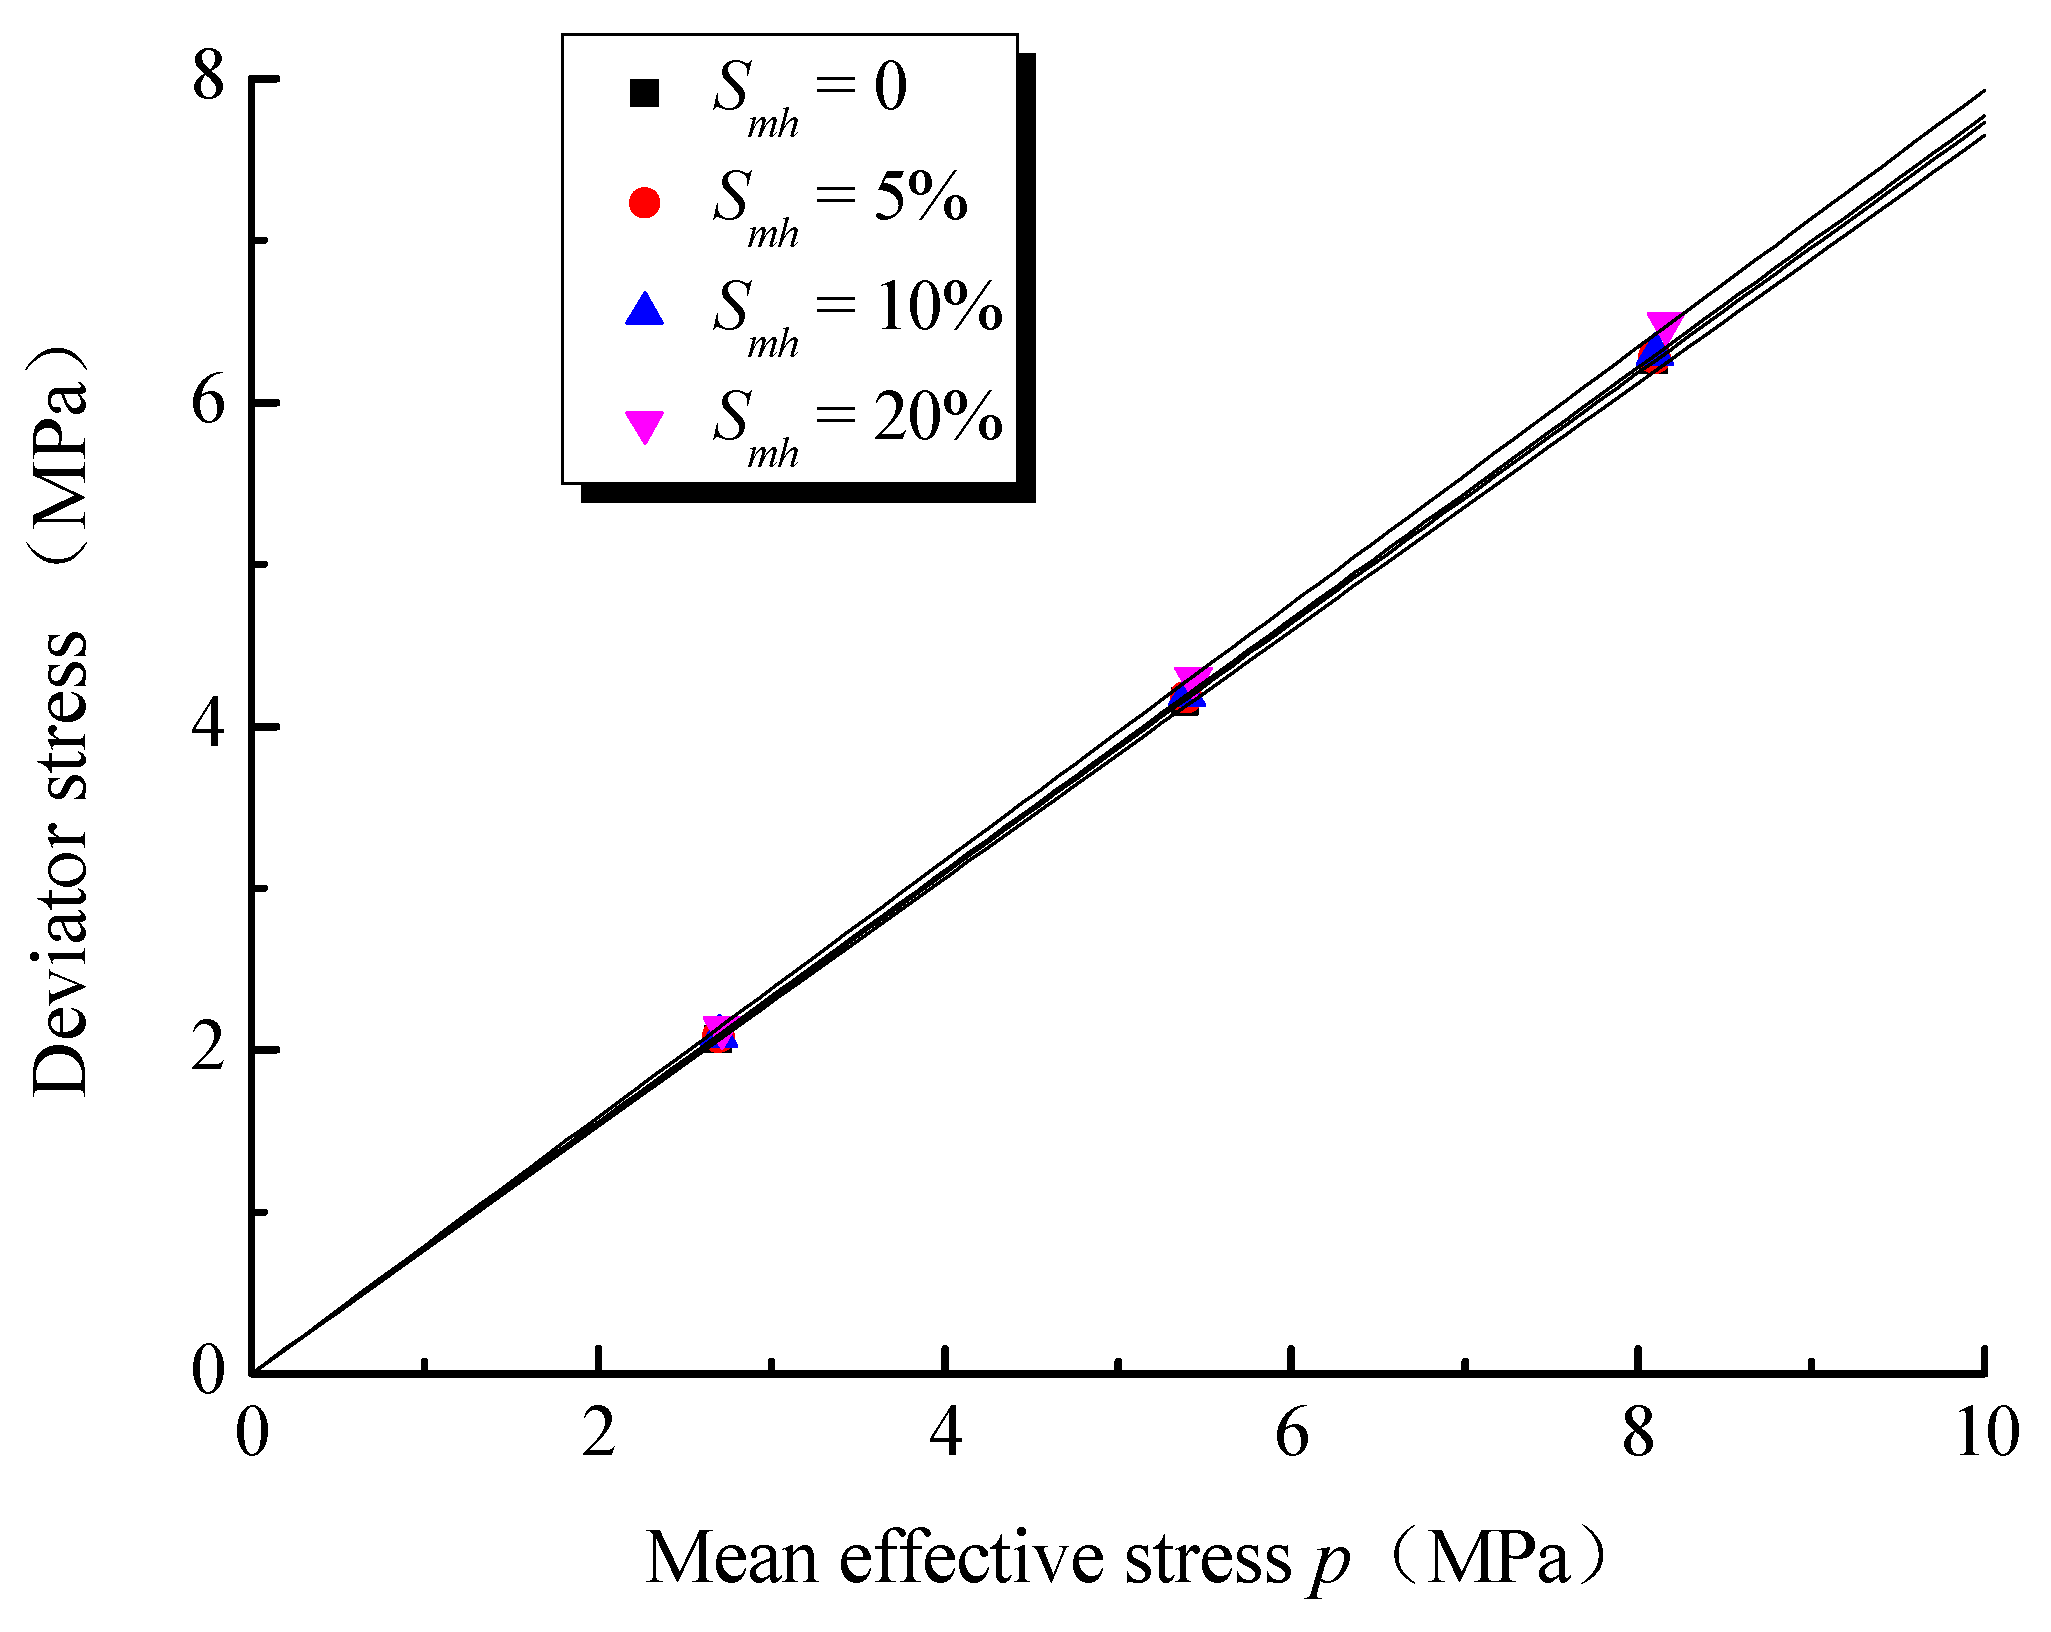
Figure 9.
Critical stress ratios of the pore-filled MHBS with MH saturations in the DEM simulations.
Figure 9.
Critical stress ratios of the pore-filled MHBS with MH saturations in the DEM simulations.
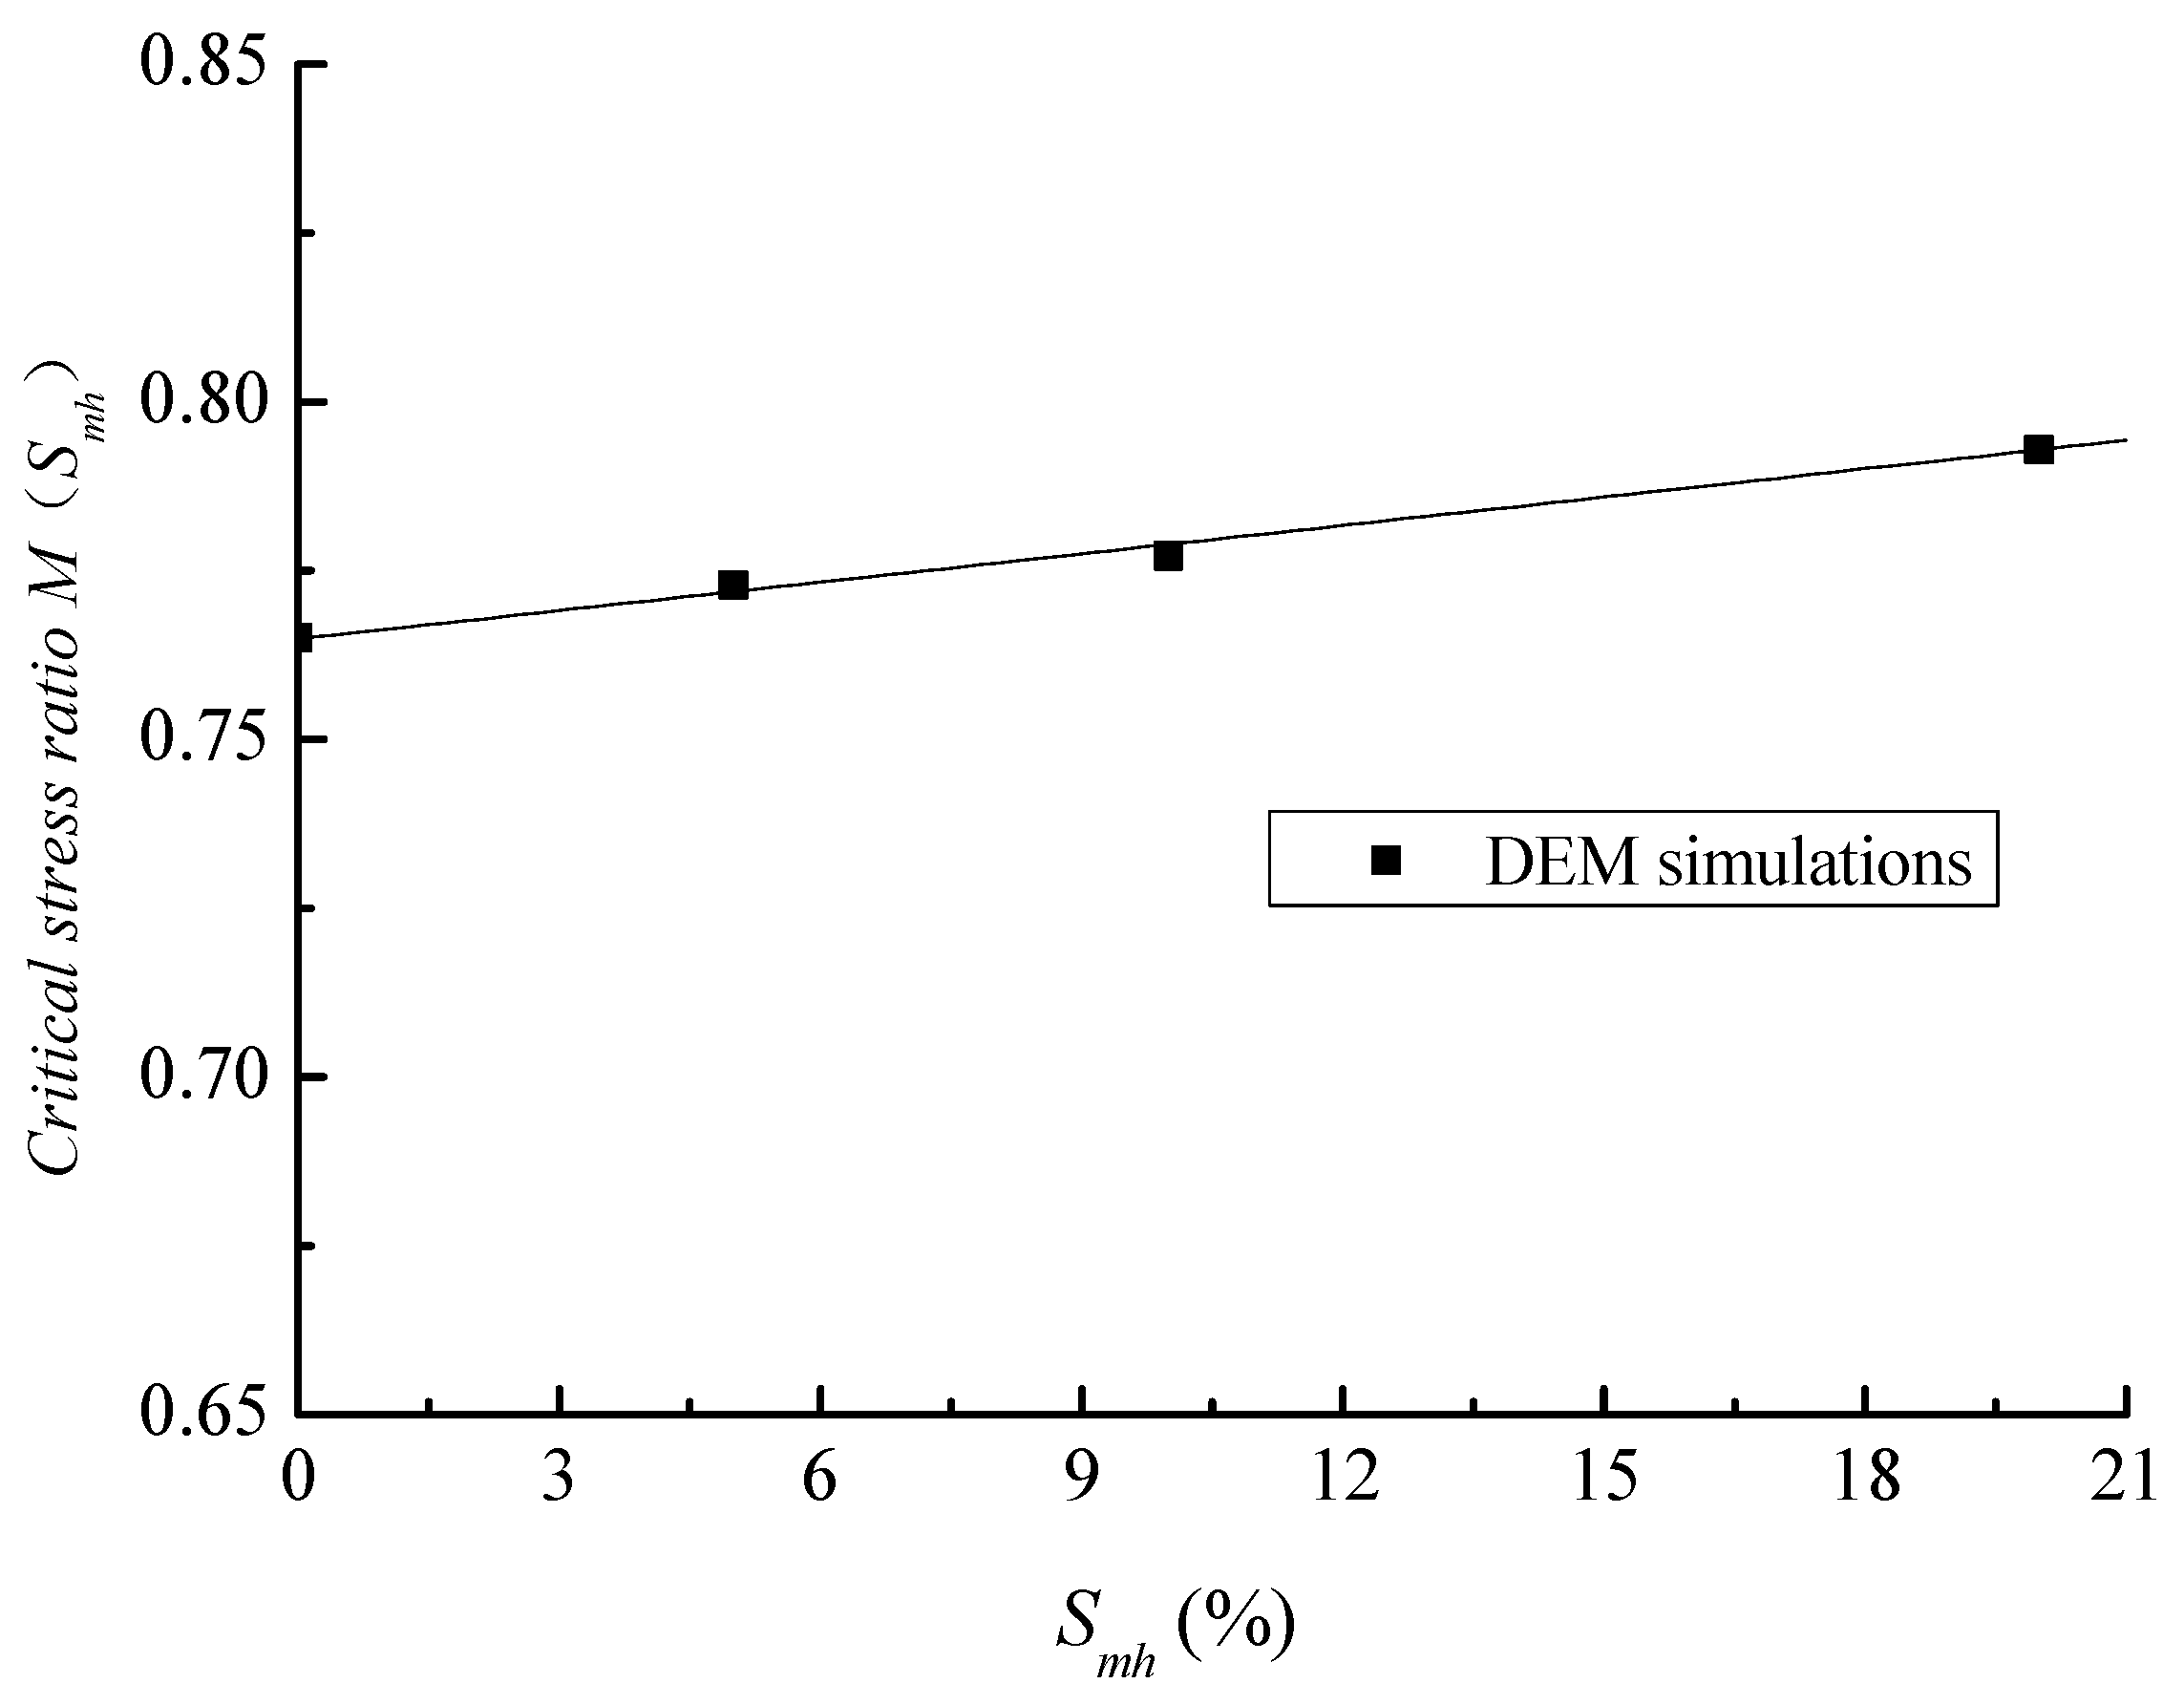
Figure 10.
Critical state line of the pore-filled MHBS in the plane.
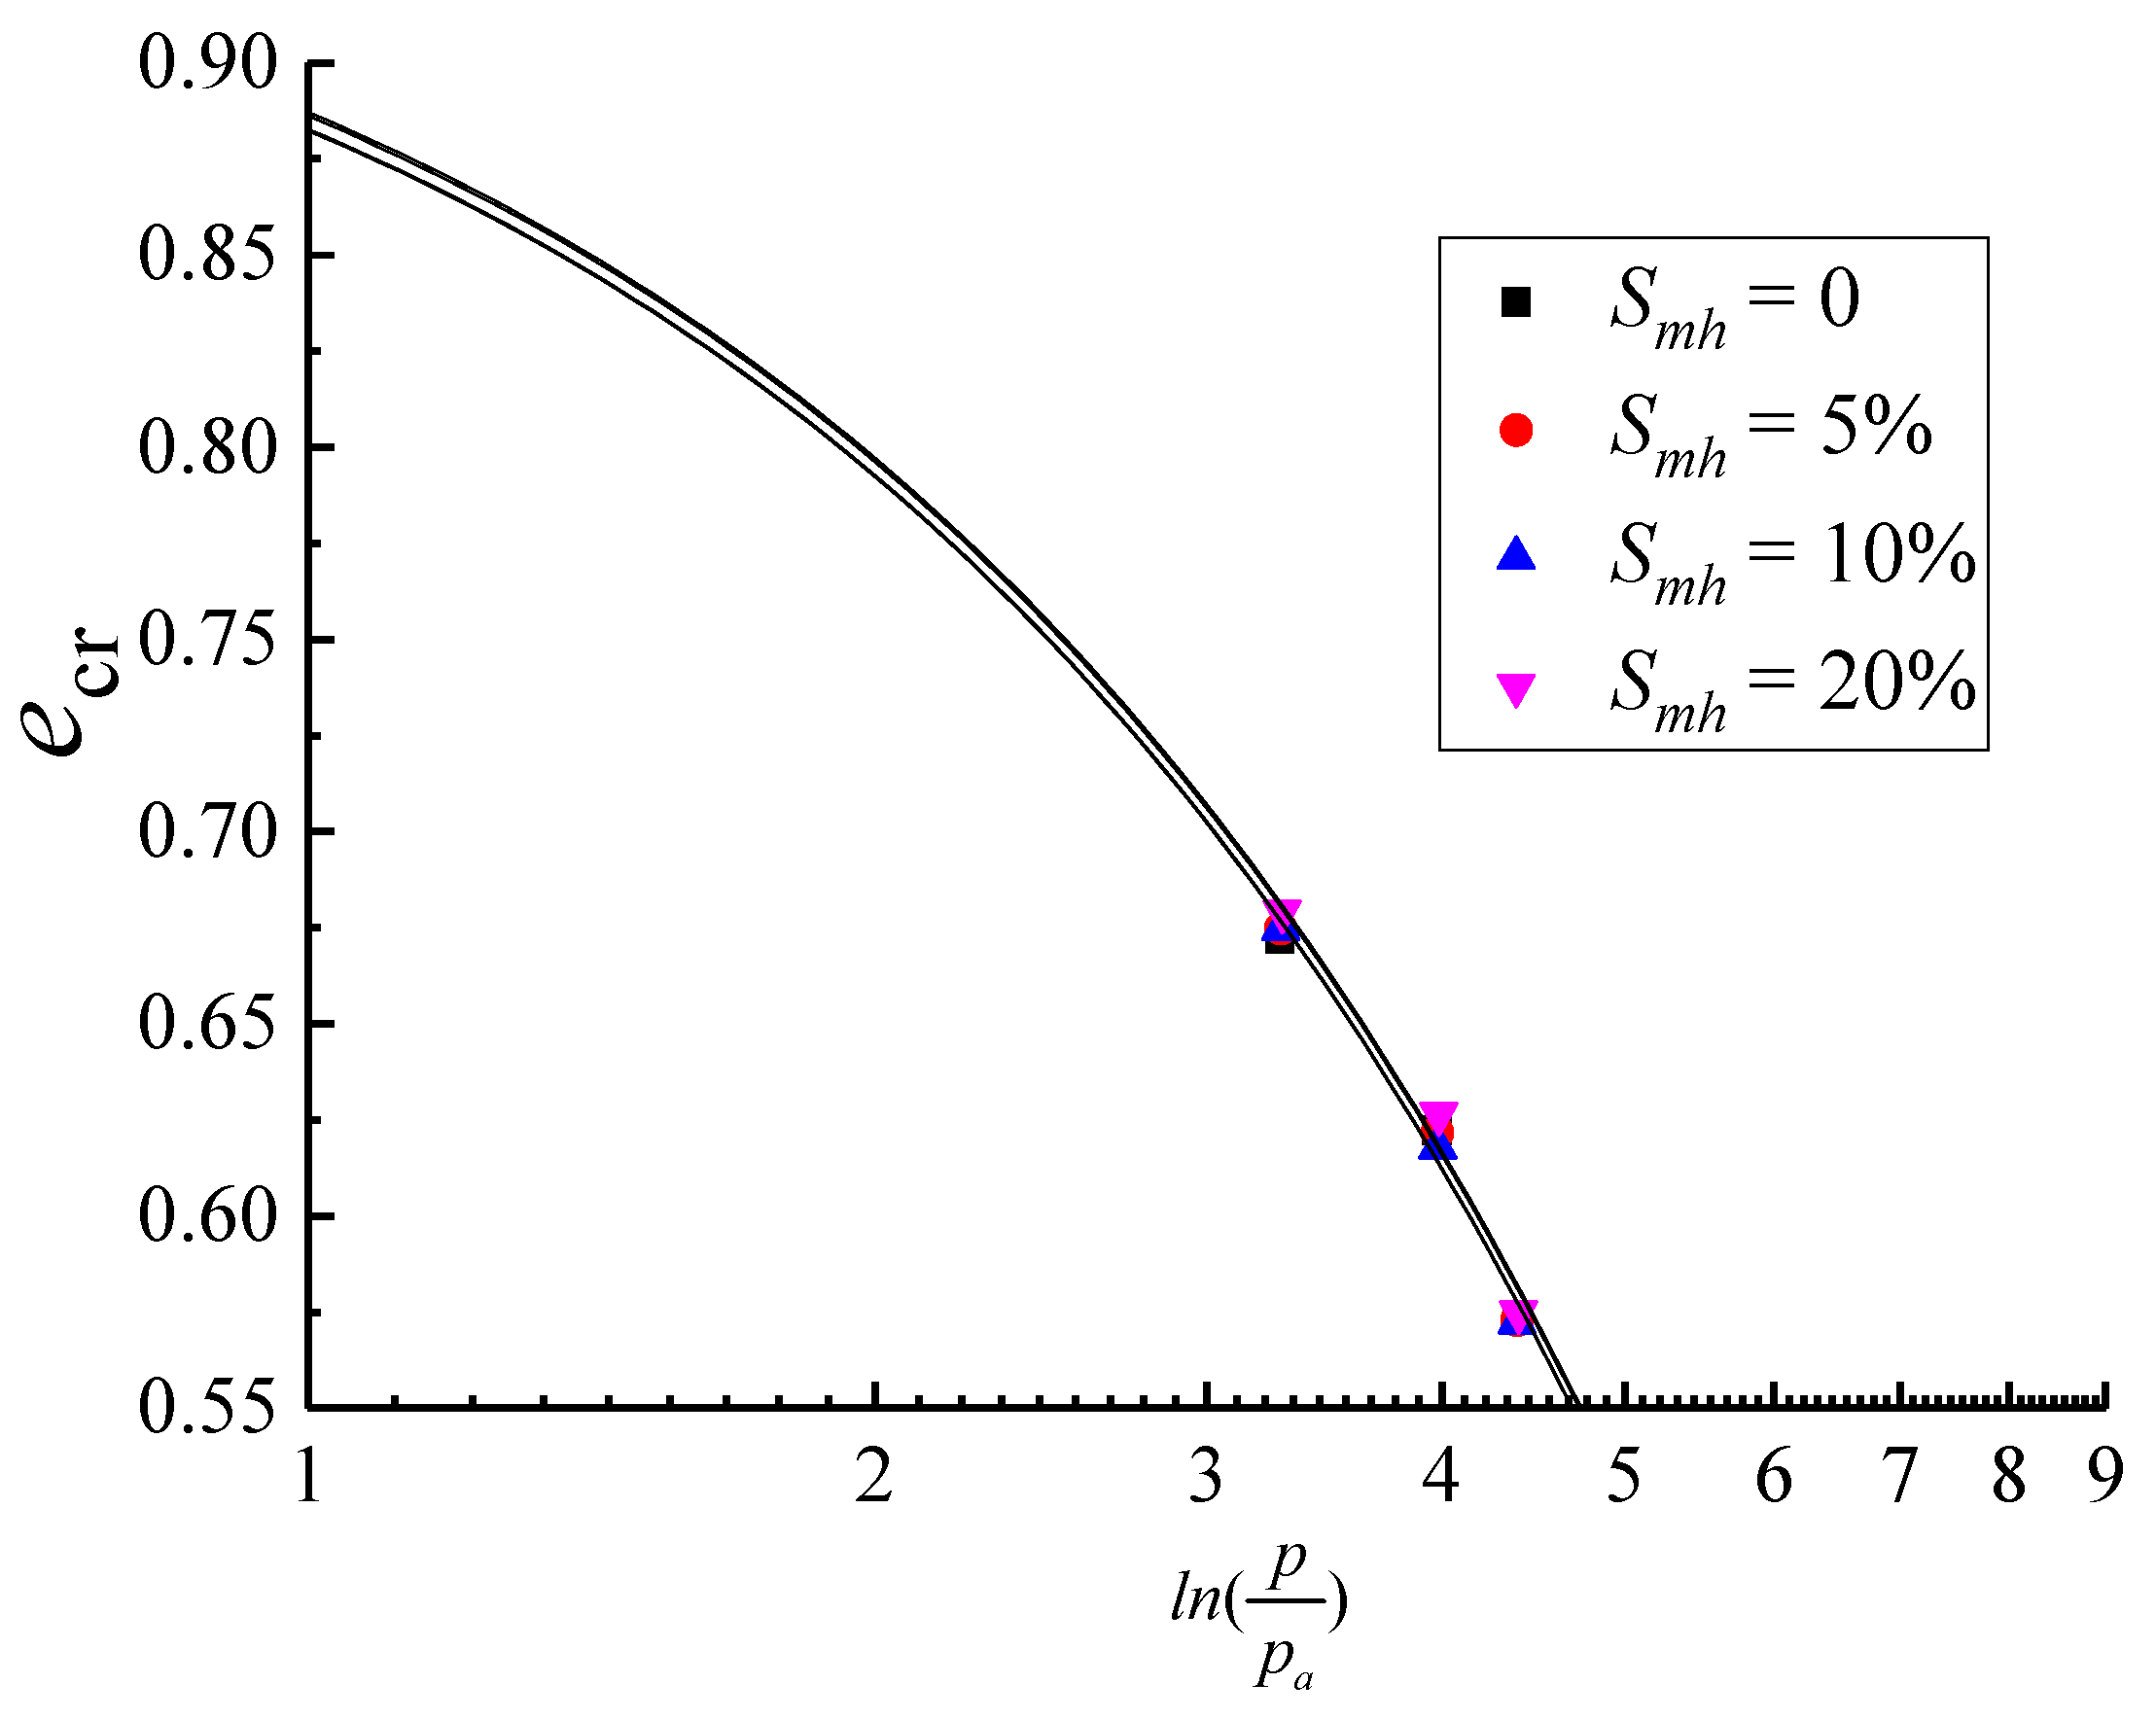
Figure 11.
Critical void ratio of the pore-filled MHBS in the DEM simulations.
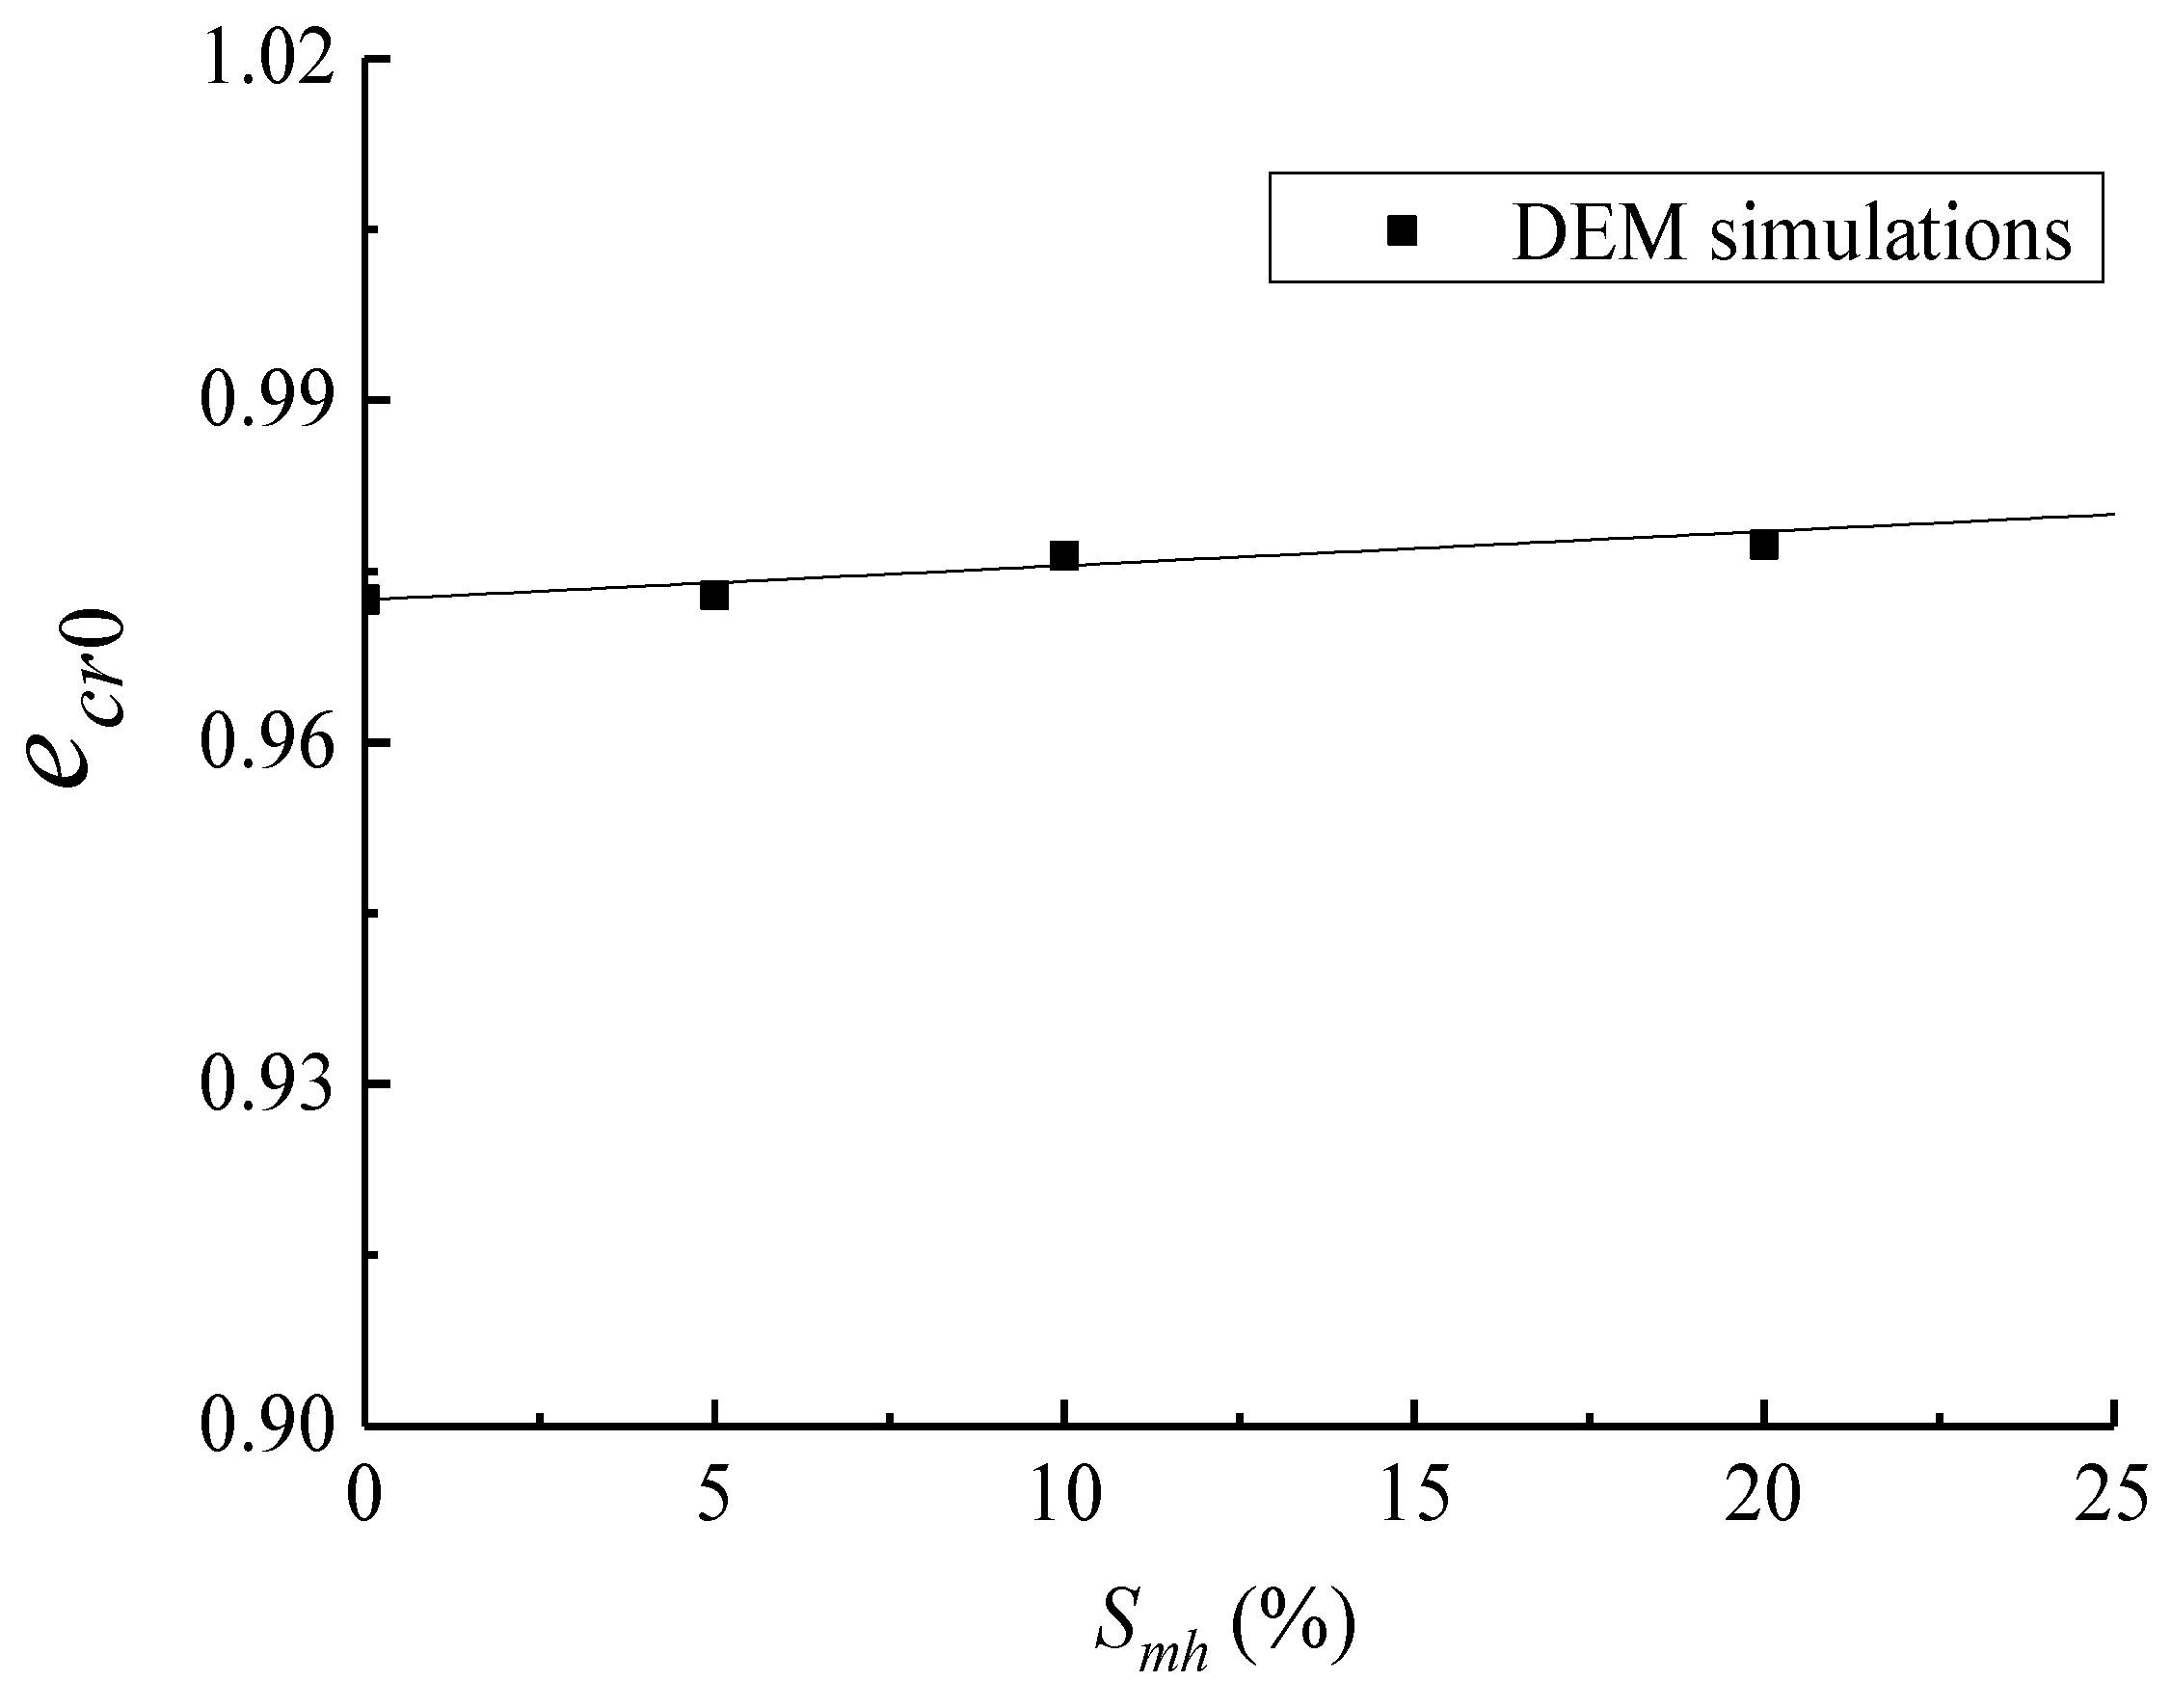
Figure 12.
Stress ratio η-dilatancy relations of the pore-filled MHBS with different ECPs and MH saturations (a) = 0 (b) = 5% (c) = 10% (d) = 20%.
Figure 12.
Stress ratio η-dilatancy relations of the pore-filled MHBS with different ECPs and MH saturations (a) = 0 (b) = 5% (c) = 10% (d) = 20%.
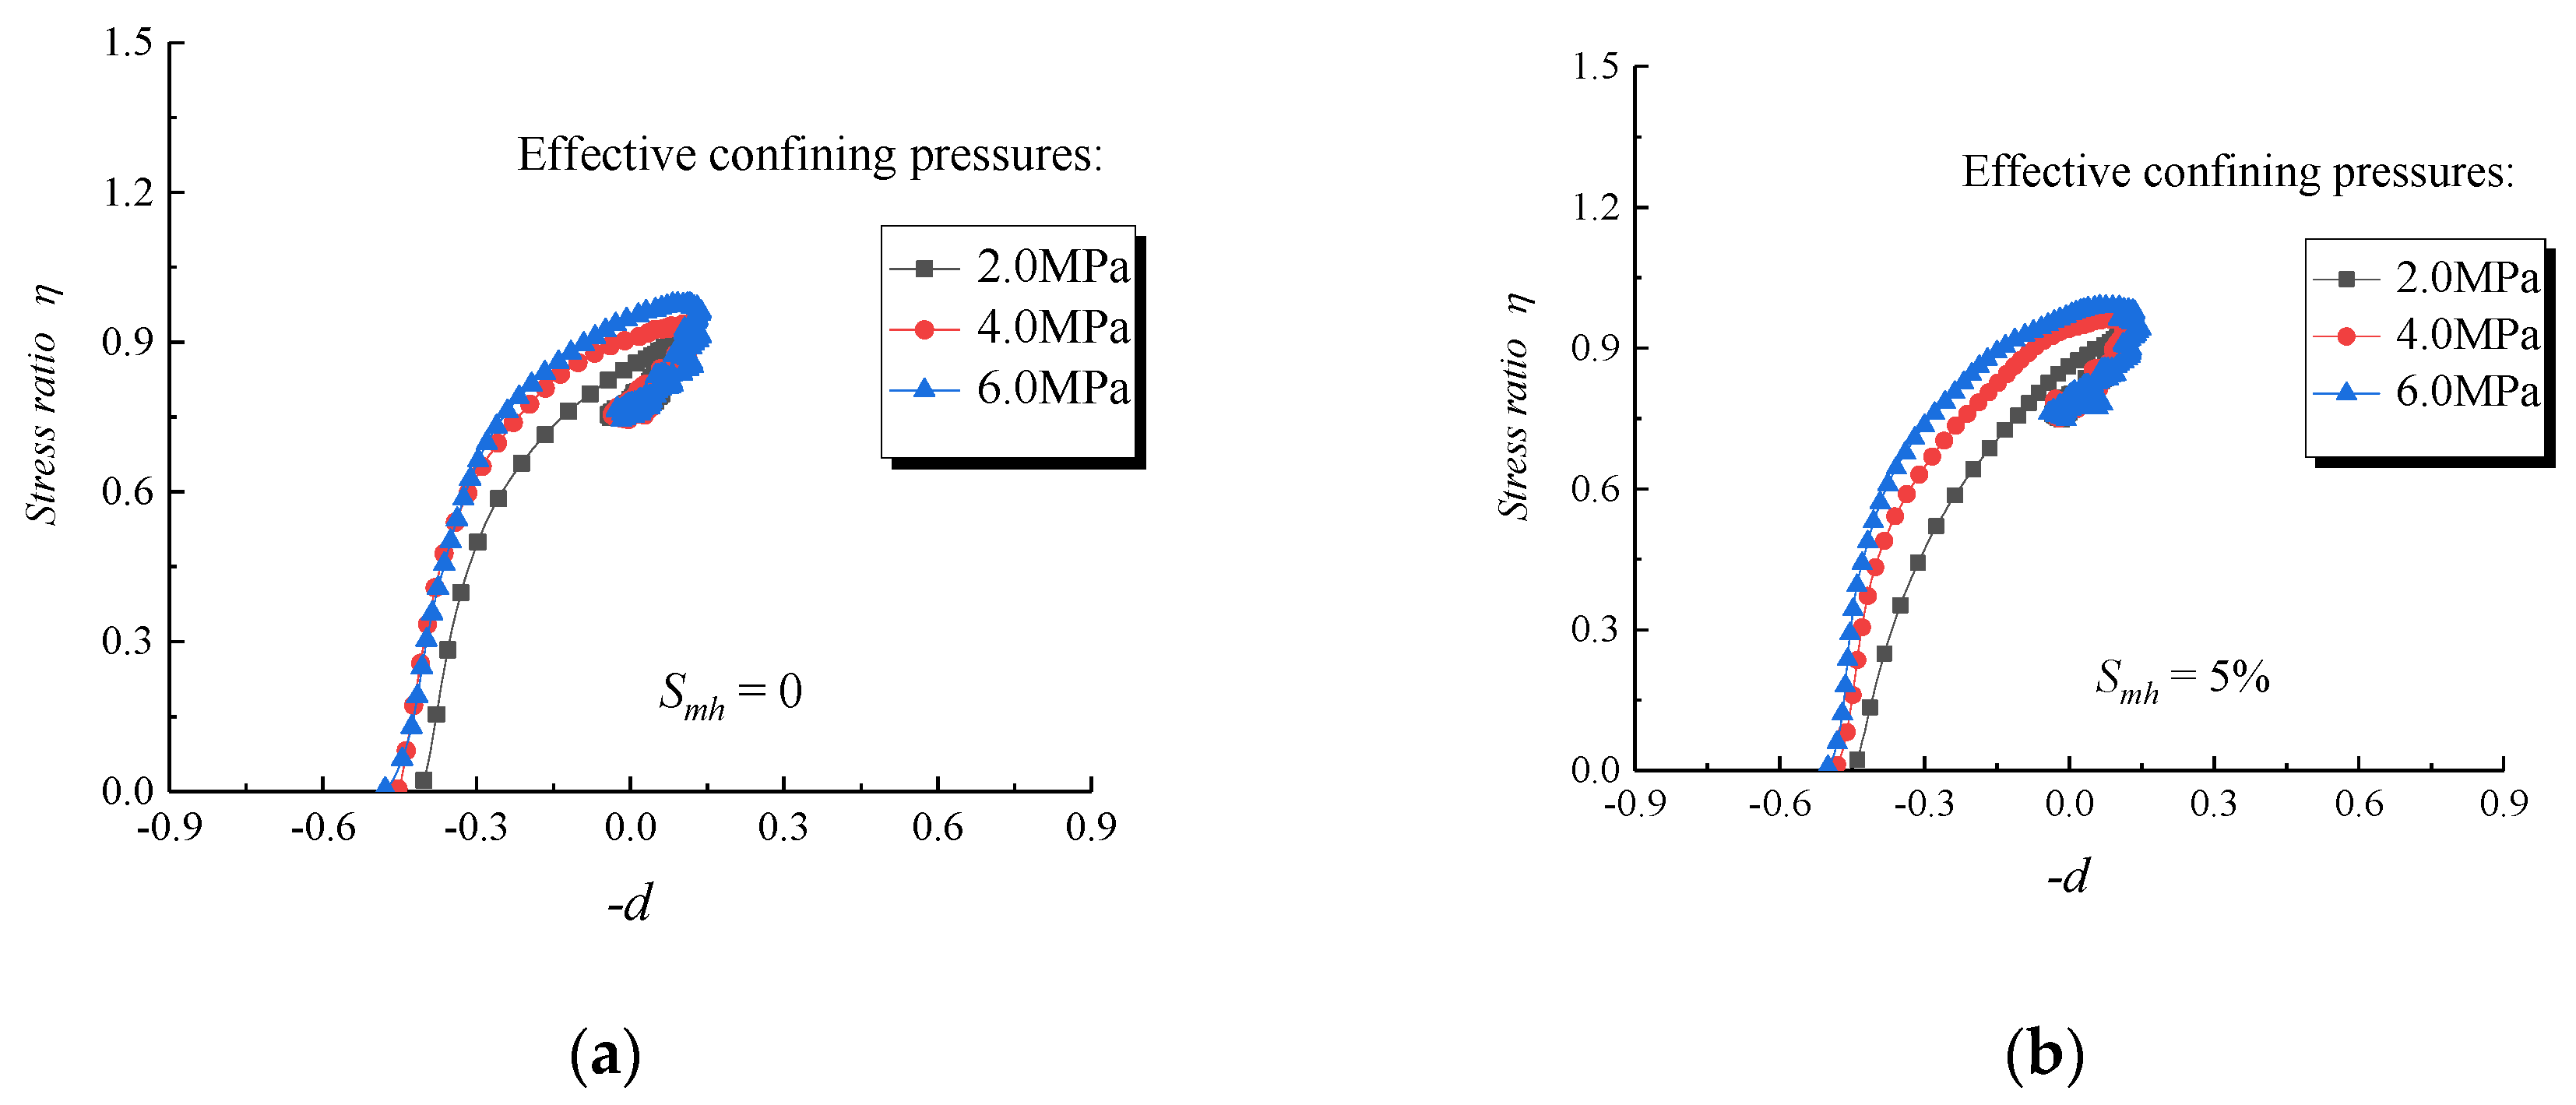
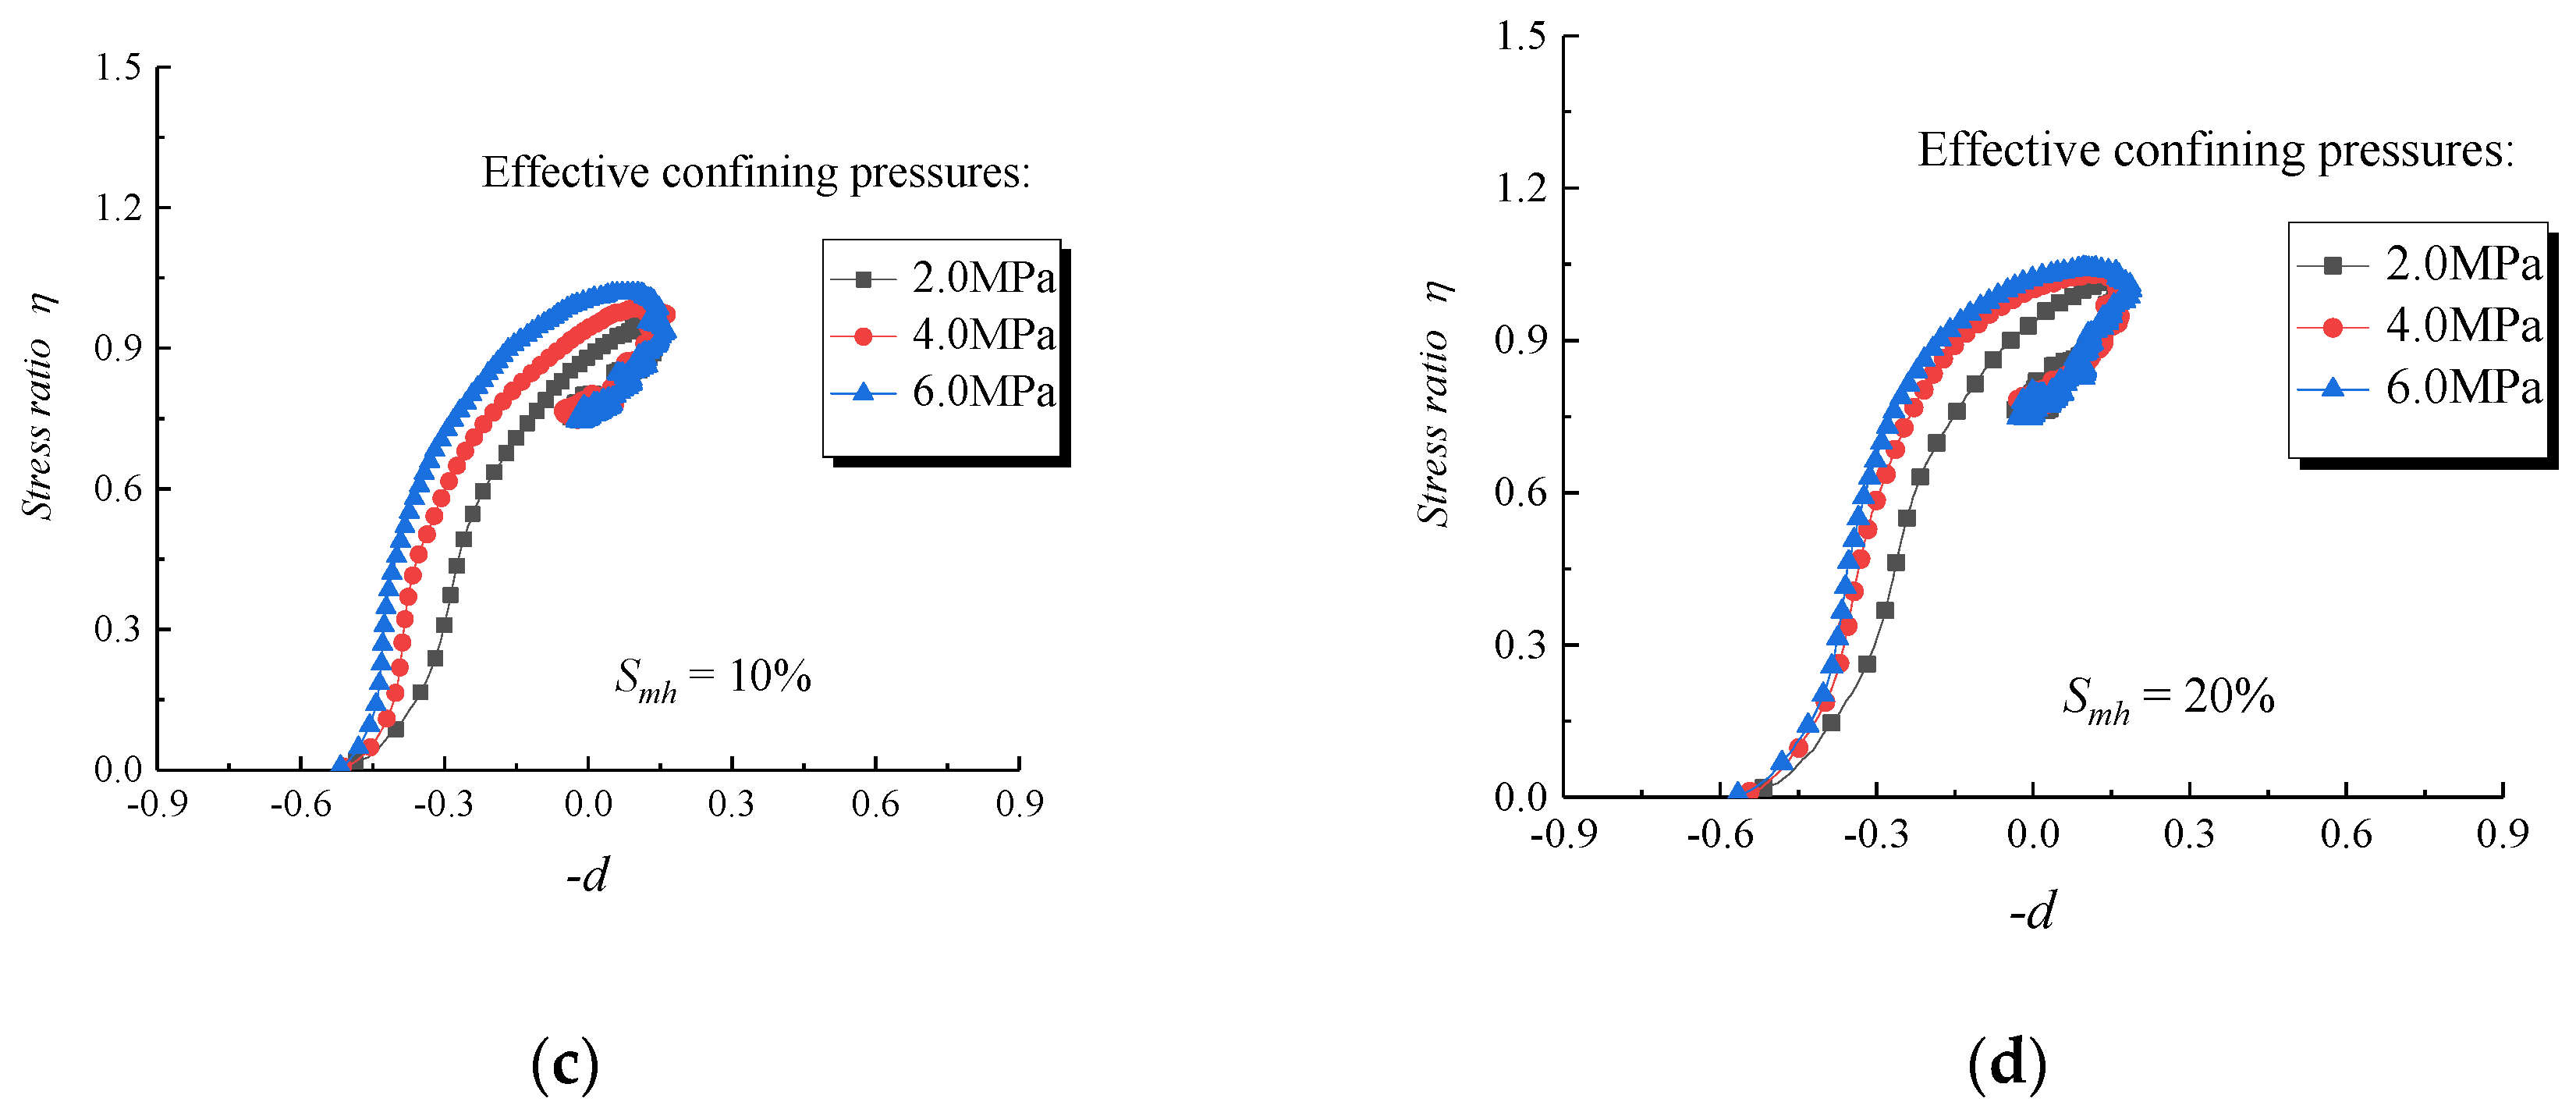
Figure 13.
Principal fabric components of the pore-filled MHBS with Smh = 5% under σ3 = 2.0 MPa in the DEM simulations (a) Fabric components (b) Strong fabric components (c) Deviator strong fabric tensor,
Figure 13.
Principal fabric components of the pore-filled MHBS with Smh = 5% under σ3 = 2.0 MPa in the DEM simulations (a) Fabric components (b) Strong fabric components (c) Deviator strong fabric tensor,

Figure 14.
Distribution of the contact normal vectors projected on the x–y, x–z, and y–z planes of the pore-filling type of MHBS with under the condition of σ3 = 2.0 MPa and (a) Distribution of contact normal vectors (b) Distribution of strong contact normal vectors.
Figure 14.
Distribution of the contact normal vectors projected on the x–y, x–z, and y–z planes of the pore-filling type of MHBS with under the condition of σ3 = 2.0 MPa and (a) Distribution of contact normal vectors (b) Distribution of strong contact normal vectors.

Figure 15.
Distribution of the contact normal vectors projected on the x–y, x–z, and y–z planes of the pore-filling type of MHBS with under the condition of σ3 = 2.0 MPa and (a) Distribution of contact normal vectors. (b) Distribution of strong contact normal vectors.
Figure 15.
Distribution of the contact normal vectors projected on the x–y, x–z, and y–z planes of the pore-filling type of MHBS with under the condition of σ3 = 2.0 MPa and (a) Distribution of contact normal vectors. (b) Distribution of strong contact normal vectors.
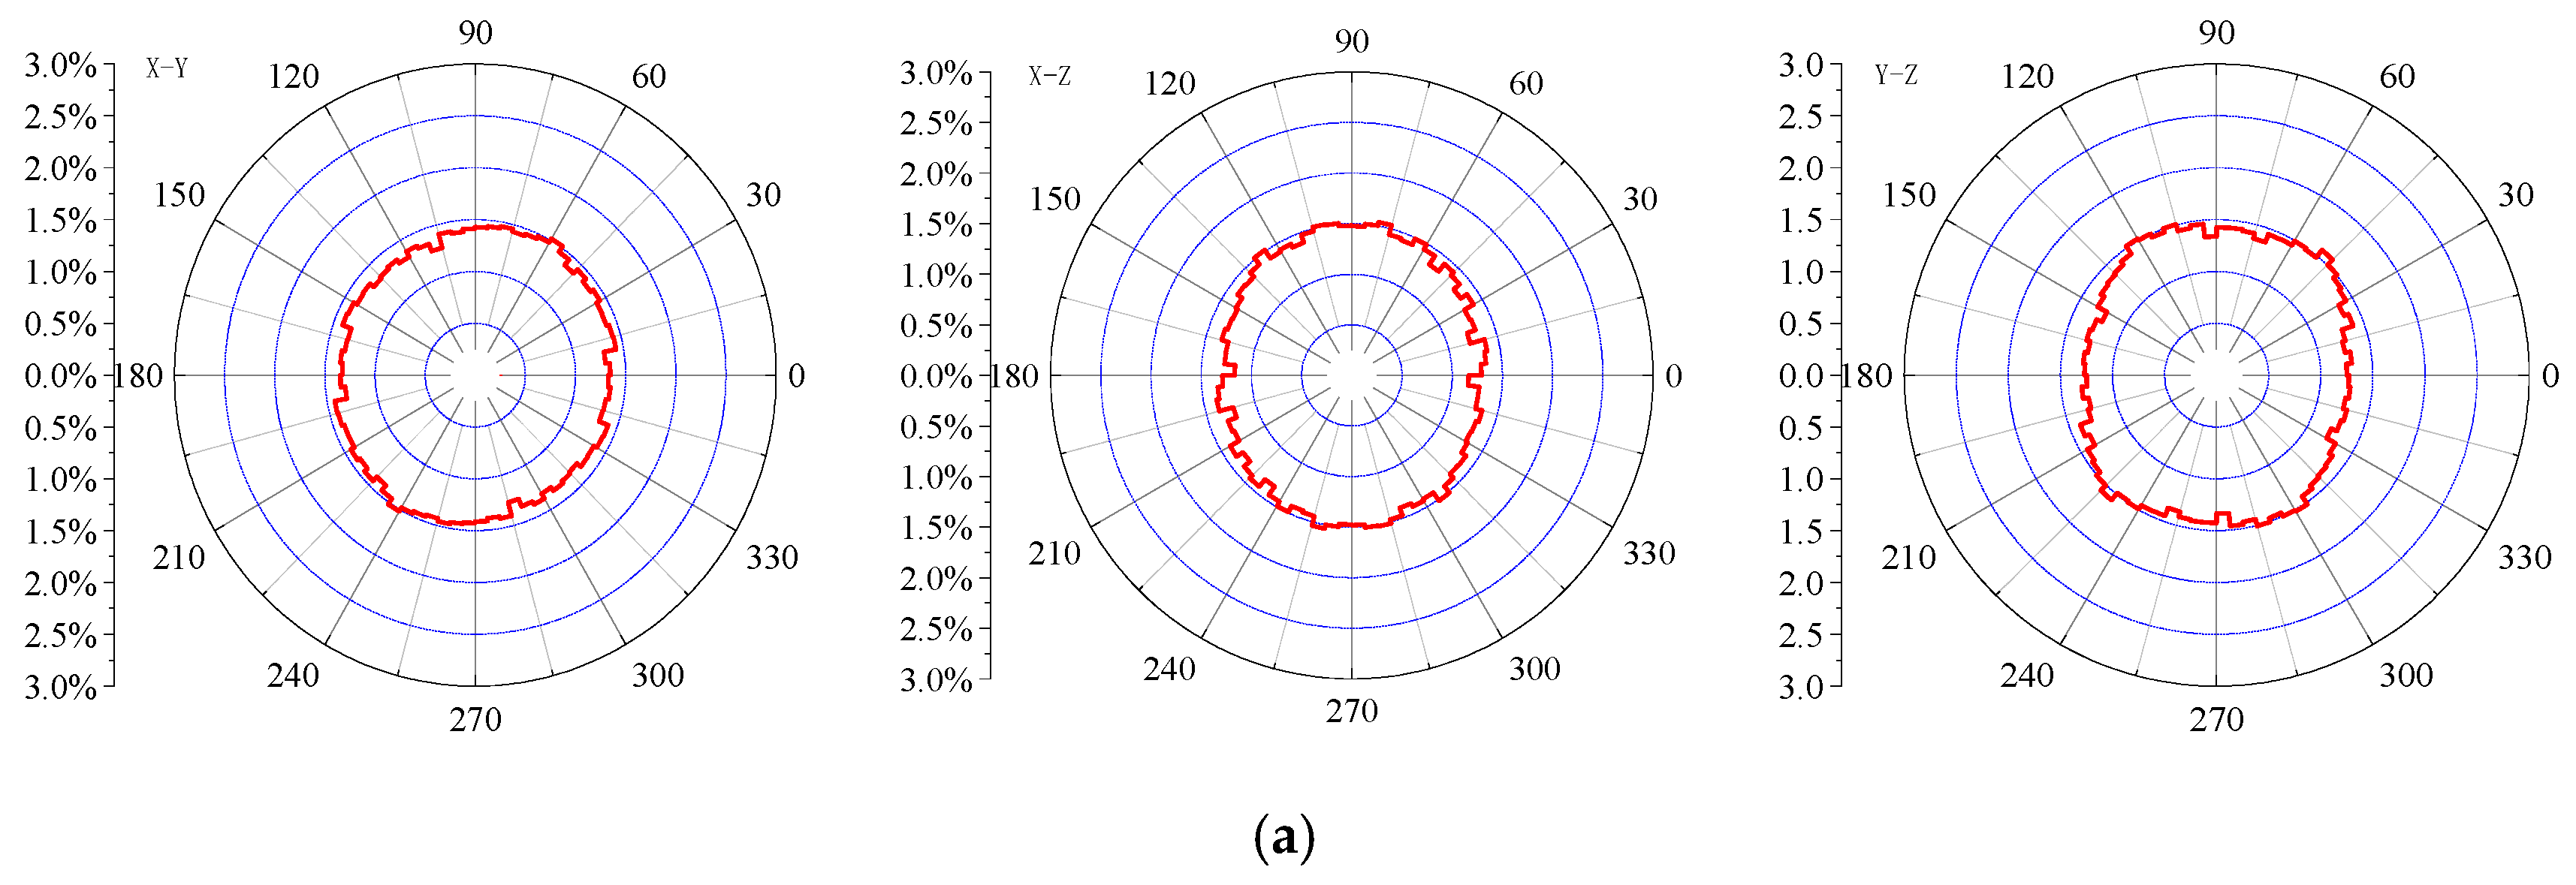
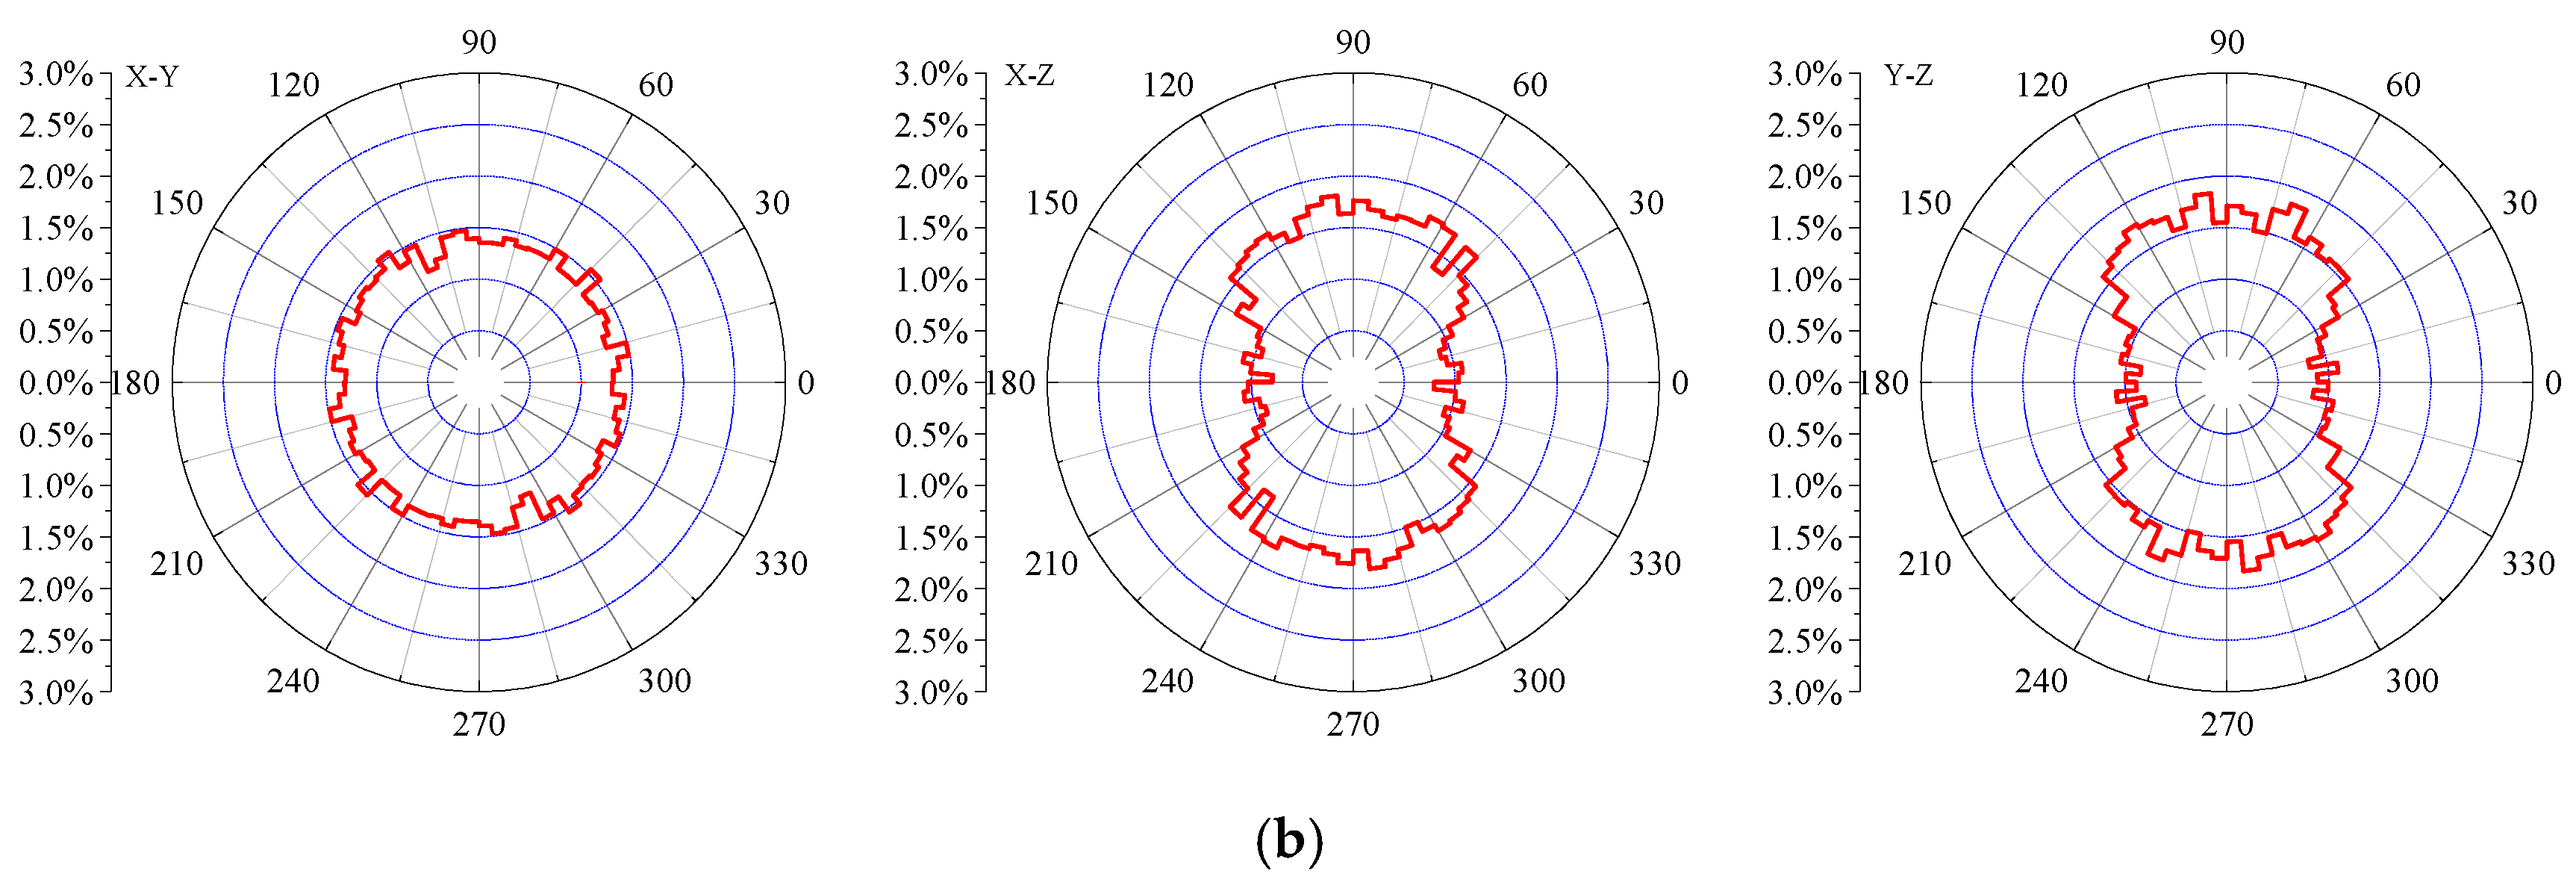
Figure 16.
Distribution of the contact normal vectors projected on the x–y, x–z, and y–z planes of the pore-filling type of MHBS with under the condition of σ3 = 2.0 MPa and (a) Distribution of contact normal vectors (b) Distribution of strong contact normal vectors.
Figure 16.
Distribution of the contact normal vectors projected on the x–y, x–z, and y–z planes of the pore-filling type of MHBS with under the condition of σ3 = 2.0 MPa and (a) Distribution of contact normal vectors (b) Distribution of strong contact normal vectors.
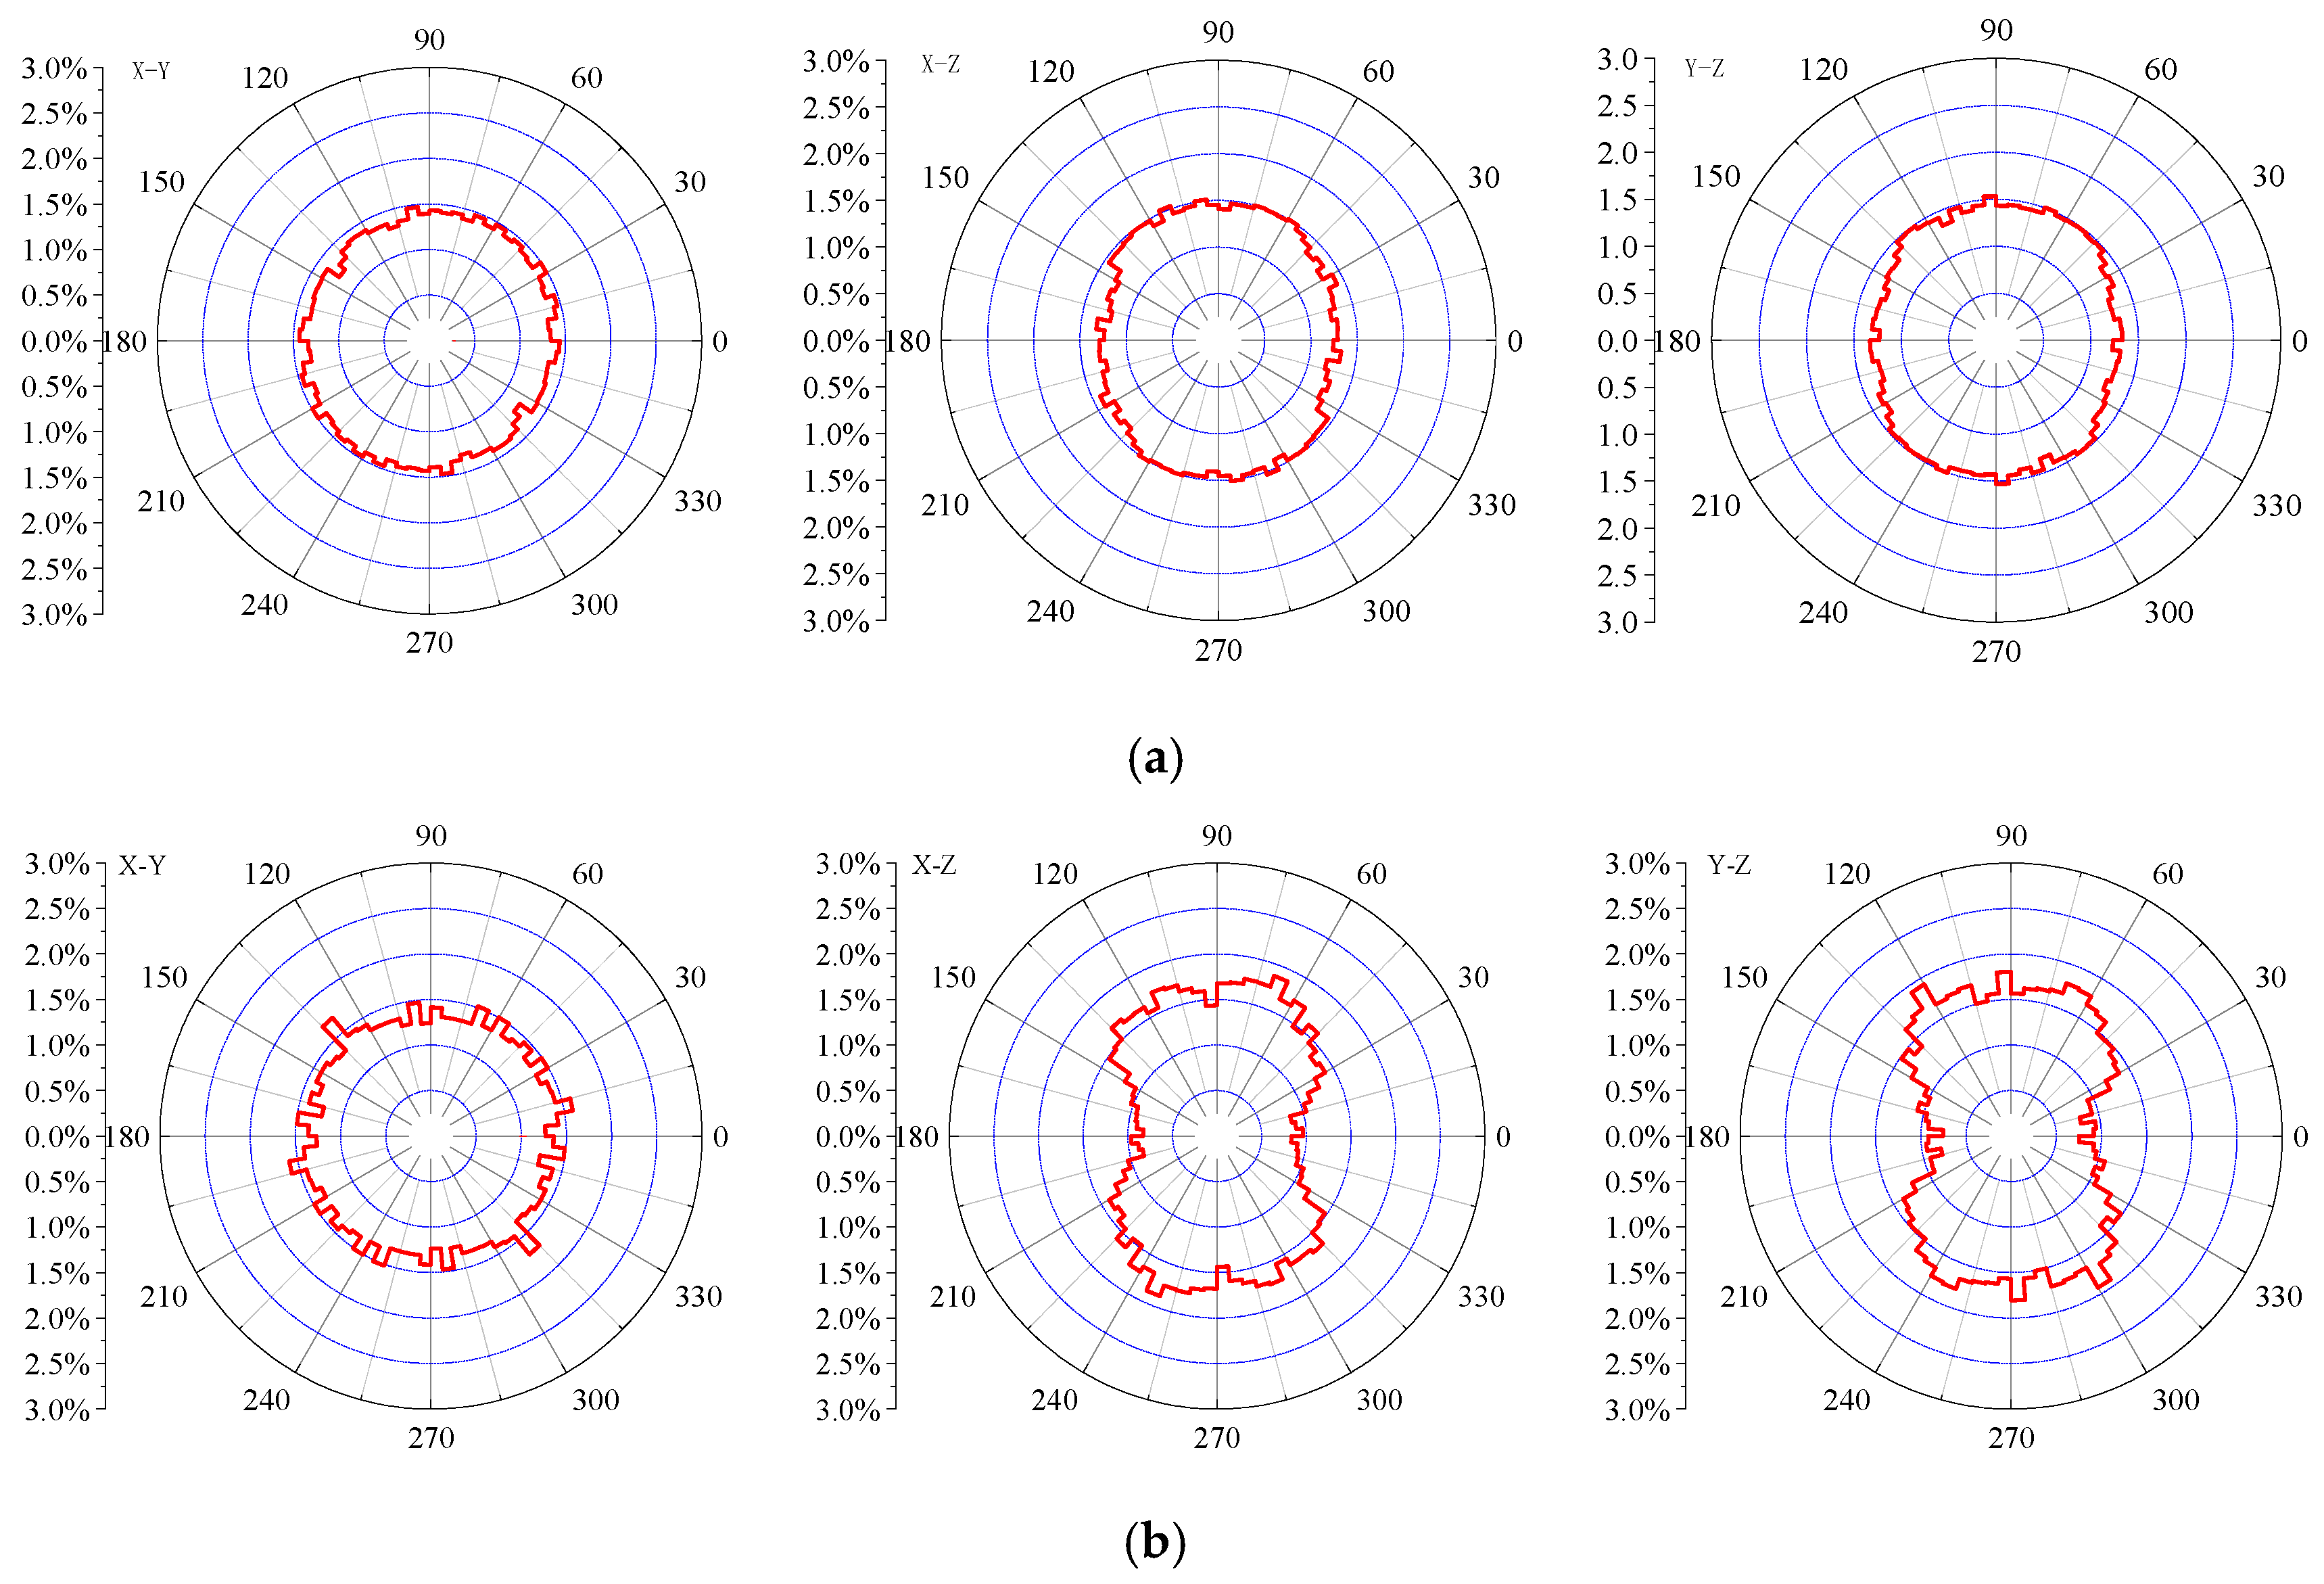
Figure 17.
CN and MCN of the soil skeleton in the pore-filled MHBS with under different ECPs (a) CN of the soil skeleton (b) MCN of the soil skeleton.
Figure 17.
CN and MCN of the soil skeleton in the pore-filled MHBS with under different ECPs (a) CN of the soil skeleton (b) MCN of the soil skeleton.
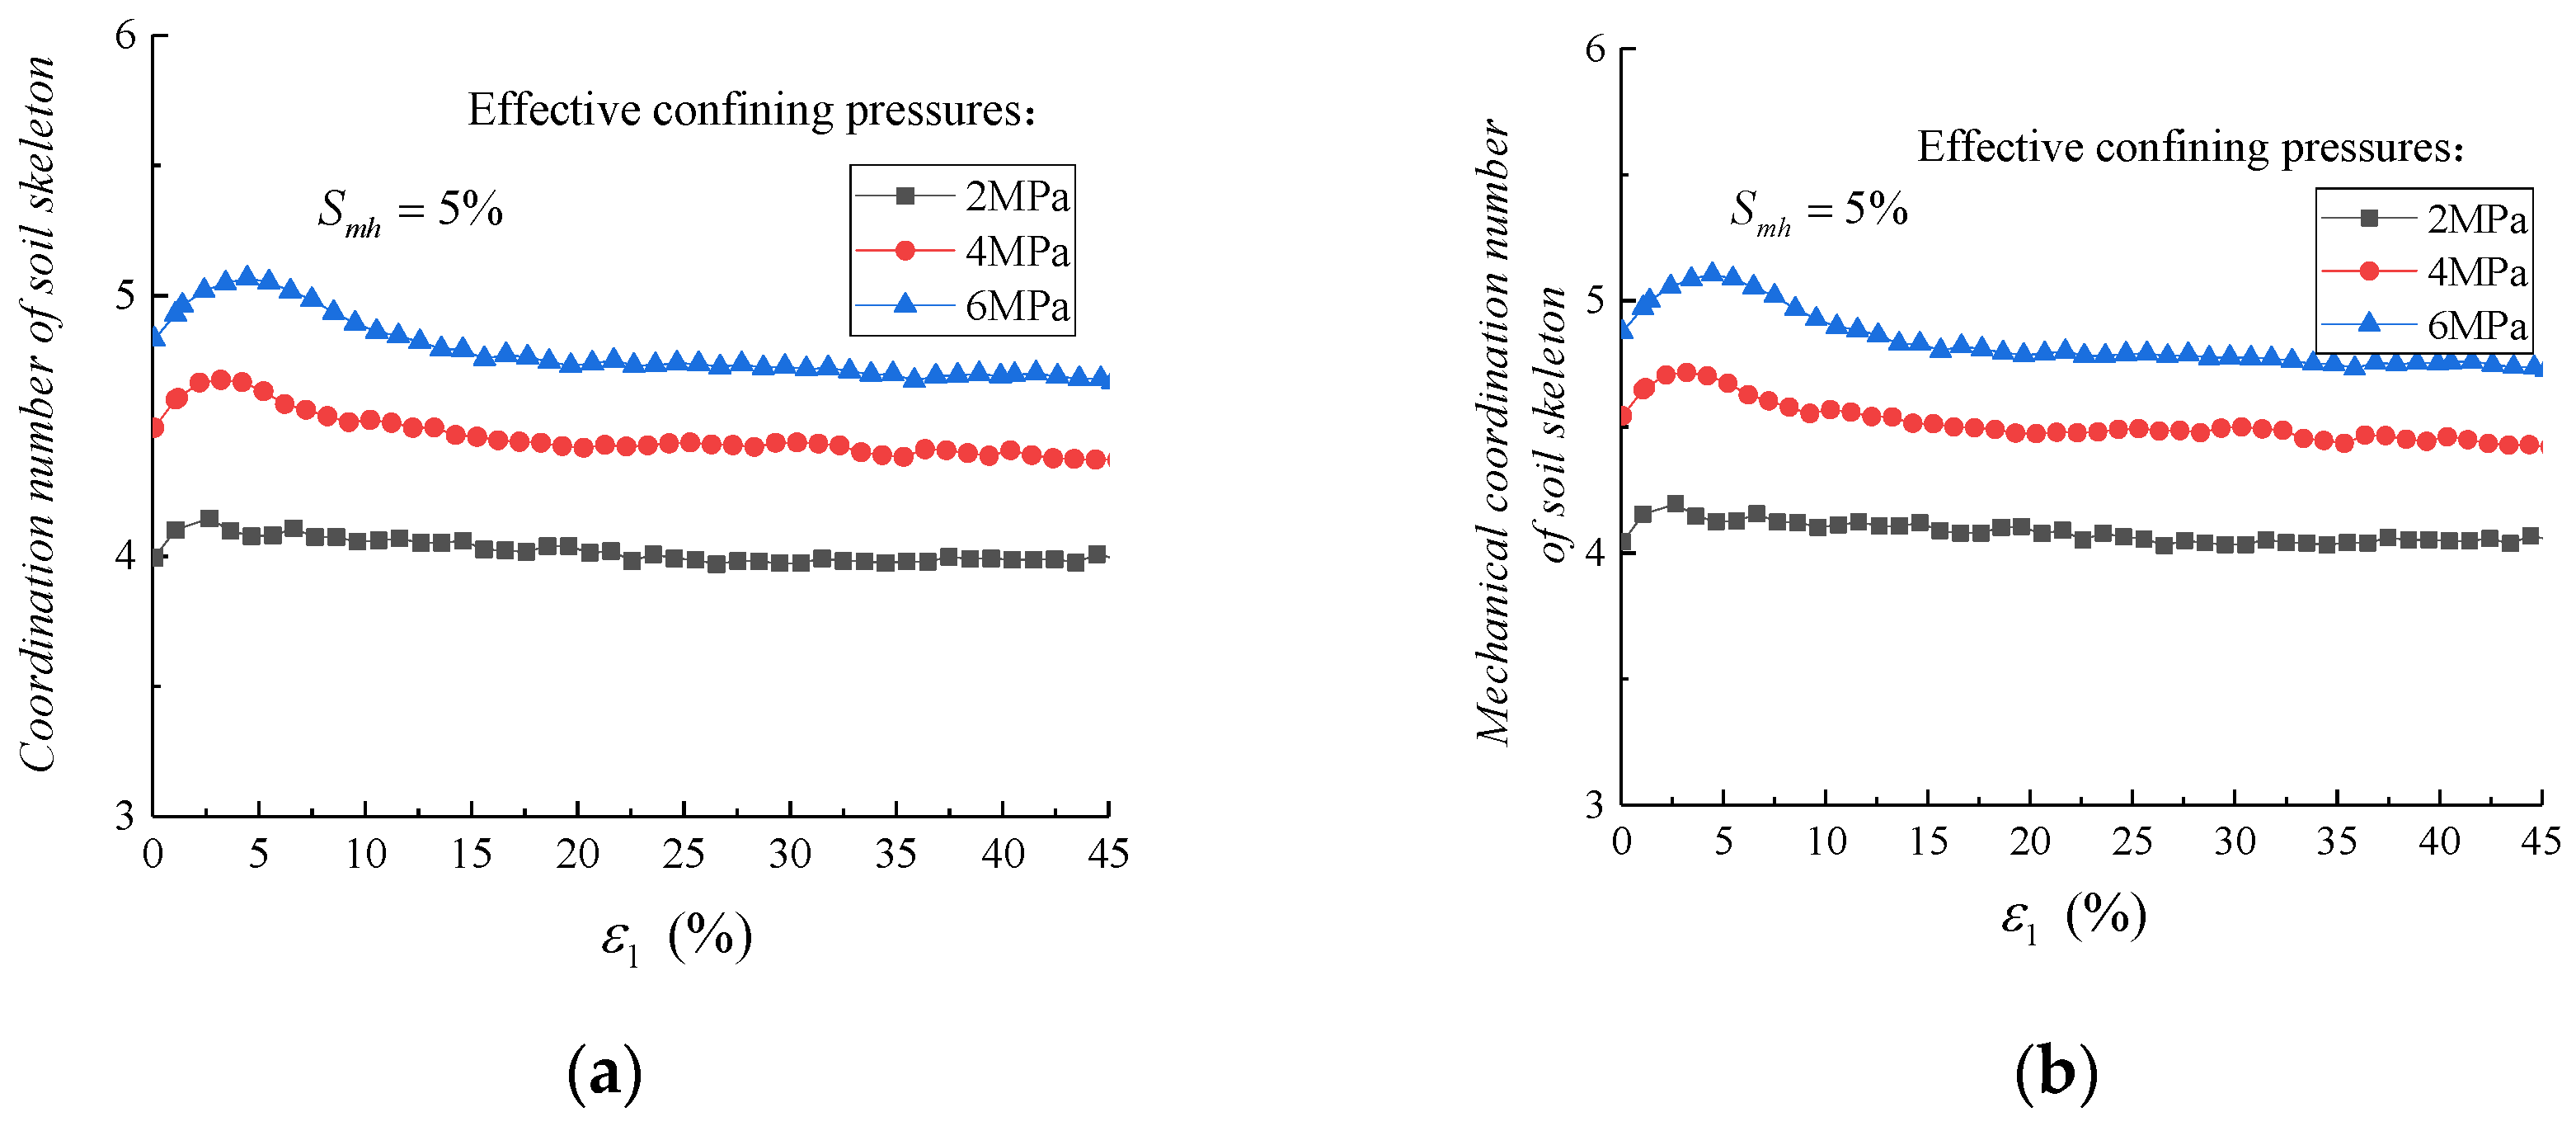
Figure 18.
CN and MCN of the soil skeleton in the pore-filled MHBS with different Smh values under 2.0 MPa (a) CN of the soil skeleton (b) MCN of the soil skeleton.
Figure 18.
CN and MCN of the soil skeleton in the pore-filled MHBS with different Smh values under 2.0 MPa (a) CN of the soil skeleton (b) MCN of the soil skeleton.

Table 1.
Parameters of granules used in the DEM.
| Parameters | Value | Parameters | Value |
|---|---|---|---|
| Soil density/(g/cm3) | 2.65 | MH density/(g/cm3) | 0.9 |
| Wall normal stiffness/(N/m) | 1.5 × 10⁵ | Wall tangential stiffness/(N/m) | 1.0 × 10⁵ |
| /(N/m) | 1.5 × 10⁵ | /(N/m) | 1.0 × 10⁵ |
| /(N/m) | 1.5 × 10⁴ | /(N/m) | 1.0 × 10⁴ |
| 0.5 | 0.04 |
Disclaimer/Publisher’s Note: The statements, opinions and data contained in all publications are solely those of the individual author(s) and contributor(s) and not of MDPI and/or the editor(s). MDPI and/or the editor(s) disclaim responsibility for any injury to people or property resulting from any ideas, methods, instructions or products referred to in the content. |
© 2023 by the authors. Licensee MDPI, Basel, Switzerland. This article is an open access article distributed under the terms and conditions of the Creative Commons Attribution (CC BY) license (https://creativecommons.org/licenses/by/4.0/).
Share and Cite
MDPI and ACS Style
He, J.; Li, T.; Rui, Y. Geomechanical Properties of Deep-Sea Pore-Filled Methane Hydrate-Bearing Soils at Critical State Using DEM Analysis. Fractal Fract. 2023, 7, 681. https://doi.org/10.3390/fractalfract7090681
AMA Style
He J, Li T, Rui Y. Geomechanical Properties of Deep-Sea Pore-Filled Methane Hydrate-Bearing Soils at Critical State Using DEM Analysis. Fractal and Fractional. 2023; 7(9):681. https://doi.org/10.3390/fractalfract7090681
Chicago/Turabian StyleHe, Jie, Tao Li, and Yi Rui. 2023. "Geomechanical Properties of Deep-Sea Pore-Filled Methane Hydrate-Bearing Soils at Critical State Using DEM Analysis" Fractal and Fractional 7, no. 9: 681. https://doi.org/10.3390/fractalfract7090681