Article

Dynamic Compressive Mechanical Property Characteristics and Fractal Dimension Applications of Coal-Bearing Mudstone at Real-Time Temperatures

1
State Key Laboratory of Geomechanics and Deep Underground Engineering, China University of Mining and Technology, Xuzhou 221116, China
2
School of Physics and New Energy, Xuzhou University of Technology, Xuzhou 221018, China
3
College of Mining Engineering and Geology, Xinjiang Institute of Engineering, Urumqi 830023, China
4
School of Mechanics and Civil Engineering, China University of Mining and Technology, Xuzhou 221116, China
5
School of Civil Engineering, Xuzhou University of Technology, Xuzhou 221018, China
6
School of Mathematics and Statistics, Suzhou University, Suzhou 234000, China
*
Authors to whom correspondence should be addressed.
Fractal Fract. 2023, 7(9), 695; https://doi.org/10.3390/fractalfract7090695
Submission received: 27 July 2023 / Revised: 13 September 2023 / Accepted: 15 September 2023 / Published: 18 September 2023

Abstract

:
Coal-bearing rocks are inevitably exposed to high temperatures and impacts (rapid dynamic load action) during deep-earth resource extraction, necessitating the study of their mechanical properties under such conditions. This paper reports on dynamic compression tests conducted on coal-bearing mudstone specimens at real-time temperatures (the temperature of the rock remains constant throughout the impact process) ranging from 25 °C to 400 °C using a temperature Hopkinson (T-SHPB) test apparatus developed in-house. The objective is to analyze the relationship between mechanical properties and the fractal dimension of fractured fragments and to explore the mechanical response of coal-bearing mudstone specimens to the combined effects of temperature and impact using macroscopic fracture characteristics. The study found that the peak stress and dynamic elastic modulus initially increased and then decreased with increasing temperature, increasing in the 25–150 °C range and monotonically decreasing in the 150–400 °C range. Based on the distribution coefficients and fractal dimensions of the fractured fragments, it was found that the degree of damage of coal-bearing mudstone shows a trend of an initial decrease and then an increase with increasing temperature. In the temperature range of 25–150 °C, the expansion of clay minerals within the mudstone filled the voids between the skeletal particles, resulting in densification and decreased damage. In the temperature range of 150–400 °C, thermal stresses increased the internal fractures and reduced the overall strength of the mudstone, resulting in increased damage. Negative correlations between fractal dimensions, the modulus of elasticity, and peak stress could be used to predict rock properties in engineering.

1. Introduction

The global emphasis on efficient and clean energy systems has drastically altered traditional fossil fuel extraction methods. Some special technologies have emerged, such as underground gasification of coal seams, in situ thermal injection mining of oil shale, and low-rank coal [1,2]. During the mining process, the rock near the coal seam becomes exposed to high temperatures and disturbances. The surrounding rock in this state is easily fractured, which can lead to significant engineering disasters [3,4,5,6]. The disturbance during mining can be seen as the impact on the rock, which means that a large dynamic load is applied in a short period of time. Coal-bearing mudstone is a typical overburdened rock vulnerable to damage due to significant changes in internal components and physical and mechanical properties at high temperatures and impacts [7,8,9]. There is an urgent need to study the dynamic mechanical response of coal-bearing sandstones under the combined effects of temperature and impact.
Research on the mechanical properties of heated rock primarily involves post-temperature and real-time temperature action [10,11,12]. The real-time temperature condition means that the temperature of the rock remains constant throughout the impact process, which is more in line with the actual rock environment than the more difficult method of conducting impact tests after temperature loading. Xianfeng Liu et al. [13] investigated the effects of temperature on the tensile strength of two types of Australian mudstone. Jie Chen et al. [14] analyzed the effects of thermal damage on the evolution of thermally damaged cracks on rock salt, gypsum, and mudstone surfaces. Furong Tang et al. [15] studied the variation of specific heat capacity and thermal conductivity with temperatures ranging from 100 °C to 1000 °C for six coal-bearing stratigraphic rock samples, including mudstone. In contrast, Lianying Zhang, Ji’an Luo, et al. [16,17,18,19,20,21,22] conducted uniaxial compression tests on mudstone at different temperatures using the MTS 810 electro-hydraulic servo system and the MTS 652.02 high-temperature testing machine to analyze the thermal damage characteristics and microscopic damage structure of mudstone at high temperatures, finding the brittle–ductile transition properties of mudstone under high-temperature action. Furthermore, Yang Xiao [23] et al. utilized high-resolution X-ray-computed tomography (CT) to investigate the fracture extension of anthracite and mudstone samples extracted from the Qinshui coalfield in Shanxi Province, Northern China, under high-temperature action. The amount of post-temperature research is much higher than that of real-time temperatures. When rocks are cooled from high temperatures to room temperature, they are susceptible to thermal shock damage and exhibit different mechanical properties than real-time temperatures. To compare the differences between post-temperature action and real-time temperature action, Luo Shengyin et al. [24] conducted physical property tests and uniaxial compression tests on rock samples after natural cooling at high temperatures and at real-time temperature, analyzing and comparing the changes in physical and mechanical properties of the specimens in different states. The difference between the two effects is noted based on the degree of deterioration of each mechanical property, and a temperature inflection point is proposed. Specifically, when the temperature is below 400 °C, the decline in natural cooling is lower than that of real-time temperature. In comparison, when the temperature is above 400 °C, the deterioration caused by natural cooling is more severe than at real-time temperatures. In geological engineering, mudstone in high-temperature rock formations is exposed to real-time high-temperature conditions for an extended period. The mechanical properties of mudstone at real-time temperature differ from post-temperature, and there are fewer research results. It is necessary to research the mechanical properties of mudstone under real-time temperature conditions.
During excavation and mining in engineering production, certain disturbances have been generated that transfer to the rock body near the coal seam in the form of energy waves, making it more susceptible to damage. These disturbances can be considered a high strain rate effect, which scholars have extensively investigated using experimental studies, numerical simulations, and theoretical models [25,26,27,28,29,30,31,32]. For instance, Liangjie Guo et al. [33] conducted dynamic compression tests on mudstone in the Huainan mine using a 50 mm diameter split-Hopkinson compression bar to investigate the dynamic mechanism, fracture characteristics, and energy dissipation of saturated mudstone. Similarly, Siming Kao et al. [34] tested pre-cracked and grouted sandy mudstone specimens using the SHPB test apparatus and recorded the dynamic damage process with a high-speed camera. Lingdong Meng et al. [35] examined the dynamic mechanical properties and intrinsic relationships of weakly consolidated rock masses under dynamic loading by Hopkinson compression bar tests, using specimens with different water contents. There are few existing kinetic studies involving coal-bearing mudstone. The dynamic mechanical properties of coal-bearing mudstone during the combined action of high temperature and disturbance in real time have not been adequately researched. The mechanical properties of coal-bearing mudstone as a composite-medium sedimentary rock during and after the action of high temperature in real time exhibit some differences. Coal-bearing mudstone is exposed to high temperatures and a robust perturbation of the geological environment for an extended period in actual underground coal-bed gasification projects [9].
This study conducts dynamic compression tests on coal-bearing mudstone specimens at room temperature (25 °C) and real-time temperatures of 50 °C, 100 °C, 150 °C, 200 °C, 250 °C, 300 °C, 350 °C, and 400 °C using the self-developed temperature Hopkinson (T-SHPB) test device. The loading pressure ranges from 0.2 MPa to 0.7 MPa, allowing the analysis of the mechanical response of coal-bearing mudstone at high temperature and high strain rates by adjusting the air pressure of the storage bin and changing the impact speed of the impact bar.

2. Characterization and Test Methods for Coal-Bearing Mudstone

The coal-bearing mudstone sample used in this study was obtained from a coal mine in Xuzhou. The stress–strain behavior and damage mechanism of the standard rock sample (ϕ50 × 100 mm) were evaluated using a universal testing machine, as depicted in Figure 1. The specimen exhibits a peak strength of 18.51 MPa and a modulus of elasticity of 898.08 MPa. The strain at the peak volume is about 55% of the peak stress, which is relatively low compared to hard rocks and suggests that the material belongs to the soft rock category. The damage pattern of the rock sample comprises both tensile and shear damage; vertical cracks are observed in the upper section due to tensile damage, whereas diagonal cracks appear in the middle and lower areas due to shear damage, with some transverse cracks from interlayer damage. Compared to hard rocks, coal-bearing mudstone represents a more complex damage pattern.

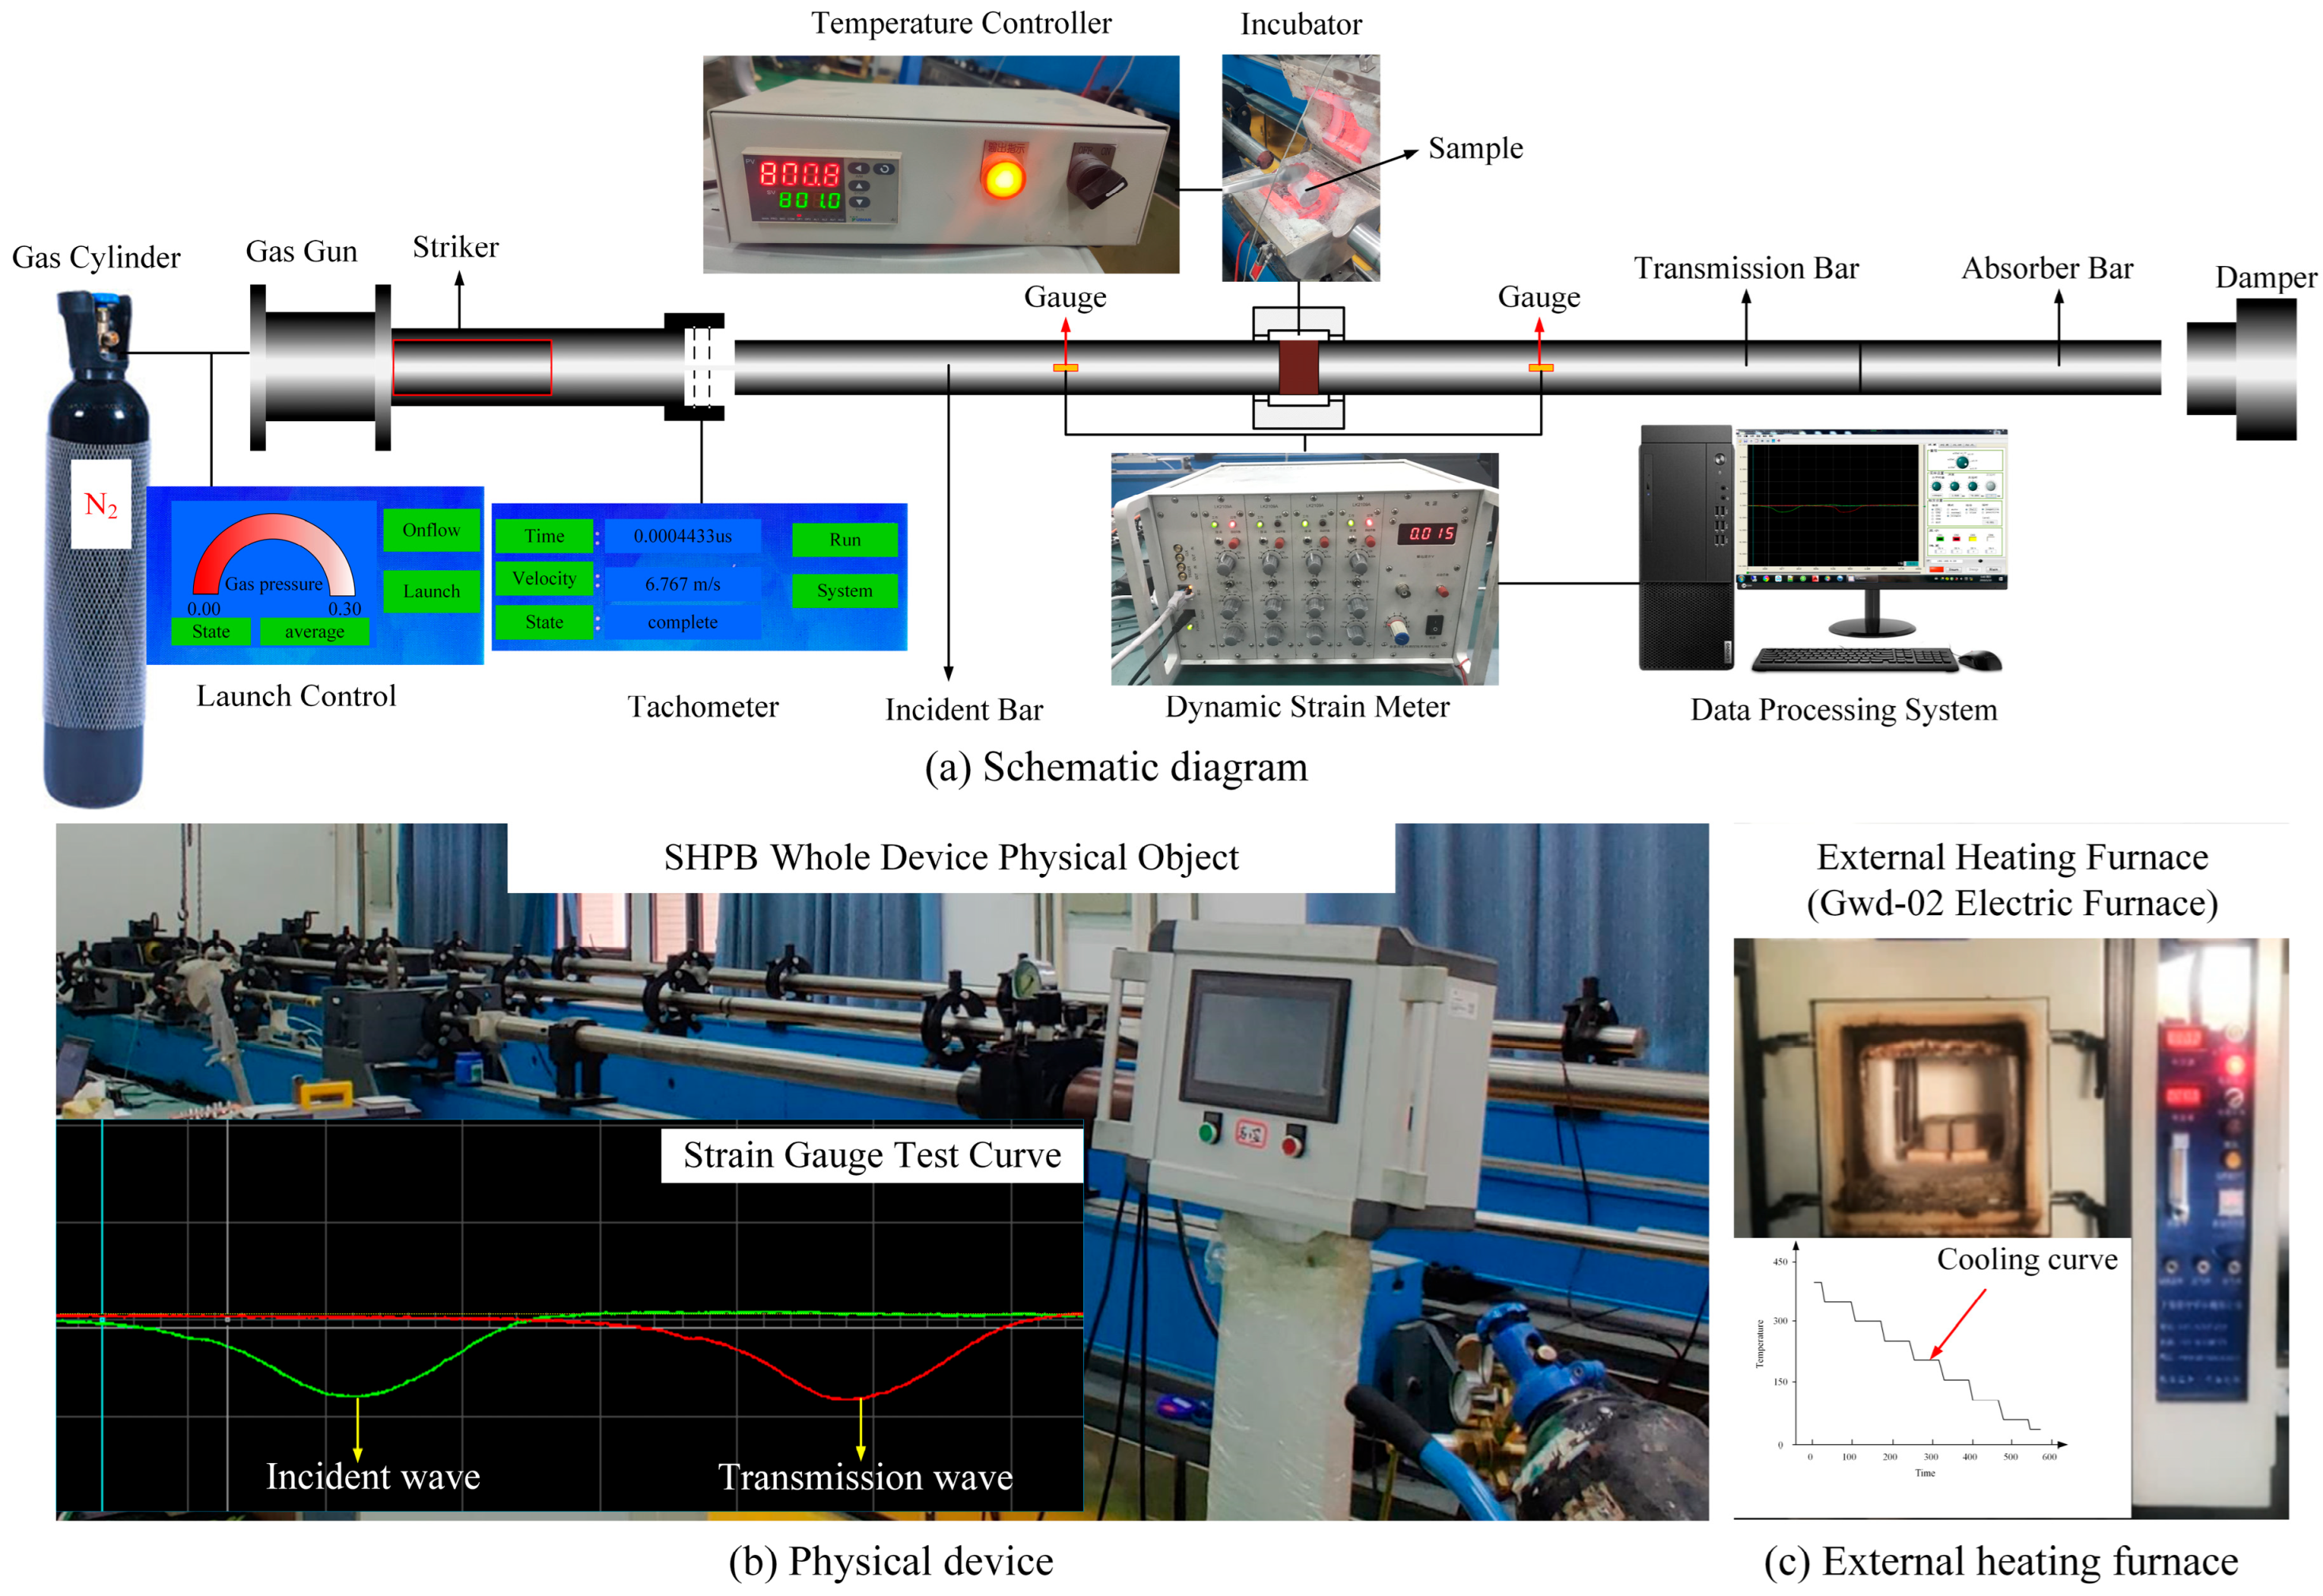
2.1. Real-Time Temperature SHPB Testing Method and Process

Per the International Commission on Rock Dynamics test standard [33,34], a cylindrical specimen (ϕ50 × 50 mm) was utilized for the kinetic test (see Figure 2). The conventional SHPB test device includes a power drive, load transfer, velocity measurement, and data acquisition and processing systems. To attain the high-temperature status of the mudstone rock sample in real time during the test, it is imperative to incorporate a temperature environment furnace and temperature controller between the incident and transmission bars, as illustrated in Figure 3. Nitrogen gas is injected into the pressurized gas chamber, and the chamber pressure is adjusted to regulate the bullet impact on the incidence bar. The stress wave is transmitted along the incidence bar to the high-temperature environment furnace, where the coal-bearing mudstone specimens at high temperature are damaged. The remaining impact energy is then transferred to the energy absorbing bar and the damping absorber through the transmission bar to be entirely immersed. The stress–strain curve of the coal-bearing mudstone is indirectly calculated via the strain information attached to the incidence and transmission bars. A schematic diagram of the test set-up is presented in Figure 3a, and the specific physical arrangement is shown in Figure 3b. In the installation process of the device, there are strict requirements on the level. Before the test starts, we need to ensure that the bars are located at the same level with the help of the leveling device on the bar system. The overall error of the height of the central axis of this paper’s incidence and transmission bars is in the range of ±1%. It can ensure that the incident and transmitted rods can realize complete alignment of the end faces at different contact positions. A rubber shaping sheet must be attached to the leading edge of the incident bar to adjust the rectangular wave to a half-sine wave. This ensures that the difference between the incident wave and the transmitted wave is within 5% in the nulled condition, thereby ensuring that the rock sample undergoes a long rising stress period to achieve a uniform internal stress state based on the assumption of a one-dimensional stress wave [36].
It can be observed that the incident and transmitted waves are almost identical in the airborne condition, demonstrating the stability of the real-time high-temperature SHPB test rig.
Using only a high-temperature ambient furnace necessitates a long heating time. The continuous high-temperature thermal exposure can cause thermal damage to the incident and transmissive bars, reducing their lifespan. To ensure safe and efficient testing, the rock sample is heated separately using an external furnace, as shown in Figure 3c. The furnace was heated at a predetermined temperature of 10 °C/min and kept at a constant temperature for four hours to ensure uniformity in specimen heating. The maximum temperature for the real-time temperature was set to 400 °C because, during the initial testing phases, it was discovered that some of the coal-based mudstone samples disintegrated after exceeding 400 °C. Eight real-time high-temperature conditions ranging from 50 °C to 400 °C were chosen for dynamic compression testing on coal-bearing mudstone samples. The velocity of the impact bar was altered by adjusting the air pressure in the gas chamber during the tests to simulate various shock waves resulting from strong perturbations in engineering. Loading air pressure ranges from 0.2 MPa to 0.7 MPa were used in six different cases, and three tests were conducted for each temperature and air pressure case. To compare the data results of the three specimens, the two specimens with similar data results were first selected; then, the specimen closer to the average of the three data was selected as the typical data result of the group to be analyzed. The specific test procedure is outlined below:
  • The tests are conducted using a high-to-low temperature gradient approach, with each rock sample pressure gradient tested at a particular temperature gradient before moving to the next one. The mudstone obtained from coal-bearing strata is placed in an external heating oven and subjected to a predetermined temperature for 10 min in a high-temperature ambient oven. The sample is then placed between the incoming and transmitting bars using a fire clamp to ensure that the temperature difference between the displayed real-time temperature and the preset temperature is within ±1 °C.
  • The air pressure score should be adjusted before swiftly holding the mudstone rock sample in place with the incidence and transmission bars for impact testing. During this process, it is essential to record the impact bullet velocity and strain signals in the incidence and transmission bars.
  • After the test, the incident and transmission bars are promptly extracted from the high-temperature ambient furnace. The rock samples are then retrieved using an iron spoon and transferred into an iron container. The container is subsequently placed inside an externally heated furnace with an appropriate temperature gradient to ensure that the samples remain intact and undamaged during the high-temperature ambient cooling process.
  • Once the impact tests for all rock samples at a particular temperature gradient are complete, the fragments are gradually cooled to room temperature within an externally heated furnace with a temperature reduction gradient. The samples are then ready for the next round of impact tests at a different temperature gradient. For instance, if the preset temperature is 400 °C, the initial holding time is 30 min at 400 °C, followed by a temperature reduction of 50 °C at a rate of 10 °C/min, along with an additional 60-min holding time at the gradient. Finally, the temperature is further reduced until it reaches room temperature (25 °C), as demonstrated in Figure 3c.
  • Upon completion of impact testing across all temperature gradients, the macroscopic damage characteristics and microscopic fracture patterns of the fractured rock samples are analyzed and quantified.

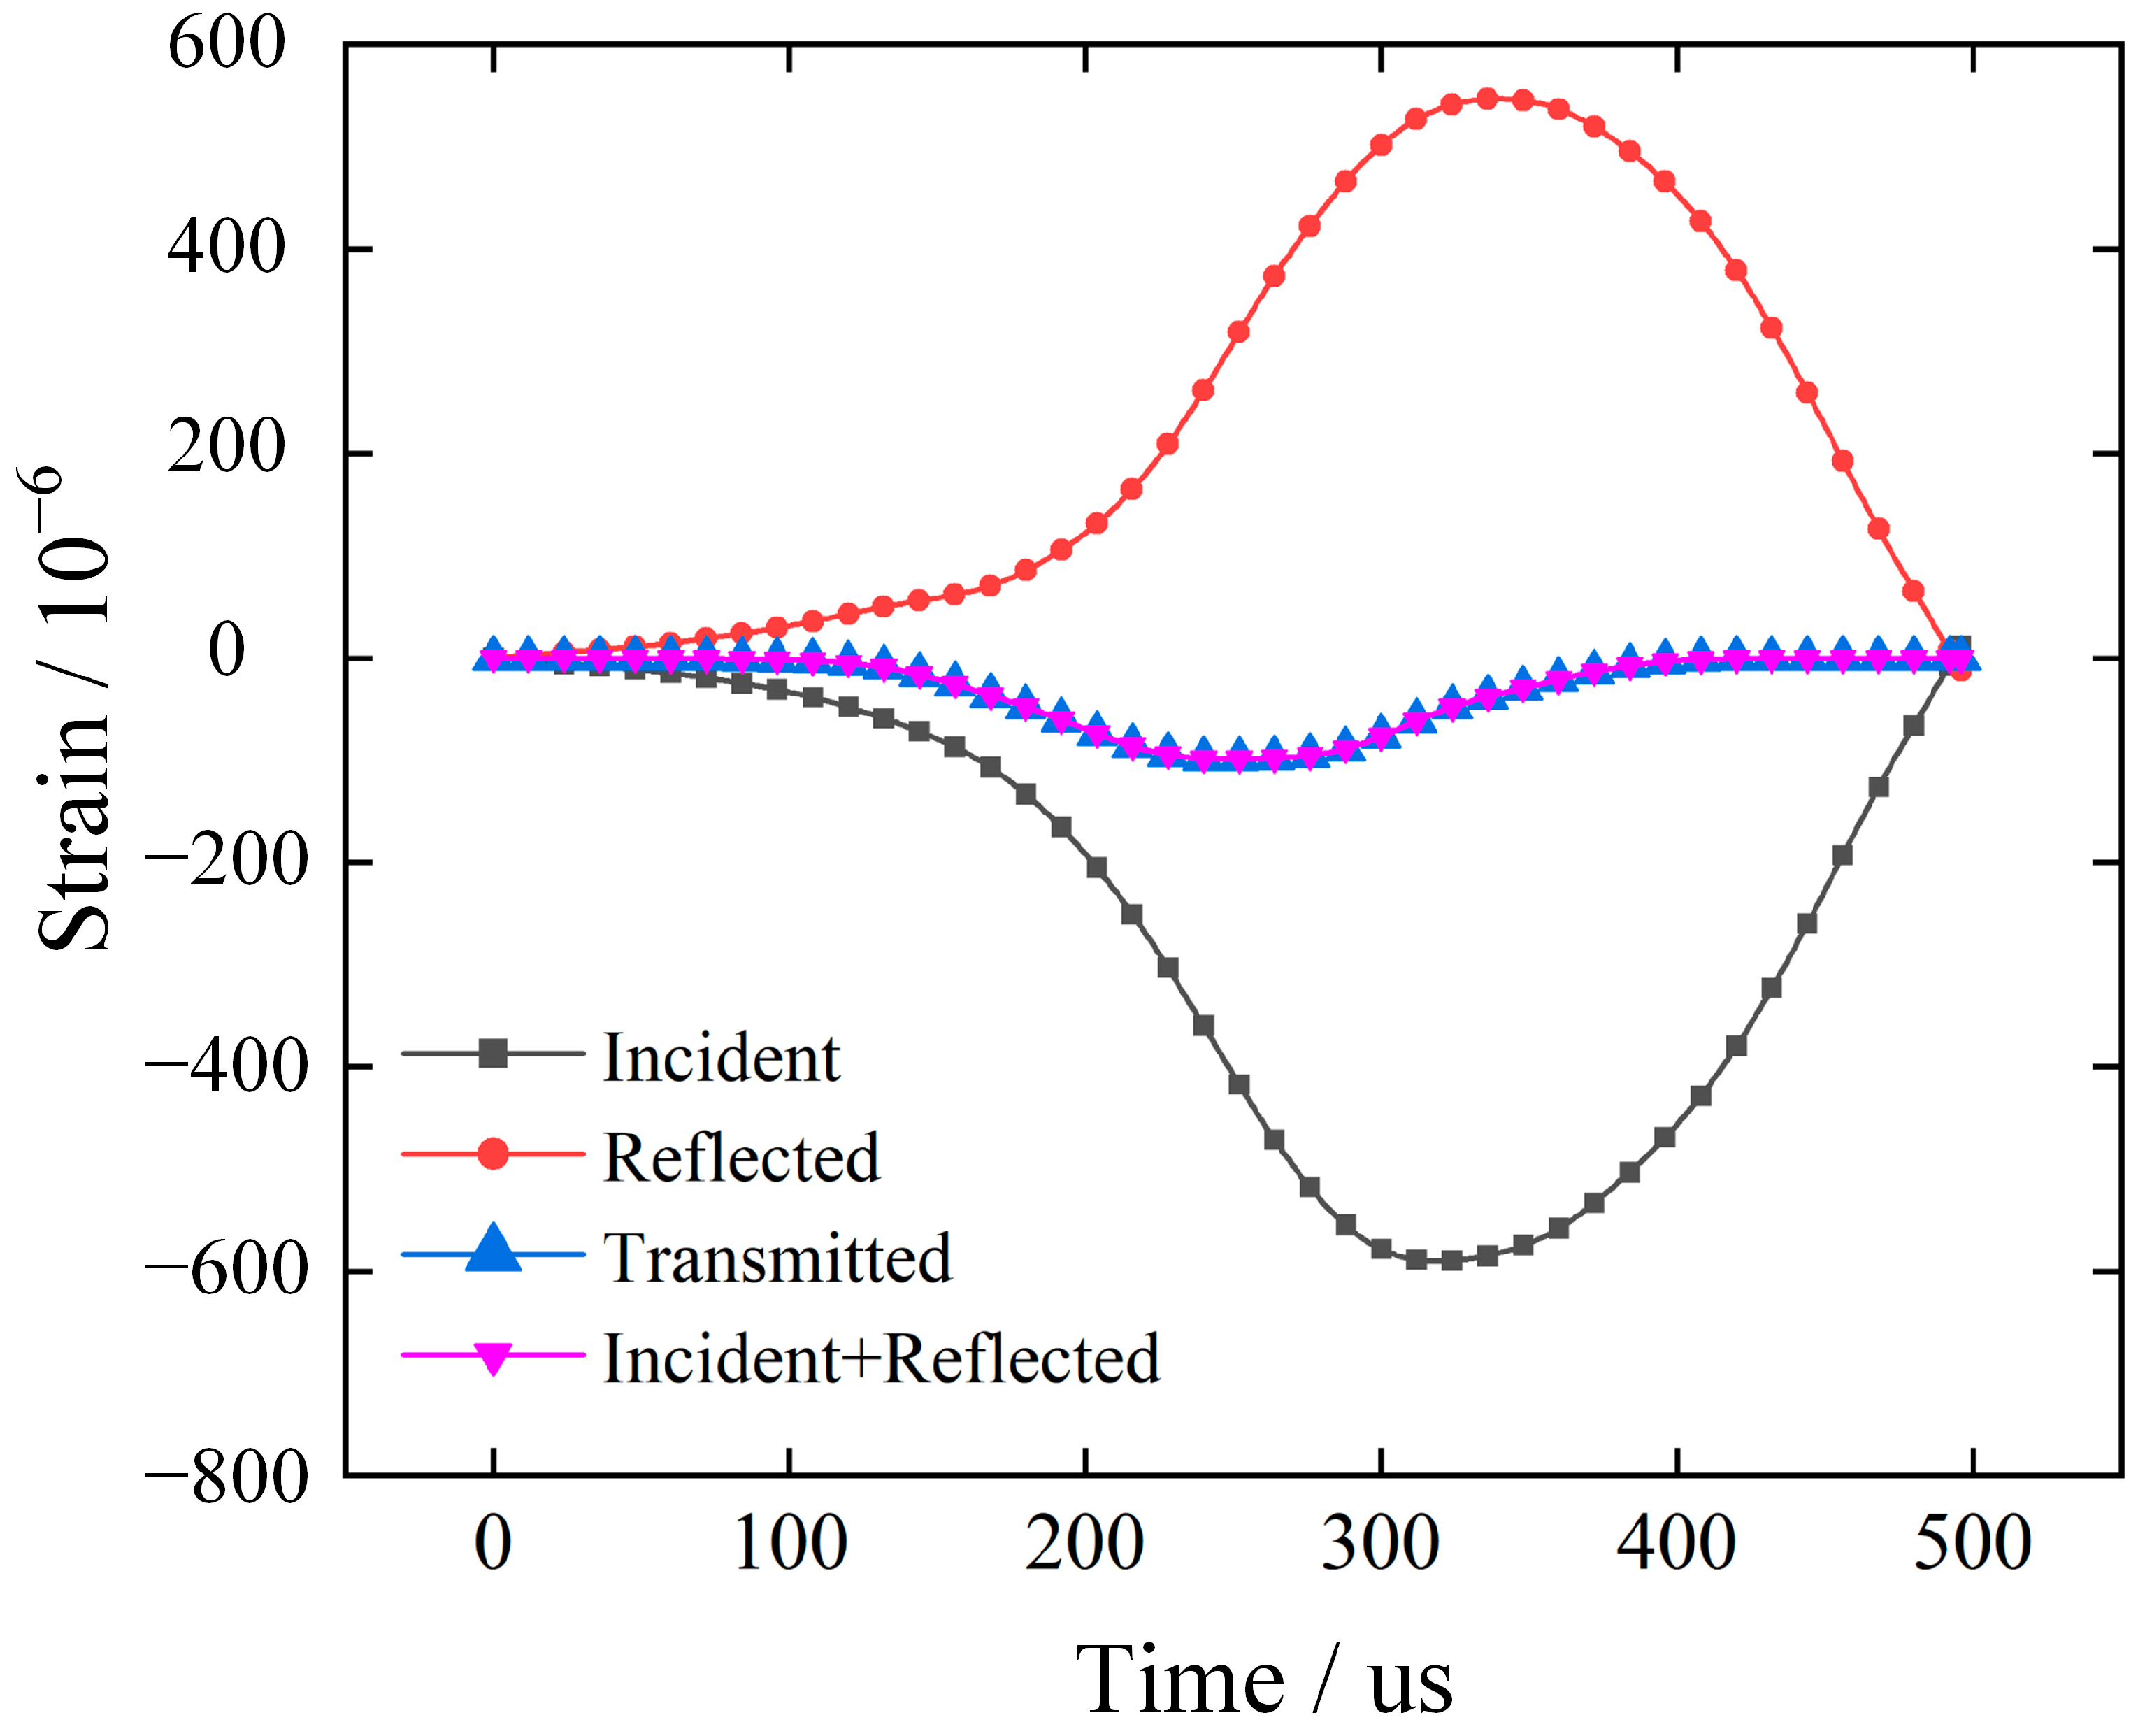
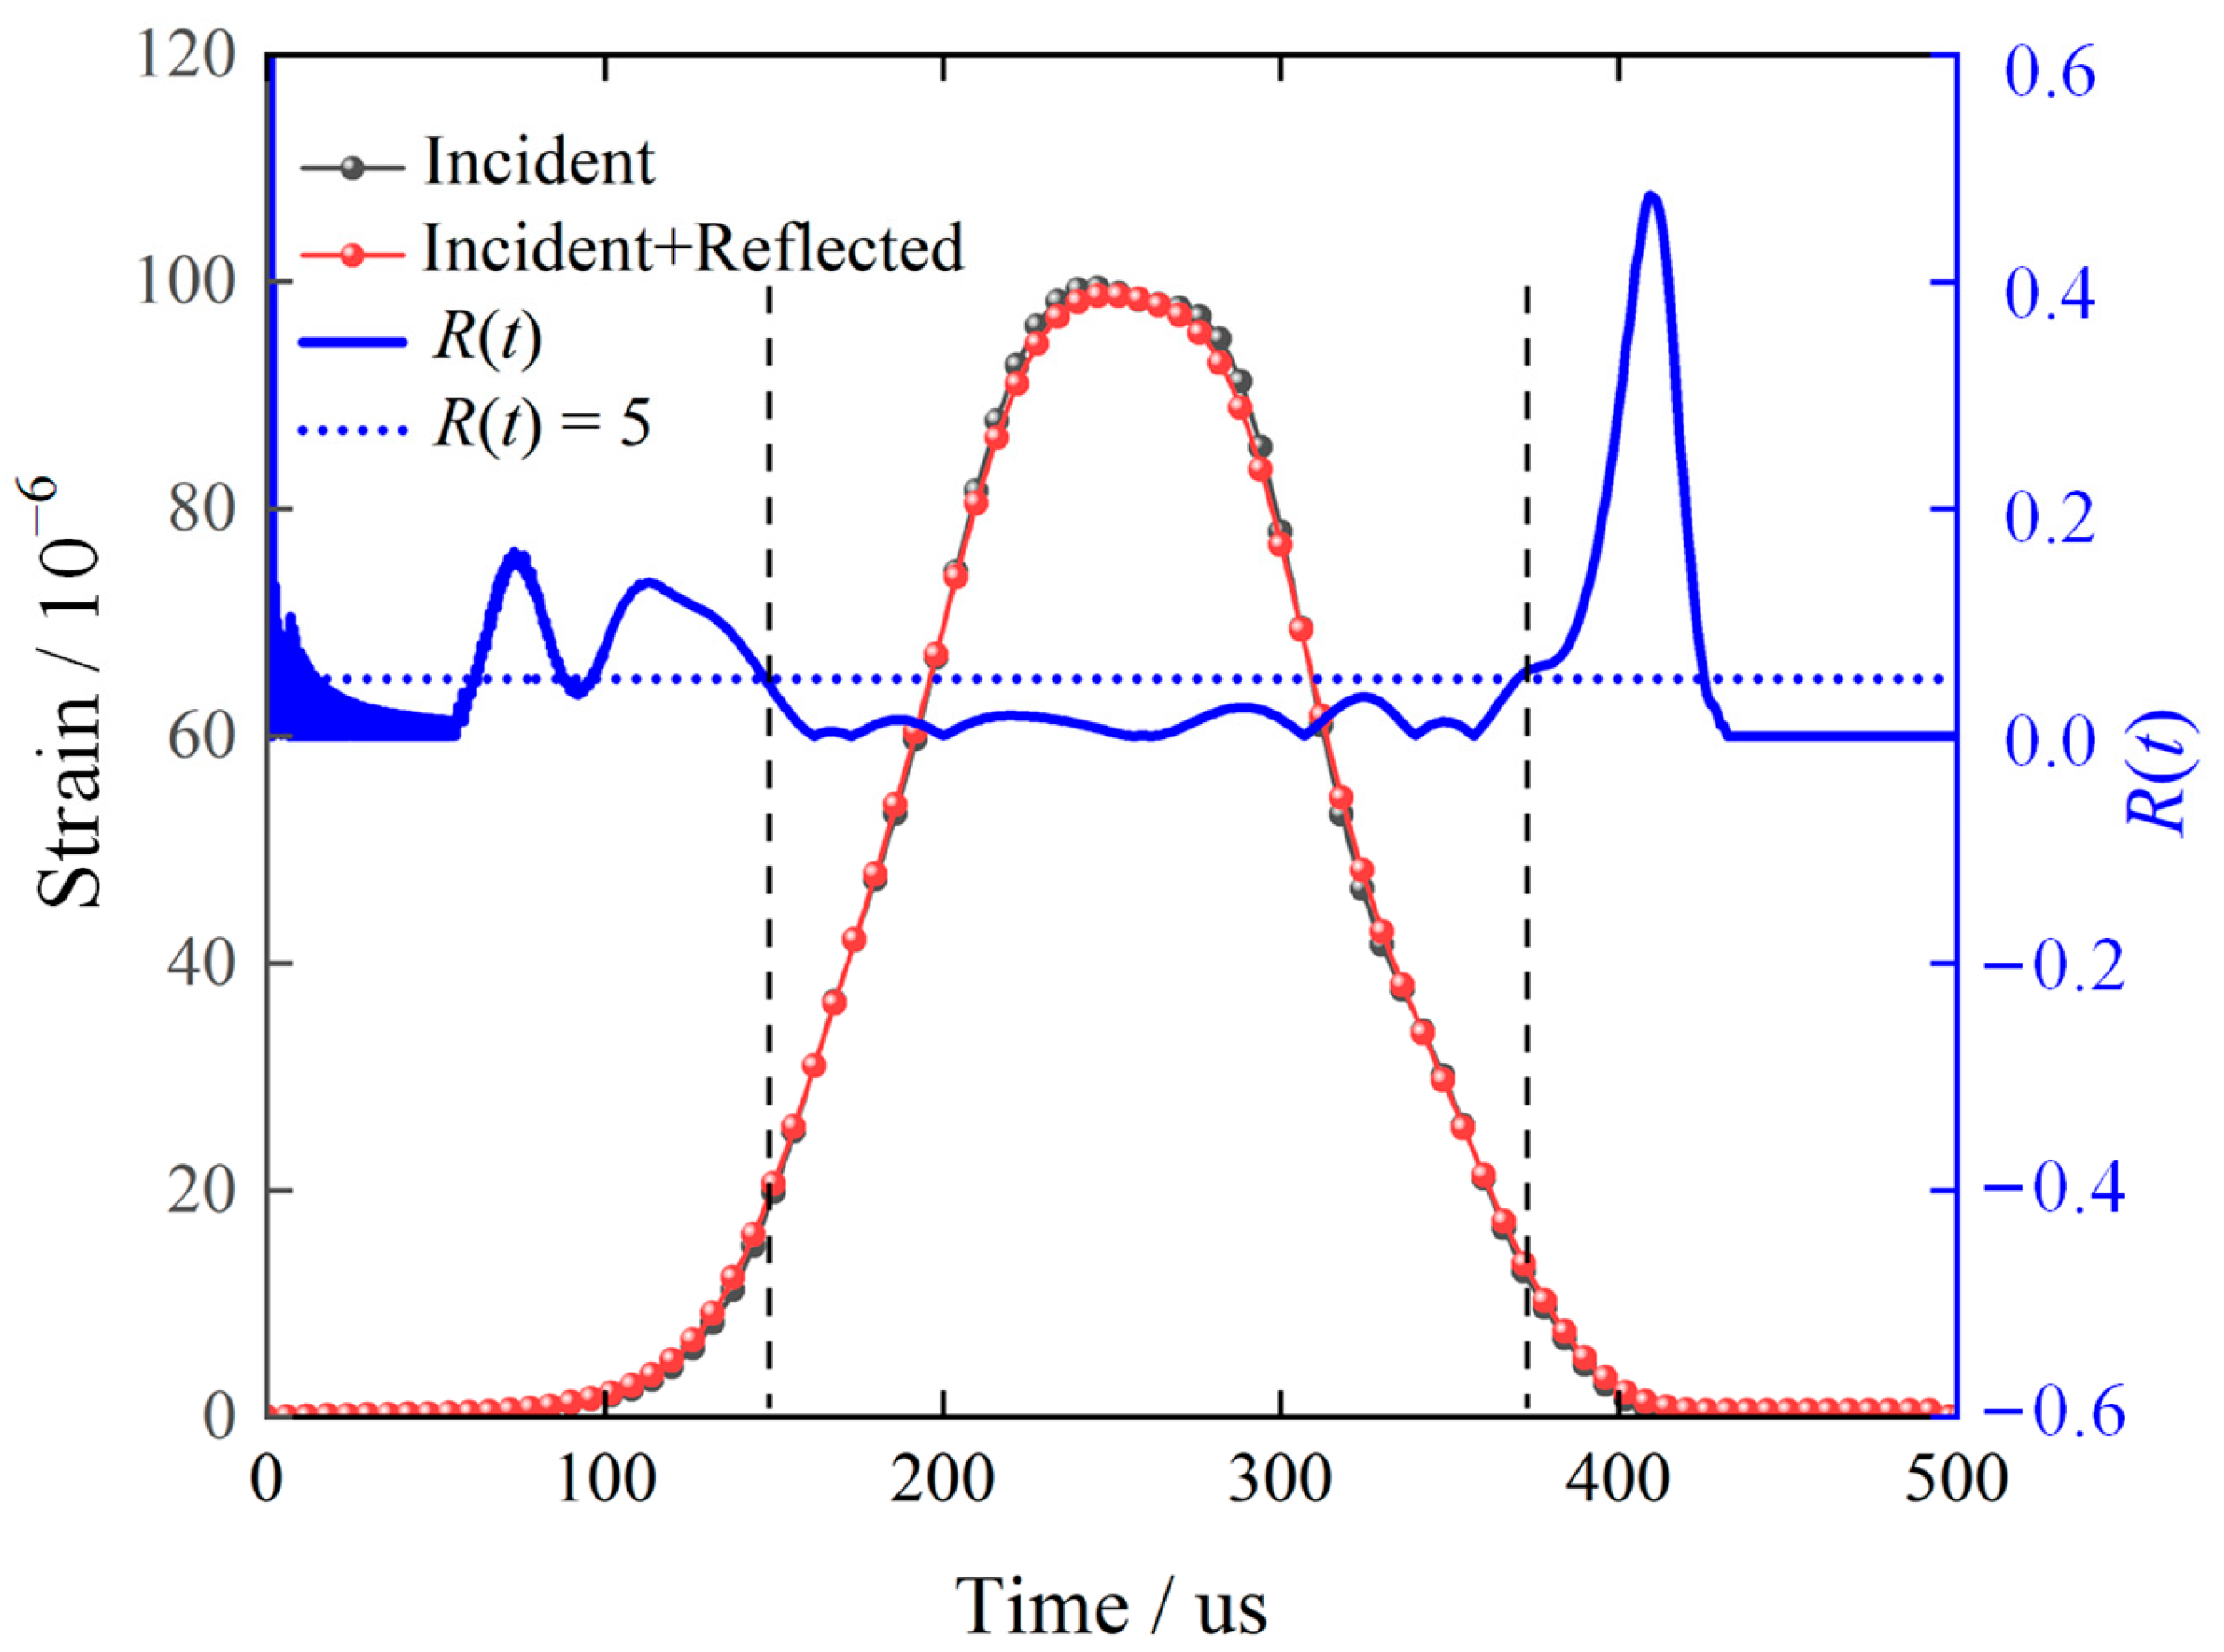
2.2. Test Principle and Accuracy Verification

This paper utilizes the three-wave formula to calculate the stress σ t , strain ε t , and strain rate ε ˙ t of a coal-bearing mudstone sample [37]. The formula is as follows:
ε ˙ t = C 0 L S ε I t ε R t ε T t ε t = C 0 L S 0 t ε I t ε R t ε T t d t σ t = A 0 2 A S E 0 ε I t + ε R ( t ) + ε T t ,
where E0 is the modulus of elasticity of the bar material, A0 is the area of the compressional bar, C0 is the wave velocity, LS is the original length of the specimen, and AS is the cross-sectional area. To ensure the accuracy of our experiment, we compare the error of the incident and reflected waves with the transmitted waves, as illustrated in Figure 4. The small, transmitted wave signal of the coal-bearing mudstone confirms the assumption of one-dimensional stress wave propagation. In contrast, the overlapping incident, reflected, and transmitted waves introduce the equilibrium index R(t) for quantitative analysis [38]. We use R(t) < 5% as the criterion for judgment and calculate it as follows:
R t = 2 ε I + ε R ε T ε I + ε R + ε T 5 % ,
Figure 5 illustrates the calculated equilibrium index R(t). We observe that the interval from the start of the rising edge to the end of the subsequent falling section satisfies the R(t) < 5% criterion, which characterizes the equilibrium time. Furthermore, the total equilibrium time exceeds four times the time required for the stress wave to pass through the specimen, demonstrating the feasibility of the test set-up.

3. Dynamic Compressive Mechanical Properties of Coal-Bearing Mudstone

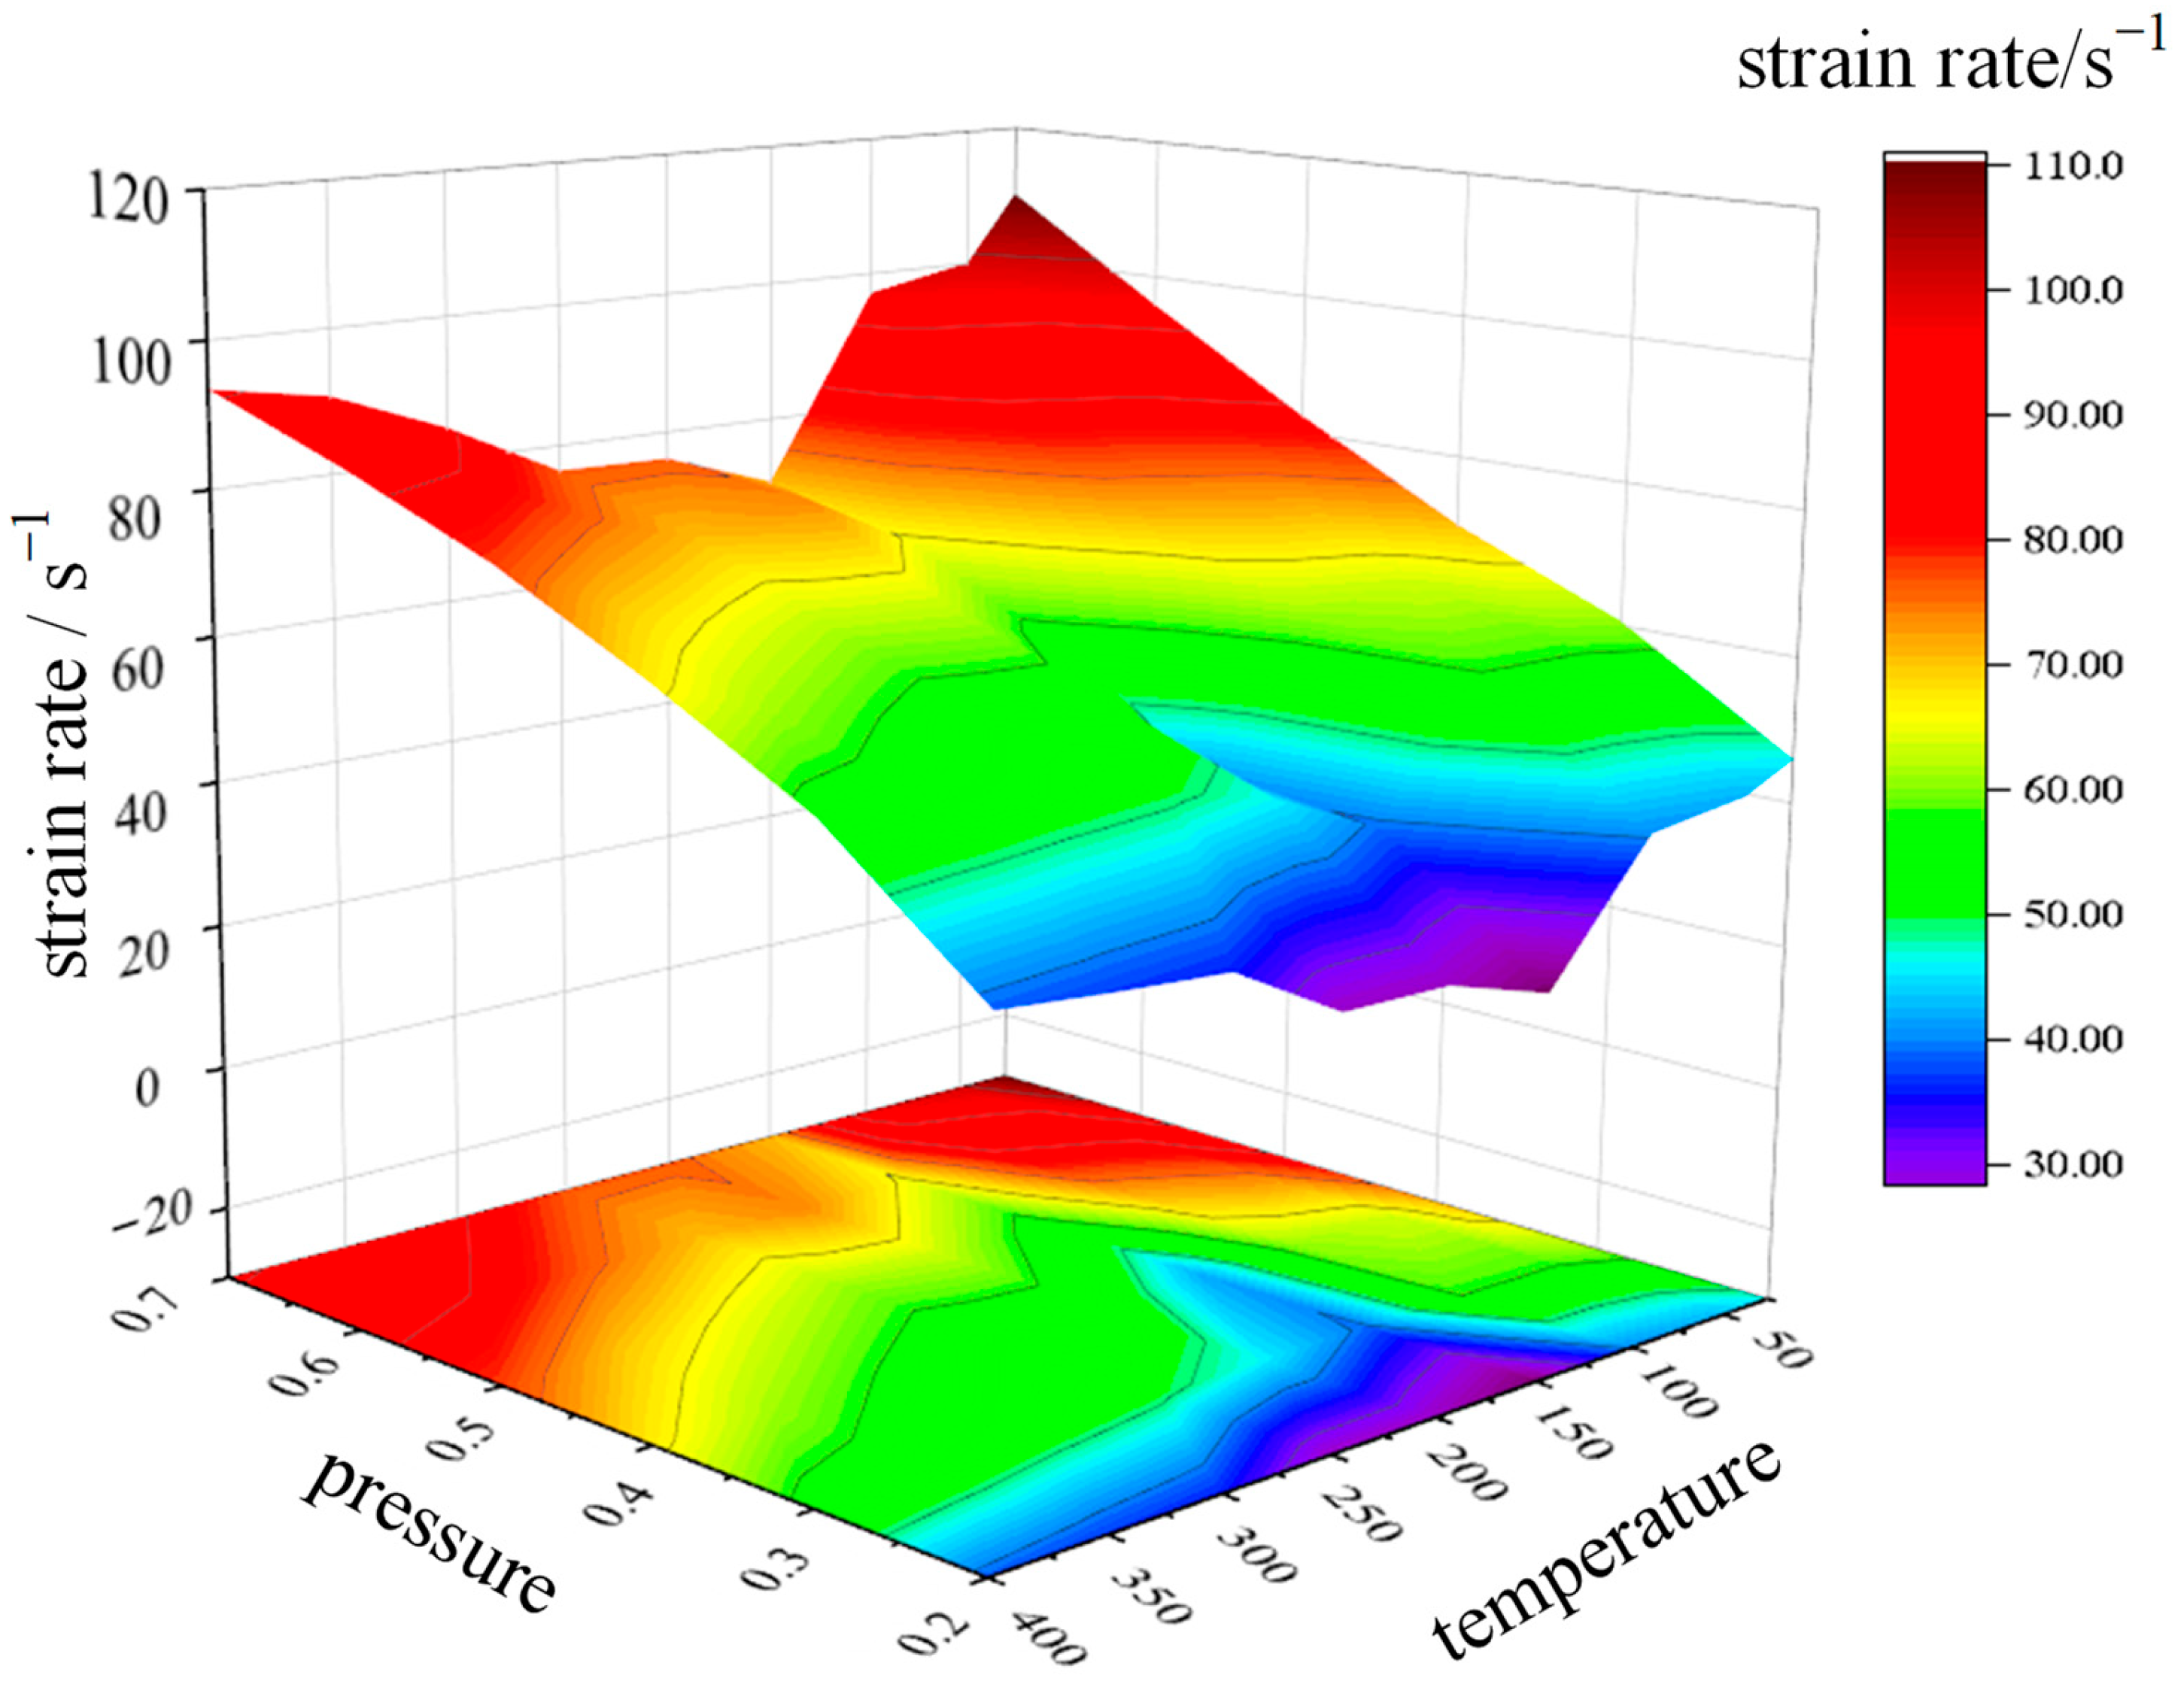
3.1. Variation of Strain Rate with Air Pressure

Air pressure serves only as an external action condition, and its influence is dependent on several factors, such as the weight of the bullet and the size of the air cavity. This study employs a dimensionless average strain rate as the independent variable to evaluate the effect on coal-bearing mudstone. The strain rate, as a function of time, can be determined using the three-wave method. The evaluation index is the average strain rate over the entire test duration, hereafter referred to as the strain rate. The strain rate varies with temperature and pressure, as shown in Table 1. Figure 6 displays the variation curve.
As depicted in Table 1 and Figure 6, the strain rate increased progressively with increasing pressure at a constant temperature. The effect of temperature on strain rate exhibited an increasing-then-decreasing trend, with the maximum increase observed at 150 °C. Specifically, the strain rate rose from 22.484 s−1 to 70.712 s−1, an increase of 214.50%. At a given pressure, the strain rate first decreased and then increased with increasing temperature. However, the strain rate at high temperatures was lower than at room temperature. The difference between the maximum and minimum strain rates at different air pressure was more pronounced at high pressure than at low pressure, indicating a more significant fluctuation in the strain rate with the temperature at high pressure.

3.2. The Variation Law of the Stress–Strain Curve

This paper compared the stress–strain curves obtained at the same pressure but different temperatures from 25 to 400 °C, as presented in Figure 7. The curves exhibit an insignificant compression-density phase, a significant elastic phase, a plastic deformation phase, and a damage phase. Compared with the static stress–strain curve, the plastic deformation stage of the stress–strain curve under impact is significantly increased. Moreover, the peak stresses increase with increasing strain rate at all temperatures, and the slope of the elastic phase gradually increases. However, the peak strains do not exhibit a significant pattern of change. Notably, the stress–strain curves at different temperatures show variations, with the maximum peak stress at high temperatures (300–400 °C) being smaller than that at room temperature (25–100 °C). To further understand this observation, a detailed statistical data analysis is necessary.

3.3. The Change in Dynamic Compression Mechanical Properties

The dynamic stress is calculated based on the three-wave method (Formula (1)) and is accurate to three decimal places. The modulus of elasticity is calculated based on the stress and strain during the elastic phase, and the accuracy of the data is also retained to three decimal places. Table 2, Table 3 and Table 4 present the dynamic mechanical properties, peak stress, elastic modulus, and peak strain at different temperatures and pressures. Figure 8 illustrates the variations of the dynamic mechanical properties, peak stress, elastic modulus, and peak strain with temperature and pressure.
Based on Table 2 and Figure 8a, it can be observed that the peak stress tends first to increase and then decrease as the temperature rises, with the highest value appearing in the temperature range of 50–150 °C. Additionally, the increase gradually reduces as the pressure increases. At the same temperature, the peak stress increases monotonically with increasing pressure, with the highest increment occurring at 50 °C. The peak stress rises from 38.323 MPa to 106.089 MPa, indicating an increase of 176.83%. As shown in Table 3 and Figure 8b, at the same pressure, the elastic modulus tends to increase and then decrease as the temperature increases, with the maximum value also occurring in the temperature range of 50–150 °C, with the increment decreasing as the pressure increases. At the same temperature, the elastic modulus increases monotonically with increasing pressure, with the highest increment occurring at 350 °C. The elastic modulus increases from 3.288 GPa to 11.586 GPa, indicating an increase of 252.37%. As presented in Table 4 and Figure 8c, the peak strain shows small fluctuations in temperature and pressure. The changes in peak stress and elastic modulus indicate that increasing temperature has a specific enhancement effect on the coal-derived mudstone, with the temperature enhancement interval being 50–150 °C. However, the strength at high temperatures decreases significantly relative to room temperature.

3.4. Variation of Dynamic Mechanical Properties with Temperature

The dynamic mechanical properties of coal-bearing mudstone are significantly affected by the coupling effect of temperature and strain rate. To analyze this effect, we selected strain rate approximation data at different temperatures to eliminate the effect of strain rate differences. Our analysis showed that the peak stresses initially exhibit increasing and then decreasing trends as temperature increases for different strain rate intervals. By fitting the curve, between 25 °C and 150 °C, peak stress increases with increasing temperature, with the rate of increase gradually slowing down as the strain rate increases. Between 150 °C and 400 °C, peak stress decreases monotonically with increasing temperature, and the rate of decrease becomes more significant with the increase in strain rate, as shown in Figure 9a. The elastic modulus, similar to peak stress, initially increases and then decreases with increasing temperature. It increases between 25 °C and 150 °C and decreases monotonically between 150 °C and 400 °C. By fitting the curve, the rate of increase and decrease in elastic modulus gradually increases with the increase in strain rate, as shown in Figure 9b. However, the peak strain does not show significant changes with increasing temperature. All data points mostly fluctuate within a small range, and the confidence level for peak strain between 0.009588 and 0.011407 is 95%, as shown in Figure 9c. This indicates that the peak strains of the coal-derived mudstone are not significantly affected by temperature.

4. Fractal Failure Characteristics of Coal-Bearing Mudstone

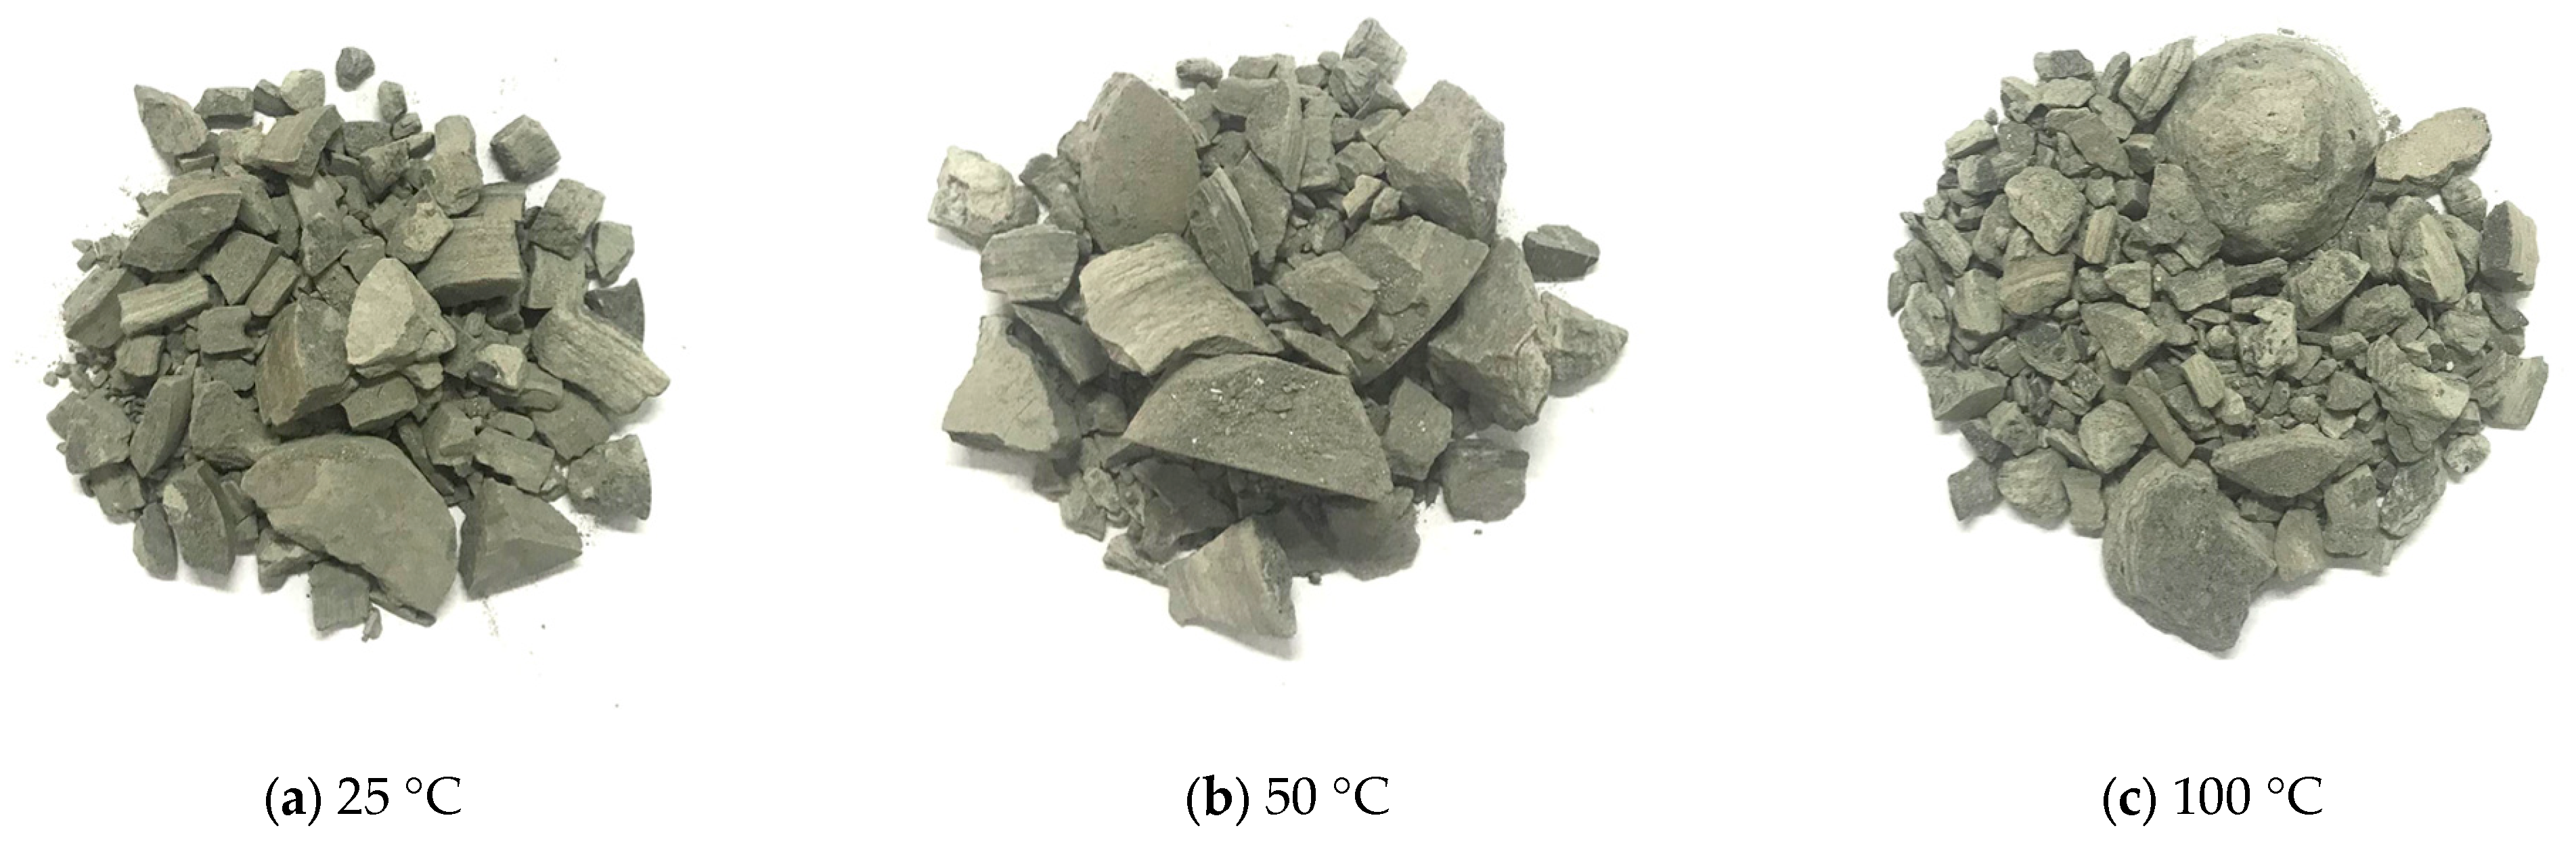
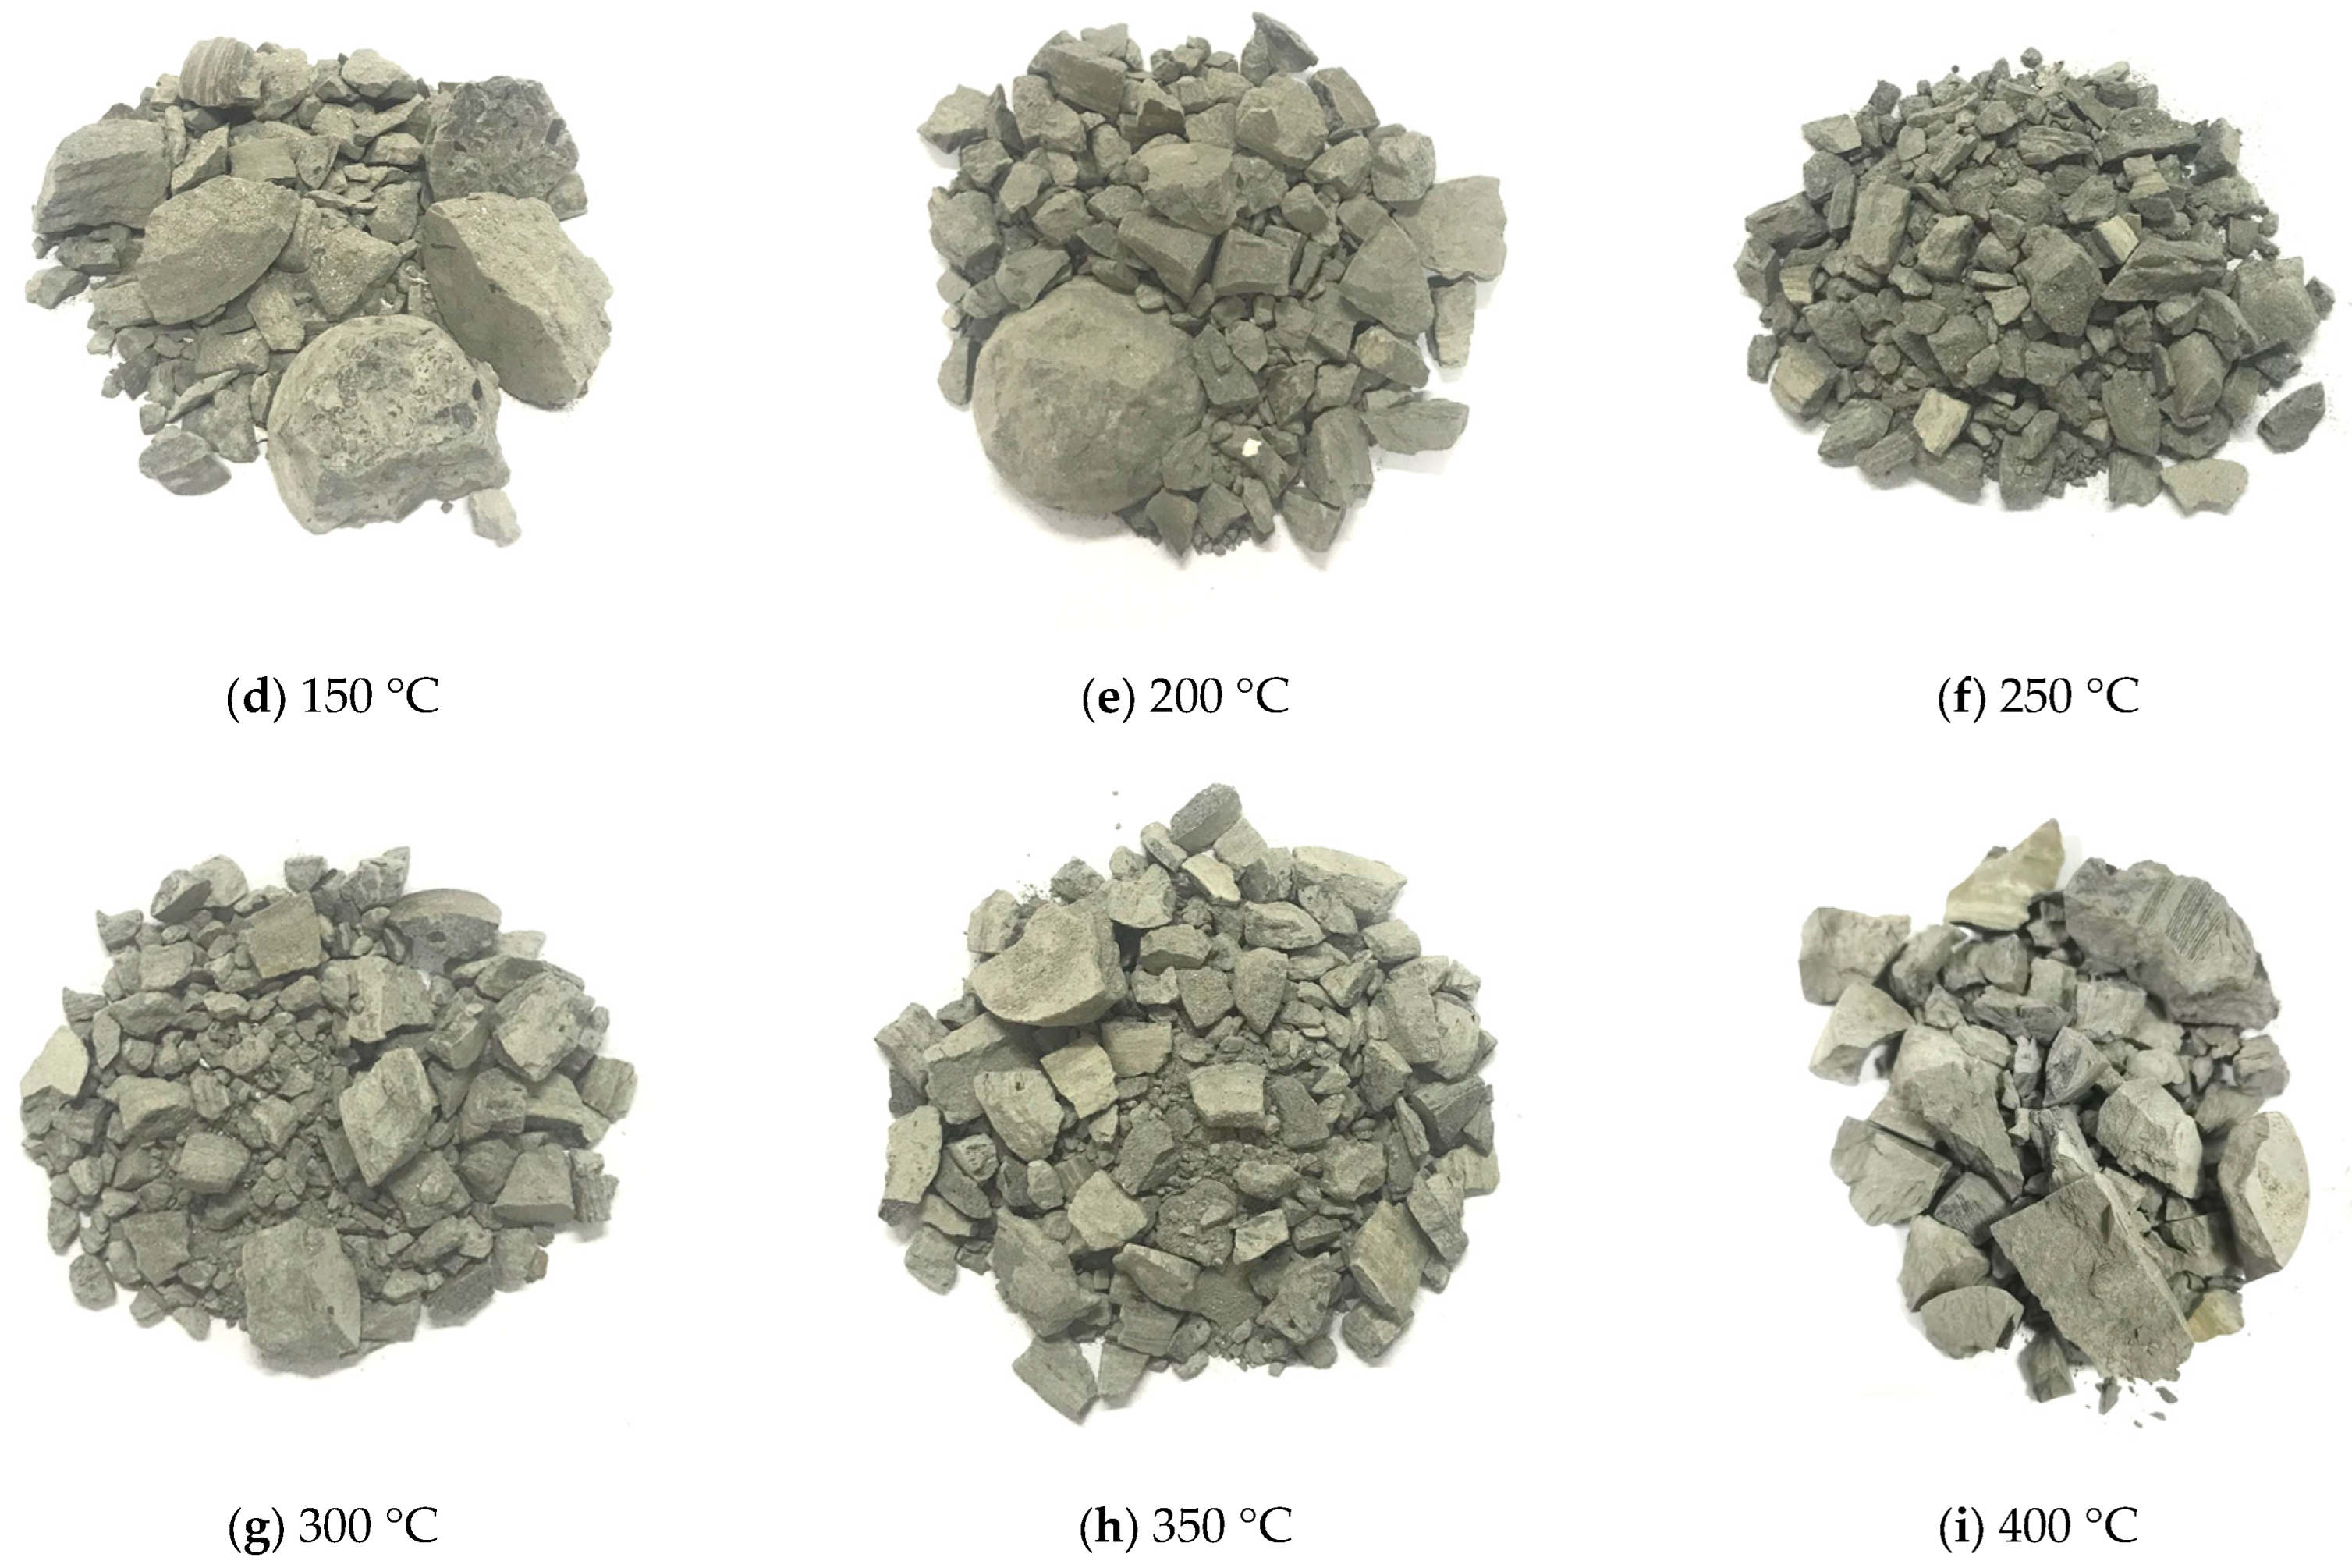
4.1. Macroscopic Damage Characteristics

Considering that the dispersion of peak stress and elastic modulus in coal-bearing mudstone increases with strain rate, the study examined the stability of the variation pattern with temperature at low strain rates (40–60 s−1). Broken fragments of the coal-bearing mudstone were analyzed to determine the variation pattern of the degree of damage with temperature in this strain rate range, as illustrated in Figure 10. The results showed that the surface fragmentation degree of the large residual fragments after composite crushing initially increased and then decreased with the temperature rise. Moreover, the degree of crushed rock samples at high temperatures was greater than at room temperature. In the temperature range of 25–150 °C, the size of the large fragments of the coal-bearing mudstone increased, while the sharpness of the fragmented contour decreased, indicating a strengthening effect on the rock samples due to the expansion of the clay minerals within the coal-bearing mudstone to fill the fissures (Figure 10a–d). Conversely, in the temperature range of 200–400 °C, the average size of the fragments gradually decreased, with large fragments disappearing and the sharpness of the edges of the fragments slightly increasing. These results indicate a weakening effect on the rock samples due to the expansion of fractures caused by the over-expansion of clay minerals within the coal-bearing sandstone through temperature, which can intensify the destruction of the rock samples (Figure 10e–i). To quantify the variation of damage with temperature and strain rate, it was necessary to sieve the particle size of the fractured fragments and determine the average particle size of the damaged fragments and the fractal dimension of the fragments.

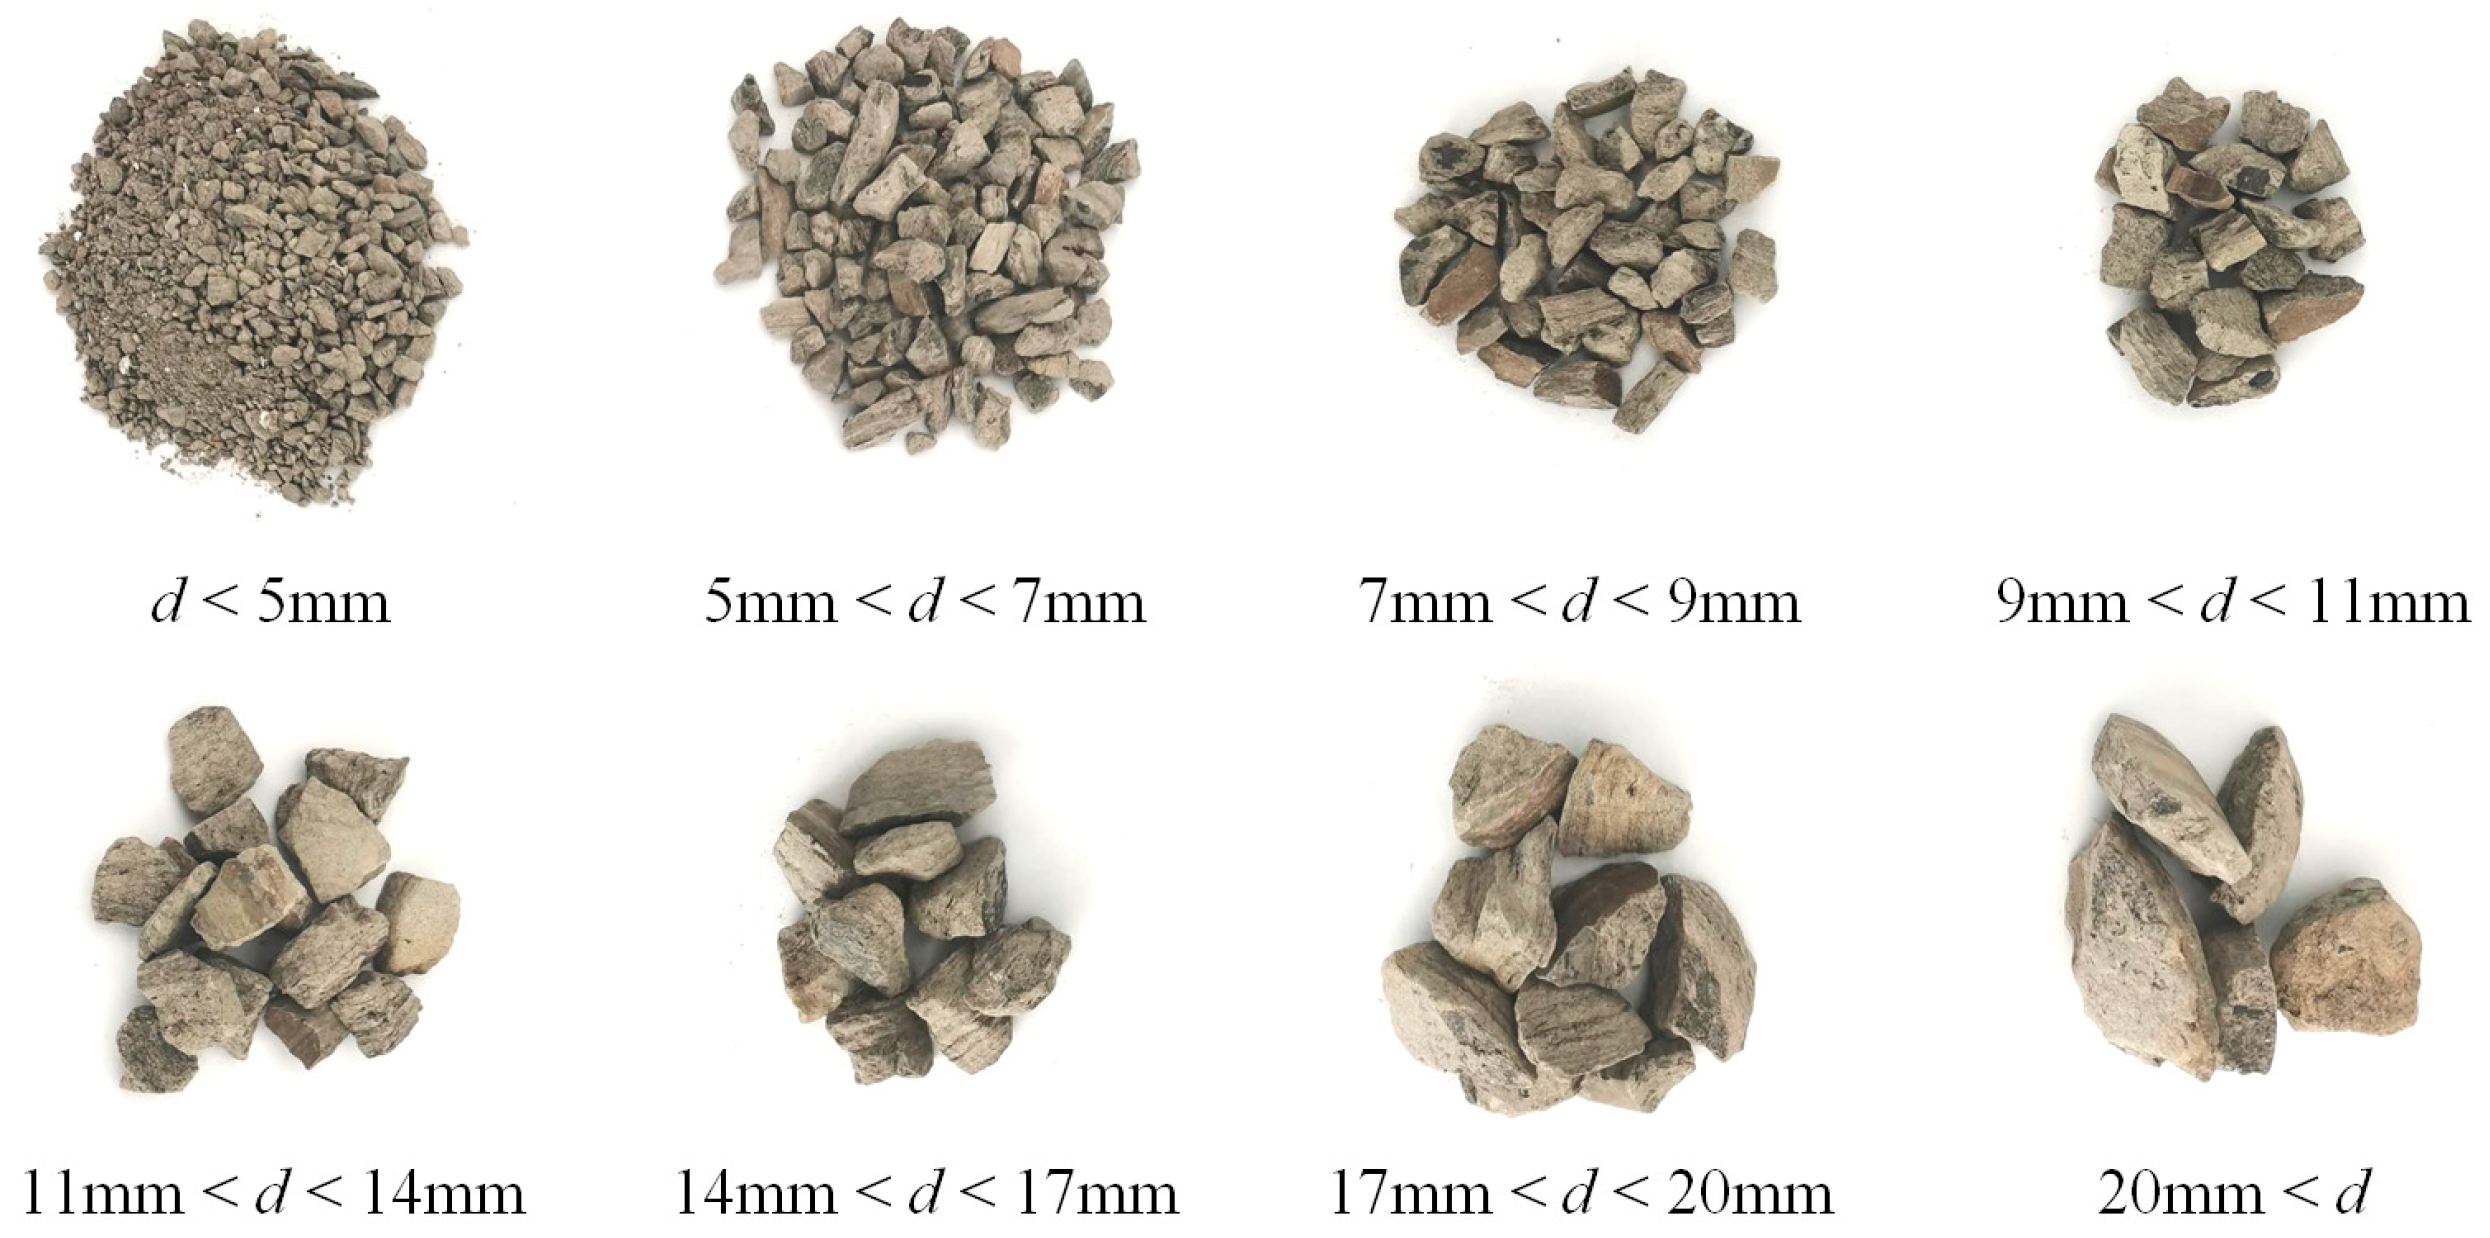
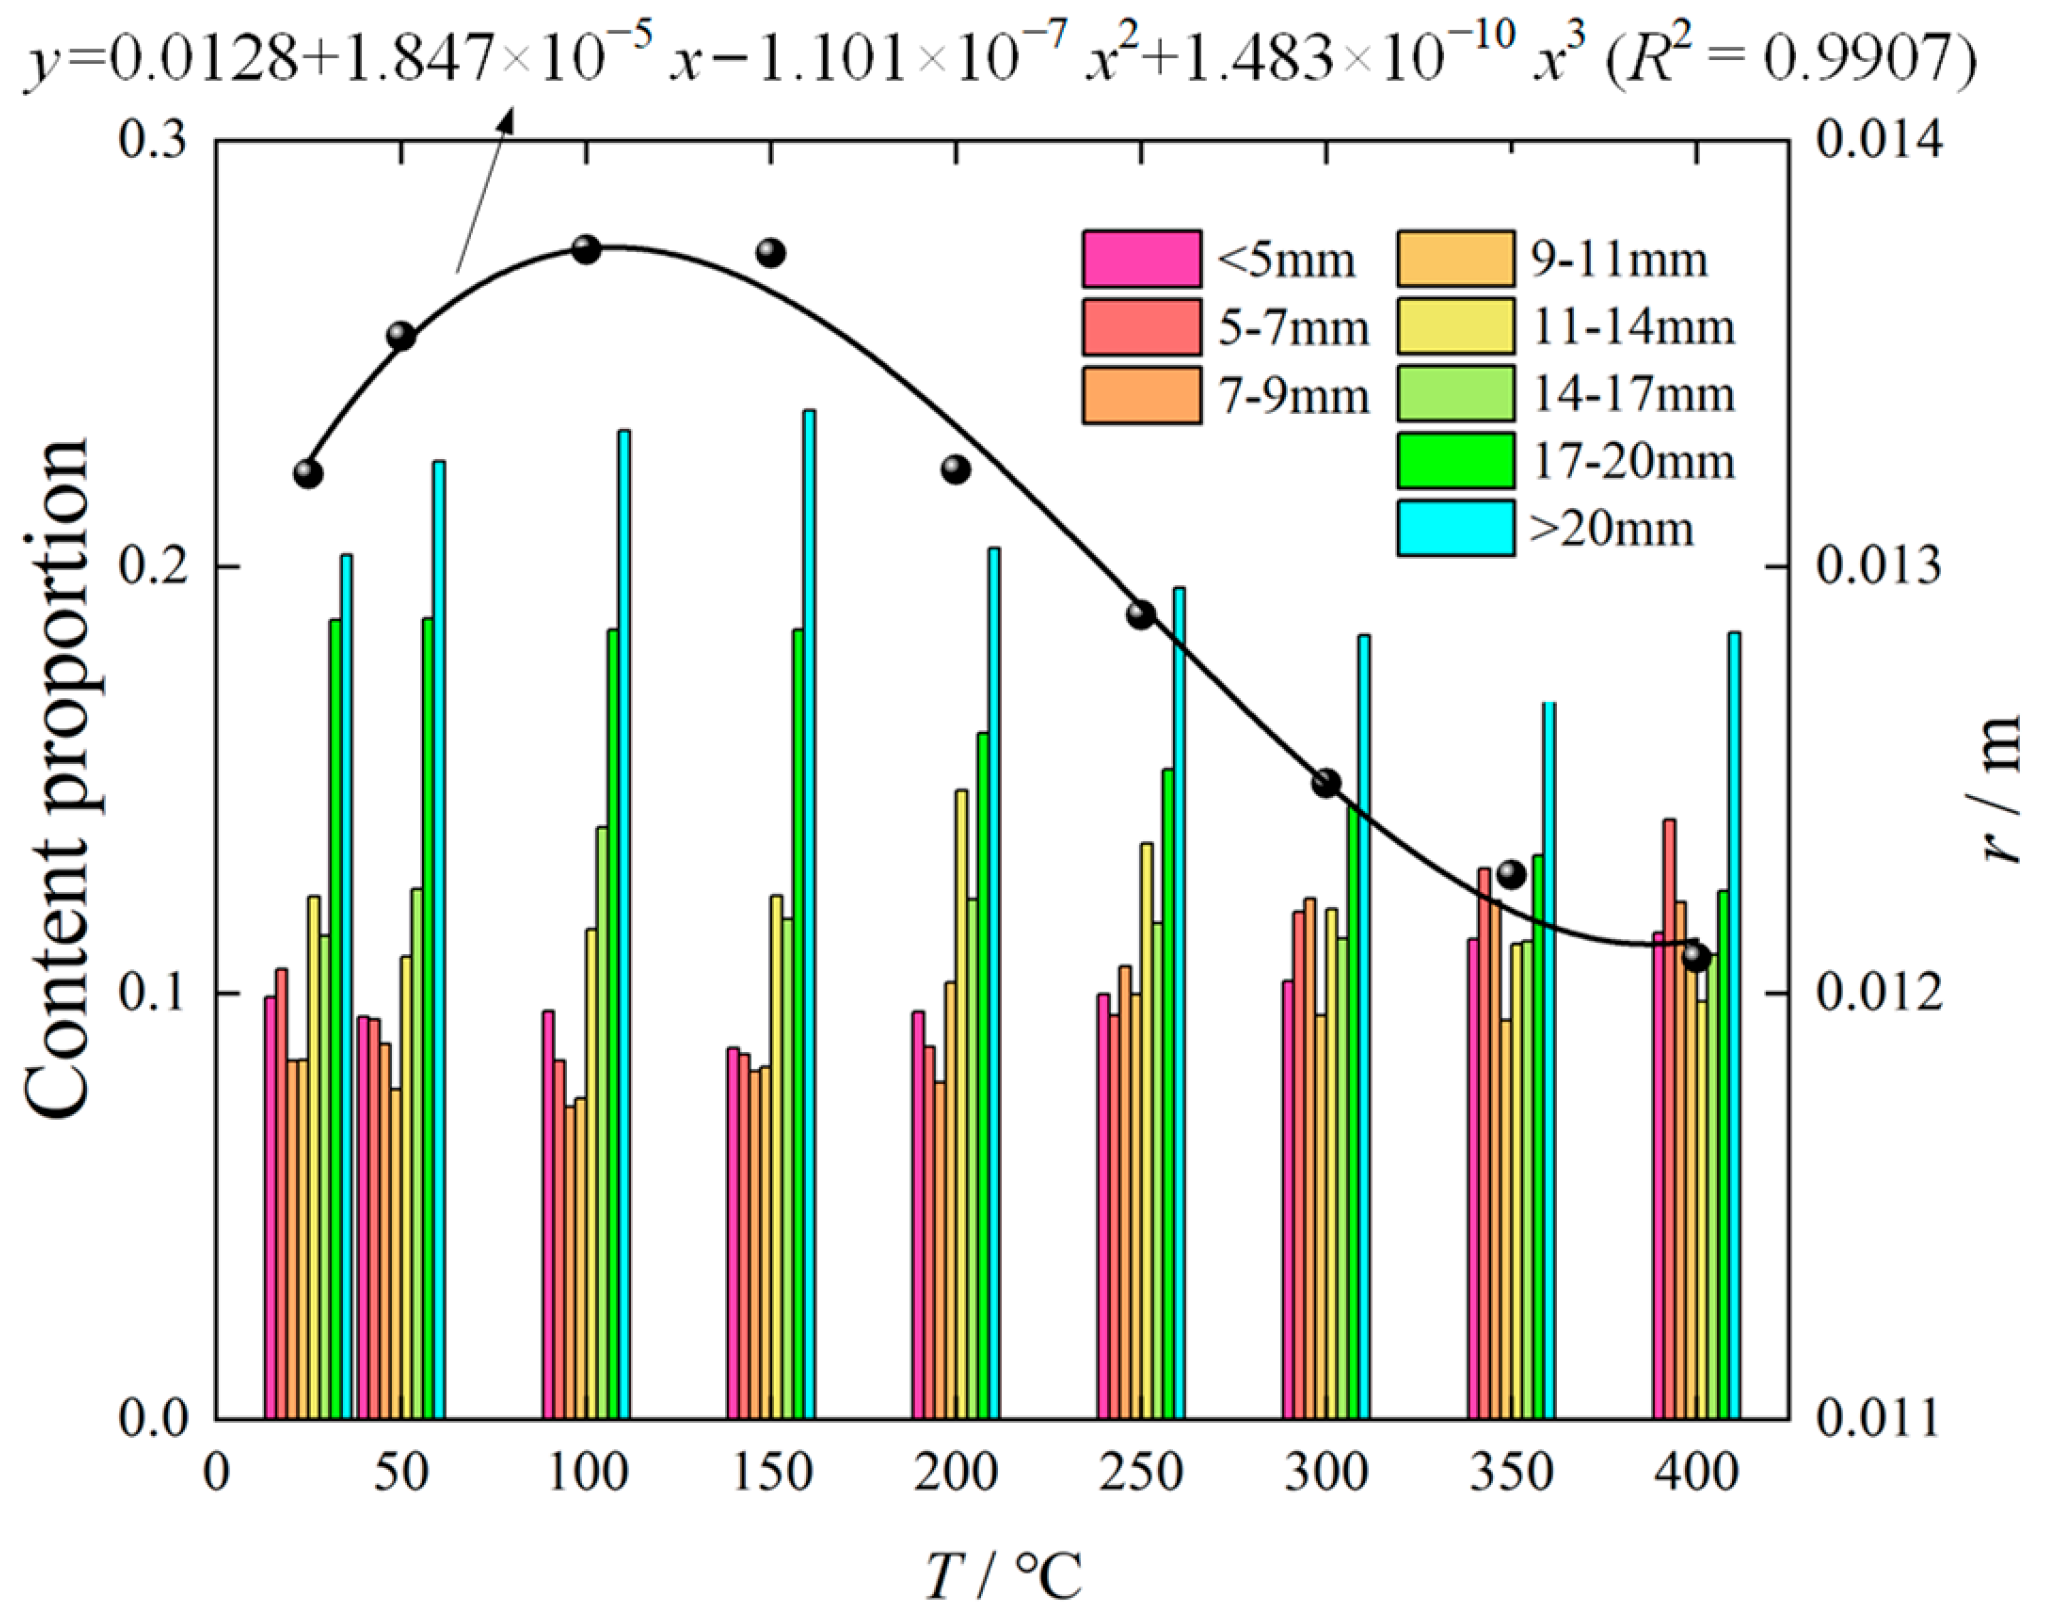
4.2. Blockiness Distribution Coefficient

In this study, the degree of fragmentation of the specimen was quantitatively described using a grading sieve to classify the rock pieces into eight-grain sizes: 0–5.0 mm, 5.0–7.0 mm, 7.0–9.0 mm, 9.0–11.0 mm, 11.0–14.0 mm, 14.0–17.0 mm, 17.0–20.0 mm, and >20.0 mm, as depicted in Figure 11. The mass fraction at each particle size range was weighed, and the group of each particle size was computed as a percentage of the overall assembly. To characterize the equivalent average particle size of the broken pieces of the specimen, the blockiness distribution coefficient was defined, where a smaller value indicated a higher degree of damage. The calculation of r is as follows:
r = n = 1 8 W sn d vn
The average particle size dvn of the n-th group is determined by calculating the average of the largest and smallest particle sizes in the particle size range. In the case of the >20.0 mm group, the average particle size is selected as 20.0 mm since the maximum size is unknown. Wsn represents the mass fraction of the n-th group. Table 5 shows the variations of Wsn and the blockiness distribution coefficient r with temperature T. By utilizing the data in the table, a variation curve of r with T is plotted, as illustrated in Figure 12.
The blockiness distribution coefficient exhibited an increasing-then-decreasing trend with increasing temperature, as suggested previously. Specifically, as the temperature increased from 25 °C to 100 °C, r increased from 0.01329 m to 0.01361 m, a 2.41% rise, and when the temperature further increased from 100 °C to 400 °C, r decreased from 0.01361 m to 0.01208 m, an 11.24% decrease. Notably, the value of r remained relatively constant in the range of 50–150 °C. Moreover, the blockiness distribution coefficient of the crushed rock samples at 400 °C was smaller than that at 25 °C, indicating more severe rock fragmentation at high temperatures. The gradual increase in r was primarily attributed to the rise in mass fraction of each particle size, while the rapid decrease in r was mainly due to the increase in the fraction of 0–5.0 mm particle size.

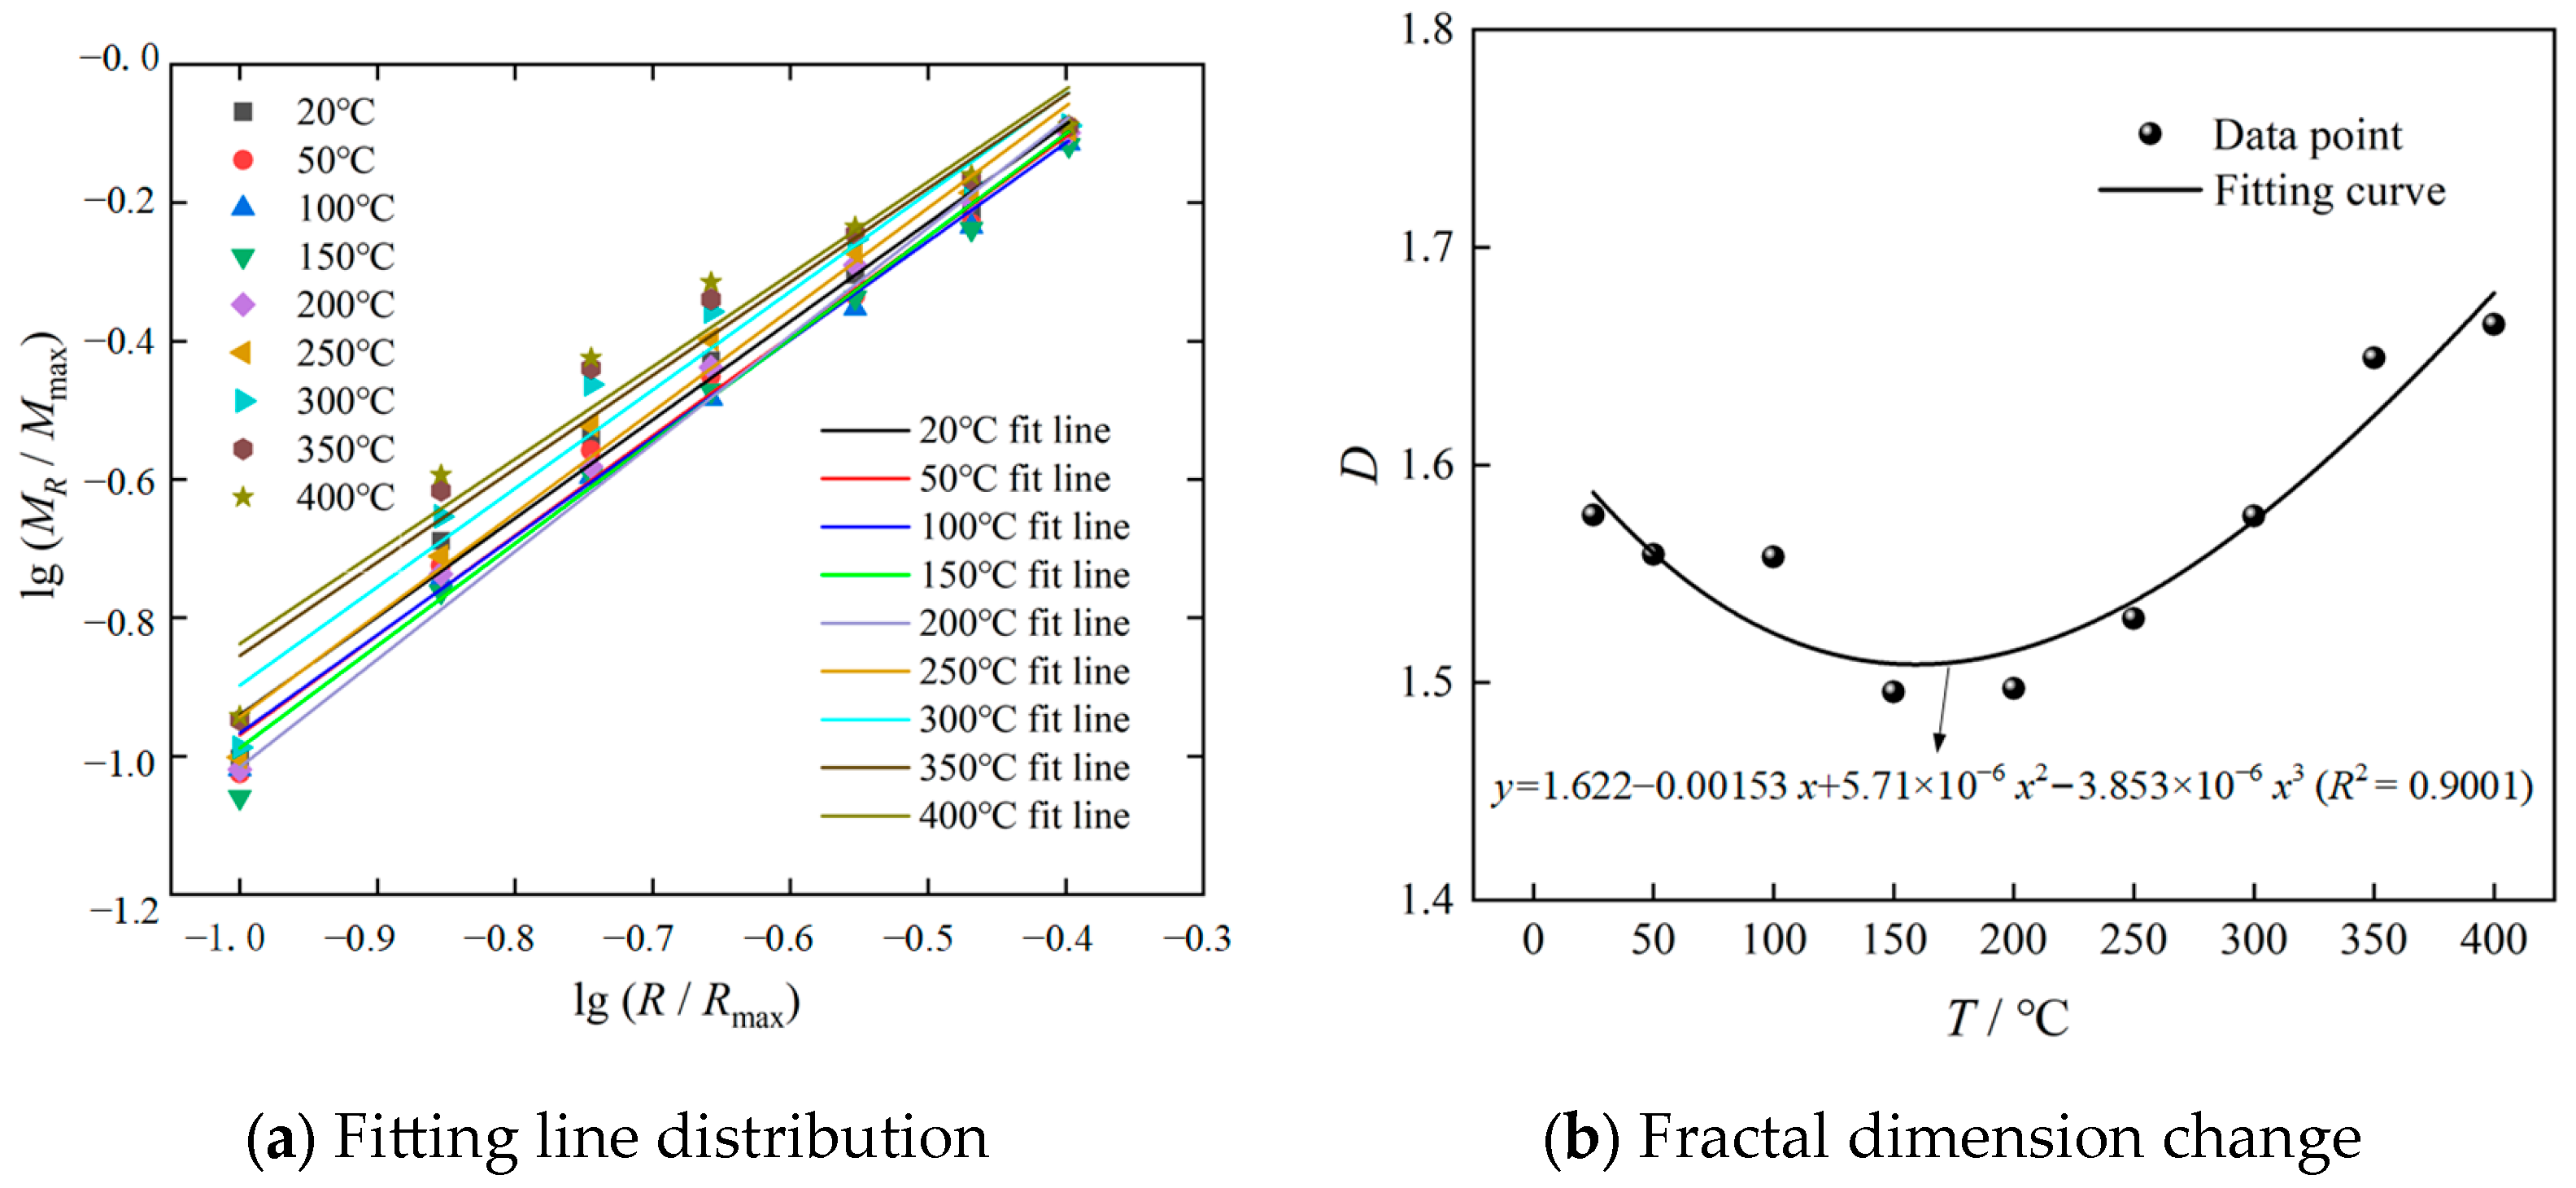
4.3. Fractal Dimension of Fragments

A fractal is a geometric form consisting of parts that mimic the whole across different spatial or temporal scales. Studies have revealed that rock fragments that result from cutting, blasting, and weathering exhibit self-similarity or scale-invariance and possess fractal properties. The fractal dimension can reflect the damage characteristics of rocks to a certain extent [39]. To determine the fractal dimension of the fragments, researchers typically utilize the mass-equivalent dimension parameter, which adheres to the subsequent relationship.
M R / M max = 1 exp R / R max α ,
At small R/Rmax, this can be approximated as
M R / M max = R / R max α ,
The left and right sides of Equation (5) are logarithmized and deformed to
lg M R / M max = α lg R / R max ,
Meanwhile, after deriving Equation (4), the equation is obtained as
d M R R α 1 d R ,
Concerning the definition of a fractal, there are the following relations:
N R D d N R D 1 d R ,
Considering that the increase in block size is closely related to the rise in mass, the following relationship exists:
d N R 3 d M R ,
The Formulas (8) and (9) can be combined to obtain
D = 3 α ,
The fractal dimension D is determined by analyzing the relationship between lg M R / M max and lg R / R max , and obtaining the value of α through linear regression. Rmax is set to be the original radius of the rock specimen to maintain consistency during the calculation. Table 6 presents the variation of lg M R / M max and D with lg R / R max at different temperatures.
A linear regression analysis of the relationship between lg M R / M max and lg R / R max reveals the temperature-dependent characteristics of the fractal dimension, as illustrated in Figure 13. With the temperature increases, the fractal dimension exhibits a decreasing-then-increasing trend. In the temperature range of 25 to 150 °C, the fractal dimension decreases from 1.5769 to 1.4957, a decrease of 5.15%. In the temperature range of 150 to 400 °C, the fractal dimension increases from 1.4957 to 1.6645. The variation of the fractal dimension in the temperature range of 25 to 100 °C is negligible, with only a tiny decrease observed. However, a significant decrease occurs when the temperature reaches 150 °C, and the fractal dimension at 150 °C and 200 °C is essentially the same. When the temperature exceeds 200 °C, the fractal dimension gradually increases with the increase in temperature, but the increase rate gradually slows with the temperature increase. At 400 °C, the fractal dimension is higher than that at 25 °C. Since the fractal dimension is positively correlated with the damage of the specimen, it can be inferred that the deterioration of coal-bearing mudstone initially decreases and then increases with the real-time temperature increase at the same strain rate level. Furthermore, the damage of coal-bearing mudstone at 400 °C is more severe than that at room temperature, consistent with the average blockiness distribution coefficient change.

5. Discussion

5.1. Different Stages of Real-Time Temperature Influence

The effect of temperature on coal-bearing mudstone can be categorized into two stages based on the combination of mechanical properties, macroscopic damage characteristics, and fractal dimension. The first stage is the strengthening stage (25–150 °C), when the temperature increase strengthens the mudstone. In the second stage, the deterioration stage (150–400 °C), the expansion effect of skeletal particles and clay minerals is more substantial, leading to mutual extrusion due to internal space constraint and thermal stress caused by temperature influence. This effect increases the internal fracture of coal-bearing mudstone, resulting in a decrease in the overall strength of the rock sample.
When the temperature is relatively small, the increase in temperature causes the closure of microfractures in the mudstone, a phenomenon that can strengthen the mudstone. With further increases in temperature, the mutual extrusion generated by the complete closure of the cracks will produce tensile stresses inside the mudstone, resulting in the deterioration of the mudstone. In conjunction with SEM (scanning electron microscopy), a comparative description of the micro-morphology at low and high temperatures is added to the paper. The thermal expansion coefficient of clay minerals was found to be larger compared to skeletal particles during the analysis of the internal mineral composition, so we believe that the strengthening effect of the small increase in temperature is due to the expansion of clay minerals to fill the initial pores. As shown in Figure 14a,b, the small increase in temperature caused the initial microfracture closure. However, as the temperature continues to increase, the continued expansion of the clay minerals causes new cracks to sprout within the mudstone, resulting in a decrease in the strength of the mudstone. As shown in Figure 14c,d, the sustained increase in temperature causes rapid expansion of the cleavage between clay minerals and skeleton cleavage and a decrease in the average particle size of the skeleton particles due to the mutual extrusion effect between the skeleton particles.
According to a previous study [40], the damage to mudstone is more dramatic at high temperatures than mudstone impact damage structures at room temperature. Comparing the mechanical properties of coal-bearing mudstone at different temperatures, an increase in the strain rate can lead to an increase in rock strength, but the intensity of fragmentation also increases accordingly. The mechanical properties of coal-bearing mudstone vary greatly under different temperatures due to changes in strain rate, and an increase in temperature will reduce the sensitivity of coal-bearing mudstone to strain rate. As the strain rate increases, the sensitivity of the mechanical properties of coal-bearing mudstone to temperature gradually increases, which is similar to marble. However, based on the larger internal porosity and significant expansion interval of coal-bearing mudstone, an increase in temperature within the low-temperature range will enhance the mechanical properties of coal-bearing mudstone [41]. Unlike the temperature action after the impact rock test, the swelling effect of temperature stress in coal-bearing mudstone at 20–150 °C makes the internal components denser. They do not suffer the consequences of damage due to the contraction of internal components after the temperature is reduced. A comparison of the rock impact test after high temperature found that there is a phase of rock strength and damage reduction under the action of real-time temperature, which is due to the high-temperature environment in which the clay minerals continue to show a state of expansion, which can make the specimen in the loading of the densification increase; high temperature after the cooling process will make the original expansion of clay minerals contract, and with the increase in temperature basically show the deterioration of the impact [42]. A comparison of uniaxial compression tests revealed a higher sensitivity of rock strength to temperature under impact, due to the shortening of the compaction phase of the rock under impact [16,17].

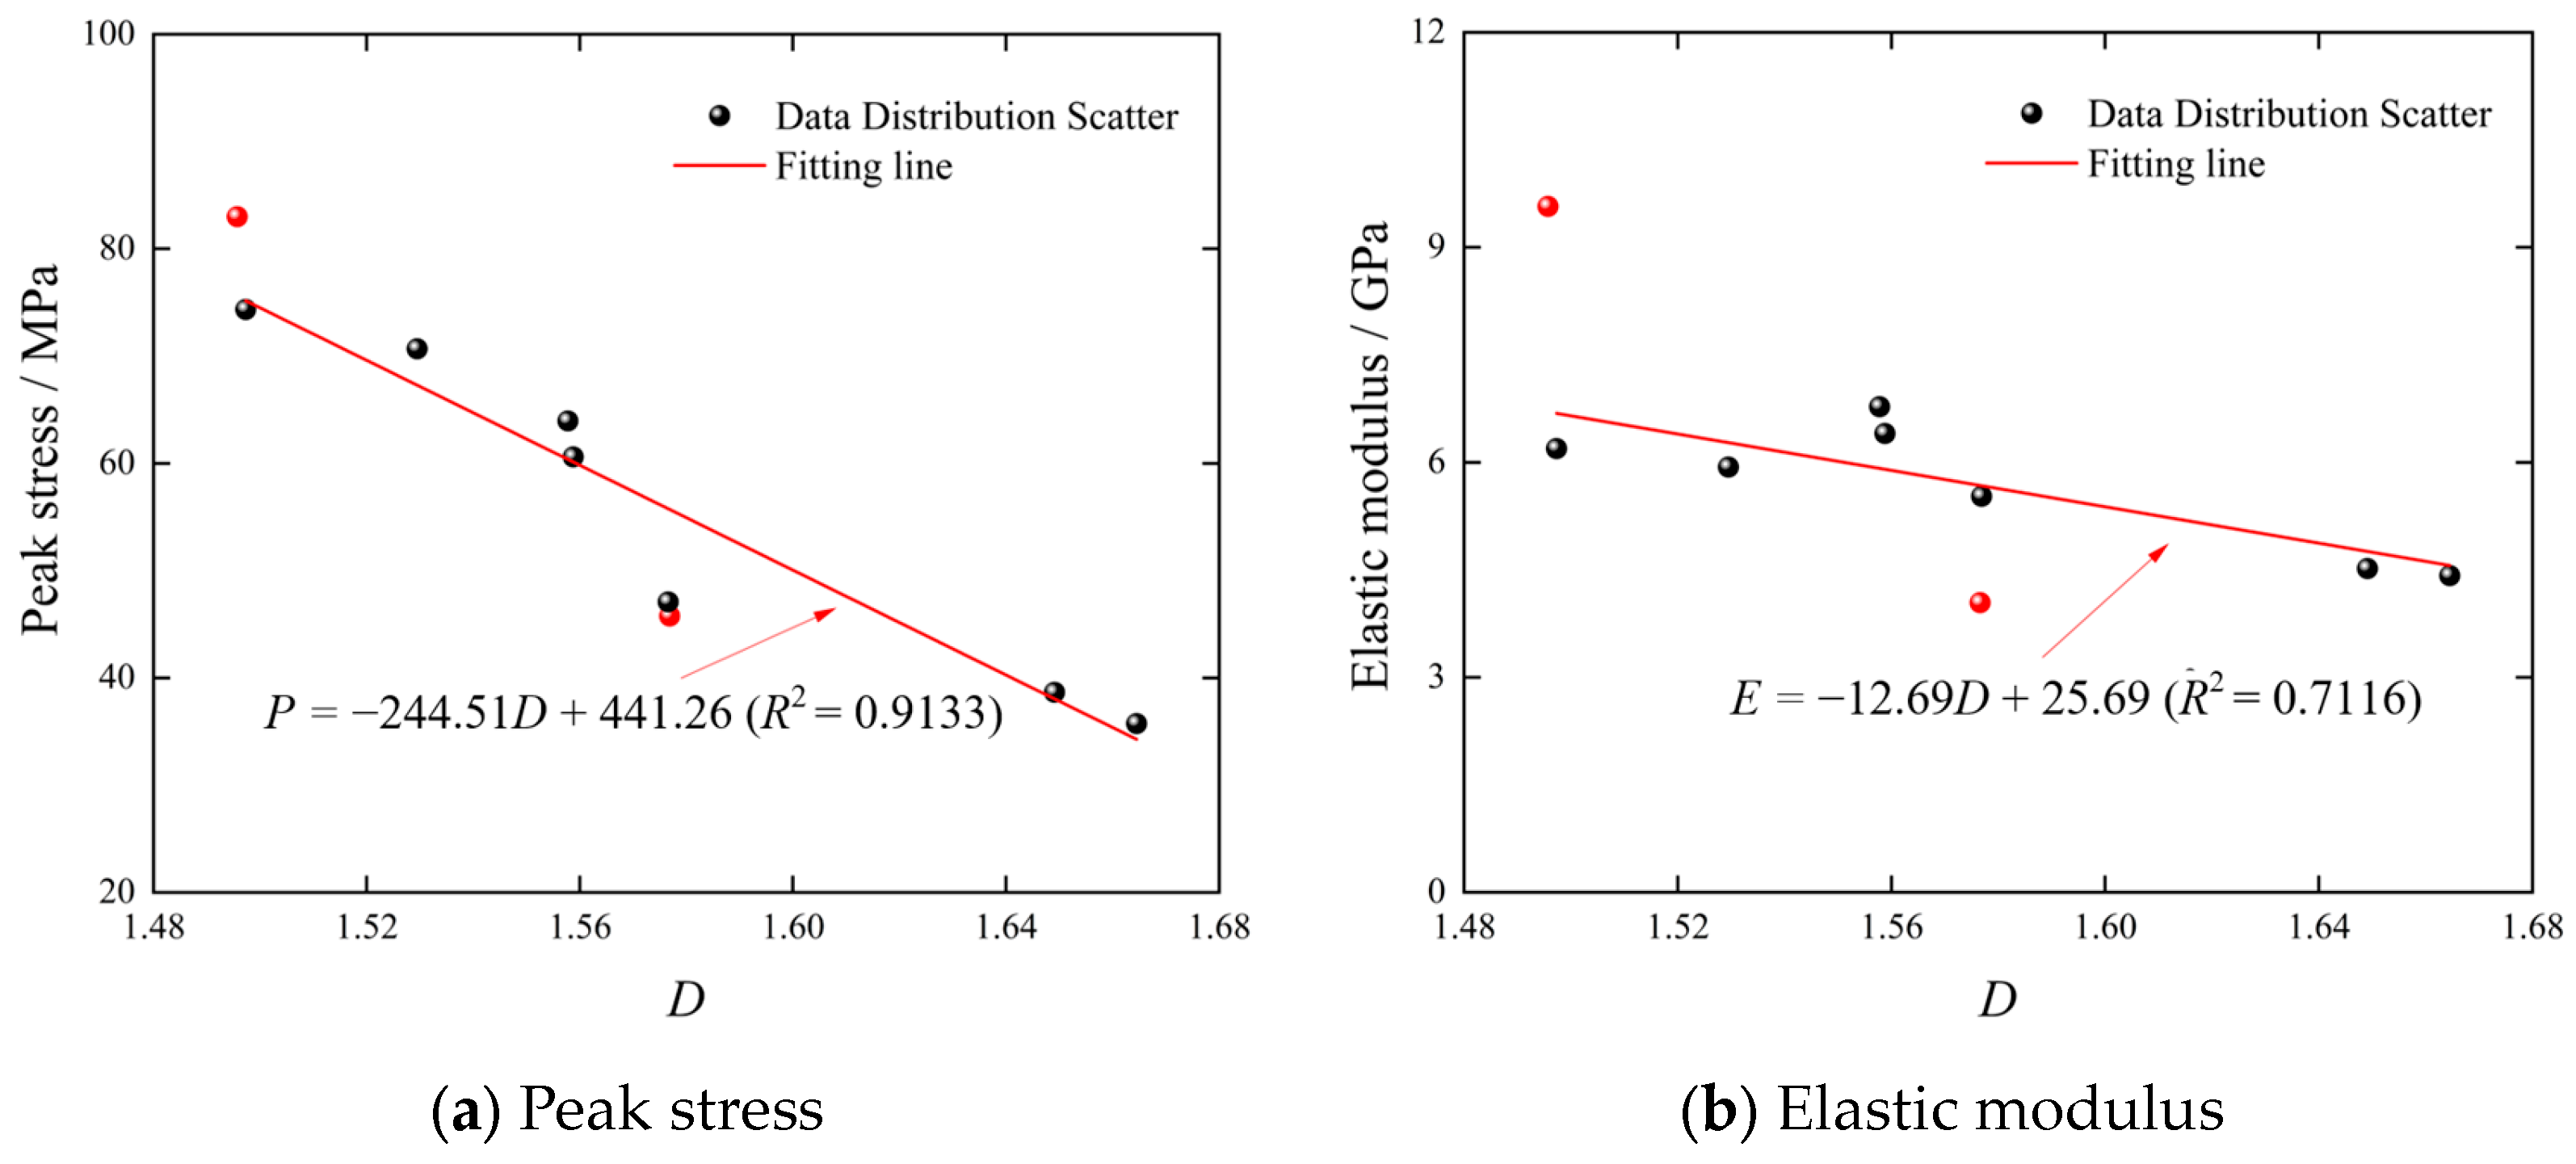
5.2. Correlation of Fractal Dimensions and Applications

To examine the relationship between the fractal dimension and mechanical properties of coal-bearing mudstone at varying real-time temperatures, we calculated correlation coefficients [43] using the following formula:
Correl x , y = x x ¯ y y ¯ x x ¯ 2 y y ¯ 2 ,
The correlation coefficients between the fractal dimension and peak stress, elastic modulus, and peak strain were −0.944, −0.916, and −0.460, respectively, indicating a negative correlation between the fractal dimension and mechanical properties. The peak stress and elastic modulus showed stronger correlations than the peak strain. Transporting actual rocks to the laboratory after experiencing real-time high-temperature damage makes it difficult to use the gradient cooling method to reach room temperature. The resulting microscopic morphological characteristics include thermal shock effects. In contrast, the particle size distribution of the fragments remains relatively unchanged with cooling, making the prediction method based on the fractal dimension of the elements more advantageous for practical applications.
To quantify the relationship between fractal dimension and mechanical parameters of coal-bearing mudstone, scatter plots of peak stress and elastic modulus were plotted with fractal dimensions as the horizontal coordinates and linearly fitted based on removing the maximum and minimum deviation values, as shown in Figure 15. In the figure, P represents peak stress, and E represents elastic modulus. With the increase in fractal dimension, both peak stress and elastic modulus show a linearly decreasing trend. Combined with linear fitting variance analysis, it is found that the fitting effect of peak stress with fractal dimension is better. It is confirmed that the fractal dimension can be used to predict rock strength in engineering. The calculation of fractal dimension is based on the size distribution characteristics of rock fragments, which can be used to predict the strength of surrounding rock in practical engineering. Considering the changes in the storage environment and internal pore characteristics after the rock samples are removed from the actual project, the method of calculating the fractal dimension based on the fractured fragments in the field is able to predict the strength range of the estimated rock, which can guide the design of the support of the actual underground project.

6. Conclusions

This study performed dynamic compression tests on coal-bearing mudstone specimens using a temperature Hopkinson (T-SHPB) test apparatus developed in-house at room temperature (25 °C) and real-time temperatures ranging from 50 °C to 400 °C. This research investigated the changes in peak stress, elastic modulus, and peak strain with temperature within the approximate strain rate range. The blockiness distribution coefficient, fractal dimension, and fracture morphology were also analyzed to determine the damage fracture characteristics from a macroscopic view. The following are the main conclusions of this study:
  • Peak stress and elastic modulus exhibit an initially increasing and then decreasing trend with rising temperature. They demonstrate a slight increase between 25 and 150 °C, followed by a monotonous decreasing trend between 150 and 400 °C. The blockiness distribution coefficient exhibits an initially increasing and then decreasing trend, while the fractal dimension shows an initially decreasing and then increasing trend as the temperature rises. Combined with macroscopic damage morphology, it indicates an initial decrease and subsequent increase in the extent of damage to the coal-bearing mudstone with increasing temperature.
  • The influence of real-time temperature on coal-bearing mudstone can be classified into two stages. The correlation coefficients between the fractal dimension of the fragments and the peak stress, elastic modulus, and peak strain are −0.944, −0.916, and −0.460, respectively. Peak stress and elastic modulus decrease linearly with the increase in the fractal dimension.

Author Contributions

Conceptualization, L.Z. and H.P.; methodology, S.G.; experiment, S.G. and Y.Z.; validation, B.L., P.W. and P.Q.; formal analysis, C.M. and Y.F.; data curation, S.G.; writing—original draft preparation, S.G.; writing—review and editing, L.Z. and H.P.; supervision, P.Q.; project administration, C.M.; funding acquisition, L.Z. and H.P. All authors have read and agreed to the published version of the manuscript.

Funding

This research was funded by the National Natural Science Foundation of China (52074240, 52274140, and 51974296), the State Key Laboratory for GeoMechanics and Deep Underground Engineering, China University of Mining & Technology (SKLGDUEK2212), the Excellent Science and Technology Innovation Team of Jiangsu Province (Engineering Structural Safety under Complex Environmental), the sixth phase of Jiangsu Province “333 talents” training support special–card neck technology research, and the Ph.D. Research Startup Foundation of Suzhou University (No. 2023BSK001).

Data Availability Statement

Data are available on request due to restrictions, e.g., privacy or ethical constraints. The data presented in this study are available on request from the corresponding author.

Conflicts of Interest

The authors declare no conflict of interest.

References

  1. Su, F.; Nakanowataru, T.; Itakura, K.I.; Ohga, K.; Deguchi, G. Evaluation of Structural Changes in the Coal Specimen Heating Process and UCG Model Experiments for Developing Efficient UCG Systems. Energies 2013, 6, 2386–2406. [Google Scholar] [CrossRef]
  2. Nourozieh, H.; Kariznovi, M.; Chen, Z.; Abedi, J. Simulation Study of Underground Coal Gasification in Alberta Reservoirs: Geological Structure and Process Modeling. Energy Fuels 2010, 24, 3540–3550. [Google Scholar] [CrossRef]
  3. Jia, B.; Xian, C.G.; Tsau, J.S.; Zuo, X.; Jia, W.F. Status and Outlook of Oil Field Chemistry-Assisted Analysis during the Energy Transition Period. Energy Fuels 2022, 36, 12917–12945. [Google Scholar] [CrossRef]
  4. Jia, B.; Xian, C.G. Permeability Measurement of the Fracture-matrix System with 3D Embedded Discrete Fracture model. Pet. Sci. 2022, 19, 1757–1765. [Google Scholar] [CrossRef]
  5. Corkum, A.G.; Martin, C.D. The Mechanical Behavior of Weak Mudstone (Opalinus Clay) at Low Stresses. Int. J. Rock Mech. Min. Sci. 2007, 44, 196–209. [Google Scholar] [CrossRef]
  6. Taheri, A.; Tani, K. Use of Down-hole Triaxial Apparatus to Estimate the Mechanical Properties of Heterogeneous Mudstone. Int. J. Rock Mech. Min. Sci. 2008, 45, 1390–1402. [Google Scholar] [CrossRef]
  7. Douma, L.A.N.R.; Primarini, M.I.W.; Houben, M.E.; Barnhoorn, A. The Validity of Generic Trends on Multiple Scales in Rock-physical and Rock-mechanical Properties of the Whitby Mudstone, United Kingdom. Mar. Pet. Geol. 2017, 84, 135–147. [Google Scholar] [CrossRef]
  8. Lei, X.L.; Nishizawa, O.; Kusunose, K.; Cho, A.; Satoh, T. Compressive Failure of Mudstone Samples Containing Quartz Veins Using Rapid AE Monitoring: The Role of Asperities. Tectonophysics 2000, 328, 329–340. [Google Scholar] [CrossRef]
  9. Ji’an, L.; Wang, L. High-Temperature Mechanical Properties of Mudstone in the Process of Underground Coal Gasification. Rock Mech. Rock Eng. 2011, 44, 749–754. [Google Scholar]
  10. Zhao, F.; Shi, Z.; Sun, Q. Fracture Mechanics Behavior of Jointed Granite Exposed to High Temperatures. Rock Mech. Rock Eng. 2021, 54, 2183–2196. [Google Scholar] [CrossRef]
  11. Zhu, Z.N.; Tian, H.; Jiang, G.S.; Cheng, W. Effects of High Temperature on the Mechanical Properties of Chinese Marble. Rock Mech. Rock Eng. 2018, 51, 1937–1942. [Google Scholar] [CrossRef]
  12. Kong, B.; Wang, E.; Li, Z.; Wang, X.; Liu, J.; Li, N. Fracture Mechanical Behavior of Sandstone Subjected to High-Temperature Treatment and Its Acoustic Emission Characteristics Under Uniaxial Compression Conditions. Rock Mech. Rock Eng. 2016, 49, 4911–4918. [Google Scholar] [CrossRef]
  13. Liu, X.; Zhang, C.; Yuan, S.; Fityus, S.; Sloan, S.W.; Buzzi, O. Effect of High Temperature on Mineralogy, Microstructure, Shear Stiffness and Tensile Strength of Two Australian Mudstones. Rock Mech. Rock Eng. 2016, 49, 3513–3524. [Google Scholar] [CrossRef]
  14. Chen, J.; Yin, L.; Ren, S.; Lin, L.; Fang, J. The Thermal Damage Properties of Mudstone, Gypsum and Rock Salt from Yingcheng, Hubei, China. Minerals 2015, 5, 104–116. [Google Scholar] [CrossRef]
  15. Tang, F.; Wang, L.; Lu, Y.; Yang, X. Thermophysical Properties of Coal Measure Strata under High Temperature. Environ. Earth Sci. 2015, 73, 6009–6018. [Google Scholar] [CrossRef]
  16. Zhang, L.; Mao, X.; Li, M.; Li, B.; Liu, R.; Lu, A. Brittle–Ductile Transition of Mudstone in Coal Measure Rock Strata under High Temperature. Int. J. Geomech. 2020, 20, 04019149. [Google Scholar] [CrossRef]
  17. Zhang, L.; Ma, C.; Zhang, Z.; Li, B.; Lei, L. Experimental Research of Loading Rate Effect on Brittle-ductile Transition of Mudstone under High Temperature. Therm. Sci. 2019, 23, 959–965. [Google Scholar] [CrossRef]
  18. Lu, Y.; Wang, L.; Sun, X.; Wang, J. Experimental Study of the Influence of Water and Temperature on the Mechanical Behavior of Mudstone and Sandstone. Bull. Eng. Geol. Environ. 2017, 76, 645–660. [Google Scholar] [CrossRef]
  19. Wu, Z.; Qin, B.D.; Chen, L.J.; Luo, Y.J. Experimental Study on Mechanical Character of Sandstone of the Upper Plank of Coal Bed under High Temperature. Chin. J. Rock Mech. Eng. 2005, 24, 1863–1867. [Google Scholar] [CrossRef]
  20. Zhang, L.; Mao, X.; Liu, R.; Guo, X.; Ma, D. The Mechanical Properties of Mudstone at High Temperatures: An Experimental Study. Rock Mech. Rock Eng. 2014, 47, 1479–1484. [Google Scholar] [CrossRef]
  21. Zhang, L.; Mao, X.; Li, M.; Liu, R. Experimental Study of Thermal Expansion Characteristics of Coaly Mudstone at High Temperatures. Geotech. Geol. Eng. 2018, 36, 521–529. [Google Scholar] [CrossRef]
  22. Qin, Y.; Tian, H.; Xu, N.X.; Chen, Y. Physical and Mechanical Properties of Granite After High-Temperature Treatment. Rock Mech. Rock Eng. 2020, 53, 305–322. [Google Scholar] [CrossRef]
  23. Xiao, Y.; Lu, J.H.; Wang, C.P.; Deng, J. Experimental Study of High-Temperature Fracture Propagation in Anthracite and Destruction of Mudstone from Coalfield Using High-Resolution Microfocus X-ray Computed Tomography. Rock Mech. Rock Eng. 2016, 49, 3723–3734. [Google Scholar] [CrossRef]
  24. Shengyin, L.; Bin, D.; Hong, T.; Jie, C.; Peng, X.; Shitao, Z. Comparative Experimental Study on Physical and Mechanical Properties of Granite after Natural Cooling and under Real-time High Temperature. Earth Sci. Front. 2020, 27, 178–184. (In Chinese) [Google Scholar]
  25. Zhou, Z.; Li, X.; Ye, Z.; Liu, K. Obtaining Constitutive Relationship for Rate-Dependent Rock in SHPB Tests. Rock Mech. Rock Eng. 2010, 43, 697–706. [Google Scholar] [CrossRef]
  26. Zou, C.; Wong, L.N.Y. Size and Geometry Effects on the Mechanical Properties of Carrara Marble Under Dynamic Loadings. Rock Mech. Rock Eng. 2016, 49, 1695–1708. [Google Scholar] [CrossRef]
  27. Chen, Y.; Lu, A.; Mao, X.; Li, M.; Zhang, L. Nonlinear Dynamics Mechanism of Rock Burst Induced by the Instability of the Layer-Crack Plate Structure in the Coal Wall in Deep Coal Mining. Shock. Vib. 2017, 2017, 4051967. [Google Scholar] [CrossRef]
  28. Hao, Y.; Hao, H. Numerical Investigation of the Dynamic Compressive Behaviour of Rock Materials at High Strain Rate. Rock Mech. Rock Eng. 2013, 46, 373–388. [Google Scholar] [CrossRef]
  29. Li, C.; Xu, Y.; Chen, P.; Li, H.; Lou, P. Dynamic Mechanical Properties and Fragment Fractal Characteristics of Fractured Coal–Rock-Like Combined Bodies in Split Hopkinson Pressure Bar Tests. Nat. Resour. Res. 2020, 29, 3179–3195. [Google Scholar] [CrossRef]
  30. Wu, H.; Dai, B.; Cheng, L.; Lu, R.; Zhao, G.; Liang, W. Experimental Study of Dynamic Mechanical Response and Energy Dissipation of Rock Having a Circular Opening Under Impact Loading. Min. Metall. Explor. 2021, 38, 1111–1124. [Google Scholar] [CrossRef]
  31. Wu, J.; Jing, H.; Gao, Y.; Meng, Q.; Yin, Q.; Du, Y. Effects of Carbon Nanotube Dosage and Aggregate Size Distribution on Mechanical Property and Microstructure of Cemented Rockfill. Cem. Concr. Compos. 2022, 127, 104408. [Google Scholar] [CrossRef]
  32. Wu, J.; Wong, H.S.; Yin, Q.; Ma, D. Effects of Aggregate Strength and Mass Fraction on Mesoscopic Fracture Characteristics of Cemented Rockfill from Gangue as Recycled Aggregate. Compos. Struct. 2023, 311, 116851. [Google Scholar] [CrossRef]
  33. Guo, L.; Wang, Y. Experimental Study on Energy Dissipation of Saturated Mudstone in Coal Mine under Impact Loading. Geofluids 2022, 2022, 5045961. [Google Scholar] [CrossRef]
  34. Kao, S.; Zhao, G.; Meng, X.; Li, Y.; Liu, Z.; Zhang, R.; Huang, S. Dynamic Mechanical Characteristics of Fractured Rock Reinforced by Different Grouts. Adv. Civ. Eng. 2021, 2021, 8897537. [Google Scholar] [CrossRef]
  35. Meng, L.; Han, L.; Zhu, H. Influence of Moisture Content on the Structural Characteristics of Argillaceous Weakly Consolidated Rock Caused by Dynamic Loading in the Coal Mine. Shock. Vib. 2021, 2021, 7206801. [Google Scholar] [CrossRef]
  36. Liu, W.; Yang, K.; Dou, L.; Wei, Z.; Chi, X.; Xu, R. Mechanical Properties and Failure Modes of CRCB Specimen under Impact Loading. Sci. Rep. 2022, 12, 12108. [Google Scholar] [CrossRef] [PubMed]
  37. Zhou, J.; Xu, W.; Zhao, G.; Meng, X.; Li, Y.; Wu, X.; Cheng, X. Energy Evolution Law and Fractal Characteristics of Different Rock Specimen Sizes on Dynamic Compression. Geofluids 2022, 2022, 5339603. [Google Scholar] [CrossRef]
  38. Hao, Y.; Hao, H. Finite Element Modelling of Mesoscale Concrete Material in Dynamic Splitting Test. Adv. Struct. Eng. 2016, 19, 1027–1039. [Google Scholar] [CrossRef]
  39. Liu, S.; Xu, J.Y. Fractal Analysis for Dynamic Failure Characteristics of Granite Induced by Mechanical–thermal Loading. Géotech. Lett. 2015, 5, 191–197. [Google Scholar] [CrossRef]
  40. Zhou, R.; Cheng, H.; Cai, H.; Wang, X.; Guo, L.; Huang, X. Dynamic Characteristics and Damage Constitutive Model of Mudstone under Impact Loading. Materials 2022, 15, 1128. [Google Scholar] [CrossRef]
  41. An, H.; Zeng, T.; Zhang, Z.; Liu, L. Experimental Study of the Rock Mechanism under Coupled High Temperatures and Dynamic Loads. Adv. Civ. Eng. 2020, 2020, 8866621. [Google Scholar] [CrossRef]
  42. Zhang, R.R.; Jing, L.W. Analysis on the Fragment and Energy Dissipation of Deep Sandstone after High/low Temperature Treatment in SHPB Tests. J. China Coal Soc. 2018, 43, 1884–1892. [Google Scholar]
  43. Wei, T.; Cheng, L.P.; Zhao, K.J. Application of Kernel Principal Component and Pearson Correlation Coefficient in Prediction of Mine Pressure Failure. In Proceedings of the 2017 Chinese Automation Congress (CAC), Jinan, China, 20–22 October 2017. [Google Scholar]
Figure 1. Typical stress–strain curve and damage mode.
Fractalfract 07 00695 g001
Figure 2. Coal-bearing mudstone specimens.
Fractalfract 07 00695 g002
Figure 3. Real-time temperature SHPB test rig.
Fractalfract 07 00695 g003
Figure 4. Strain signal waveform superimposition.
Fractalfract 07 00695 g004
Figure 5. Stress balance analysis.
Fractalfract 07 00695 g005
Figure 6. The curve of strain rate with temperature and pressure.
Fractalfract 07 00695 g006
Figure 7. Variation of the stress–strain curve with strain rate at different temperatures.
Fractalfract 07 00695 g007
Figure 8. The curve of mechanical properties with temperature and pressure.
Fractalfract 07 00695 g008
Figure 9. Variation of mechanical parameters with temperature for different strain rates.
Fractalfract 07 00695 g009
Figure 10. Variation of macroscopic damage characteristics with temperature.
Fractalfract 07 00695 g010aFractalfract 07 00695 g010b
Figure 11. Crushed rock masses of different grain sizes.
Fractalfract 07 00695 g011
Figure 12. Curves of the mass fraction and blockiness distribution coefficient with temperature.
Fractalfract 07 00695 g012
Figure 13. Characteristics of the fractal dimension with temperature.
Fractalfract 07 00695 g013
Figure 14. Microscopic fracture characteristics at different temperatures.
Fractalfract 07 00695 g014
Figure 15. Variation of peak stress and elastic modulus with fractal dimension.
Fractalfract 07 00695 g015
Table 1. Variation of strain rate with temperature and pressure.
Pressure/
Temperature
Strain Rate ε ˙ (s−1)
25 °C50 °C100 °C150 °C200 °C250 °C300 °C350 °C400 °C
0.2 MPa46.02142.46840.45522.48427.06527.25535.89637.05138.498
0.3 MPa60.65058.03557.76539.16445.89550.05351.65153.84955.819
0.4 MPa70.32563.65460.74542.06554.21053.51657.05161.25167.416
0.5 MPa82.55175.72170.54554.89862.51661.04865.05570.02777.874
0.6 MPa95.87487.45183.15165.56473.84670.51175.84283.41586.135
0.7 MPa110.052100.16597.10570.71276.15476.44784.51590.75493.464
Table 2. Variation of peak stress with temperature and pressure.
Pressure/
Temperature
Peak Stress σ m (MPa)
25 °C50 °C100 °C150 °C200 °C250 °C300 °C350 °C400 °C
0.2 MPa45.77938.32349.62143.02142.27543.33026.22725.75628.223
0.3 MPa57.70960.61063.94564.34263.27950.40634.61738.65235.731
0.4 MPa71.48886.07777.87473.89974.35670.67547.08047.11441.711
0.5 MPa89.40193.60189.10883.00184.44278.23154.72853.97043.584
0.6 MPa94.92199.37097.28395.82898.81173.10859.20960.06446.229
0.7 MPa103.437106.089100.87698.566100.46982.77366.97067.28151.809
Table 3. Variation of elastic modulus with temperature and pressure.
Pressure/
Temperature
Elastic Modulus E d (GPa)
25 °C50 °C100 °C150 °C200 °C250 °C300 °C350 °C400 °C
0.2 MPa5.5256.4035.8095.0244.6214.5053.2263.2883.376
0.3 MPa7.3436.9966.7766.7336.1925.9354.0414.5194.418
0.4 MPa9.8099.3528.7837.4387.6097.2715.4085.1584.629
0.5 MPa10.6259.67110.2189.5709.3628.8457.8567.7646.375
0.6 MPa12.11011.13212.68110.09310.8559.1729.1318.4506.714
0.7 MPa15.18513.02515.62313.70313.24012.54211.17811.5868.679
Table 4. Variation of peak strain with temperature and pressure.
Pressure/
Temperature
Peak Strain ε d (×10−3)
25 °C50 °C100 °C150 °C200 °C250 °C300 °C350 °C400 °C
0.2 MPa10.68210.12311.52511.4359.69810.74110.2779.97610.760
0.3 MPa10.05311.3869.83112.79112.05410.63210.6279.96210.624
0.4 MPa9.00910.04310.17911.18111.30510.63010.36410.6419.807
0.5 MPa7.77911.01011.40710.7819.80810.88010.5949.8929.588
0.6 MPa9.4649.73510.48911.07610.36010.35310.17310.94210.755
0.7 MPa9.15211.73610.82910.1819.97911.2719.23211.5508.426
Table 5. Variation of the mass fraction and blockiness distribution coefficient with temperature.
T/°CWsnr/m
<5 mm5–7 mm7–9 mm9–11 mm11–14 mm14–17 mm17–20 mm>20 mm
250.099160.105640.084230.084330.122700.113520.187660.202760.01322
500.094460.093930.088130.077570.108710.124540.187860.224800.01354
1000.095830.084220.073330.075330.115060.138980.185260.231990.01374
1500.087220.085650.081830.082750.122900.117530.185380.236740.01374
2000.095760.087420.079080.102590.147550.122110.161030.204460.01323
2500.099700.094890.106310.099700.135140.116520.152550.195190.01289
3000.102930.119150.122270.094820.119780.112910.144100.184040.01249
3500.112800.129280.121670.093790.111530.112170.132450.186310.01228
4000.114270.140740.121370.107810.098130.109100.123950.184630.01208
Table 6. The variation of lg M R / M max and D with lg R / R max at different temperatures.
T/°C lg M R / M D
lg R / R max = 1.00000 lg R / R max = 0.85387 lg R / R max = 0.74473 lg R / R max = 0.65758 lg R / R max = 0.55284 lg R / R max = 0.46852 lg R / R max = 0.39794
25−1.00366−0.68867−0.53906−0.42787−0.30447−0.21497−0.098411.5769
50−1.02475−0.72494−0.55827−0.45089−0.33461−0.23111−0.110591.5588
100−1.01850−0.74461−0.59623−0.48319−0.35284−0.23452−0.114631.5578
150−1.05938−0.76228−0.59397−0.47179−0.33691−0.23816−0.117331.4957
200−1.01882−0.73712−0.58127−0.43789−0.29039−0.19756−0.099341.4973
250−1.00130−0.71088−0.52158−0.39729−0.27105−0.18558−0.094311.5295
300−0.98746−0.65349−0.46300−0.35737−0.25263−0.17272−0.088331.5766
350−0.94769−0.61604−0.43920−0.33957−0.24483−0.16670−0.089541.6491
400−0.94207−0.59344−0.42437−0.31498−0.23484−0.16026−0.088651.6645
Disclaimer/Publisher’s Note: The statements, opinions and data contained in all publications are solely those of the individual author(s) and contributor(s) and not of MDPI and/or the editor(s). MDPI and/or the editor(s) disclaim responsibility for any injury to people or property resulting from any ideas, methods, instructions or products referred to in the content.

