Article

Structural Characterization of Toxoplasma gondii Brain Cysts in a Model of Reactivated Toxoplasmosis Using Computational Image Analysis

by
Neda Bauman
1,
Jelena Srbljanović
1,
Ivana Čolović Čalovski
2,
Olivera Lijeskić
1,
Vladimir Ćirković
1,
Jelena Trajković
3,4,
Branko Bobić
1,
Andjelija Ž. Ilić
3,* and
Tijana Štajner
1,*
1
National Reference Laboratory for Toxoplasmosis, Group for Microbiology and Parasitology, Centre of Excellence for Food- and Vector-Borne Zoonoses, Institute for Medical Research, National Institute of Republic of Serbia, University of Belgrade, 11000 Belgrade, Serbia
2
Department of Parasitology and Mycology, Institute of Microbiology and Immunology, Faculty of Medicine, University of Belgrade, 11000 Belgrade, Serbia
3
Institute of Physics Belgrade, University of Belgrade, Pregrevica 118, 11080 Belgrade, Serbia
4
Faculty of Physics, University of Belgrade, 11000 Belgrade, Serbia
*
Authors to whom correspondence should be addressed.
Fractal Fract. 2024, 8(3), 175; https://doi.org/10.3390/fractalfract8030175
Submission received: 9 February 2024 / Revised: 13 March 2024 / Accepted: 14 March 2024 / Published: 18 March 2024
(This article belongs to the Section Life Science, Biophysics)

Abstract

:
Toxoplasma gondii is an obligate intracellular parasite existing in three infectious life stages—tachyzoites, bradyzoites, and sporozoites. Rupture of tissue cysts and re-conversion of bradyzoites to tachyzoites leads to reactivated toxoplasmosis (RT) in an immunocompromised host. The aim of this study was to apply ImageJ software for analysis of T. gondii brain cysts obtained from a newly established in vivo model of RT. Mice chronically infected with T. gondii (BGD1 and BGD26 strains) were treated with cyclophosphamide and hydrocortisone (experimental group—EG) or left untreated as infection controls (ICs). RT in mice was confirmed by qPCR (PCR+); mice remaining chronically infected were PCR−. A total of 90 images of cysts were analyzed for fractal dimension (FD), lacunarity (L), diameter (D), circularity (C), and packing density (PD). Circularity was significantly higher in PCR+ compared to IC mice (p < 0.05 for BGD1, p < 0.001 for the BGD26 strain). A significant negative correlation between D and PD was observed only in IC for the BGD1 strain (ρ = −0.384, p = 0.048), while fractal parameters were stable. Significantly higher D, C, and PD and lower lacunarity, L, were noticed in the BGD1 compared to the more aggressive BGD26 strain. In conclusion, these results demonstrate the complexity of structural alterations of T. gondii cysts in an immunocompromised host and emphasize the application potential of ImageJ in the experimental models of toxoplasmosis.

1. Introduction

Toxoplasma gondii is an obligate intracellular parasite with a worldwide distribution. It exists in three infectious life stages—rapidly dividing tachyzoites, slowly growing bradyzoites, and sporozoites. Conversion of tachyzoites into encysted bradyzoites is a particular feature of the complex life cycle of this parasite but essential for its persistence in the host [1]. However, rupture of tissue cysts with an egress of bradyzoites and their re-conversion to proliferating tachyzoites results in life-threatening reactivated toxoplasmosis (RT), which is an expected outcome of impaired immune control of the chronic infection [2].
Although T. gondii cyst stage has been extensively studied for decades, there are still controversies regarding mechanisms responsible for its latency in an immunocompetent host, as well as events preceding reactivation in the setting of a weakened immune system [3]. Furthermore, despite some existing drugs (used for the treatment of other diseases) [4,5] and novel compounds [6] with documented efficacy on T. gondii cyst stage in murine models of chronic toxoplasmosis, there is still a small arsenal of registered drugs available for the treatment of toxoplasmosis, and none of them are able to eradicate the parasite from an infected host [7,8]. In addition, the analysis of chemotherapy results in animal models often requires the application of a complex and heterogeneous methodology and needs to be improved in the future [9].
Computational image analysis is now increasingly used in biomedical research, offering a precise quantitative approach in describing complex objects [10,11,12,13]. Fractal-based image analysis methods can be used, solely or in combination with other methods such as the gray-level co-occurrence matrix (GLCM) analysis [14,15], discrete wavelet transform (DWT) [14], and the finite-element method (FEM) [16] to point out the structural alterations, i.e., different degrees of irregularity in the structure of signals and images of human biological samples obtained from a wide range of clinical conditions, predominantly carcinoma and chronic noncommunicable diseases. Depending on the studied problem, certain parameters were selected to conduct the analyses. In [14], fractal dimension was used alongside GLCM and DWT features in the classification of cells exposed to a hyperosmotic environment versus controls. In [16], fractal dimension combined with FEM was employed to assess the mechanical properties of liver tissue affected by fibrosis. Fractal lacunarity has been used in [15,17]. Multifractal features (generalized dimensions, singularity spectrum) have provided excellent classification accuracy in [18,19,20].
In microbiology, computational image analysis has also been proposed as a promising tool that could facilitate both research and diagnostics [21,22,23]. However, its application potential for in-depth studies focused on T. gondii is still limited. In fact, we were the first to introduce the use of freely available ImageJ software v. 1.52i (NIH, Bethesda, MD, USA), along with its fractal analysis plugin [24], as an affordable and widely accessible methodology for detailed observational analysis of T. gondii brain cysts [25]. For example, such a novel yet mathematically objective study approach on T. gondii cysts in murine models of toxoplasmosis would enable standardized analysis and interpretation of experimental results, and eventually facilitate drug development process.
Even though a variety of animal models of toxoplasmosis have been developed so far, primarily for chemotherapy studies [9], only few have been focused on RT. Indeed, development of an up-to-date murine model of RT that would allow for evaluation of drug efficacy in a rapidly rising population of immunocompromised patients, especially those undergoing organ or tissue transplantation [26], has become a research priority. Most in vivo models of RT established so far included only the high-dosage corticosteroid treatment [9,27]. Corticosteroids are indeed the first-line drugs used for the treatment of graft versus host disease (GVHD) in transplant recipients. In addition, cyclophosphamide is one of the widely used immunosuppressants in transplantation-related protocols [28] and has also been used in some experimental models of RT [29,30]. Combining these two drugs would enable closer simulation of one of the most common iatrogenic immunosuppression protocols in human transplantation medicine.
The aim of this study was to apply computer image analysis on high-resolution images of T. gondii brain cysts obtained from a newly established in vivo model of RT, using T. gondii strains isolated from human biological samples for infection and immunosuppressant drugs commonly administered in transplant recipients.

2. Materials and Methods

2.1. Mice

For in vivo experimental models of RT, Swiss Webster female mice (Medical Military Academy Animal Research Facility, Belgrade, Serbia) weighing 18–20 g at the beginning of the experiment were used. Mice were housed five per cage at the Institute for Medical Research Animal Research Facility, Belgrade, Serbia, and offered regular mouse feed and drinking water ad libitum.

2.2. Parasites

Two T. gondii strains of human origin genotyped as type II T. gondii strains (referred to as BGD1 and BGD26) were included in the study. These strains were previously isolated from human biological materials and thereafter regularly maintained in Swiss Webster mice in the National Reference Laboratory (NRL) for Toxoplasmosis, Belgrade, Serbia [31,32]. Tachyzoites used for experimental infection were obtained based on a previously established protocol [33]. Briefly, tachyzoites of the BGD1 and BGD26 strains were harvested from peritoneal exudates of Swiss Webster mice previously inoculated intraperitoneally (i.p.) with cysts, then propagated in Vero cells (ATCC No. CCL-81) and harvested before the inoculation. To determine the precise number of parasites needed for infection, 20 µL of suspension was stained with Trypan blue and counted using a Burker-Turk hemocytometer.

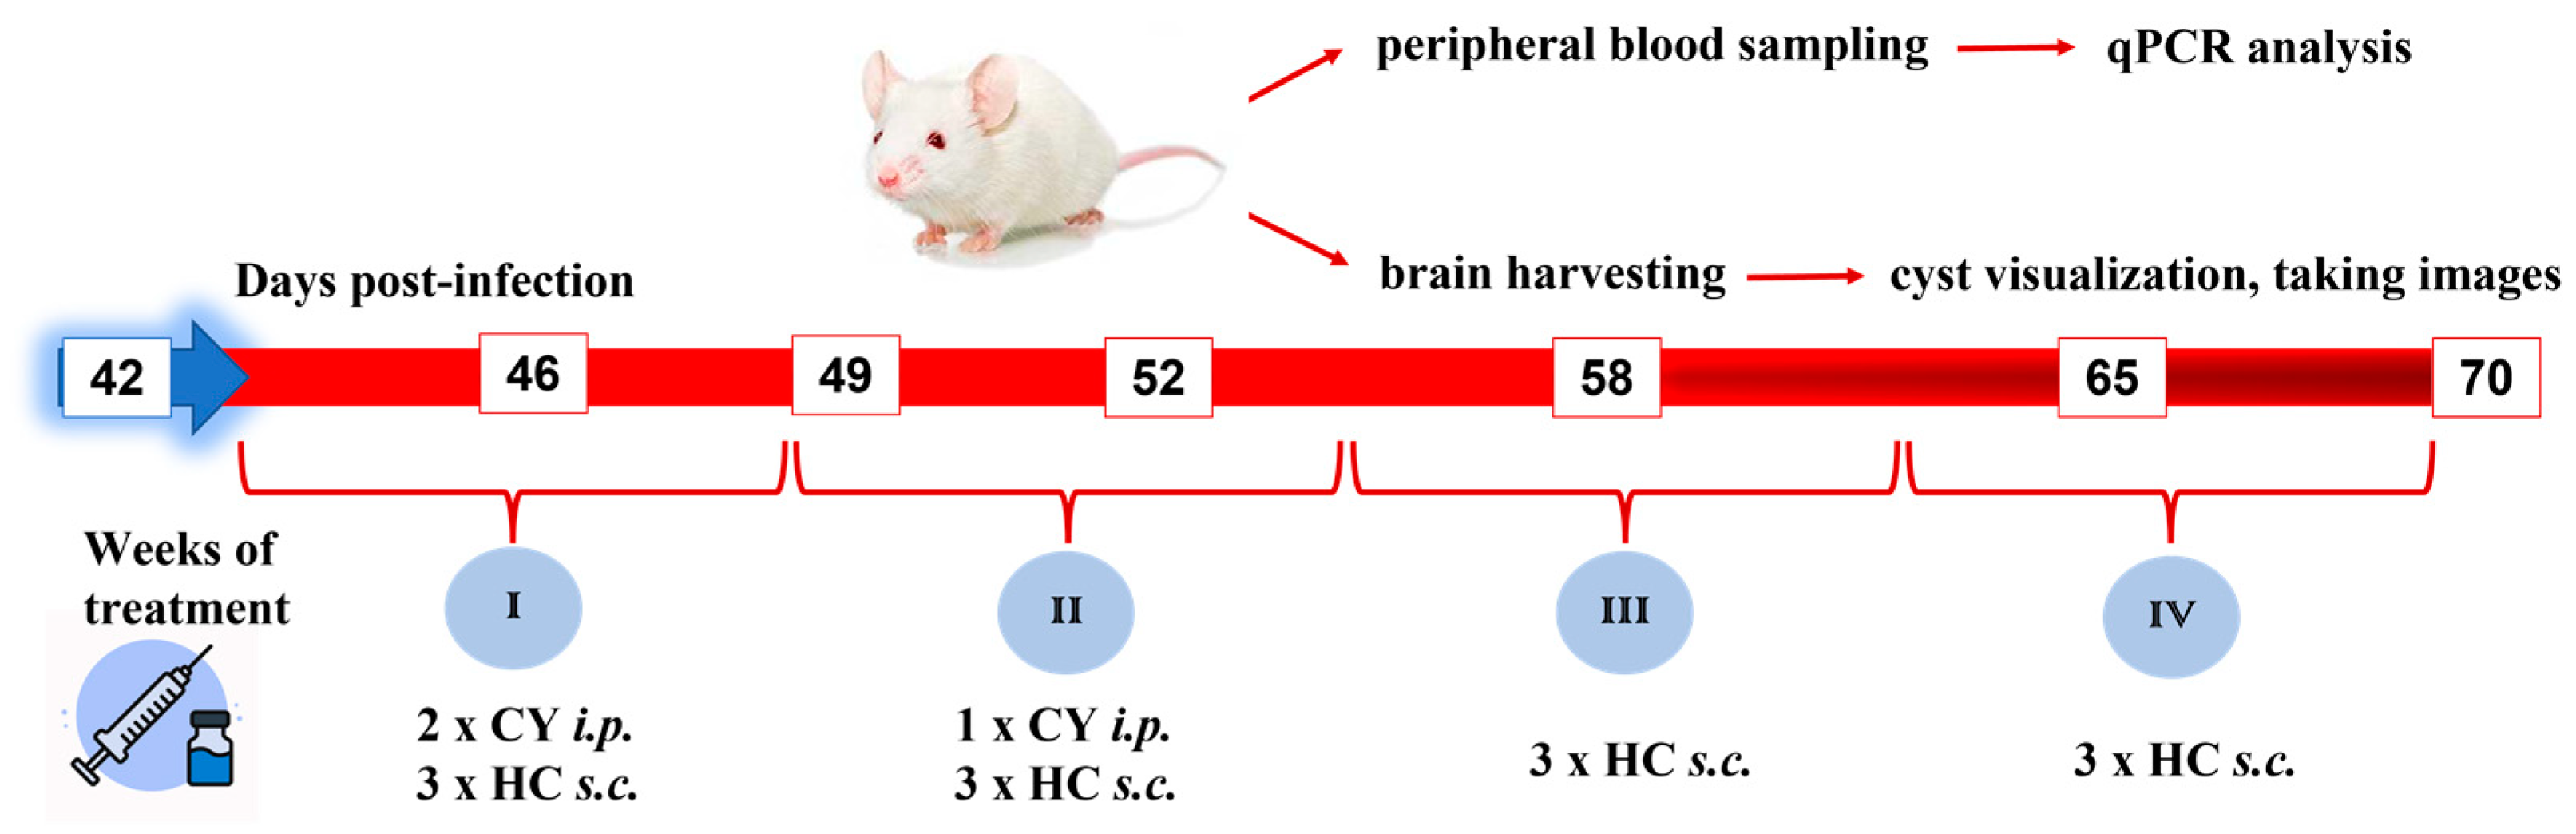
2.3. Experimental Design

The mice were inoculated i.p. with tachyzoites of the BGD1 (104, n = 102 mice) and BGD26 (102, n = 50 mice) strains. The doses of tachyzoites for each strain were determined based on the results of the survival rate in mice infected with 102 and 104 tachyzoites in our preliminary experiments. Signs of clinical aggravation (ruffled fur, apathy, loss of appetite/anorexia, etc.) and survival were monitored daily during the 42-day period needed for complete establishment of chronic infection. On day 21, T. gondii infection was confirmed in the surviving mice by the detection of specific IgG antibodies from serum using in-house high-sensitivity direct agglutination assay (HSDA), using approximately 20 µL of peripheral blood, drawn from the saphenous vein [34]. Seronegative mice were eliminated from the study.
To establish the in vivo model of RT that would respond to real-life challenges, Swiss Webster mice infected six weeks before with tachyzoites of BGD1 T. gondii strain were assigned to treatment with cyclophosphamide (150 mg/kg per dose in three doses every third day) and hydrocortisone (50 mg/kg per dose 3 times a week) (experimental group—EG) over a period of 4 weeks or left untreated as infection controls (ICs). Hence, immunosuppression in treated mice was achieved by using both drugs during the first two weeks and maintained only by the corticosteroid drug for the last two weeks of treatment/experiment. After the establishment of the model with BGD1, the same protocol was applied to the BGD26 strain, which was used to compare the results obtained with the main (BGD1) strain. The immunosuppressive drug regimen used in this study was based on the literature data [27,35] and results of our preliminary experiments, which showed a fast drop in leukocyte count in peripheral blood of treated animals (as low as 0.66 × 10⁶/mL peripheral blood (SD = 0.357) at day 10 of the treatment) and a mortality rate (30%) not exceeding the percentage reported for the usual corticosteroid regimen used in previous model of RT [27].
Peripheral blood (50 µL) for qPCR analysis was drawn from 1–5 mice (depending on survival) per strain at day 42 (IC mice) and at 6 more time points (IC and EG mice), defined within the treatment timeline (day 46, 49, 52, 58, 65, and 70 post-infection), if applicable (if there were surviving mice available at that particular time point). Upon collection of peripheral blood, mice were humanely sacrificed by cervical dislocation. Their brains were harvested, homogenized in 1 mL of saline solution using a syringe and a needle (21 gauge), and microscopically examined for the presence of T. gondii cysts.
RT in mice was diagnosed based on the detection of T. gondii 529-bp repetitive element in peripheral blood sample using qPCR [36]. Amplification was performed in a StepOnePlus Real-Time PCR System (Applied Biosystems, Foster City, CA, USA) using the following cycling conditions: 2 min at 50 °C, 10 min at 95 °C followed by 40 cycles of 15 s at 95 °C and 60 s at 60 °C. Apart from samples, the reaction mixture contained Maxima Probe/ROX qPCR Master Mix (2×) (Thermofisher Scientific, Waltham, MA, USA), forward (5′-AGAGACACCGGAATGCGATCT) and reverse (5′-CCCTCTTCTCCACTCTTCAATTCT) primers (25 µM), TaqMan probe (5′-6FAM-ACGCTTTCCTCGTGGTGATGGCG-TAMRA) (10 µM) (Invitrogen, Carlsbad, CA, USA), and nuclease-free water in a final volume of 20 µL. Samples were analyzed in duplicate. According to these results, treated mice were classified as T. gondii-reactivated (PCR+) or not (PCR−).
The experimental design of the model is presented in Figure 1.

2.4. Image Acquisition

Computer image analysis was performed on images of T. gondii cysts obtained from established in vivo models. For cyst visualization, 25 μL of the brain suspension was placed on glass slides without fixation. The cysts were morphologically recognized using a phase-contrast microscope (Axioskop 2 Plus, Zeiss, Jena, Germany), under magnification of 1000× (oil immersion), and photographed by Zeiss Axio-CamMRc 5 in a live image window. The cyst diameter was measured using AxioVision Rel. 4.8.2 software. The images were saved as 2584 × 1936 px2 TIFF files (image format 24 bit RGB). Several images of the same cyst were taken, and the best-focused one was selected for further analysis.

2.5. Image Analysis

All of the computer image analyses necessary for cyst characterization were performed using the ImageJ software package v. 1.52i (NIH, Bethesda, MD, USA), which is widely available, straightforward to apply, and amongst the tools of choice in the biomedical community. The acquired phase-contrast images appeared in shades of gray and were converted to 8-bit grayscale images prior to any analyses. Figure 2 shows several representative example cyst images, illustrating the initial appearance of bradyzoites within a cyst, as well as the transformations performed to prepare the original images for particle and fractal analysis. There are no obvious, to the human observer, differences in the visual appearance of bradyzoites between the two studied T. gondii strains; thus, only images for the BGD1 strain are shown. Examples are given for the IC and EG groups, for three time points. Contrast enhancements allowing 0.4% of saturated pixels and histogram equalization were carried out for all images, rendering high-contrast high-resolution images shown in the leftmost column of Figure 2.

2.5.1. Morphological Analysis

Morphological analysis was employed to check the cysts’ size and shape. The cyst Area, Perimeter, and circularity, C, were accurately determined by the ImageJ software. The cyst circularity, C, is defined as
C = 4 π × A r e a ( P e r i m e t e r ) 2 .
It is a measure of how close a shape is to a perfect circle. Shapes close to a circle have a C close to 1.0, whereas elongated shapes have a C close to 0.0. The cyst Perimeter was used to calculate the mean diameter for each cyst, which showed an excellent agreement with the diameters measured directly under the microscope. The Area was saved to be used in the calculation of packing density, PD.

2.5.2. Particle Analysis

For particle analysis, the enhanced contrast images underwent local Niblack thresholding and conversion to binary images. The default Niblack weighting coefficient of 0.2 for light objects on the dark background was kept for all images. The local threshold value at each pixel was calculated taking into account the neighborhood around that pixel, which was empirically chosen as a circular area (window) of a 28 px window radius. The neighborhood mean value of grayscale intensity was summed with the weighted standard deviation of grayscale intensity, resulting in the local threshold at each pixel:
tNi = μ(w) − 0.2·σ(w).
In (2), μ(w) and σ(w) correspond to the mean and standard deviation of grayscale intensities within a local neighborhood window of size w = 28 px. A different threshold for every pixel is based on the grayscale properties of the neighboring pixels [37].
The images were converted to binary. The watershed segmentation in ImageJ was performed next, in order to somehow work around the fact that the bradyzoites are extremely densely packed and overlap each other. The term watershed originates from the analogy with topography [38,39], where a catchment basin corresponds to the set of points whose path of steepest descent terminates in the same local minimum of the “height” function (pixel grayscale intensity minima, or pixel grayscale intensity maxima if an image is inverted). One of the very efficient early algorithms used an “immersion simulation” [38], imagining a water level rising from the local minima and flooding the basins. At each pixel where the water from two different minima would merge, a “dam” has to be built. At the end of the “immersion”, each minimum is completely surrounded by dams, i.e., watersheds delimiting its associated catchment basin. Algorithms working with binary images often use the inversed distance transformation.
Although the number of particles generated by segmentation could be somewhat larger than the actual number of bradyzoites in a studied cross-section, e.g., the front part and the rear part of an overlapped bradyzoite could be counted as two particles, identical treatment of all cyst images ensured an accurate assessment of relative particle numbers. The particle counting procedure, currently available in ImageJ, is known to work properly only with clearly separated particle areas. The obtained particle numbers, Np, were expected to be proportional to the actual numbers of bradyzoites within a cyst. The parameter of interest for cyst characterization, packing density, expressed in μm−2, was obtained as
P D = N p A r e a .

2.5.3. Fractal Analysis

As has been shown previously [25], the patterns of bradyzoite packing exhibit a fractal character, with the fractal dimension around 1.75. Whereas the PD describes the occupancy of the cysts, fractal parameters relate to the structural and textural properties of a pattern of bradyzoite contours. For example, if the bradyzoites underwent changes in size and particularly in roughness or raggedness of their contours, due to some external factors, one could expect to observe changes in the fractal parameters. These changes occur independently of the possible alterations in the numbers of bradyzoites and PD.
Starting from the high-contrast images in the leftmost column of Figure 2, we applied the global Otsu threshold to the entire cyst images, adjusting the threshold grayscale intensity to best outline the bradyzoite contours. Then, we adjusted the lower histogram value to keep only the narrow interval of gray tones including the Otsu threshold. In that manner, we obtained the relatively thin lines outlining the bradyzoite contours, shown in the right column of Figure 2. We took the 520 × 520 px2 sized cutouts from the region close to the cyst center to acquire equally sized visual texture images for all analyzed cysts. Fractal analysis was carried out on binary images (contour outlines) using the FracLac plugin (A. Karperien, Charles Sturt University, Bathurst, Australia) for ImageJ software [24].
We applied scaled series with a 7/8 ratio, meaning that an enlargement of consequent grid cell size was about 1/8, guaranteeing a sufficient number of relatively dense data points for fitting the regression lines. Here, a total of 25 grid cell sizes were applied to obtain the data points used for fitting the regression curves, describing the scale–count power law dependence. Namely, grid cells sized ε {16, 19, 21, 24, 28, 32, 36, 41, 47, 54, 62, 70, 81, 92, 105, 120, 137, 157, 180, 205, 234, 268, 306, 350, 400} px were used. Figure 3 shows an example bradyzoite contour outline covered by grid cells of different sizes, ε. Twelve random grid positionings per image were used.
The cumulative mass method, to determine the fractal dimension, FD, and fractal lacunarity, L, makes an assessment of the probability of finding m pixels inside a cell of size ε, P ( m , ε ) . This is carried out by counting pixels inside the grid cells and normalizing the obtained pixel count data for the total probability of one, m P ( m , ε ) = 1 . The first-order mass moment, M(ε), and the second-order mass moment, M2(ε), were obtained as:
M ( ε ) = m m P ( m , ε ) ,   M 2 ( ε ) = m m 2 P ( m , ε ) .
The FD was then estimated from the (ε, M(ε)) data as:
F D = lim ε 0 ln M ( ε ) ln ε .
Adequacy of regression line fit was estimated based on the correlation coefficient, r2, which was close to one for all analyzed images, confirming almost linear data and high FD estimate accuracy. The mean lacunarity, L, is obtained by averaging lacunarities per grid size, ε, calculated from the first-order and second-order mass moments as given below. The lacunarity for each grid size corresponds to the squared coefficient of variation.
λ ( ε ) = M 2 ( ε ) M ( ε ) 2 M ( ε ) 2 ,   L = λ ( ε ) .

2.6. Statistical Analysis

Statistical analysis was performed using GraphPad Prism 8.0.1. (GraphPad Software, San Diego, CA, USA). Shapiro–Wilk and Kolmogorov–Smirnov tests, as well as Q–Q plots, were used to test the normality of the dataset. Image data were evaluated by analysis of variance (ANOVA) and Tukey’s test for post hoc analysis, or Kruskal–Wallis with Dunn’s post hoc test, depending on the data distribution. The independent-samples t-test was used when comparing two sets of data, as well as the Mann–Whitney U test for comparing data with non-normal distribution. For analysis of correlation, Spearman’s or Pearson’s rank correlation tests were used, depending on the data distribution. The level of significance was p ≤ 0.05.

2.7. Ethics Statement

The study protocol was approved by the State Ethics Committee (Veterinary Directorate of the Ministry of Agriculture, Forestry and Water Management of Serbia decision no. 323-07-07496/2022-05). The animal experiments were conducted concordant to procedures described in the National Institutes of Health Guide for Care and Use of Laboratory Animals (Washington, DC, USA). All efforts were made to minimize suffering.

3. Results

In vivo models of RT used for harboring images required for ImageJ analysis conducted in this study were established by administering the combination of cyclophosphamide and hydrocortisone to mice chronically infected with one of two available T. gondii strains of human origin. After the establishment of chronic infection, and exclusion of uninfected mice (n = 4 for BGD1, and n = 1 for the BGD26 strain), surviving animals were assigned to treatment with immunosuppressant drugs (EG, n = 54 for BGD1 and n = 5 for the BGD26 strain) or left untreated as IC (n = 28 for BGD1 and n = 3 for the BGD26 strain). Signs of clinical deterioration in mice infected with either of the two strains were most pronounced in the second week of infection, as well as during the second week of combined treatment using both immunosuppressant drugs. The BGD26 strain appeared to be more virulent with a mortality rate of 83.7%, compared to BGD1 (16.3%). The majority of animals infected with either the BGD1 or BGD26 strain that succumbed to the infection died during the second week post-infection (10.2% and 61.2%, respectively) (Figure 4). During the treatment, the mortality rate was 7.4% for the BGD1 strain, while all treated animals infected with the BGD26 strain survived. According to qPCR results from peripheral blood samples, RT was diagnosed in 26.7% and 60% of animals infected with the BGD1 and BGD26 strain, respectively. Positive qPCR reactions from peripheral blood are presented in Figures S1–S10.
A total of 90 high-resolution images of T. gondii brain cysts obtained from established in vivo models of RT were analyzed for diameter (D), circularity (C), packing density (PD), fractal dimension (FD), and lacunarity (L), using ImageJ software. The analyzed cysts differed according to the parasite strain, treatment (IC or EG), and peripheral blood qPCR result (PCR+ or PCR−) (Table 1). The results of the analyzed parameters are summarized in Table 2.
Parameters of interest (D, C, PD, FD, and L) were compared among four different groups within a particular strain (IC, EG, PCR+, and PCR−), as well as between the two strains.
Cyst circularity was significantly higher in the mice with confirmed RT (PCR+) compared to untreated controls (ICs) (p < 0.05 for BGD1 and p < 0.001 for the BGD26 strain) and mice with no detected reactivation (PCR−) (only for the BGD1 strain, p < 0.05). However, in case of the BGD26 strain, the difference was also observed in all treated mice (EG) compared to the untreated ones (IC), regardless of reactivation (p < 0.05).
PD analysis showed no statistically significant differences among cysts regardless of the treatment and data on reactivation of T. gondii infection in mice. However, a significant negative correlation between D and PD was observed in the group of untreated mice for the BGD1 strain (ρ = −0.384, p = 0.048), but not in the treated ones. However, an inversed correlation was not found in either group of mice infected with the BGD26 strain.
In contrast to morphological and particle analysis, we have found that fractal analysis parameters (FD and L) were not altered by administered immunosuppressant drugs.
Comparison of ImageJ-derived parameters between images of cysts obtained throughout infection with T. gondii strains used for our model of RT revealed that D, C, and PD were significantly higher, while L was lower in the BGD1 strain in comparison to the BGD26 strain. Moreover, the differences in C, PD, and L between the two strains were highly significant. Opposed to that, there were no statistically significant differences in FD between the BGD1 and BGD26 strains (Table 2).

4. Discussion

Determination of quantitative parameters describing tissue cyst shape and occupancy, as well as their changes in various experimental settings in murine models of toxoplasmosis, could help gain further insights into the T. gondii strain-dependent cyst structure in brain tissue and its alterations under drug-induced immunosuppression. In our previous work, we have suggested the application potential of computational image analysis in revealing the complexity of T. gondii brain cysts. The majority of analyzed parameters were stable among cysts, indicating a highly uniform structure and occupancy of the T. gondii brain cysts of different age and parasite strains, as well as of those derived from mice of different genetic backgrounds [25].
A total of 90 high-resolution computer images of T. gondii brain cysts obtained from a model of RT established by using two different T. gondii strains (one per each experimental setting) and a combination of immunosuppressant drugs (cyclophosphamide and hydrocortisone) were analyzed in this study. We applied the methodology for image analysis, using the freely available ImageJ software, that we have previously published [25]. Morphological, particle, and fractal analysis was used to quantify the geometrical complexity of T. gondii brain cysts, as well as to determine if shape uniformity or structural organization of parasites inside tissue cysts were altered by applied immunosuppressive regimen.
Morphological and particle analysis revealed changes in cyst shape and occupancy in immunosuppressed mice. Circularity values in this study were remarkably close to one, confirming the almost perfectly round shape of T. gondii brain cysts, concurring our previous findings [25]. However, here, we observed a statistically significant increase in C in mice with confirmed RT. Apparently, excystation of bradyzoites in ruptured cysts triggered microscopically undetectable but statistically significant changes in cyst shape. It is known that a sphere has the lowest surface area for a given volume, and thus requires the least energy for maintaining its shape. Moreover, an increased pressure within a cyst, e.g., due to the slightly increased numbers of bradyzoites, would drive an increase in cyst circularity. Perhaps the additional rounding of brain cysts could also be interpreted as a parasite response to unfavorable events in its surroundings. This could be explained as a defense mechanism of T. gondii to maintain its persistence, as well as transmission to the new host, which is a tendency of every parasite [40]. Moreover, these results indicate that C, as a quantitative and easily obtained parameter, could be used as an additional tool for tracking the reactivation in murine models of RT and eventually replace more expensive molecular methods. Indeed, even though peripheral blood samples are extensively used for monitoring of T. gondii reactivation via state-of-the-art qPCR methodology, blood is not an ideal sample for PCR since it is abundant in DNA polymerase inhibitors, e.g., hem from hemoglobin, which could lead to false-negative results and undetectable reactivation. Further development of ImageJ plugins could not only minimize inconclusive or false-negative findings derived from PCR but also offer a more precise perspective into ultrastructural modifications leading to cyst instability and eventually, rupture. However, this should be confirmed on a larger scale, by expanding the experimental model through increase in the number and variety of mice species and parasite strains.
Our methodology used for particle analysis, with a watershed algorithm as an additional tool offering precise estimation of the relative number of closely packed parasites inside cysts, was previously underlined as simple, yet highly convenient, for this purpose [25]. As other authors [41], we [25] have also previously shown that D and PD of tissue cysts were inversely correlated. The same was observed here in the case of the BGD1 strain, albeit only in the group of infected untreated mice. In cysts derived from treated mice, on the other hand, the absence of a negative correlation between D and PD indicated changes in cyst occupancy in immunosuppressed mice. It is possible that cysts underwent significant structural changes as an effect of immunosuppressant treatment, leading to alterations of the relationship between D and PD that was previously established as stable. Never before were effects of immunosuppressants in chronic T. gondii infection, inevitably linked to reactivation risk, evaluated using ImageJ, even though it is a highly accessible piece of software. Possible reasons likely include a lack of publicly available data and the fact that the methodology itself is not standardized for evaluation of the infection stage. However, it should not be disregarded that the majority of PCR protocols used to diagnose and monitor infection are in-house and hence also unstandardized. The capacity of ImageJ to identify, to single out and mathematically prove new, treatment-related microscopic relations in the parasitic niche within the host organism, may complement a deeper understanding of not only the infection pathogenesis but also the mechanism of action of various drugs, both registered and experimental.
In contrast to morphological and particle analysis, the structure and organization of T. gondii cysts originating from either of those two strains did not change despite immunosuppressive treatment or reactivation of latent infection according to fractal analysis. FD was very uniform among the observed groups within a particular strain. Moreover, there was no difference between the two strains, which was in accordance with our previous findings [25]. Such results indicate that the immunosuppressive treatment did not in any way affect the contours of densely packed and overlapping bradyzoites inside the brain tissue cysts, i.e., it did not significantly affect bradyzoite shape. Whereas PD mainly describes the occupancy of the cysts, FD relates to the roughness or raggedness of contours of bradyzoites. It would be interesting to investigate if future treatment options aimed at having detrimental effects to T. gondii bradyzoites would perhaps modify otherwise very stable FDs. This observation also underlines the significance of FD as a well-established feature of T. gondii cysts from various sources. The ever-increasing number of immunocompromised patients prone to reactivation triggers more and more research aimed at the development of new compounds or repurposing of existing drugs that could be active towards bradyzoites, since none of the current treatment options are. These drug candidates are highly diverse, as is the methodology used for the evaluation of their effectiveness in many research centers worldwide, emphasizing the need to gather around a method that would be feasible, objective, and precise but also cost-effective. Armando et al. [42] have proposed an algorithm for an automated detection of T. gondii cysts on microscopic slides based on specific parameters of T. gondii cysts calculated with MatLab software (v. 2013). Defining the range of FD values in our research is a valuable result which could be used as a valuable parameter for developing such an algorithm and associated software. Time-consuming detection of T. gondii cysts by microscopic slide examination requires experienced microscopist. Thus, ImageJ could be used for the future upgrade of bioassay, a gold-standard, confirmatory diagnostic test based on microscopic identification of T. gondii cysts in brain samples of mice inoculated with biological samples (blood, amniotic fluid, cerebrospinal fluid, etc.). Although still used in specialized laboratories, time-consuming and labor-intensive bioassay is largely obsolete in most diagnostic and research centers, often due to deficiency in highly trained staff and objective, quantifiable approach in results interpretation, which is an undisputable asset of an ImageJ-based methodology. Moreover, ImageJ could find its application in chemotherapy studies as well. Namely, brain cyst counts, but also their in-depth characteristics, are valuable experimental results in murine models of toxoplasmosis. Tracking the reduction of brain cyst burden in chemotherapy experiments by automatic detection of brain cysts on microscopic slides by ImageJ could facilitate evaluating the effects of therapeutics with anti-T. gondii properties, particularly those effective against cyst stage of this parasite.
T. gondii strains used for our models of RT were previously classified as type II strains and were both isolated from cases of human congenital toxoplasmosis. The presented results of the computer analysis of brain cysts highlight the digital methodology as an additional objective approach in distinguishing strains of T. gondii, which can be combined with the known clinical presentation in congenitally infected infants and data obtained from extensive in vivo studies. Namely, while there were no clinical signs of infection in newborns infected with the BGD1 strain, the one infected with BGD26 presented with hydrocephalus and epilepsy. Furthermore, the results derived from established models of RT indicate that there is a difference in virulence between these strains. During acute toxoplasmosis, the mortality rate in mice infected with the BGD26 strain was five times higher than in BGD1-infected mice. This virulence apparently also affected the incidence of RT, as the mice infected with the BGD26 strain were almost three times more prone to reactivation. Furthermore, according to computational analysis, these differences reflected in the structure of tissue cysts, since the majority of analyzed parameters were strain-dependent. Namely, we have shown that cysts of a less virulent BGD1 strain were larger, more densely packed, and with a more pronounced spherical shape. The higher circularity of the strain could be responsible for its better stability in brain tissue of an immunocompromised host. In contrast to FD, which remained uniform, lacunarity, L, was significantly lower in the BGD1 strain compared to BGD26, which confirmed our previous observations [25]. Apparently, the homogeneity of structure inside tissue cysts quantified here by L depends on the T. gondii strain. Although we have previously speculated it could be associated with the number of passages in laboratory animals, the intrinsic features such as virulence of a particular strain could be another explanation. According to our results, more homogeneous cysts originated from the BGD1 strain, which is a strain of lower virulence and reactivation rate compared to BGD26.
The results of the present study indicate that there is in fact a low level of uniformity in the structure of brain cysts derived from two different T. gondii strains, as opposed to our previous observation regarding the complexity of T. gondii cysts [25]. In addition to parasite strains used for infection, other experimental conditions such as life stage of the parasite, route of infection, and genetic background of the host affect infection dynamics and further hamper the interpretation of experimental results [43,44]. In the present study, the possible impact of such variables was excluded by providing identical, strictly controlled experimental conditions. Namely, the i.p. application of the precisely counted exact number of tachyzoites per mouse (Swiss-Webster females, 18–20 g) herein allowed for more precise comparison of strain-related differences in the structure of T. gondii brain cysts. On the other hand, almost half of the analyzed images from previously published studies originated from a collection stored in the NRL’s photo archive [25], thus lacking the uniform standard.
In conclusion, these results pave the way for the further application of image analysis in experimental models of toxoplasmosis. This innovative approach sheds new light on structural changes of the T. gondii cyst stage in an immunocompromised host, allowing for their objective quantitative analysis. Furthermore, the availability of a sustainable animal model of RT alongside advanced, computer-based image analysis of cysts obtained in chemotherapy experiments offers an immense potential to, in time, enable optimization and standardization of the evaluation of effects of novel therapeutics for T. gondii. It could provide a straightforward and cost-effective mathematically quantifiable computer-based approach to analysis of the effectiveness of potential drug candidates in chemotherapy experiments, which remains to be investigated in future studies.

Supplementary Materials

The following supporting information can be downloaded at: https://www.mdpi.com/article/10.3390/fractalfract8030175/s1, Figures S1–S10: Positive qPCR reactions from peripheral blood.

Author Contributions

Conceptualization, N.B., J.S., I.Č.Č., B.B., A.Ž.I. and T.Š.; methodology, N.B., J.S., V.Ć., B.B., A.Ž.I. and T.Š.; software, J.T. and A.Ž.I.; validation, N.B., J.S., I.Č.Č., A.Ž.I. and T.Š.; formal analysis, N.B., J.S., O.L., J.T., A.Ž.I. and T.Š.; investigation, N.B., J.S., O.L., V.Ć., B.B. and A.Ž.I.; resources, A.Ž.I. and T.Š.; data curation, N.B., J.S., O.L., A.Ž.I. and T.Š.; writing—original draft preparation, N.B., J.S., A.Ž.I. and T.Š.; writing—review and editing, N.B., J.S., I.Č.Č., O.L., V.Ć., J.T., B.B., A.Ž.I. and T.Š.; visualization, N.B., J.S., O.L., J.T. and A.Ž.I.; supervision, T.Š.; project administration, A.Ž.I. and T.Š.; funding acquisition, T.Š. All authors have read and agreed to the published version of the manuscript.

Funding

This research was funded by the Science Fund of the Republic of Serbia, 7328, Reinvention of the diagnostic algorithm and treatment options for reactivated toxoplasmosis—ToxoReTREAT. N.B., J.S., O.L., V.Ć., B.B., and T.Š. also acknowledge funding by the Ministry of Science, Technological Development, and Innovation of the Republic of Serbia (contract no. 451-03-47/2023-01/200015). A.Ž.I. and J.T. also acknowledge funding provided by the Institute of Physics Belgrade, University of Belgrade, through the grants by the Ministry of Science, Technological Development, and Innovation of the Republic of Serbia.

Data Availability Statement

The raw data supporting the conclusions of this article will be made available by the authors on request.

Conflicts of Interest

The authors declare no conflicts of interest. The funders had no role in the design of the study; in the collection, analyses, or interpretation of data; in the writing of the manuscript; or in the decision to publish the results.

References

  1. Dubey, J.P. Advances in the life cycle of Toxoplasma gondii. Int. J. Parasitol. 1998, 28, 1019–1024. [Google Scholar] [CrossRef]
  2. Weiss, L.M.; Dubey, J.P. Toxoplasmosis: A history of clinical observations. Int. J. Parasitol. 2009, 39, 895–901. [Google Scholar] [CrossRef]
  3. Augusto, L.; Wek, R.C.; Sullivan, W.J., Jr. Host sensing and signal transduction during Toxoplasma stage conversion. Mol. Microbiol. 2021, 115, 839–848. [Google Scholar] [CrossRef]
  4. Martynowicz, J.; Doggett, J.S.; Sullivan, W.J., Jr. Efficacy of Guanabenz Combination Therapy against Chronic Toxoplasmosis across Multiple Mouse Strains. Antimicrob. Agents. Chemother. 2020, 64, e00539-20. [Google Scholar] [CrossRef]
  5. Hamie, M.; Najm, R.; Deleuze-Masquefa, C.; Bonnet, P.A.; Dubremetz, J.F.; El Sabban, M.; El Hajj, H. Imiquimod Targets Toxoplasmosis Through Modulating Host Toll-Like Receptor-MyD88 Signaling. Front. Immunol. 2021, 12, 629917. [Google Scholar] [CrossRef]
  6. Rodriguez, J.B.; Szajnman, S.H. An updated review of chemical compounds with anti-Toxoplasma gondii activity. Eur. J. Med. Chem. 2023, 262, 115885. [Google Scholar] [CrossRef]
  7. Angel, S.O.; Vanagas, L.; Ruiz, D.M.; Cristaldi, C.; Saldarriaga Cartagena, A.M.; Sullivan, W.J., Jr. Emerging Therapeutic Targets Against Toxoplasma gondii: Update on DNA Repair Response Inhibitors and Genotoxic Drugs. Front. Cell. Infect. Microbiol. 2020, 10, 289. [Google Scholar] [CrossRef] [PubMed]
  8. Silva, M.D.; Teixeira, C.; Gomes, P.; Borges, M. Promising Drug Targets and Compounds with Anti-Toxoplasma gondii Activity. Microorganisms 2021, 9, 1960. [Google Scholar] [CrossRef] [PubMed]
  9. Dunay, I.R.; Gajurel, K.; Dhakal, R.; Liesenfeld, O.; Montoya, J.G. Treatment of toxoplasmosis: Historical perspective, animal models, and current clinical practice. Clin. Microbiol. Rev. 2018, 31, e00057-17. [Google Scholar] [CrossRef] [PubMed]
  10. Koundal, D.; Gupta, S. Advances in Computational Techniques for Biomedical Image Analysis; Academic Press: Cambridge, MA, USA, 2020; pp. 299–308. [Google Scholar]
  11. Madabhushi, A.; Lee, G. Image analysis and machine learning in digital pathology: Challenges and opportunities. Med. Image Anal. 2016, 33, 170–175. [Google Scholar] [CrossRef]
  12. Sbalzarini, I.F. Seeing is Believing: Quantifying is Convincing: Computational image analysis in biology. In Focus on Bio-Image Informatics. Advances in Anatomy, Embryology and Cell Biology; De Vos, W., Munck, S., Timmermans, J.P., Eds.; Springer: Cham, Switzerland, 2016; Volume 219. [Google Scholar] [CrossRef]
  13. AlSheikh, M.H.; Al-Saidi, N.M.G.; Ibrahim, R.W. Dental X-ray identification system based on association rules extracted by k-symbol fractional Haar functions. Fractal Fract. 2022, 6, 669. [Google Scholar] [CrossRef]
  14. Pantic, I.; Valjarevic, S.; Cumic, J.; Paunkovic, I.; Terzic, T.; Corridon, P.R. Gray level co-occurrence matrix, fractal and wavelet analyses of discrete changes in cell nuclear structure following osmotic stress: Focus on machine learning methods. Fractal Fract. 2023, 7, 272. [Google Scholar] [CrossRef]
  15. Djuričić, G.J.; Radulović, M.; Sopta, J.P.; Nikitović, M.; Milošević, N.T. Fractal and Gray Level Cooccurrence Matrix computational analysis of primary osteosarcoma magnetic resonance images predicts the chemotherapy response. Front. Oncol. 2017, 7, 246. [Google Scholar] [CrossRef] [PubMed]
  16. Prieto-Vázquez, A.Y.; Cuautle-Estrada, A.; Grave-Capistrán, M.A.; Ramírez, O.; Torres-SanMiguel, C.R. Fractal analysis and FEM assessment of soft tissue affected by fibrosis. Fractal Fract. 2023, 7, 661. [Google Scholar] [CrossRef]
  17. Zaia, A.; Maponi, P. Mitochondrial DNA profiling by fractal lacunarity to characterize the senescent phenotype as normal aging or pathological aging. Fractal Fract. 2022, 6, 219. [Google Scholar] [CrossRef]
  18. Atupelage, C.; Nagahashi, H.; Yamaguchi, M.; Abe, T.; Hashiguchi, A.; Sakamoto, M. Computational grading of hepatocellular carcinoma using multifractal feature description. Comput. Med. Imaging Graph. 2013, 37, 61–71. [Google Scholar] [CrossRef]
  19. Abdelsalam, M.M.; Zahran, M.A. A novel approach of diabetic retinopathy early detection based on multifractal geometry analysis for OCTA macular images using support vector machine. IEEE Access 2021, 9, 22844–22858. [Google Scholar] [CrossRef]
  20. He, S.; Thangaraj, C.; Easwaramoorthy, D.; Muhiuddin, G. Multifractal analysis on age-based discrimination in X-ray images for sensing the severity of COVID-19 disease. Eur. Phys. J. Spec. Top. 2022, 231, 3663–3671. [Google Scholar] [CrossRef]
  21. Rani, P.; Kotwal, S.; Manhas, J.; Sharma, V.; Sharma, S. Machine Learning and Deep Learning Based Computational Approaches in Automatic Microorganisms Image Recognition: Methodologies, Challenges, and Developments. Arch. Comput. Methods. Eng. 2022, 29, 1801–1837. [Google Scholar] [CrossRef]
  22. Shambhu, S.; Koundal, D.; Das, P.; Hoang, V.T.; Tran-Trung, K.; Turabieh, H. Computational Methods for Automated Analysis of Malaria Parasite Using Blood Smear Images: Recent Advances. Comput. Intell. Neurosci. 2022, 2022, 3626726. [Google Scholar] [CrossRef]
  23. Jeckel, H.; Drescher, K. Advances and opportunities in image analysis of bacterial cells and communities. FEMS Microbiol. Rev. 2021, 45, fuaa062. [Google Scholar] [CrossRef]
  24. Karperien, A.L.; Jelinek, H.F. Box-counting fractal analysis: A primer for the clinician. In The Fractal Geometry of the Brain; Di Ieva, A., Ed.; Springer: New York, NY, USA, 2016; pp. 91–108. [Google Scholar] [CrossRef]
  25. Bauman, N.; Ilić, A.; Lijeskić, O.; Uzelac, A.; Klun, I.; Srbljanović, J.; Ćirković, V.; Bobić, B.; Štajner, T.; Djurković-Djaković, O. Computational image analysis reveals the structural complexity of Toxoplasma gondii tissue cysts. PLoS ONE 2020, 15, e0234169. [Google Scholar] [CrossRef] [PubMed]
  26. Passweg, J.R.; Baldomero, H.; Bader, P.; Bonini, C.; Cesaro, S.; Dreger, P.; Duarte, R.F.; Dufour, C.; Kuball, J.; Farge-Bancel, D.; et al. Hematopoietic stem cell transplantation in Europe 2014: More than 40000 transplants annually. Blood Marrow Transplant. 2016, 51, 786–792. [Google Scholar] [CrossRef] [PubMed]
  27. Djurkovic-Djakovic, O.; Milenkovic, V. Murine model of drug induced reactivation of Toxoplasma gondii. Acta Protozool 2001, 40, 99–106. [Google Scholar]
  28. Carreras, E.; Dufour, C.; Mohty, M.; Kröger, N. (Eds.) The EBMT Handbook: Hematopoietic Stem Cell Transplantation and Cellular Therapies, 7th ed.; Springer: Cham, Switzerland, 2019. [Google Scholar]
  29. Silva, L.A.; Brandão, G.P.; Pinheiro, B.V.; Vitor, R.W. Immunosuppression with cyclophosphamide favors reinfection with recombinant Toxoplasma gondii strains. Parasite 2012, 19, 249–257. [Google Scholar] [CrossRef] [PubMed]
  30. Jin, Y.; Yao, Y.; El-Ashram, S.; Tian, J.; Shen, J.; Ji, Y. The Neurotropic Parasite Toxoplasma gondii Induces Astrocyte Polarization through NFκB Pathway. Front. Med. 2019, 6, 267. [Google Scholar] [CrossRef] [PubMed]
  31. Djurković-Djaković, O.; Klun, I.; Khan, A.; Nikolić, A.; Knezević-Usaj, S.; Bobić, B.; Sibley, L.D. A human origin type II strain of Toxoplasma gondii causing severe encephalitis in mice. Microbes Infect. 2006, 8, 2206–2212. [Google Scholar] [CrossRef] [PubMed]
  32. Stajner, T.; Bobic, B.; Klun, I.; Nikolic, A.; Srbljanovic, J.; Uzelac, A.; Rajnpreht, I.; Djurkovic-Djakovic, O. Prenatal and early postnatal diagnosis of congenital toxoplasmosis in a setting with no systematic screening in pregnancy. Medicine 2016, 95, e2979. [Google Scholar] [CrossRef]
  33. Rajnpreht, I.; Klun, I.; Uzelac, A.; Bobić, B.; Nikolić, A.; Srbljanović, J.; Djurković-Djaković, O. Vero cells as an in vitro model system for the propagation of type-3 Toxoplasma gondii tachyzoites. In Proceedings of the 12th European Multicolloquium of Parasitology, Turku, Finland, 20–24 July 2016. [Google Scholar]
  34. Desmonts, G.; Remington, J.S. Direct agglutination test for diagnosis of Toxoplasma infection: Method for increasing sensitivity and specificity. J. Clin. Microbiol. 1980, 11, 562–568. [Google Scholar] [CrossRef]
  35. Huyan, X.H.; Lin, Y.P.; Gao, T.; Chen, R.Y.; Fan, Y.M. Immunosuppressive effect of cyclophosphamide on white blood cells and lymphocyte subpopulations from peripheral blood of Balb/c mice. Int. Immunopharmacol. 2011, 11, 1293–1297. [Google Scholar] [CrossRef]
  36. Stajner, T.; Vasiljević, Z.; Vujić, D.; Marković, M.; Ristić, G.; Mićić, D.; Pasić, S.; Ivović, V.; Ajzenberg, D.; Djurković-Djaković, O. Atypical strain of Toxoplasma gondii causing fatal reactivation after hematopoietic stem cell transplantion in a patient with an underlying immunological deficiency. J. Clin. Microbiol. 2013, 51, 2686–2690. [Google Scholar] [CrossRef]
  37. Singh, T.R.; Roy, S.; Singh, O.I.; Sinam, T.; Singh, K.M. A new local adaptive thresholding technique in binarization. Int. J. Comp. Sci. 2011, 8, 271–277. [Google Scholar] [CrossRef]
  38. Soille, P.; Vincent, L. Watersheds in digital spaces: An efficient algorithm based on immersion simulations. IEEE Trans. Pattern Anal. Mach. Intell. 1991, 13, 583–598. [Google Scholar] [CrossRef]
  39. Kornilov, A.S.; Safonov, I.V. An overview of watershed algorithm implementations in open source libraries. J. Imaging 2018, 4, 123. [Google Scholar] [CrossRef]
  40. Rougier, S.; Montoya, J.G.; Peyron, F. Lifelong persistence of toxoplasma cysts: A questionable dogma? Trends Parasitol. 2017, 33, 93–101. [Google Scholar] [CrossRef] [PubMed]
  41. Watts, E.; Zhao, Y.; Dhara, A.; Eller, B.; Patwardhan, A.; Sinai, A.P. Novel approaches reveal that Toxoplasma gondii bradyzoites within tissue cysts are dynamic and replicating entities in vivo. mBio 2015, 6, e01155-15. [Google Scholar] [CrossRef]
  42. Armando, Q.; Graciela, J. Identification of Toxoplasma gondii cysts in samples from Colombia using digital image processing. In Proceedings of the 2014 IEEE ANDESCON, Cochabamba, Bolivia, 15–17 October 2014; p. 1. [Google Scholar] [CrossRef]
  43. Howe, D.K.; Sibley, L.D. Toxoplasma gondii comprises three clonal lineages: Correlation of parasite genotype with human disease. J. Infect. Dis. 1995, 172, 1561–1566. [Google Scholar] [CrossRef] [PubMed]
  44. Szabo, E.K.; Finney, C.A.M. Toxoplasma gondii: One organism, multiple models. Trends Parasitol. 2017, 33, 113–127. [Google Scholar] [CrossRef]
Figure 1. Model of RT—experimental design. Time points for IC (blue and red) and EG (red) are presented on the timeline. CY—cyclophosphamide; HC—hydrocortisone.
Fractalfract 08 00175 g001
Figure 2. High-contrast high-resolution T. gondii cyst images (several representative example images). Leftmost: contrast enhanced; middle: transformed images used for particle analysis; rightmost: transformed images used for fractal analysis.
Fractalfract 08 00175 g002
Figure 3. Grids of different grid cell sizes, ε, used to cover a binary two-dimensional (2D) pattern while obtaining the data points for the scale–count dependence.
Fractalfract 08 00175 g003
Figure 4. Survival in mice upon infection with T. gondii strains of human origin, BGD1 or BGD26.
Fractalfract 08 00175 g004
Table 1. Number of analyzed cysts (images *) per strain.
Strain IC EG Total
PCR+ PCR−
BGD12772155
BGD2610151035
IC—infection control; EG—experimental group. * Only one image per cyst was selected for the final analysis.
Table 2. Strain-related differences in parameters of structural complexity of T. gondii cysts (mean ± SD).
StrainGroupD (μm)CPD (μm–2)FDL
BGD1IC45.80 ± 13.000.994 ± 0.0030.533 ± 0.0601.746 ± 0.0700.259 ± 0.076
EG PCR−44.55 ± 11.680.994 ± 0.0020.604 ± 0.2421.748 ± 0.0690.259 ± 0.076
EG PCR+46.32 ± 16.710.996 ± 0.0010.553 ± 0.0731.749 ± 0.0690.252 ± 0.073
Total45.52 ± 12.850.994 ± 0.0020.563 ± 0.1591.747 ± 0.0700.258 ± 0.076
BGD26IC32.97 ± 5.450.979 ± 0.0110.415 ± 0.0341.746 ± 0.0710.289 ± 0.082
EG PCR−41.02 ± 9.860.988 ± 0.0060.452 ± 0.1391.749 ± 0.0700.285 ± 0.083
EG PCR+34.29 ± 8.260.989 ± 0.0070.480 ± 0.0591.750 ± 0.0670.294 ± 0.082
Total35.84 ± 8.550.986 ± 0.0090.454 ± 0.0871.749 ± 0.0690.290 ± 0.082
p
values
0.0049<0.0001<0.00010.6341<0.0001
IC—infection control; EG—experimental group; D—diameter; C—circularity; PD—packing density; FD—fractal dimension; L—lacunarity. p values are shown for comparison of parameters among cysts of different strains in the IC group.
Disclaimer/Publisher’s Note: The statements, opinions and data contained in all publications are solely those of the individual author(s) and contributor(s) and not of MDPI and/or the editor(s). MDPI and/or the editor(s) disclaim responsibility for any injury to people or property resulting from any ideas, methods, instructions or products referred to in the content.

