1. Introduction
Globally, over 660 million patients had been diagnosed with COVID-19 infection by January 2023, and about 6.6 million died from COVID-19. It is important to screen for COVID-19 as soon as possible to prevent its spread through separation and medical treatment. COVID-19 is an infection initiated via a virus called SARS-CoV-2. As a matter of fact, there are many different types of lung infections, which can range from a simple cold to a fatal condition. Coronaviruses are known to cause respiratory system symptoms, frequently mistaken for contagions caused by other viruses. In unusual cases, individuals may have slight, self-restraining infections with adversative properties such as influenza. There are several symptoms of respiratory concerns, including fever, coughing, and trouble breathing, as well as exhaustion, a sore throat, and a weak immune system [
1,
2,
3,
4,
5]. The use of CT scans and X-rays is without a doubt one of the most important methods for the detection of COVID-19. There is a consensus within the medical community that chest imaging is a quick and effective method of diagnosis. Numerous papers have pointed out that it is the first screening tool for widespread use. Several different computer vision techniques are used to segment and classify objects. As an alternative to a computer-based automatic method that allows the progression of patients infected by measuring the infection region and disintegrating it every two to six days, a computer-based automatic method that can run on partial computing devices is a great solution when the task is quick and straightforward. Medical recognition is essential, as COVID-19 is a challenging syndrome for medical professionals to detect [
6,
7,
8,
9].
The WHO called it a major universal public health crisis, and the situation continued to pose a public health issue that necessitated substantial coordination. COVID-19 can be reported automatically through CT scans, making it an excellent way to extend traditional healthcare methods. However, CT has several limitations [
10,
11]. It should be noted that despite this, COVID-19 cases continue to rise sharply. COVID-19 patients represent a significant number of patients that must be detected and monitored manually, which is challenging. Hence, one of the most significant responsibilities of stopping the spread of COVID-19 is to come up with a fast and precise method of diagnosing the disease. In the past few years, research into artificial intelligence has grown in popularity, attracting scholars to solve complex problems in many areas, such as medicine, economics, and cyber security. Artificial intelligence offers significant advantages by substituting humans with machines capable of executing repetitive and complex tasks, resulting in notable benefits [
12,
13,
14,
15,
16,
17]. Artificial intelligence (AI) can solve the analytical issues relating to a rapid increase in patients. Many researchers believe machine learning can successfully detect COVID-19 patients using medical images. The development of machine learning techniques for chest CT and X-ray images of COVID-19 patients has been studied, and some have achieved outstanding results. Moreover, many innovative and inspirational image-processing algorithms have been developed for the detection of COVID-19 [
18].
Other important diagnostic tools, including radiological imaging, can also be used for COVID-19. It is commonly observed that CT images of COVID-19 patients demonstrate ground-glass opacities in the early stages of the disease and consolidation of the lungs in the later stages of the disease. The morphology of the lung may also be rounded, and there may be a peripheral lung distribution [
19,
20,
21,
22,
23,
24,
25,
26,
27].
In situations where the patient is suspected of having viral pneumonia, CT scans can provide an early indication of infection. While there are several causes of viral pneumonia, the images of the various causes are similar. These images also overlap with those seen in other inflammatory and infectious lung diseases. Since COVID-19 cannot be distinguished from other viral pneumonia as a result of this overlap, radiologists have difficulty diagnosing the disease. As the gold standard for diagnosing viral and bacterial infections at the molecular level, the RT-PCR method is used by most health authorities around the world to diagnose viral and bacterial infections [
28]. To lower the disease curve, early detection and mass testing are necessary. To fulfill the demands on the healthcare system, all infrastructure must be expanded with the rapidly increasing number of newly diagnosed illnesses. It has been found that chest computed tomography can be useful in the early detection of the disease. In certain instances, the initial PCR test results for the patient indicated a negative outcome. However, confirmation relied on the findings from their CT scan. Moreover, a chest CT screening was advised as the patient displayed symptoms consistent with COVID-19, despite the negative results of the PCR tests [
29,
30,
31]. Automatic detection tools will be key to preventing the spread of disease and speeding up the diagnosis process to prevent further spread and, at the same time, ensure that CT images are available to construct an AI-based device to prevent their spread. Several attempts have been made to identify alternative testing tools for COVID-19 infection to alleviate the shortage and inefficiency of current tests. Researchers have demonstrated that CT scans highly indicate COVID-19’s radiological features. CT scanners are readily available and can be used by a wide range of medical professionals, making them an efficient and useful tool for testing.
This paper investigates COVID-19 detection from CT images by fractional Fourier transform. The FrFT is a generalized form of the Fourier transform, considered a time-frequency transform, unlike the Fourier transform, which only provides frequency information. The features extracted in this study are fractional Fourier transform coefficients, which are complex numbers, obtained by applying FRFT to the image.
An overview of the literature is presented in the following section. The next section provides an overview of the proposed database. After describing the database, the next section describes the proposed method, pre-processing, feature selection, and classification. In the following section, we summarize the results of the experiments. As a final section, the main conclusions of the study are presented.
2. Literature Review
In the medical imaging field, artificial intelligence has been primarily introduced to provide improved quality and efficiency of clinical care in response to the need for better clinical treatments. It is widely believed that the amount of radiology imaging data is growing much faster than the number of qualified readers. Due to this fact, healthcare professionals are constantly required to improve their efficiency in the way they analyze images to compensate for this lack of efficiency. Kaur and Ghandi conducted a study on COVID-19 detection using transfer learning and investigated various pre-trained network architectures suitable for small medical imaging datasets. Specifically, they explored different variants of the pre-trained ResNet model, including ResNet18, ResNet50, and ResNet101. The experimental findings showed that the transfer learned ResNet50 model outperformed the other models, achieving a recall of 98.80% and an F1-score of 98.41%. To further enhance the results, the researchers examined the activations from different layers of the best performing model and applied support vector machine, logistic regression, and K-nearest neighbor classifiers for detection. Additionally, they proposed a classifier fusion strategy that combined predictions from different classifiers using majority voting. The experimental results demonstrated that by utilizing learned image features and the classification fusion strategy, the recall and F1-score were further improved to 99.20% and 99.40%, respectively [
32].
Xu et al. presented a model that was evaluated on the COVID-CT and SARS-CoV-2 datasets. The proposed method was compared to a standard deep convolutional neural network (DCNN) as well as seven other variable-length models using five commonly used metrics: sensitivity, accuracy, specificity, F1-score, precision, and receiver operating curve (ROC) and precision-recall curves. The results of the study indicated that the proposed DCNN-IPSCA model outperformed the other benchmarks. It achieved a final accuracy of 98.32% and 98.01%, sensitivity of 97.22% and 96.23%, and specificity of 96.77% and 96.44% on the SARS-CoV-2 and COVID-CT datasets, respectively. These findings demonstrate the superiority of the proposed model in accurately classifying COVID-19 cases and distinguishing them from other conditions in the examined datasets [
33].
According to Dansana, CT scan and X-ray image data sets containing 360 images were processed using a CNN-based approach. The data were transformed using the Inception_V2, DT, and VGG-19 methods based on a binary classification pneumonia method. We have demonstrated that a fine-tuned version of the VGG-19, Inception_V2, and DT method produces high training accuracy and validation rates [
34].
In the case of feature extraction-based approaches, several frameworks have recently been developed, usually relying on a CNN. In addition to applying a 3D CNN to the whole CT volume in one stage, 2D CNNs are applied to CT slices, and the slice-level results are aggregated through an aggregation mechanism. The results obtained in a study by Wang on a dataset that included only COVID-19 cases and normal cases showed an accuracy of 90.1%, a sensitivity of 84.0%, and a specificity of 98.2% with a three-dimensional CNN-based classifier [
26].
As Hu demonstrated that the same label can be applied to all slices of a CT scan. This allowed them to develop a comprehensive model that employed intermediate CNN layers for identifying classification characteristics. Final decisions are made by combining these features. Based on the three-way classification proposed by the researchers, their proposed method achieved an overall accuracy of 87.4 because each volume of the CT scan contains many slices without any visible infection area, and utilizing patient-level labels for all slices is unreasonable and will add errors to the system [
35].
As described by Pathak, the proposed system is considered a pre-proposed transfer learning method for the detection of COVID-19 in CT scans. A 2D convolutional neural network was used to classify CT images using the ResNet50 algorithm. A 10-fold cross-validation procedure was used on 413 images of COVID-19 and 439 images of non-COVID-19, and the proposed system performed with an accuracy of 93.01% [
9].
To classify 150 COVID-19 and non-COVID-19 images, Barstugan used machine learning algorithms instead of deep learning approaches. A support vector machine was employed to classify the extracted features, using several feature extraction methods such as the grey-level size zone matrix (GLSZM) and the discrete wavelet transform (DWT). Two, five, and ten folds of cross-validation were conducted in the experiments. As a result of the use of the GLSZM feature extraction method, an accuracy rate of 99.68% was achieved [
36].
According to Nayak et al., their proposed model was evaluated using two larger datasets of chest X-ray images. Dataset-1 consisted of 2250 images, while Dataset-2 contained 15,999 images. The classification accuracy achieved by the model was 98.67% for Dataset-1 in the multi-class classification case and 99.00% in the binary classification case. For Dataset-2, the model achieved an accuracy of 95.67% in the multi-class classification and 96.25% in the binary classification. The performance of the proposed model was compared with four contemporary pre-trained convolutional neural network (CNN) models as well as state-of-the-art models. Additionally, the study investigated the impact of various hyperparameters such as different optimization techniques, batch size, and learning rate. One advantage of the proposed model is its ability to achieve high accuracy while demanding fewer parameters and requiring less memory space compared to other models [
19].
Silva et al. introduced an efficient deep learning technique for COVID-19 screening, incorporating a voting-based approach. The proposed method involves classifying images from a given patient into groups using a voting system. The approach was evaluated on the two largest datasets available for COVID-19 CT analysis, with a patient-based split to ensure accurate testing. Additionally, a cross-dataset study was conducted to evaluate the models’ robustness in scenarios where data is sourced from different distributions. The cross-dataset analysis revealed that the generalization capability of deep learning models for this task is considerably inadequate. The accuracy dropped significantly from 87.68% to 56.16% in the best evaluation scenario, indicating a significant decrease in performance when applied to datasets from different distributions. This highlights the challenges in achieving robust and accurate results when deploying deep learning models in scenarios with varying data sources [
37].
Compared with RT-PCR testing mechanisms, radiographic patterns on computed tomography (CT) chest scanning models provide superior sensitivity and specificity. Furthermore, a variety of methods have been developed to make use of CT and X-ray image datasets for the implementation of automated classifications. The results of the study demonstrate that CT and RT-PCR can be complementary in predicting COVID-19. CT features act as instant diagnostic indicators, while RT-PCR is used to confirm the diagnosis. Additionally, it is necessary to differentiate COVID-19 from other pneumonia infections in CT chest screening by leveraging the detective capabilities of artificial intelligence (AI). A deep learning (DL) method is particularly effective in separating COVID-19 cases from other types of pneumonia [
38].
The Kassani study used several pre-trained networks to extract the features of images in the publicly available dataset so that COVID-19 could be differentiated from normal cases. The networks used were MobileNet, DenseNet, Xception, InceptionV3, InceptionResNetV2, and ResNet. After feature extraction, a series of machine learning algorithms were applied, including a decision tree, random forest, XGBoost, AdaBoost, Bagging, and LightGBM. Kassani concluded that the Bagging classifier produces the most accurate results based on features extracted from the pre-trained network DESNSEA121, with an accuracy of 99.00% [
39].
Kogilavani et al. conducted a study where they utilized deep learning techniques to detect COVID-19 patients through the analysis of CT scans. Their research focused on developing deep learning methods specifically designed for COVID-19 detection. Several convolutional neural network (CNN) architectures, namely, VGG16, DenseNet121, MobileNet, NASNet, Xception, and EfficientNet, were employed in their study. The dataset consisted of a total of 3873 CT scans, encompassing both “COVID-19” and “Non-COVID-19” cases. Separate datasets were allocated for the validation and test phases. The obtained accuracy rates for the different CNN architectures were as follows: VGG16 achieved an accuracy of 96.68%, DenseNet121 achieved 97.53%, MobileNet achieved 96.38%, NASNet achieved 89.51%, Xception achieved 92.47%, and EfficientNet achieved 80.19%. The analysis of the results demonstrated that the VGG16 architecture exhibited superior accuracy compared to the other architectures [
40].
Ruano et al. conducted a study where they utilized two datasets for their analysis: SARS-CoV-2 CT Scan (Set-1) and FOSCAL clinic’s dataset (Set-2). To leverage the power of deep learning, they employed supervised learning models that were pre-trained on natural image data. These models were then fine-tuned using a transfer learning approach. The deep classification was carried out using two methods: (a) an end-to-end deep learning approach; (b) random forest and support vector machine classifiers, where the deep representation embedding vectors were fed into these classifiers. For Set-1, the end-to-end deep learning approach achieved an average accuracy of 92.33%, with a precision of 89.70%. In the case of Set-2, the end-to-end approach achieved an average accuracy of 96.99%, with a precision of 96.62%. On the other hand, when utilizing deep feature embedding with a support vector machine, the average accuracy for Set-1 was 91.40%, with a precision of 95.77%. For Set-2, the average accuracy reached 96.00%, with a precision of 94.74% [
41].
According to Peng et al., their study involved the utilization of three existing COVID-19-related CT image datasets, which were combined to form a larger integrated dataset. The weights of DenseNet, Swin Transformer, and RegNet were pretrained on the ImageNet dataset using transfer learning. Subsequently, these models were further trained on the integrated dataset comprising COVID-19 CT images. The classification results were obtained by aggregating the predictions from the three models using the soft voting approach. The proposed model, called DeepDSR, was compared to three state-of-the-art deep learning models (EfficientNetV2, ResNet, and Vision Transformer) as well as the individual models (DenseNet, Swin Transformer, and RegNet) for both binary and three-class classification problems. The results demonstrated that DeepDSR achieved the highest precision of 98.33%, recall of 98.95%, accuracy of 98.94%, F1-score of 98.64%, AUC of 99.91%, and AUPR of 0.9986 in the binary classification problem, significantly surpassing other methods. Furthermore, DeepDSR attained the best precision of 97.40%, recall of 96.53%, accuracy of 97.37%, and F1-score of 0.9695 in the three-class classification problem [
17].
3. Materials and Methods
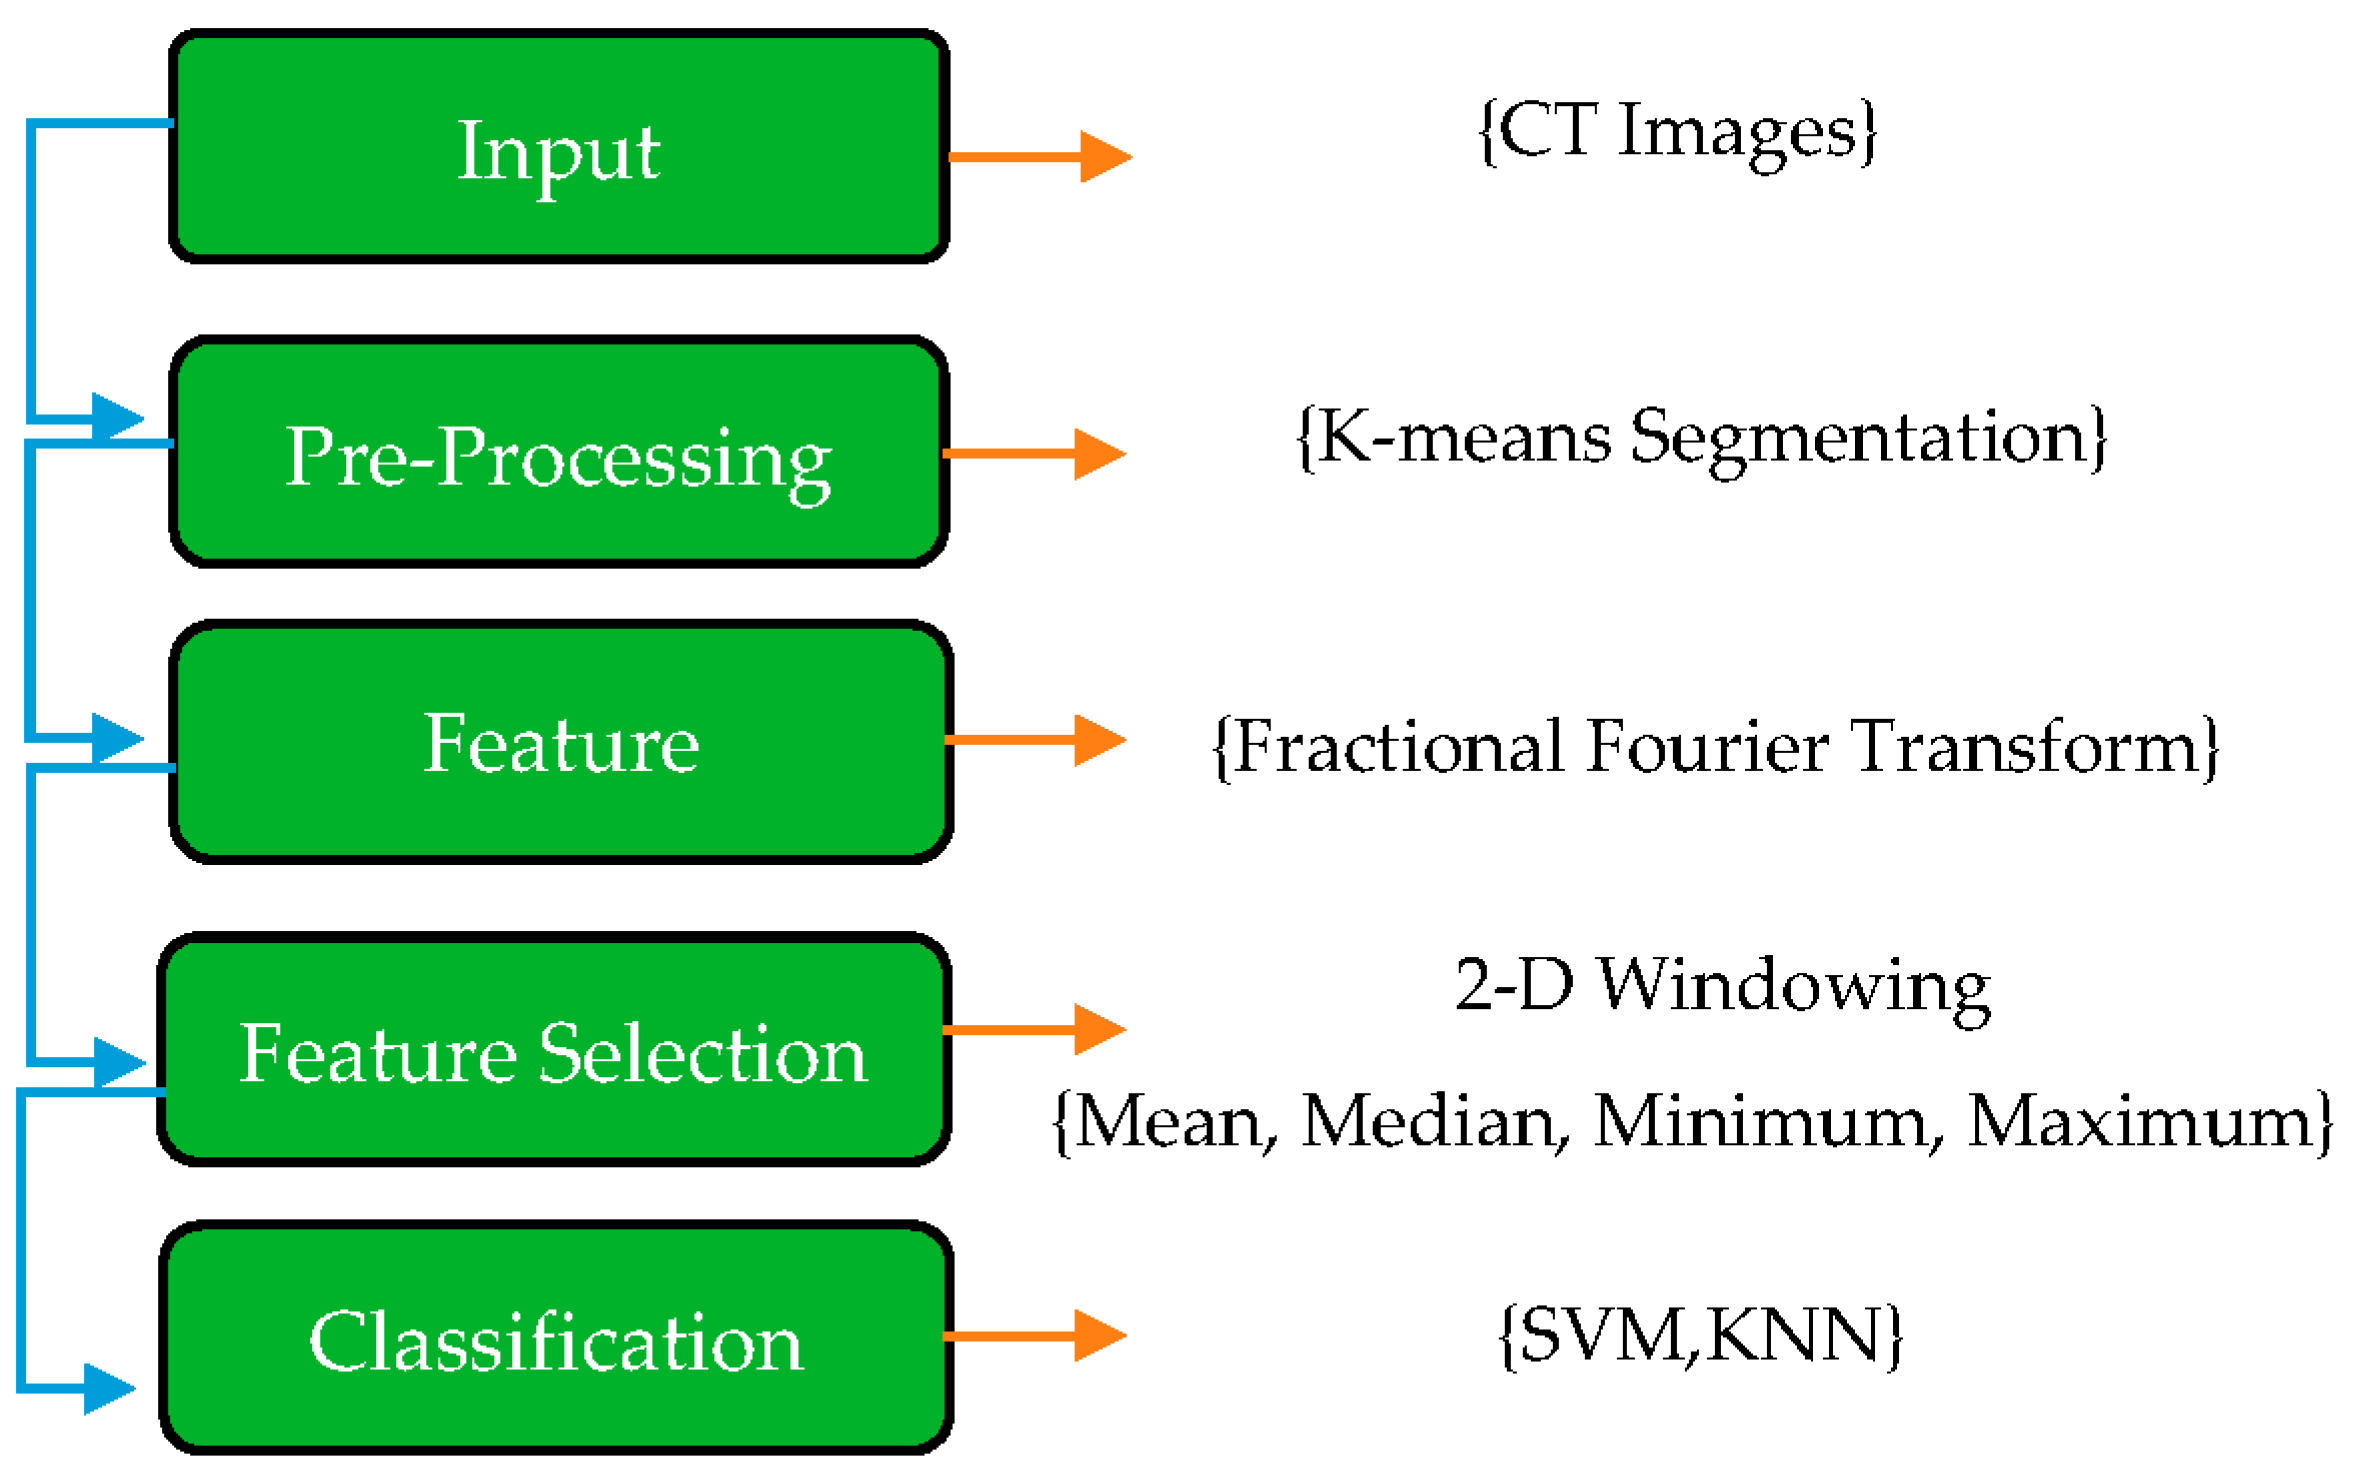
In this paper, the first step of the proposed method is explaining the COVID-19 dataset. In this case, the images were in png format and did not require any filtering or normalization. Once all images have been resized to 200 × 200 pixels, K-means segmentation is applied to the images to remove any non-lung parts from the images. As a result of this, FrFT coefficients are used for feature extraction with diverse fractional orders. Real, absolute, imaginary, and phase components of the complex coefficients are computed as part of the equation for the complex coefficients. Next, a novel method called adjacent rectangular windows is applied to determine which features will produce the best results. The coefficients of a 2D window containing coefficients were calculated based on the maximum, minimum, median, and mean values. In the end, K’s nearest neighbors (KNN) and support vector machines (SVM) were applied to classify the images with the most accurate features extracted by the windowing method.
These various stages are applied to achieve the best accuracy and separate COVID-19 from non-COVID-19. The structure of each step is shown in
Figure 1.
3.1. Database
The suggested dataset (SARS-CoV-2) contains 2481 CT images shared among 1252 patients infected with COVID-19; and 1229 CT scans for non-COVID-19 patients that have other pulmonary diseases. Data were gathered from hospitals in Sao Paulo, Brazil. In this case, the data consist of 60 patients infected with coronavirus; 28 of them were female, and 32 were male [
42]. The size of the images in this database was different; the size of all the images equalized before the pre-processing stage (
Figure 2). The dimensions of the images vary; for example, the smallest size recorded in the database is 104 × 153, while the largest size is 484 × 416.
Figure 3 displays several instances of CT scans from both SARS-CoV-2-infected and non-infected patients, which form part of the dataset.
3.2. Pre-Processing
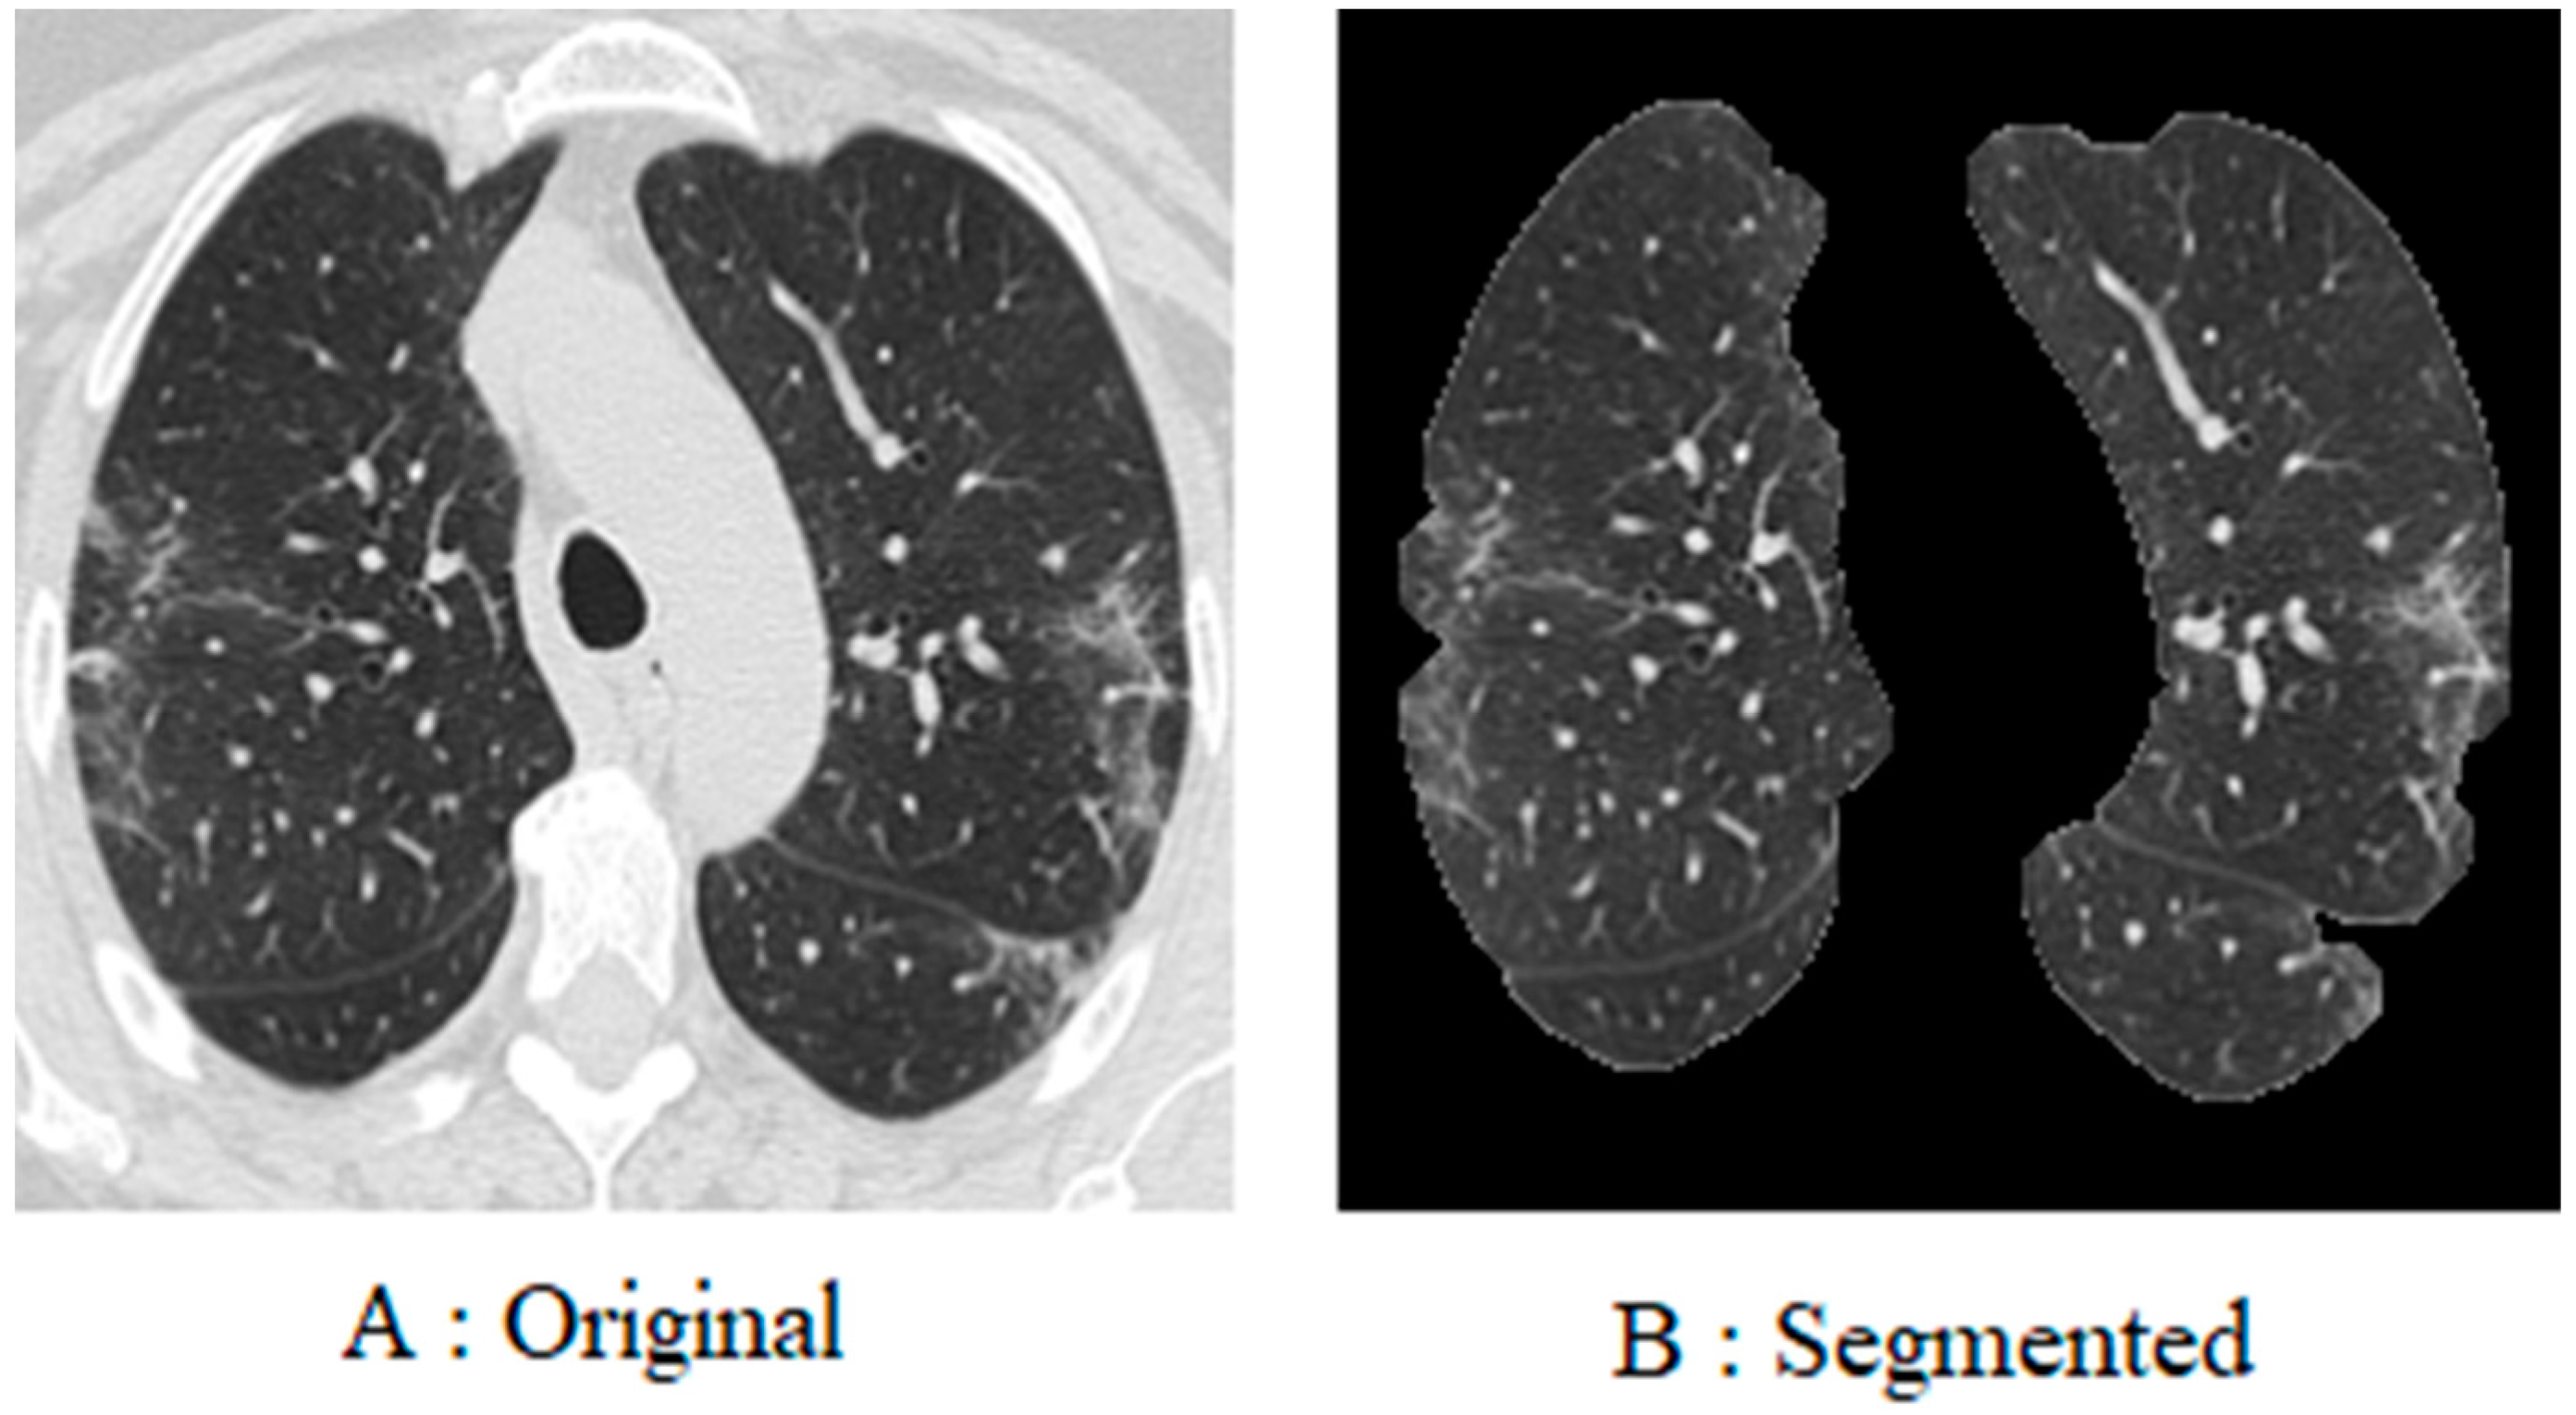
To begin with, every image in the database was resized to 200 × 200 pixels. This is due to the fact that the images in the database are of different sizes, and each image has a different number of pixels. Furthermore, since coronavirus is a lung disease, it is imperative to distinguish lung areas from other body parts. In other regions of the image, white borders can be seen that were derived from the original image using K-means segmentation and morphological methods. The lung image is illustrated in
Figure 4, following the application of the pre-processing method.
3.3. Fractional Fourier Transform
An alternative to the traditional Fourier transform (FT) is the fractional Fourier transform (FrFT), which extends the FT to the entire time-frequency domain using fractional powers of the Fourier operator. As a generalization of the FT, the FrFT adds an extra parameter related to the rotation of the signal in the time-frequency domain. A chirp function basis is used in such a scheme to decompose the temporal signal. Thus, the FrFT provides a unified time-frequency representation of the signal with a higher time-frequency resolution than other techniques [
43]. Numerous applications of the FrFT can be found in quantum mechanics, optics, and signal and image processing. Scholars believe that the extracted features must excellently separate the desired output classes.
The extracting features can be applied in frequency, time, and time-frequency domains based on the paper’s purpose. In this paper, FrFT is used for feature extraction. In 1980, Namias offered this operative to explain Hamilton’s second-order function in quantum-mechanical systems [
23]. After that, Several researchers contributed to its development in numerous applications, such as mathematic approaches to the matrix in image processing and swept-frequency filters [
7].
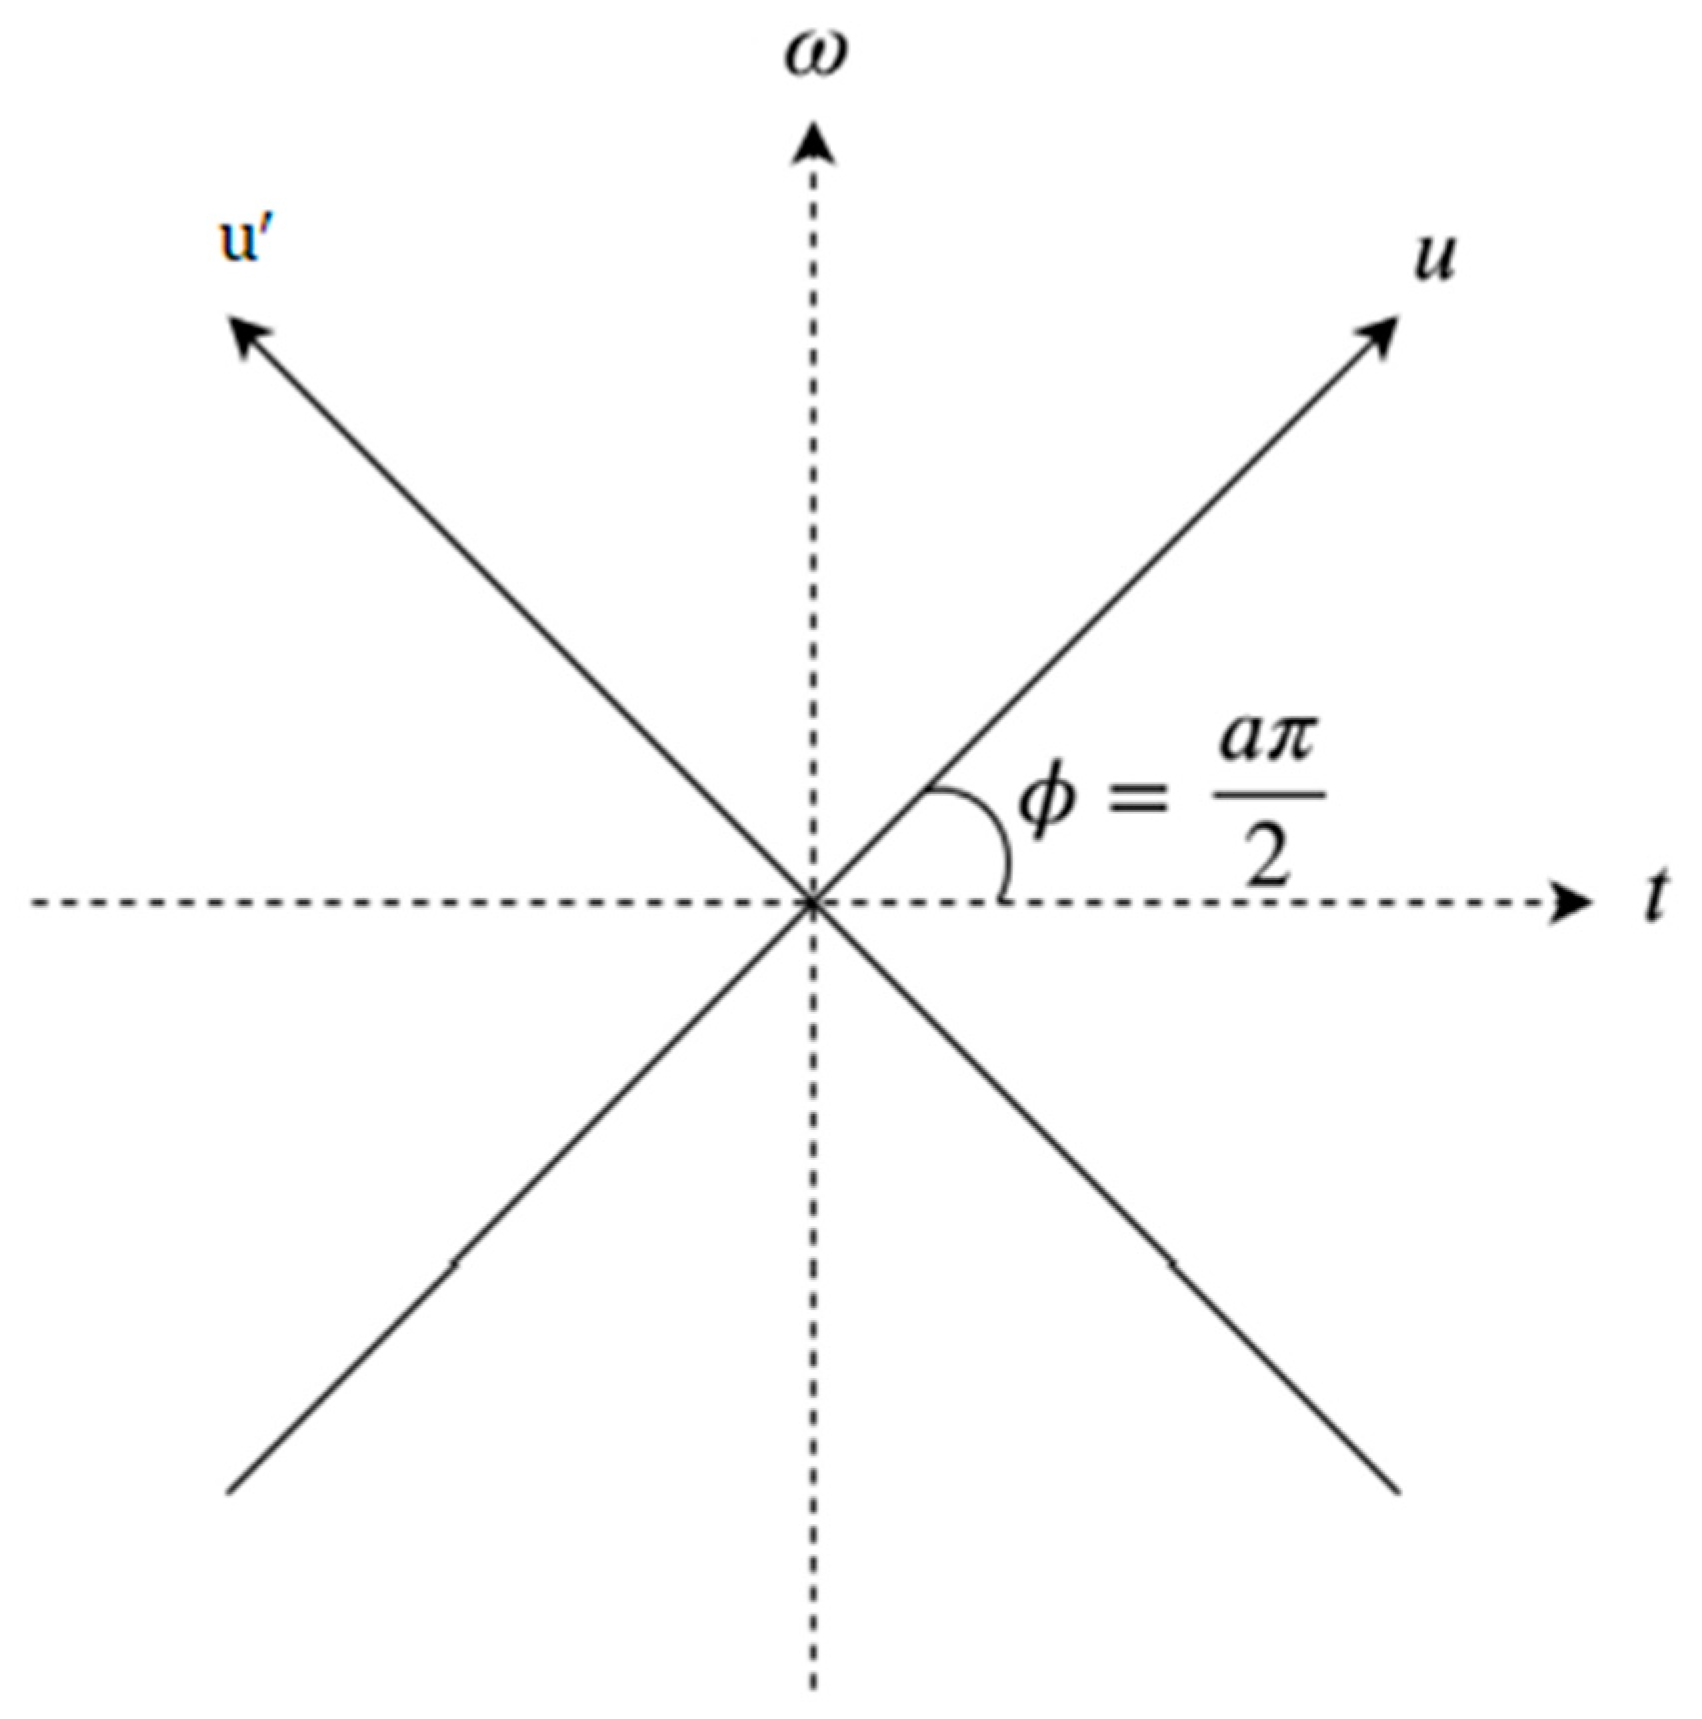
In addition to being a linear transformation, FrFT is a generalization format of the normal Fourier transform that includes a specific order parameter α that varies from zero to one (
; FrFT is illustrated in
Figure 5. There is no way of determining the most acceptable value of α to provide accurate data analysis. While α = 1, the fractional Fourier transform behaves similarly to a conventional Fourier transform. FrFT can be used in several techniques, for instance, the rotation of a function in the time-frequency domain, fractional powers of the Fourier transform, and differential equations [
25]. Accordingly, the linear integral transform explanation was used as the most direct and concrete explanation based on the linear transform explanation for computing. The function usually be represented as
.
where
a is the number of rotations on the interval 0 ≤ |
a| ≤ 2 and
is the kernel, which is symmetric and has the following explanation when
.
The kernel is
δ(
u −
) when α = 2 nπ, and the kernel function utilizied is represented by
δ(
u +
), where α + π = 2 nπ [
43].
Determining the appropriate alpha value is one of the challenges of this project, which uses fractional Fourier transform to extract features. The coefficients of the fractional Fourier transform are obtained after applying the fractional Fourier transform to extract features. It is very important to note that these coefficients are complex numbers. The concept of real and imaginary parts, absolute value, and phase are all included. We have separated and processed each of these components separately in the course of this research.
3.4. Feature Extraction and Selection
A subset of features can be derived in two ways: by feature extraction and selection. Feature extraction involves the process of extracting specific properties or characteristics from a dataset, typically with a certain level of detail or resolution. On the other hand, feature selection refers to the act of choosing or selecting a subset of features from the original feature set, often based on certain criteria or algorithms. Feature separation is impossible when a quality strongly correlates with the feature set. In some cases, a part may play a role in classification accuracy despite poor relevance [
13]. According to Heisenberg’s uncertainty principle, the accuracy of time and frequency measurements cannot be increased simultaneously. In this way, by increasing the accuracy in the time domain, the accuracy of the work in the frequency domain decreases.
In the same way, if the accuracy in the frequency domain increases, the accuracy in the time domain decreases. Frequency in biological signals at different times can have very different meanings. This limitation can be used in image and signal processing. Frequency domain transformations encompass various techniques, such as the fractional Fourier transform, fractional S Transform, and fractional wavelet transform, which involve manipulating signals in the frequency domain. In this paper, after extracting the feature, due to the large volume of features extracted by fractional Fourier transform, we needed to select the feature and reduce its values. As shown in
Figure 6, the proposed method is outlined step by step. A novel windowing method was used to reduce features. As a result of the pre-processing method, each image is converted to 200 by 200 pixels. The feature extraction process resulted in the extraction of 40,000 features. The number of features needed to be reduced. The features were reduced using two-dimensional windows. First, one-dimensional vector features were reconstructed into a two-dimensional matrix of 200 × 200 features. To reduce the features, a two-dimensional transition window was used. These images were scaled according to the proportions of 10 × 10, 20 × 20, to 100 × 100. In the case of a 10 × 10 window, the number of features decrease from 40,000 to 200. In the case of a 100 × 100 window, the number of features decrease from 40,000 to 20. After applying the windowing, the statistical methods of mean, median, minimum, and maximum were used.
3.5. Classification
As a result of image processing after feature extraction, the most practical features to use for classification consist of identifying COVID-19 in each image. In this paper (KNN) K-nearest neighbor and the support vector machine (SVM) are used for classification.
KNN is one of the most popular classifiers in pattern recognition. It is a popular method for supervised binary classification and two-class learning, which can be used for machine learning. This classifier is designed to distinguish classes based on the detection of hyperplanes. SVM is designed to identify distinct classes of data points by finding hyperplanes in an N-dimensional space. SVM measures the margin distance between data points of the two classes. This is because there are several options for choosing the hyperplane. This margin should be maximized to provide a clear decision boundary for classifying future data points [
29].
Data are divided into two groups using the Holdout method: train and test. Several possible divisions exist, such as 40/60, 30/70, or 20/80. Therefore, training is conducted on training data, and evaluation is performed on test data to produce the desired model. This method is called Holdout validation. If the number of classes in the test and train groups does not match, the Holdout method will not be able to train the model correctly. Consequently, both the training and test groups must have the same distribution of classes. Classification is based on the division 10/90 in this project.
This method compares the training group to a test group based on similarity. The distance between the entered new sample and all training samples can then be calculated, and the K-nearest model will be chosen to classify the updated sample. After organizing non-COVID-19 and COVID-19 subjects, nominated features were classified with various properties for the train and test stage. The primary step was to allocate 10% of non-COVID-19 and the remaining for the test stage. Then, the amount of training is reduced to 10%. The performance of the suggested method is evaluated using specificity, accuracy, sensitivity, and precision, which are defined as follows:
: true negative, : true negative, : false positive, : false negative
The performance has been stated with the performance factors via two classifiers.
4. Results
After extracting features, such as the derived phase, imaginary, real, and absolute value, a classification procedure was used. The fractional order of 0.8 and 0.7 had been achieved for the KNN and SVM classifiers, respectively. This order was achieved by trial and error; unfortunately, there are not any other techniques to determine this order. This study used the 2D windowing method to select features, and the derivative calculated the difference in features. This operator is used to convert the feature matrix into a new space, with significantly promising results. The declared average value is the average taken from the indicators (specificity, accuracy, precision, and sensitivity).
To evaluate its performance, different features of the proposed technique are examined in
Figure 7, such as the absolute, real, imaginary, and phase coefficients.
Figure 7 shows that the best coefficient for KNN is determined based on phase, while the best coefficient for SVM is determined based on absolute value. The average value used in all stages is calculated by considering the average value of all indicators in the real and imaginary parts, as well as the phase and amplitude parts. Based on the results depicted in the figure, the optimal alpha value for KNN classification is determined to be 0.8, while for SVM classification, it is obtained from 0.7.
At the end of the process, the features are classified. It was necessary to preprocess images before FrFT to determine the best fractional order. Each coefficient was used to specify the optimal characteristics for each step.
Figure 8 shows the most accurate K-neighbor (1–9) value for KNN classifiers. With 99.80% accuracy, the best K-neighbor value is achieved at k = 1. The best features were selected, illustrated in 90% of the training and one neighborhood by using a 2D window (including mean, median, maximum, and minimum coefficients) with different dimensions. As an important point to note, FrFT with 0.8 and 0.7 fractional orders may provide more accurate results than FrFT with other fractional orders for KNN and SVM classifiers. This applies specifically when
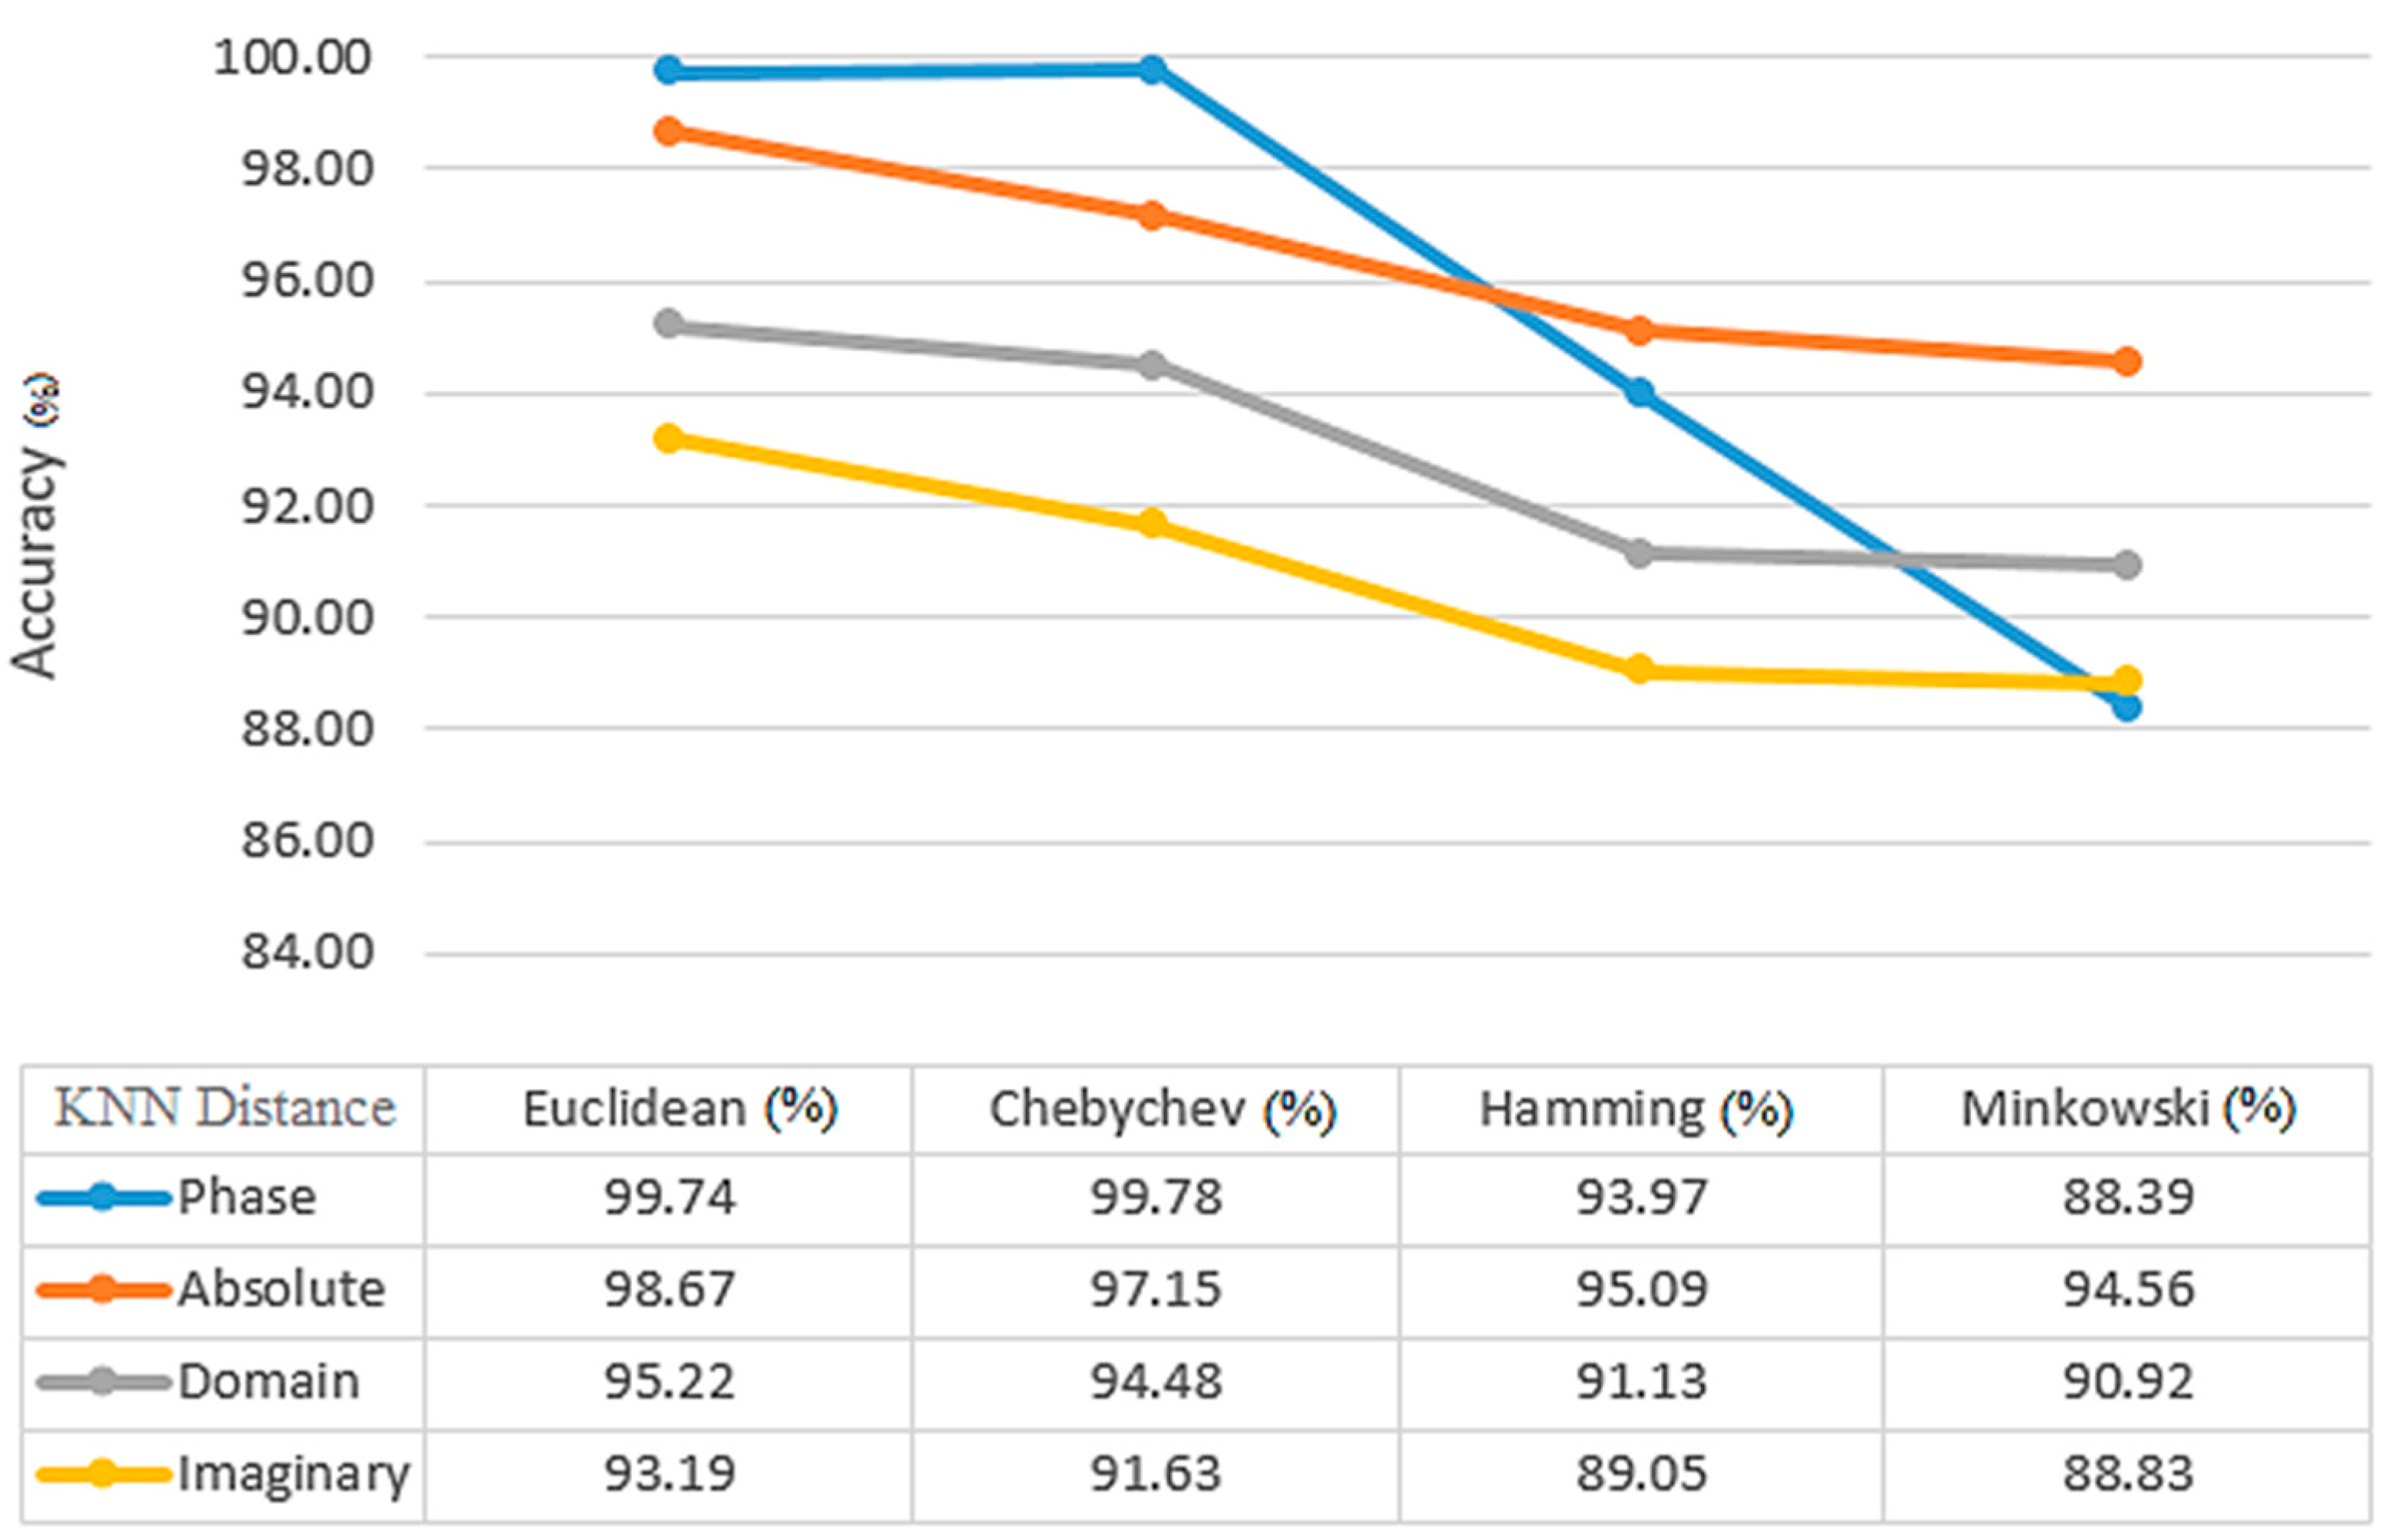
= 1, which is equivalent to FT. From
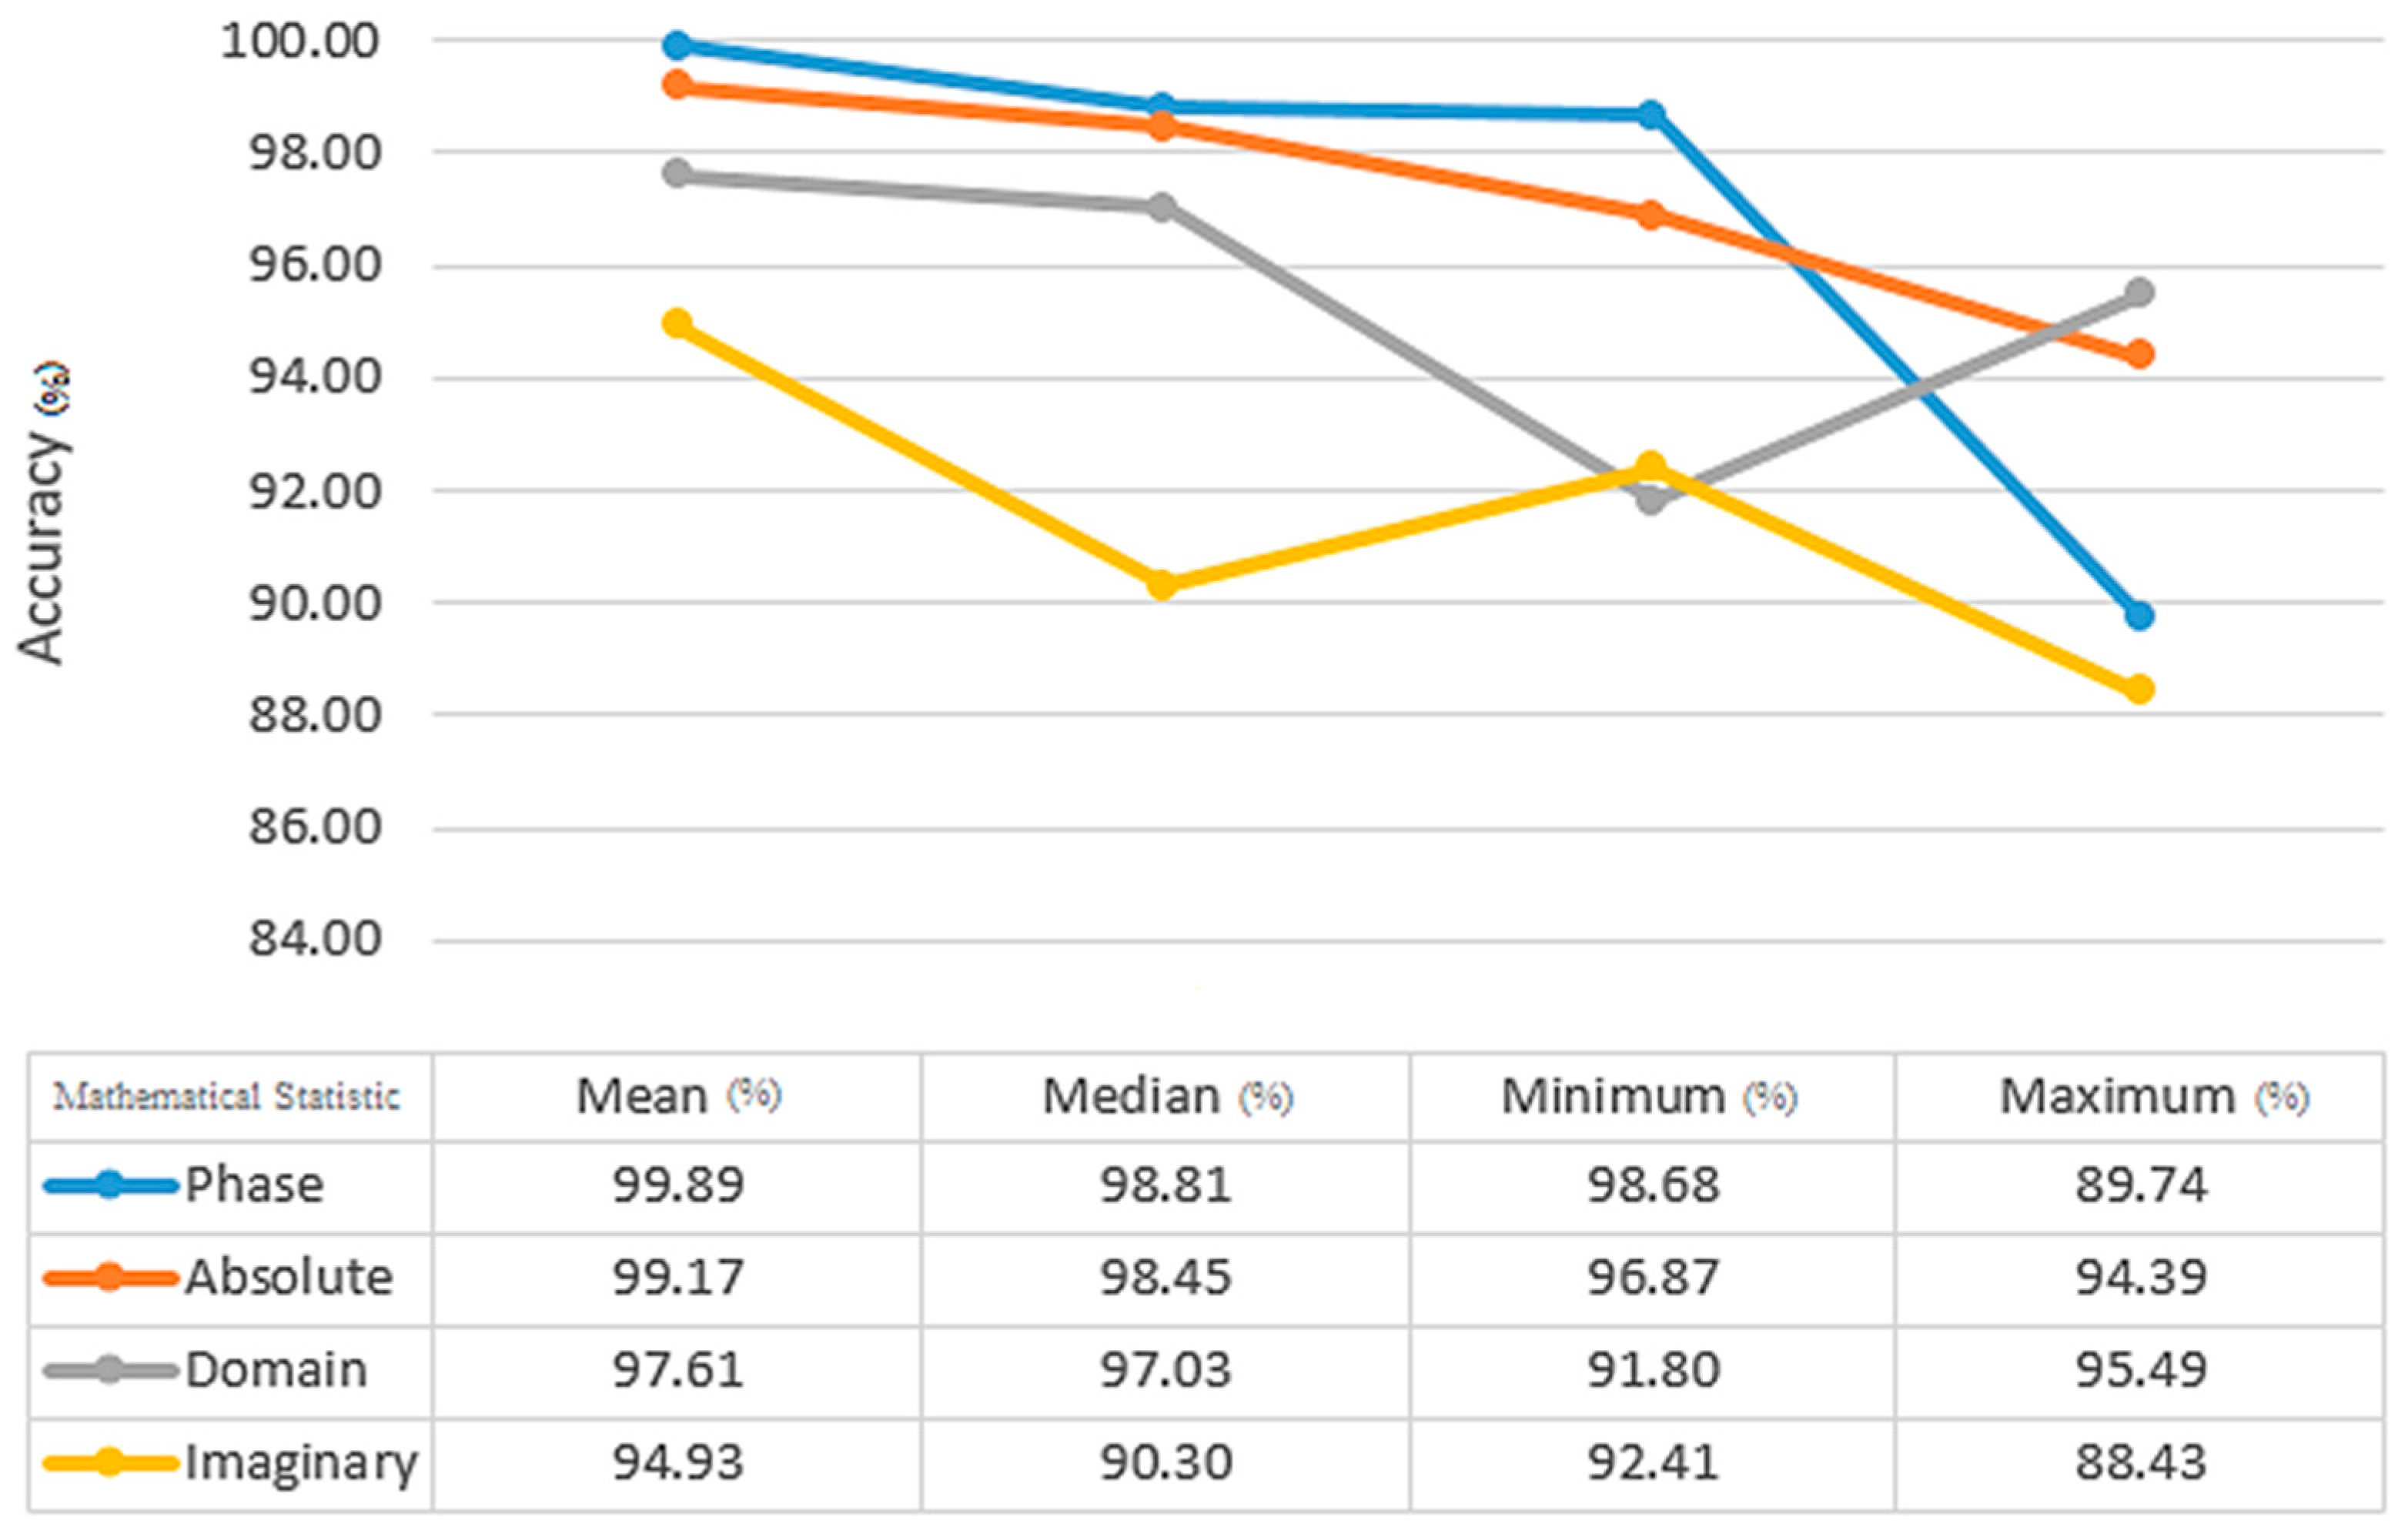
Figure 9, the Euclidean distance between Chebyshev, Hamming, and Minkowski classifiers yields the highest average and accuracy with 99.74% and 99.09%, respectively, for the KNN classifier. In comparison to the other training results for the KNN classifier, 90% of the training results have higher accuracy than the others. Median, maximum, and minimum, when compared by the mean static method, have an accuracy and average of all indicators of 99.89% and 93.96%, respectively (
Figure 10).
Among the most significant parameters involved in SVM classification is the selection of the appropriate kernel.
Table 1 shows that the polynomial kernel, the most accurate one, achieves 99.90% and 97.49%, respectively, at both the average and accuracy levels of SVM kernels. There is a significant difference between 90% of the training results for the SVM classifier that are more accurate in comparison to the rest of the results. As a result of using the median static method between mean, maximum, and minimum, the accuracy and average of all indicators were 99.89% and 93.96%, respectively (
Table 2).
After the classification step, the following steps determine an appropriate number of optimal features. The first objective was to determine what was the average performance of classifiers across all criteria. Afterward, it was determined which features resulted in the highest level of accuracy. According to these findings, 80 and 200 features are appropriate for the detection of COVID-19 using KNN and SVM classifiers. With the use of KNN and SVM classifiers,
Figure 11 displays the average accuracy of each feature. In addition, by utilizing KNN and SVM classifiers, the average accuracy achieved is approximately 95.05% and 99.90%, respectively.
5. Discussion
As a result of this experiment, it appears that fractional Fourier transforms can produce increasingly good results when used in conjunction with CT images for classification. The results presented in this paper were produced by following some steps to be as reliable as possible. To sum up, in the beginning, only lung parts were segmented from the dataset. A large feature plane was constructed using 40,000 features extracted from the fractional Fourier transform coefficients based on the size of each image (200 × 200). An innovative method, including 2D windowing, was used to select the best features. We used a 2D window with different dimensions to calculate the mean, median, maximum, and minimum coefficients. Consequently, the number of features decreased from 40,000 to 80 for KNN and 200 for SVM. The KNN and SVM classifiers yielded the most optimal outcomes. With 90% training (the training dataset is completely different from the test dataset) and k = 1, Euclidean distance for KNN, and polynomial kernel for SVM classifiers, they were able to accomplish this objective. All four coefficients, real, absolute, imaginary, and phase, were extracted as different features in each step.
A review of previous works reveals that all used CT scan images and employed supervised and unsupervised classification methods and deep learning. A clear comparison between the results of the proposed method and those of traditional methods can be achieved by comparing the results of the proposed method to those of traditional methods, such as those shown in
Table 3. To obtain a reliable comparison, the conditions of the experiments should be similar. Accordingly, it is impossible to recommend one study over another. Taking a quick look at the information, the fractional Fourier transform method is found to be a sufficient method for extracting features. There are many advantages to using the fractional Fourier transform. These include its coefficients, which are the same characteristics that were examined in this study. Mixture coefficients provide both amplitude and phase as well as the absolute value and imaginary part. They are much simpler and faster than the methods currently being used. The 2D windowing method is used in this research to reduce features. This innovative method is also fast and reliable and relies on simple mathematical Algorithms like minimum and maximum have shown effective outcomes in accurately classifying between COVID-19 and non-COVID-19 cases. Despite the time-consuming nature commonly associated with 2D fractional Fourier transform, it can still be considered as a potential method for feature extraction in future applications, taking into account certain limitations.


