
Microbiogeochemical Traits to Identify Nitrogen Hotspots in Permafrost Regions
by
 , and
, and
Claudia Fiencke
1,2,*, 
Maija E. Marushchak
3,
Tina Sanders
4,
Rica Wegner
1,† and
Christian Beer
1,2 1
Department of Earth System Sciences, Faculty of Mathematics, Informatics and Natural Sciences (MIN), Institute of Soil Science, Universität Hamburg, Allende-Platz 2, 20146 Hamburg, Germany
2
Center for Earth System Research and Sustainability, Universität Hamburg, Allende-Platz 2, 20146 Hamburg, Germany
3
Department of Environmental and Biological Sciences, University of Eastern Finland, P.O. Box 1627, 70211 Kuopio, Finland
4
Institute for Carbon Cycles, Helmholtz-Zentrum Hereon, Max-Plank-Straße 1, 21502 Geesthacht, Germany
*
Author to whom correspondence should be addressed.
†
Present Address: Department for Environmental Science (ACES), Stockholm University, 10691 Stockholm, Sweden.
Nitrogen 2022, 3(3), 458-501; https://doi.org/10.3390/nitrogen3030031
Submission received: 30 June 2022
/
Revised: 29 July 2022
/
Accepted: 4 August 2022
/
Published: 12 August 2022
(This article belongs to the Special Issue Nitrogen Cycling in Permafrost Soils)
Abstract
:Permafrost-affected tundra soils are large carbon (C) and nitrogen (N) reservoirs. However, N is largely bound in soil organic matter (SOM), and ecosystems generally have low N availability. Therefore, microbial induced N-cycling processes and N losses were considered negligible. Recent studies show that microbial N processing rates, inorganic N availability, and lateral N losses from thawing permafrost increase when vegetation cover is disturbed, resulting in reduced N uptake or increased N input from thawing permafrost. In this review, we describe currently known N hotspots, particularly bare patches in permafrost peatland or permafrost soils affected by thermokarst, and their microbiogeochemical characteristics, and present evidence for previously unrecorded N hotspots in the tundra. We summarize the current understanding of microbial N cycling processes that promote the release of the potent greenhouse gas (GHG) nitrous oxide (N2O) and the translocation of inorganic N from terrestrial into aquatic ecosystems. We suggest that certain soil characteristics and microbial traits can be used as indicators of N availability and N losses. Identifying N hotspots in permafrost soils is key to assessing the potential for N release from permafrost-affected soils under global warming, as well as the impact of increased N availability on emissions of carbon-containing GHGs.
1. Introduction
Permafrost-ground that remains frozen continuously for at least two years, lies mainly under about 13–18 million km2 (9–14%) of the land surface in the Northern Hemisphere and smaller portions in the alpine and ice-free regions of Antarctica [1,2,3,4,5]. Based on the spatial extent of permafrost, regions are divided into continuous (90–100%), discontinuous (50–90%), sporadic (10–50%), or isolated (0–10%) permafrost zones [6] (Figure 1). A variety of Arctic terrestrial ecosystem types is subdivided according to the composition of the vegetation and the depth of organic layer [1,7,8,9]. These ecosystems are dry and wet tundra with a thin organic layer (<40 cm); two peatland ecosystems with a thick organic layer (>40 cm): ombrothrophic bogs (including uplifted palsas and peat plateaus) and minerotrophic fens; and upland forests and littoral ecosystems where permafrost is not always present [9,10,11]. Permafrost-affected soils are characterized by low temperatures (mean annual temperature < 0 °C) and often high soil moisture [8]. Soils are usually divided into three layers: (1) the active layer (AL), the upper part of the soil, that is subject to seasonal freezing-thawing cycles, (2) the permafrost layer (PL), which remains constantly frozen throughout the year, and (3) a transition zone (TZ, [11,12]). The permafrost table acts as a water barrier, significantly affecting redox conditions [13]. Due to the heterogeneity of topography and hydrological conditions, vegetation types, and soil physicochemical properties (including SOM quantity and quality), (sub)Arctic tundra environments exhibit high small-scale variability [8,11,14,15,16,17,18,19,20,21,22]. In terms of seasonal dynamics, permafrost soil ecosystems differ from those at lower latitudes due to long winters, a strong influence of snow cover on soil temperature and moisture, repeated freeze-thaw cycles in spring and fall, and short growing seasons. Therefore, theses soils are subject to strong temporal and spatial dynamics that affect the availability of nutrients [23,24,25,26,27,28,29,30].
Low temperatures, cryoturbation, i.e., the mixing of soil by repeated freeze-thaw cycles, and poor soil drainage result in slow decomposition, and thus the net sequestration of organic carbon in permafrost-affected soils [12,32]. Consequently, permafrost soils store a large amount of organic nitrogen [33] and carbon (1014 Pg C, depth 0 to 3 m, northern circumpolar and Tibetan permafrost regions [34]). The actual N pool is much larger than current estimates of 0.9–2.2 (6.0) kg N m−2 in the first meter of soil [35,36,37,38,39], and 67 Pg N within in the first 3 m for the northern permafrost region [37]. Because of the highly variable C/N ratios in northern circumpolar soils [35,38,39,40] with the majority of soils ranging from 10–50 [21], the actual N stock is uncertain and could be twice as high as calculated [37] especially for the thermokarst-influenced Yedoma—ice-rich Pleistocene sediments—landscapes [39,41,42]. Recent studies on Yedoma permafrost estimated total N stocks in permafrost to be as high as 97 Pg N at depths to more than 3 m [42]. However, most of the nitrogen is firmly bound in soil organic matter (SOM) by tight N mineralization-immobilization-turnover (MIT) or in the perennially frozen ground, therefore tundra ecosystems are generally described as severely N-limited [30,43,44,45,46,47,48,49,50,51,52,53,54,55,56]. Nitrogen limitation is enhanced by low internal N inputs due to low or even negative net N mineralization rates, including ammonification and nitrification under cold and wet conditions (summarized in [53,57,58,59]) and low external N inputs due to biological N fixation (20–2000 mg m−2 y−1, [53,59,60,61]) combined with low atmospheric N deposition (<200–300 mg m−2 y−1, [62,63]), and no external N fertilization. Recycled N accounts for over 95% in the Arctic tundra [47] and inhibited microbial inorganic N turnover [64,65]. Bioavailable dissolved inorganic N (DIN) concentrations are low and N processes are dominated by N immobilization indicating a tight N cycle in organic rich soils [47,64,66,67,68,69] due to strong competition between plants and microorganisms [65,70,71,72]. The inorganic N demand of plants could be compensated by using bioavailable dissolved organic N (DON) forms [23,65,73], which are mostly available in higher concentrations than DIN [23,71,74,75,76,77]. Although the N cycling of permafrost-affected soils is less open and N output is lower than in other ecosystems, the organic-only N cycling paradigm has recently been refuted [59] as gross N mineralization rates are higher than previously expected [15,51,78,79,80,81] and soils may be susceptible to lateral N losses [56,65,82].
In addition, advances in microbial gene abundance and activity surveys over the last two decades have shown that N cycling microbes can be very abundant in both the seasonally thawing active layer and the long-term frozen permafrost, and that microorganisms actively drive N cycling (recently reviewed in [58,59]). At the same time, there is increasing evidence that permafrost-affected soils represent an important source of the potent greenhouse gas (GHG) nitrous oxide (N2O) [82], a strong ozone-depleting gas and the third most important GHG with a global warming potential of 298 times higher than that of CO2 on a 100-year timescale [83]. Permafrost-affected soils release N2O, especially when N uptake by plants is low and soil water content is intermediate. According to a recent first-order estimate, permafrost-affected soils emit up to 20% of the global N2O emissions from natural soils [82]. In addition, hydrologic export of inorganic N from permafrost-affected soils may be high, which likely has strong impacts on aquatic ecosystems [84,85]. Nitrogen losses occur primarily in permafrost-affected soils disturbed by wind erosion, cryoturbation, or thermokarst, reducing N uptake by plants and increasing N inputs creating hotspots of high N availability [86,87,88]. Furthermore, the microbial N cycle and its effect on C cycle and GHG release are still subject to large uncertainties, although the contribution of permafrost soils to global N2O emission from pristine soils is high, and the effects of inorganic N availability on the C cycle in soils and adjacent aquatic ecosystems could have implications for the Earth’s GHG budget [47,50,52,55,89,90,91,92,93,94,95,96]. In the future, permafrost regions will be strongly affected by climate change, rising temperatures and changing soil moisture conditions [11,97,98], deepening of the active layer and thermokarst [5,99,100], which will affect microbial processes in these soils [101,102]. Increased N availability is expected due to thawing of permafrost containing large amount of inorganic N [42,75,76,103], increased microbial N mineralization [75,102,104], and expansion of disturbed areas known for high N losses [82]. Therefore, it is of great importance to better understand (1) the current pattern of N availability in permafrost-affected soils, (2) the underlying microbial driven N cycling, (3) the environmental controls that regulate the microbial formed N2O emission and inorganic N export to aquatic ecosystems.
In this review, we aim to highlight the hotspots of high N availability in permafrost-affected ecosystems, which can be identified by certain traits that correlate with high lateral and gaseous N losses. First, we provide an overview of the main microbial N transformation processes that are affected by N availability and largely determine N losses, in particular autotrophic nitrification and heterotrophic denitrification. In the main section, we describe the microbial N cycling and associated N-loss processes, particularly in the two best-described N hotspots in cryoturbation-affected soils, namely bare organic lowland soils in permafrost peatlands and disturbed mineral upland soils in hillslope thermokarst landscapes. In this section, we also present preliminary evidence of additional N hotspots in the tundra. Finally, we analyze how N hotspots interact with climate change and carbon-relevant GHGs, and provide an outlook for future research. Hypotheses are:
- Permafrost-affected soils are not generally N-limited, but there are N hotspots of N availability with more open N cycling and increased potential for N losses in the form of inorganic N leaching and N2O emissions.
- N hotspots can be identified by certain soil characteristics and microbial traits: different N forms, microbial net N turnover rates, especially N mineralization, nitrification and denitrification, and abundance of key functional N cycling genes.
2. Regulation of N Availability by Microbial N Processes in Permafrost-Affected Soils
2.1. Levels and Traits of N Availability
The N availability of an ecosystem can be described as a gradient from N limitation to N saturation, which is indicated by several traits and determines the potential of N losses due to the excess of inorganic N. Nitrogen availability is defined as high when N supply is greater than N demand [105]. The N limitation of primary production in tundra soils has been demonstrated by numerous fertilizer experiments in which mainly inorganic nitrogen was supplied (recently reviewed by), indicating that N is mainly limited as DIN. In permafrost-affected soils, the following parameters were mainly used individually or together as indicators for N availability: (1) N forms in the bulk soil, such as high total N content (TN) (as well as associated low C/N ratio), detectable dissolved organic and inorganic N forms (DON, DIN), a high ratio of DIN/DON and nitrate/ammonium [28,30,55,68,75,86,95,106,107,108,109,110,111] and high δ15N content [27,95,111,112,113,114,115], (2) vegetation parameters such as high total N and low C/N ratio, nitrate or δ15N content in foliage or litter [55,57,95,107,108,115,116,117], (3) high rates of microbial driven N processes: N mineralization (ammonification, and nitrification) [17,51,55,68,75,81,93,95,107,109,111,115,118] or (4) a high relative abundance of key functional genes encoding the enzymes responsible as an indirect indicator of these processes [20,87,95,109,118,119,120,121].
Using these N availability traits, we propose to divide the N availability of permafrost-affected soils into three levels based on the model of Schimel and Bennett [65] (Figure 2). These levels mainly characterize the ratio of N immobilization to N mobilization indicated by the content of different N forms and rates of net microbial N cycling processes. Unlike gross N cycling rates, these net N cycling rates do not reflect the total amount of N cycling, but rather how much N remains after N uptake by soil organisms and plants and incorporation into their biomass by anabolic processes for inorganic catabolic N cycling [122,123]. Arctic ecosystems are generally at the first level of N availability, the N limitation level where N immobilization dominates [65,122,124] (Figure 2I). Plants and microbes compete strongly for organic and inorganic N forms and therefore the N cycle is tightly closed. This level is characterized by mainly organic N forms as high DON content, high C/N ratio of bulk soil (>25), low detectable DIN mainly in form of ammonium and therefore a low DIN/DON or DIN/TN ratio. In addition, net depolymerization rates may be high, but N mineralization and nitrification rates are zero or even negative. Since the bulk C/N ratio of SOM poorly reflect the N availability to microorganisms (especially in mineral soils where SOM is mineral bound), the imbalance between bulk soil C/N and microbial biomass C/N could be better used as indicator [68,125]. For boreal peat soils, the C/N ratio was used as a predictor of N2O emissions, above a threshold of 25, emissions rapidly increase, and a similar threshold was demonstrated for permafrost peatlands [86,126]. Due to the high N immobilization rates, there is no excess of N surplus for net inorganic N turnover and therefore no N loss in form of DON, inorganic and N2O.
At the second level (intermediate N availability, Figure 2II), in addition to the high importance of organic N forms, the N cycle is more open than at the first level. At this N level, net N mineralization rates, particular ammonification rates and thus higher ammonium contents are detectable. Since low or no net nitrification rates occur, the inorganic N is only lost as ammonium at this level.
The third level, also referred as N hotspot (Figure 2III) is mainly characterized by low C/N ratio and high δ15N of bulk soil, low DOC and DON content, and high DIN/DON or DIN/TN ratio, and high inorganic N content with high nitrate/ammonium ratio. In addition, net inorganic N cycling process rates of nitrification under oxic and denitrification rates under anoxic conditions can be considered as indicator of N availability, as they are limited by low inorganic N availability in soils with tight N cycle. An intermediate soil moisture with a water-filled pore space (WFPS) of about 60% allows aerobic and anaerobic microbial N processes to occur simultaneously [127]. Besides process rates related to microbial activities, a high relative abundance of functional genes encoding the key enzymes of these processes can serve as an indicator. At the third level, N mobilization predominates over the N immobilization because N demand is lower, resulting in a more open N cycle that favors N leaching, mainly in the form of nitrate, and N losses in gaseous form. Both nitrification and denitrification produce nitric oxide (NO) and nitric acid (HONO), both important for atmospheric chemistry, the GHG N2O, and the atmospheric inert gas N2 through the complete denitrification process (reviewed in [128,129,130]).
2.2. Key Microbial N Processes Determining N Availability in Permafrost-Affected Soils
Because of the large stores of organic matter, permafrost-affected soils have a great abundance and diversity of distinct soil microbial communities in both the active layer and permafrost [131,132,133]. Although these organisms must cope with extreme cold and fluctuating temperatures, frequent freeze and thaw cycles, and frozen ground combined with low nutrient and liquid water availability, microbial communities are well adapted or highly resistant to these adverse conditions [101,134,135,136,137,138]. The abundance, richness, and evenness of communities generally decrease with soil depth [101,131,132,139,140,141,142,143], but there is still microbial activity at subzero temperatures and in the permafrost layer [101,144,145,146,147,148]. Microbial community composition varies geographically and at smaller scales, and microbes can survive and be activated even after thousands of years [132,134,149,150,151]. Despite these cold conditions, the enriched bacteria are mostly cold-adapted (psychrotolerant) rather than cold-favoring (psychrophilic) organisms [119,152,153,154,155]. In addition to spatial heterogeneity, microbial communities also exhibit a high degree of seasonal heterogeneity [28,156,157,158,159,160,161].
A complex network of metabolically versatile microorganism catalyzes various N processes in soils in general (reviewed, e.g., by [128]) as well as in permafrost-affected soils (reviewed, e.g., by [53,58,59]). The microbial composition and activities of N cycling microorganisms, together with organic matter quantity and quality, determine the N availability of soils. Although ammonification, the conversion of organic N to ammonium, and biological N fixation (BNF) are the major sources of internal and external nitrogen input to the soil system, we focus in this review on the major processes of inorganic nitrogen cycle. In particular, these are autotrophic nitrification and heterotrophic denitrification as key processes for the display and regulation of N availability, since both processes depend on reactive N, but are also responsible for N loss at the final level of N availability (Figure 2III). Aerobic autotrophic nitrification can be considered a bottleneck for N losses in permafrost-affected soils, as it is the main process that forms nitrate, which is important for plant nutrition [57] and allows lateral inorganic N loss in form of nitrate leaching and vertical losses through the formation of N gases. The role of heterotrophic nitrification, recently reviewed in soils in general [162], is rarely analyzed in permafrost-affected soils [163]. The nitrification process produces NO and N2O as a byproduct under oxygen-limited conditions [128,129] and is also the only process that provides the substrate for anaerobic heterotrophic denitrification (and the nitrification-denitrification process) [82,87]. Since nitrification is oxygen dependent and denitrification is inhibited by high oxygen concentration, the balance between the two processes and the ratio of N2O/NO is controlled by the water-filled pore space (WFPS) in soils [127]. At about 60% WFPS, both nitrification and denitrification processes can occur, and the N2O/NO ratio is about one with the highest soil N2O emission. At lower WFPS, nitrification forms N2O (40–60%) and NO (0–60%). At 60–80% WFPS, N2O and NO are formed, and at a WFPS above 80% (water saturation), only N2 is formed by a complete denitrification. In permafrost-affected soils, N2O emissions were observed at WFPS values of 60–70%, mainly associated with denitrification [82]. Not only oxygen content, but also other environmental parameters control N-cycle processes in controversial ways, e.g., SOM content [59,164,165].
2.2.1. Nitrification
Nitrification, the canonical oxidation of ammonia to nitrite (ammonia oxidation) and further to nitrate (nitrite oxidation) or the complete oxidation of ammonia to nitrate (comammox-process) is mostly carried out by specialized, obligate chemolithotrophic aerobic ammonia-oxidizing bacteria (AOB) and archaea (AOA) and nitrite-oxidizing bacteria (NOB) (reviewed e.g., by [128]) occupying different environmental niches [129,166]. Nitrifiers have been studied and detected in permafrost soils since the early 1990s, mostly using culture-dependent methods [167,168]. However, few nitrifiers were detected, and soils had little or no net nitrifying activity [14,15,169,170,171]. Only isolated sites had significantly higher cell counts and activities comparable to temperate soils [15,112,171]. High net nitrification and denitrification rates correlated with the δ15N value of the soils [112]. For a long time, extreme environmental conditions such as low pH and temperatures, high water levels associated with anoxic conditions, and low N availability were considered factors inhibiting nitrification in this habitat [64,172,173]. About a decade ago, metagenomic studies contributed significantly to the understanding of the functional capacity of nitrifiers in permafrost habitats [174]. Molecular-based methods enable the detection of ammonia-oxidizing bacteria, archaea and comammox by targeting, e.g., the 16S rRNA genes or the key functional enzyme of ammonia monooxygenase (amoA) [20,110,118,119,120,175,176,177,178,179,180,181,182] and nitrite oxidoreductase gene (nrx) for comammox and nitrite oxidizers [119,155,182]. Using these methods, nitrifying genes were found in the active layer of permafrost-affected soils in high abundance, comparable to other ecosystems, but with low diversity [120,174]. Nitrifiers have also been detected in frozen permafrost cores [101,150,174,183,184] with gene abundance increasing after thawing [185] but may have been lost in ice rich sediments (Yedoma, [87,186]).
As in temperate soils [129,187], AOB amoA could dominate in Arctic soils at neutral pH values [119,178], while in acid soils mainly AOA amoA was found [120,147,181] and some soils showed no correlation with the soil pH values [118]. At neutral alluvial soils with low SOM content, AOB were mainly represented by the genus Nitrosospira, with relative abundance of nitrifying taxa accounting for up to 6% of the total microbial community (indicated by 16S rRNA). The abundance of nitrifiers correlated with potential AOB activities und enriched Nitrosopira-like AOB were characterized as psychrotolerant [119]. The genus Nitrosospira also dominated in samples from Antarctica soils [179,180,188,189] and the Canadian Arctic [163]. However, when AOA dominates, the measured nitrification activity did not correlate with abundance of the amoA gene, as some AOA clades have low nitrification activity and alternative mixotrophic growth [118]. Recently, it was shown that especially the new Candidatus AOA genus Nitrosopolaris with four species are widely distributed in polar and alpine habitats and a new AOA species Ca. Nitrosocosmicus arcticus was isolated from Arctic soils [182,190]. All ammonia-oxidizing organisms (AO) produce N2O (and NO) as a byproduct during aerobic ammonia oxidation by different pathways (from reactive intermediates and nitrifier-denitrification) and at different amounts, with N2O yields about 30 times higher in AOB than in AOA and comammox [129,191,192]. The global median N2O yield from AO is 0.14% per ammonia [193]. Although AOA often outnumber AOB in soils, AOB nitrification is far more susceptible to N2O formation [192]. Therefore, models of soil N2O emission could be improved by including not only physiochemical parameters [194], but also microbial traits to distinguish between AO communities [195]. For the final step of nitrification, nitrite oxidation, nitrite-oxidizing bacteria (NOB) of the genera Nitrospira and Nitrotoga might play an important role in permafrost-affected soils [119,155]. To date, two psychrotolerant strains of Nitrotoga have been enriched from active layer (Nitrotoga arctica) and permafrost, both with temperature optima of 17 °C and 22 °C, respectively [155,196].
Ramm et al. [59] synthesized nitrification rates of the active layer of permafrost-affected ecosystems and estimated mean gross nitrification rates of 6.6 µg N g dw−1 d−1 with slightly negative or near zero net nitrification rates. Organic soils have much higher rates than minerals soils. Thus, gross nitrification rates are comparable or even higher than in synthesized data from non-permafrost ecosystems [59]. Nitrification rates were mainly controlled by soil organic carbon (highest rates at medium SOC), C/N ratio, and total N and accounted for about half of ammonification rates, indicating a great importance of autotrophic nitrification.
2.2.2. Denitrification
Nitrate formed by nitrification can be gradually reduced under anoxic conditions by heterotrophic canonical denitrification from nitrate to nitrite, to gaseous nitric oxide (NO) and nitrous oxide (N2O), and finally to inert dinitrogen gas (N2). This heterotrophic process uses C compounds as electron donor, therefore depends on the availability of degradable organic carbon in the soil. Denitrification is carried out by various non-specific groups of mainly prokaryotic microorganisms occupying divers ecological niches [130]. The final step of denitrification represents the only known N2O sink in the biosphere [197]. In permafrost-affected soils, denitrifying organisms were detected based on their various key enzyme genes (nitrate reductases: narGHI, napAB, nitrite reductases: nirS, nirK, NO reductase: norVW, norB and N2O reductase: nosZ [136]). In general, the main product of denitrification is N2, but in the absence of N2O reductase, N2O is formed. The N2O/N2 ratio determines how much N2O is formed and is regulated by the denitrifying community. High N2O/N2 ratios can result from high abundance of denitrifying fungi lacking N2O reductase [198], or from favorable soil conditions, such as carbon availability or acidity [199,200]. On a global scale, N2O accounts for about 8% of the terrestrial denitrification flux, and thus has a higher yield than nitrification [193,201]. In permafrost-affected soils, denitrification is the main process of N2O emission, but nitrification can also be a major contributor (20% [202]) or even dominate ([203], 86% [163]).
Studies of in-situ denitrification rates in permafrost-affected soils are rare (e.g., [112,204]) but have recently been reviewed [58]. Denitrifying communities of permafrost-affected soils remain largely unresolved to date, with one of the first characterizations of denitrifiers occurring in N hotspots of bare permafrost peatlands and sea animal-influenced soils (details see chapters below). In both N hotspots, nirS-type (nitrite reductase) denitrifiers play an important role [189,205], as well as in permafrost-affected soils on the Tibet Plateau [110]. Metatranscriptomic analyses of active layer in Arctic cryosols at representative ice-wedge polgygon in the Canadian high Arctic polar desert detected active denitrifiers using the marker gene nirS, but most of these have not yet been cultured [136]. In this study, the known denitrifiers were members of the genera Thiobacillus, Denitrovibrio, Pseudomonas, Azospirillum, and Azorhizobium, and soil N2O emission correlated with a particular denitrifier community [136]. At one N hotspot in hillslope thermokarst landscape that produces large amounts of N2O, denitrification genes accounted for 15–29% (nirS + nirK) of the analyzed N functional genes [87]. A recent metagenomic analysis of tundra soils in northern Finland showed that dentrifiers were dominated by poorly characterize taxa but had truncated denitrification enzymes that lacked one or more denitrification genes, leading to the hypothesis that these organisms contribute significantly to N2O cycling in tundra soils [181]. However, the study did not find a significant relationship between N2O flux and the abundance of denitrifying genes. In addition, permafrost samples contained denitrifying genes, as shown in metagenome studies [135]. As in the active layer, the relative abundance of the last denitrification step was low in frozen permafrost, which may lead to the accumulation of N2O [101,174,183]. The gene abundance of denitrifiers increases after thawing [185], but not during long-term incubations [206].
3. Hotspots of N Availability and Properties
Nitrogen availability is primarily determined by plant N demand. Therefore, hotspots and hot moments of N excess result from lack of competition due to a spatial or temporal separation of N sources and sinks with high N loss potential as N2O (reviewed in [82]) or nitrate [28,84,207,208,209,210,211,212,213].
Nitrogen hotspots occur, e.g., in the absence of vegetation [30,86,120,211,214,215,216,217,218], with pioneer vegetation following disturbance [87,213] where ecosystem disturbance from wind erosion, cryoturbation, thermokarst, fluviatile erosion, or wildfire have resulted in vegetation loss, or in deep active layers and permafrost without deep-rooting plant species [55,75,76,103,219]. Accordingly, hot moments also occur when plant N demand and immobilization are reduced [28,30,55,59,75,103,217,220,221,222,223], e.g., during spring thaws prior to N uptake by plants [24,40,224,225,226,227] or at the end of the growing season [28,228,229]. A temporal separation of N mineralization and N immobilization was observed in the Arctic tundra [75,230]: In the winter months, N mineralization predominates and DIN is enriched, while in the growing season N immobilization predominates [70,104,224]. Consequently, at the beginning of the growing season, the thawing of frozen DIN, temperature-induced increase in N mineralization, and presumably frequent freeze-thaw cycles associated with microbial cell lysis may result in the substantial release of plant-available DIN [66,75,110,225,231,232,233].
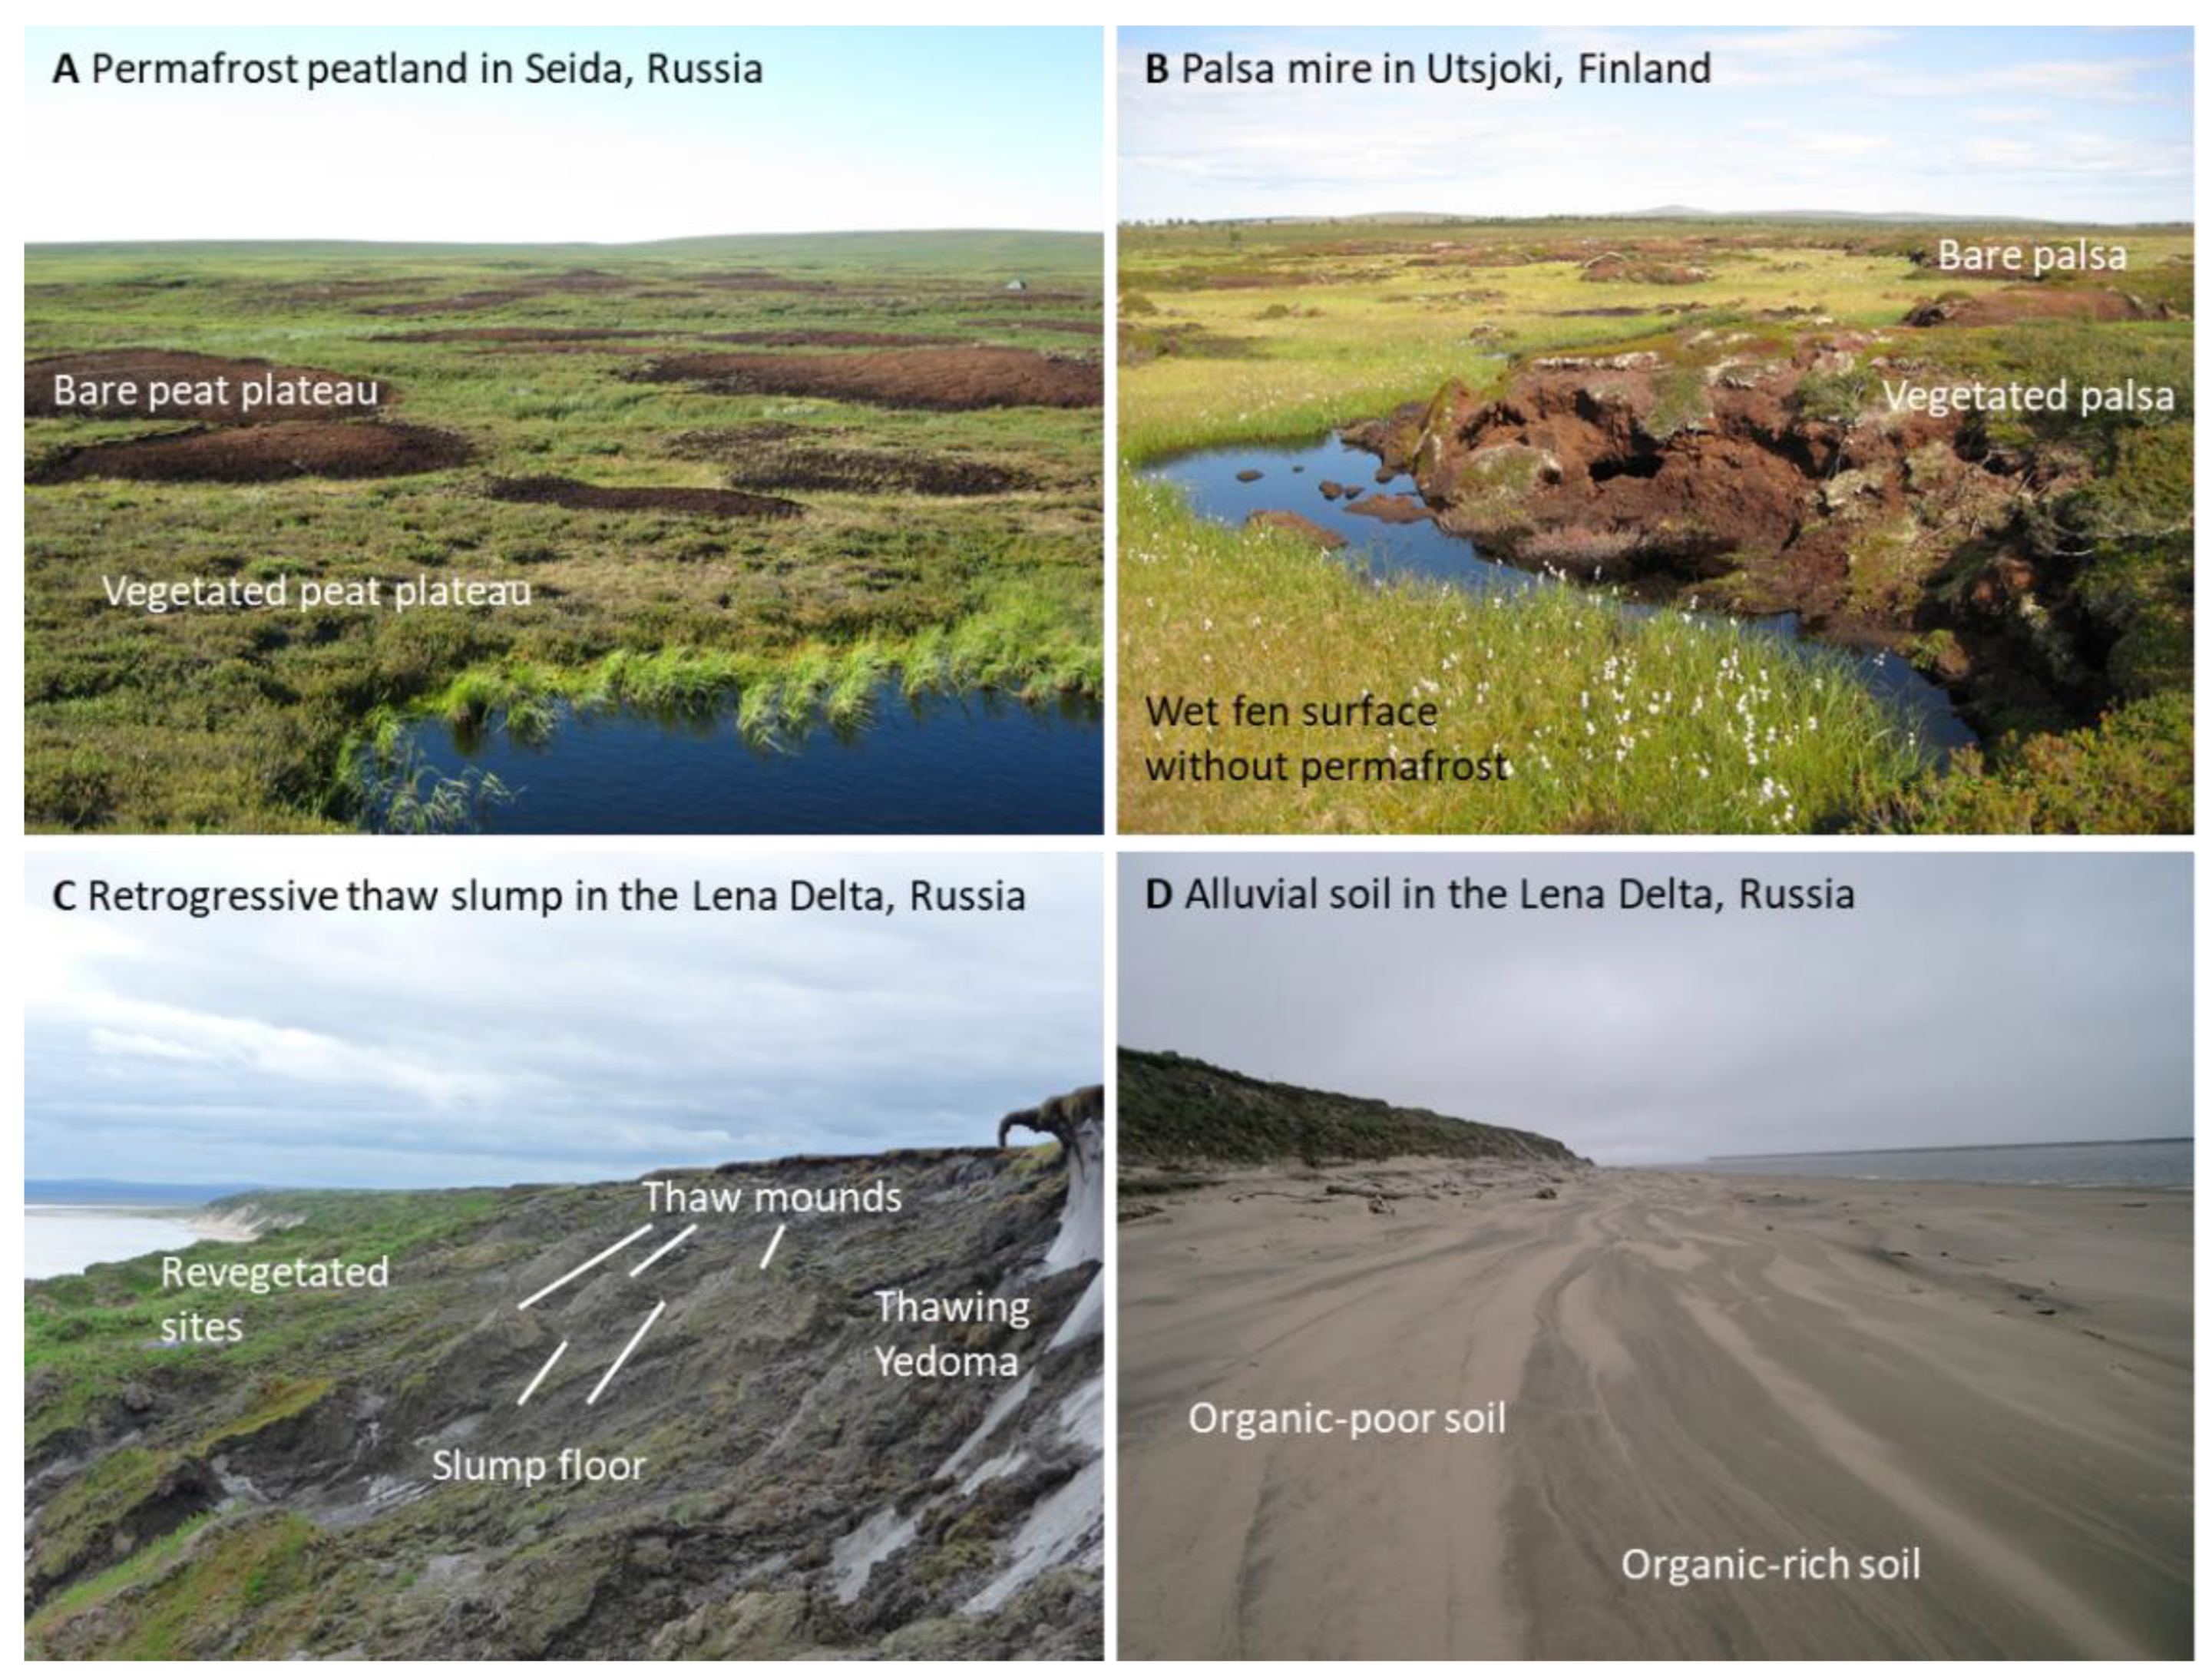
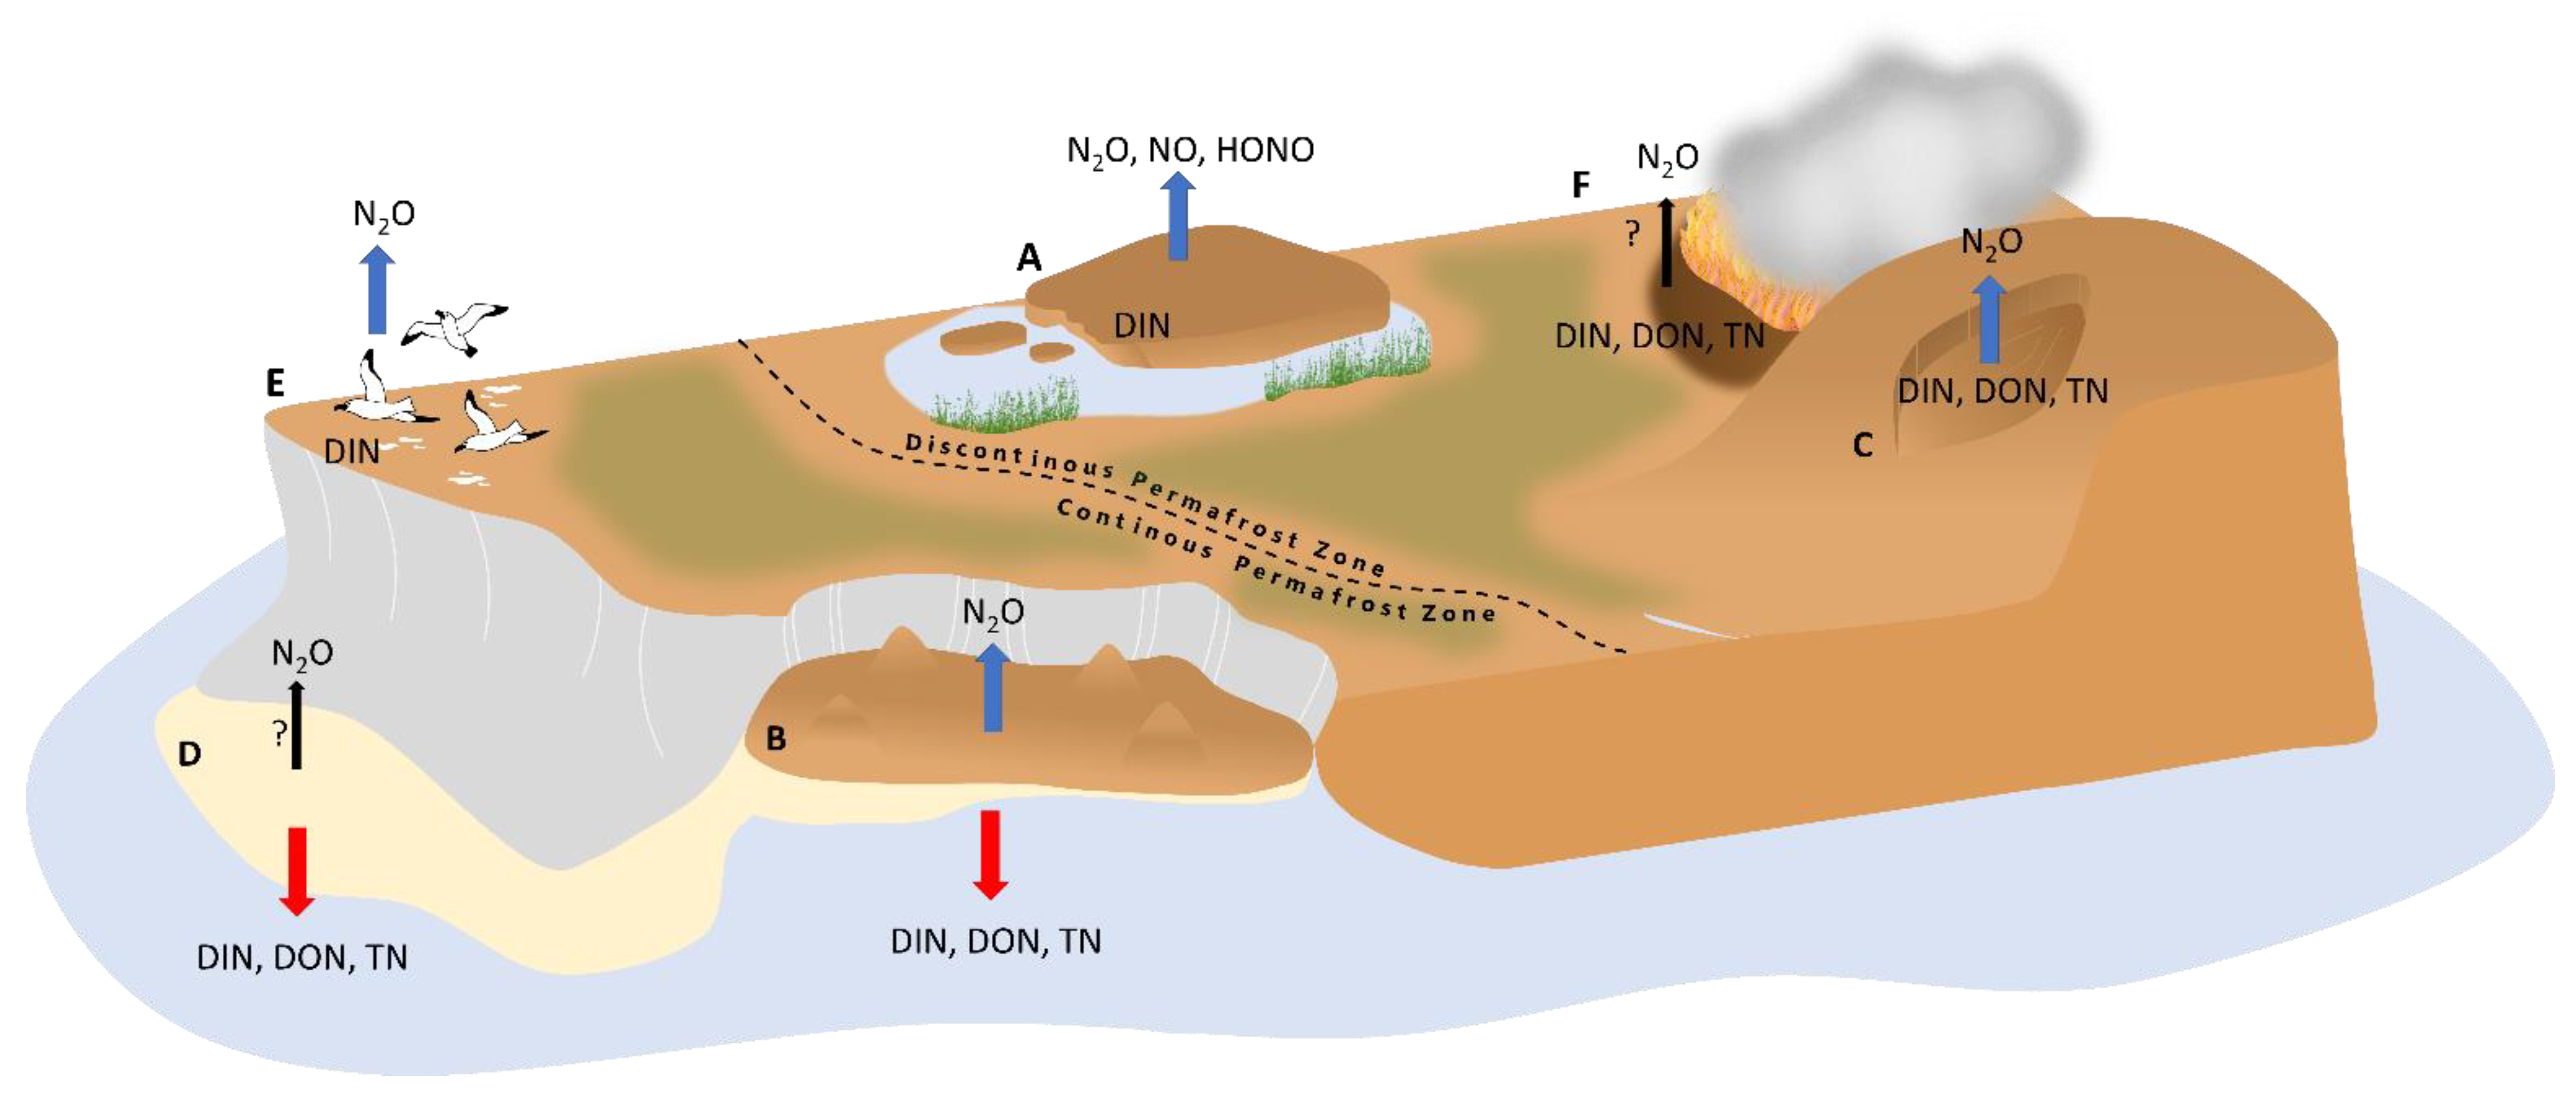
However, N hotspots can also result from additional N input from animal excreta [188,189,234,235,236,237], plants associated with diazotrophic bacteria [111], or N release from thawing permafrost [87,213,238]. Since N hotspots have only been discovered in the last two decades, only a limited number of studies have been conducted at a few sites (Figure 1) that describe their biogeochemical characteristics in relation to N losses. The two best described hotspot types are (1) N hotspots in bare organic lowland soils in permafrost peatlands, where high in situ emissions of N2O from permafrost environments were initially detected [214], and (2) disturbed mineral soils at retrogressive thaw slumps, where N leaching was first found [28,208,210] (Figure 3). In the following sections, we detail what is known about N availability and the correlation between potential N traits in combination with N losses. In addition, at the end this chapter, we characterize other recently discovered and less well documented probable N hotspots, (3) alluvial soils, (4) animal-influenced, and (5) wildfire-affected soils in permafrost-ecosystems (Figure 4).
3.1. Bare Organic Lowland Soils in Permafrost Peatland
3.1.1. Habitat, Soil Characteristics and Inorganic N
The high content of ground ice in permafrost peatlands leads to the formation of various shapes of patterned ground and ice wedge polygonal networks, as well as elevated mounds, such as palsas and peat plateaus. Northern permafrost peatlands cover an area of about 1.7 ± 0.5 million km2 and store about 185 ± 70 Pg organic carbon and 7 ± 4 Pg nitrogen in their soils [33]. Altogether, northern peatlands are at present-day a sink for CO2 (0.10 ± 0.02 Pg y−1) as well as a source of CH4 (0.026 ± 0.002 Pg y−1) and of N2O (0.022 ± 0.005 Tg y−1, but based on data from only a limited number of sites) with C and N losses to aquatic systems of 0.022 ± 0.02 Pg C y−1 and 0.7 ± 0.5 Tg N y−1 [33]. Permafrost peatlands with ombrotrophic palsa and peat plateaus surrounded by minerotrophic unfrozen fen surfaces represent a typical permafrost-affected ecosystem at sporadic and discontinuous permafrost zone in subarctic regions, in contrast to ice-wedge polygons that occur in the continuous permafrost regions [11,239,240]. While in the sporadic permafrost zone palsa mires occur with a large proportion of the mire surface without permafrost, in more northerly with higher permafrost cover extensive frozen peat plateaus occur surrounded by only narrow fen stripes [11] (Figure 3 and Figure 4). Uplifted peat surfaces have often bare, non-vegetated patches of varying sizes-called peat circles up to 25 m in diameter-created by the expansion of the ice body and the resulting surface uplift, erosion (wind abrasion) or cryoturbation [214,241,242,243] (Figure 3 and Figure 4). Due to higher elevation compared to the non-frozen mire surface, the palsas and peat plateaus are well-drained, ombrotrophic and the vegetated parts have typical bog vegetation [86]. The uppermost peat is usually old, minerotrophic and only partially covered by a thin layer of moss, but without any vascular plants [86,244]. Assuming a spatial coverage of peat plateaus (and palsas) of about 20% in the Artic [214] and a 1–4% proportion of bare sites in these uplifted permafrost peatlands, the area of bare peat plateaus in the Arctic could be 0.015–0.06 million km2 [214]. However, the precise identification of these small-scale features on a pan-Arctic scale is difficult. Bare peat surfaces on palsa and peat plateaus are typical landscapes in permafrost peatlands in Canada [245], Europe [240], northwestern Russia, and Siberia [241,242]. However, so far, only a few bare peat sites in Finland and eastern Russia have been studied for their N properties, N turnover, and microorganisms involved (Figure 1), which are described below.
The bare peat soils in uplifted palsas and peat plateaus have been termed as Cryic Folic Histosol [246], and the surfaces are characterized by old peat material (age up to 6000 years) with a high degree of peat decomposition [243,244]. The bare peat surfaces have higher total labile carbon and nitrogen, lower C/N ratio, lower pH of about 3–4, higher bulk density, and lower phosphate content, unlike the surrounding vegetated peat soils (Fibric Histosols) [86,202,216,241,242,244,246,247]. In addition, the water table in the palsas and peat plateaus is lower than in the surrounding peatlands without permafrost, with the water content as water-filled pore space (WFPS) in the bare peat surfaces often at 60–70% [86,202,217], i.e., in the intermediate range favorable for N2O emission. Oxygen concentration in bare peat circles of a Russian peat plateau varied between 17–20% in the first 35 cm and was <1% at 45 cm depth, allowing simultaneous aerobic microbial processes in the topsoil and anaerobic processes in deeper parts [217]. In general, the bare peat circles had higher concentrations of inorganic nitrogen ammonium and nitrate at lower DOC/DIN ratios than the vegetated parts of the peat plateau [86,120,202,214,216,247,248]. For the Seida site in Russia, the mean values of all studies for ammonium were 60 ± 14 µg NH4+-N g dw−1 (Table 1) with the highest mean of 116 ± 39 µg NH4+-N g dw−1, [202] (Table S1). Meanwhile, for nitrate, the mean values were 117 ± 3 µg NO3−-N g dw−1 (Table 1 and Table S2, Figure 5C) with the highest mean of 419 ± 54 µg NO3−-N g dw−1, [247] (Table S1). Nitrate concentration in bare peat was even two orders of magnitude higher than ammonium with concentrations up to 1 mg NO3−-N g dw−1, and with increasing soil depth nitrate content decreased and ammonium increased [217].
3.1.2. C and N Mineralization
While the vegetated subsites of the peat plateau are carbon sinks and have the highest SOC stock per unit area in the region, the bare peat circles act as carbon sources [249,250,251]. Peat circles exhibited comparable in situ soil microbial respiration to vegetated parts despite the presence of old carbon [243], indicating that peat is highly available for decomposition [223,244,247] (Table S1). However, in laboratory incubations, peat circles had lower C-mineralization rates than vegetated sites [223,242] (27 µg compared to 92 µg CO2-C g dw−1 d−1 in incubations at 15 °C [244] (Table S1). Bare peat sites are usually small or negligible CH4 sources [251] or even sinks [252] in contrast to waterlogged, surrounded fens with high CH4 emissions. The ability of bare palsa surface for atmospheric CH4 uptake was also demonstrated under dry conditions in laboratory incubations with intact peat cores [223]. Peat circles were found to have lower microbial biomass with low diversity of specialized microorganism for decomposition of SOM [242]. In anoxic incubation experiments, fermentation potentials are lower for bare peat circles than for the vegetated sites [205,253]. The soils of peat circles were inhabited by the bacterial class-level taxa Alphaproteobacteria, Acidimicrobiia, Acidobacteria, Verrucomicrobiae, and Bacteroidia, as well as by archaeal Nitrososphaeria and non-methanogenic Euryarchaeota [253]. Cryoturbation destroys plant roots and leads to suppression of filamentous fungi, so more unicellular fungal forms were found [242]. In contrast to C mineralization, bare peat surfaces show higher gross N mineralization rates (16.8 ± 9.7 µg N g dw−1 d−1, mean rates of [86,202]) in oxic laboratory incubation experiments at 15 °C and in situ 15N labeling experiments than sparse and vegetated sites on the peat plateau (9.0 ± 10.8 µg N g dw−1 d−1 mean rates of [86,202]) (Table 1). Gross nitrification [120,202] (Table 1 and Table S1) and in situ net N mineralization [202,216] (Table S1) were also higher in the bare peat plateau than in the vegetated one. Net N mineralization rates in peat circles were an order of magnitude lower than gross rates for peat circles [216], indicating a surplus of available N in bare peat circles [202]. The gross nitrification rates of bare peat circles (8.4 ± 7.3 µg N g dw−1 d−1 mean rates of [120,202]) were in the upper range of those reported for permafrost-affected soils (mean 6.6 µg N g dw−1 d−1 in [59]) and in the middle range of other ecosystems [164], while vegetated sites on the peat plateau (0.2 ± 0.1 µg N g dw−1 d−1, [202]) were in the lower range [59] despite the low pH values found (Table 1).
3.1.3. Gaseous N Loss
In conjunction with high N turnover rates, peat circles show exceptionally high N2O rates of 0.89 ± 0.10 g N2O-N m−2 per year (and a daily emission of 6.55 ± 2.83 mg N2O-N m−2) during the 100-day growing season, being the highest N2O emission of any natural terrestrial ecosystems [86,214] (Table S1, Figure 4A). The first observation of high N2O emissions from permafrost peatlands represented the highest N2O emissions from northern pristine terrestrial ecosystems and was estimated at the time to be up to 0.6% of global annual N2O emissions [214]. In one study, the N2O emissions from the peat circle were approximately equal to the net N mineralization, such that almost all of the N surplus was lost to N2O emission [216]. N2O concentrations in theses soils were 0.35–5 ppm and increased with depth [217]. Compared to the mean value of N2O fluxes of 1.98 ± 3.19 mg N m−2 d−1 from various studies on peat circles at Seida site in Russia, N2O emissions from vegetated peat plateaus (0.01 ± 0.03 mg N m−2 d−1) and surrounding water-logged fens, and from upland soils in tundra heath were negligible or soils even consumed N2O [86,120,202,214,254] (Table 1 and Table S2, Figure 5A,B). In sparsely vegetated peat mounds, the N2O emissions were averaged only 12% of those from peat circles [86]. The bare soils of the peat plateau also emitted N2O outside the growing season, with cold season emissions accounting for 20–69% of annual peat circles emissions [86]. In two seasons studied, bare sides produced N2O at the beginning of the growing season, and after N2O decreased at the end of the growing season, there was a significant increase of CO2 and CH4 in the soil [247]. Nitrous oxide emission of bare sites during growing season correlated positively with air and soil temperature, total N content, inorganic N and nitrate content, WFPS, pH and C/N ratio with emission measured only below a threshold of C/N ratio <25 [86,120,202,247]. Gil et al. [217] additionally found a positive correlation between N2O concentration and ammonium and CO2 concentration and a negative one with nitrate concentration in the soil profile. Recently, bare peat sites on permafrost peatlands with high availability of inorganic N have also been identified as important sources of nitric oxide (NO, 1.42 ± 0.13 mg N m−2 d−1) and nitrous acid (HONO, 0.06 ± 0.02 mg N m−2 d−1) [255] (Table S1, Figure 4A). As with N2O, low emissions were detected from adjacent vegetated surfaces. This was the first report of these gases from high latitudes soils. At the maximum, reactive N gas fluxes were similar to N2O emission rates from these permafrost peatlands and about twice as high as average global emissions. Both NO and HONO, like N2O, are formed by microbial nitrification and denitrification processes. Reactive N gas fluxes correlated negatively with C/N ratio and positively with total inorganic N, nitrate, and ammonium content with variable moisture effects.

Table 1.
Soil properties, gross and net N turnover rates, abundance of functional N genes, and in situ N2O fluxes at two types of N availability hotspots: exemplified by a best described site of bare surfaces on permafrost peatland and thermokarst disturbed and revegetated retrogressive thaw slump (RTS), and undisturbed sites associated with the hotspots: vegetated surfaces on permafrost peatland and intact, fully vegetated soil adjacent to thaw slump, respectively. For RTS sites, a distinction was made between two subsites: slump floor (SF) and thaw mound (TM).
| Permafrost Peatland | Mineral Upland Soils in Thermokarst Landscapes | ||||
|---|---|---|---|---|---|
| Soil and Microbial Properties | Bare Surfaces * | Vegetated Surfaces * | Disturbed, Revegetated RTS ** | Undisturbed Fully Vegetated Site Next to RTS ** | |
| Slump Floor (SF) | Thaw Mound (TM) | ||||
| pH | 3.7 ± 0.5 [86,247] | 3.6 ± 0.3 [86,247] | 7.2 ± 1.5 [87,256] | 7.9 ± 0.0 [256] | 5.7 ± 0.3 [87] |
| C/N | 22 ± 4 [86,247] | 51 ± 16 [86,247] | 15 ± 1 [87,256] | 13 ± 0 [256] | 38 ± 4 [87] |
| WFPS (%) | 53 ± 25 [86,247] | 22 ± 7 [86,247] | 60 ± 11 [87,256] | 60 ± 3 [256] | 13 ± 6 [87] |
| SOM (%) | 95 ± 1 [86,247] | 98 ± 0 [86,247] | 11 ± 4 [87,256] | 8 ± 0 [256] | 27 ± 3 [87] |
| TN (%) | 2.4 ± 0.3 | 1.0 ± 0.3 | 0.30 ± 0.10 | 0.34 ± 0.01 | 0.29 ± 0.03 |
| [86,247] | [86,247] | [87,256] | [256] | [87] | |
| δ15N in bulk soil (‰) | n.d. | n.d. | 1.4 ± 0.5 [87,256] | 2.0 ± 0.1 [256] | 1.2 ± 0.3 [87] |
| Ammonium (µg N g dw−1) | 60.1 ± 14.4 | 19.6 ± 5.7 | 1.4 ± 1.8 | 0.0 ± 0.0 | 9.0 ± 11.7 |
| [86,202,205,216,247,255] | [86,202,205,216,247,255] | [87,256] | [256] | [87] | |
| Nitrat (µg N g dw−1) | 116.8 ± 2.8 | 4.4 ± 7.7 | 0.7 ± 0.1 | 81.6 ± 24.3 | 0.0 ± 0.0 |
| [86,202,205,216,247,255] | [86,202,205,216,247,255] | [87,256] | [256] | [87] | |
| DIN/TN (%) | 1.1 ± 1.3 [86,247] | 0.3 ± 0.1 [86,247] | 0.1 ± 0.1 [87,256] | 2.4 [256] | 0.3 [87] |
| Gross N mineralization | 16.8 ± 9.7 [86,202] | 9.0 ± 10.8 [86,202] | 15.1 ± 10.1 [87] | n.d. | b.d. |
| (µg N g dw−1 d−1) | |||||
| Net N mineralization | n.d. | n.d. | 4.0 ± 4.9 [87,256] | 1.4 ± 0.5 [256] | −20.9 ± 16.6 [87] |
| (µg N g dw−1 d−1), p.a.s. 0.8 [59] | |||||
| Gross nitrification | 8.4 ± 7.3 [120,202] | 0.2 ± 0.1 [202] | b.d. | n.d. | b.d. |
| (µg N g dw−1 d−1), p.a.s. 6.6 [59] | |||||
| Net nitrification | n.d. | n.d. | 1.6 ± 1.5 [87,256] | 1.4 ± 0.5 [256] | −6.0 ± 2.9 [87] |
| (µg N g dw−1 d−1), p.a.s. −0.4 [59] | |||||
| Net denitrification | 0.56 | <0.004 | 2.8 ± 1.8 [87] | n.d. | 0.01 ± 0.00 |
| with (without acetylene) (µg N g dw−1 d−1) | (0.37) [205] | (b.d.) [205] | (0.3 ± 0.4) [87,256] | (0.20 ± 0.02) | (0.01 ± 0.00) |
| [256] | [87] | ||||
| Functional nitrification gene | |||||
| AOA amoA (copies gdw−1) | 6.4 × 10⁸ [120] | 8.0 × 10⁶ [120] | 2.0 × 10⁷ [87] | n.d. | 5.4 × 10⁷ [87] |
| AOB amoA (copies gdw−1) | b.d. | b.d. | 3.3 × 10⁷ [87] | n.d. | 4.2 × 10⁶ [87] |
| Functional nitrification gene amoA (% of 16S rRNA) | |||||
| n.d. | n.d. | 7 [87] | n.d. | 1 [87] | |
| amoA (% of N genes) | n.d. | n.d. | 3.4 ± 1.0 [87] | n.d. | 0.5 ± 1.0 [87] |
| Functional denitrification gene (% of 16S rRNA [205], N genes [87]) | |||||
| narG | 7.6 ± 2.8 [205] | 0.04 ± 0.01 [205] | 42 ± 0.9 [87] | n.d. | 45 ± 9.3 [87] |
| nirS + nirK | 0.34 ± 0.08 [205] | 0.88 ± 0.13 [205] | 29 ± 0.1 [87] | n.d. | 15 ± 0.6 [87] |
| (nirS + nirK)/nosZ (%/%) | 0.20 × 10³ [205] | 8.88 × 10³ [205] | 2.4 ± 0.2 [87] | n.d. | 0.5 ± 0.1 [87] |
| N2O fluxes | 1.98 ± 3.19 | 0.01 ± 0.03 | 1.64 ± 2.61 [87] | n.d. | −0.001 ± 0.018 [87] |
| (mg N m−2 d−1) | [86,120,202,247,255] | [86,120,202,247,255] | |||
* Peat plateau in Seida, Komi Republic, Russia (N 67°03′, E 62°57′, Figure 1 and Figure 2), bare peat surfaces covered by a thin moss layer but lacking vascular plants, vegetated site with typical bog vegetation [86]. ** Retrogressive thaw slump, Kurungnakh Island, Lena Delta, Russia (N 72°20, E 126°17′, Figure 1 and Figure 2), undisturbed site: Holocene cover deposits with moss, sedge and dwarf shrub vegetation communities on top of the RTS, disturbed thermokarst site: Yedoma revegetated with grasses (Arctagrostis arundinacea) subdivided into slump floor (SF, SF3V in [256]; SF3 in [257], Yedoma mixed with younger Holocene) and thaw mounds (TM, TM1V in [256] dominated by late Pleistocene Yedoma) as described in Marushchak et al. [87]. Data are mean values ± standard division calculated from the mean values of the cited publications, therefore they are mainly variations between sampling years. All gas fluxes were measured with static chamber technique, more detailed parameters and information can be found in Table S1. amoA = gene of subunit A of ammonia monooxygenase, AOA = ammonia-oxidizing archaea, AOB = ammonia-oxidizing bacteria, b.d. = below detection limit, dw = dry weight, DIN = dissolved inorganic nitrogen, narG = gene of nitrate reductase, n.d. = not determined, nirS, nirK = genes of nitrite reductases, nosZ = gene of N2O reductase, p.a.s. = mean rates of permafrost-affected soils from Ramm et al. [59], SOM = soil organic matter, TN = total nitrogen, WFPS = water-filled pore space.
3.1.4. Microbial Based N Processes
In anoxic incubations, samples from cryoturbated bare peat circles show high N2O production rates (0.37 µg N2O-N g dw−1 d−1 and 0.56 µg N2O-N g dw−1 d−1 at 20 °C in the absence and presence of acetylene, respectively), but not from adjacent vegetated sites (Table 1 and Table S2, Figure 5E,F), suggesting anaerobic denitrification as the main N2O source and the potential to be responsible for the in situ N2O emissions [205]. Instead, soils samples from vegetated sites showed high N2O consumption potential in incubations [254]. However, samples from vegetated sites produced N2O after the addition of nitrite and nitrate. Therefore, the content of inorganic N had limited denitrification at vegetated sites [202,205,254]. Since N2O production from peat circles was not stimulated by substrate, these samples were not N-limited [205]. N2O emissions from peat circles were associated with a specific, diverse, and acid-tolerant denitrifier community that had different compositions at sites with low and high N2O emissions [205,253,258]. Concentrations of key denitrification enzymes were significantly higher in peat circles than in vegetated sites, with, e.g., nitrate reductase (narG) accounting for about 8% of bacterial 16S rRNA (Table 1) and the nirS-type (nitrite reductase) denitrifier playing a major role. The high emission of N2O could be caused by a specialized denitrifying community with a high percentage of denitrifiers that lack the final step to produce N2 from N2O, as shown by very low amount of the N2O reductase gene (nosZ) [205]. Denitrifiers found in bare and vegetated soils belong to Actino-, Alphaproteo-, and Betaproteobacteria, but most key enzyme sequences are only distantly related to cultured denitrifiers, so they are not yet cultured and their ecophysiological properties are therefore unknown [205,254]. At bare sites, acetate consuming key players of the Burkholderiaceae family coexist with Rhodanobacter sp. during complete denitrification, which under natural conditions might be limited of electron donors [253]. In situ 15N labeling studies at the same bare peat circle have shown that aerobic ammonia-oxidizing nitrification is responsible for about 20% and denitrification processes for about 80% of the emitted N2O, which was regulated by moisture (WFPS) and thus oxygen status [202,217]. The process of nitrifier denitrification could be excluded as no ammonia-oxidizing bacteria (AOB) were detected [120,253]. Therefore, the 20% N2O produced by ammonia oxidation were abiotically formed from intermediates or byproducts of ammonia oxidation pathway of the detected ammonia-oxidizing archaea (AOA). These nitrifiers were described to be adapted to acid soil conditions despite low concentrations of their actual substrate ammonia [129]. Although nitrifiers contribute only slightly to N2O production in bare peat circles, nitrification is the most important limiting step in N2O emission, as it regulates the supply of nitrite and nitrate for denitrification.
In addition, in four Arctic and subarctic permafrost peatlands in Russia and Finland, AOA were most abundant in bare peat soils compared to vegetated parts, and neither AOB nor comammox were detected [120] with only 0.01% abundance of bacterial nitrifiers of 16S rRNA [253]. In addition, high gross nitrification rates at bare sites with up to 13.5 ± 1.1 µg NO3−-N g dw−1 d−1 (in incubations at 15 °C, Table S1) were assigned only to AOA by inhibition experiments [120], which could be due to the low pH values that generally favor AOA over AOB [129,190,259,260,261] and, in peat soils [262]. On average, the abundance of amoA genes was about 200 times higher in bare peat than in vegetated peat surfaces [120]. AOA showed low diversity. Only two phylotypes of clades NS-ζ-1.2 and NS-γ−2.3.2 clades were detected associated with the taxonomic order Nitrososphaerales, with the closest relatives Candidatus Nitrosocosmicus arcticus Kfb [190]. Nitrate concentrations correlated positively with AOA (amoA) gene abundance and N2O fluxes. Due to the high availability of inorganic N in the peat circles, biological N2-fixation (BNF) and N fixing cyanobacteria were absent there, in contrast to the vegetated parts of the peat plateau [216]. Therefore, the high N mineral cycle is fed only by internal N sources of N mineralization and no additional external N input from BNF.
In summary, all soil parameters of the bare peat sites indicate high N availability, i.e., N hotspot character, caused by high mineralization relative to N immobilization, which together with intermediate moisture supports high gaseous N losses through active nitrification and denitrification processes (Figure 2).
3.2. Disturbed Mineral Upland Soils in Hillslope Thermokarst Landscapes
Similar to bare peat surfaces caused by wind erosion, high N losses by gaseous fluxes and/or leaching have been reported from thermokarst-influenced upland soils, where N availability is increased by the N release from permafrost layers after thawing, but also by loss of plant cover [28,42,75,103,213] (Figure 3 and Figure 4). This disruption of the N cycle is long-lasting and is not reversed by initial revegetation with plants [87,125,213,218,263,264,265,266,267].
3.2.1. Habitat and Soil Characteristics
Thermokarst is defined as a process that causes subsidence of the ground surface due to thawing of ice-rich permafrost [11,97,268,269,270]. About 20% of Northern Hemisphere permafrost areas are currently affected by thermokarst, with a substantial increase projected by the end of the century (to 20–50% for upland areas [271,272,273]). Thermokarst landscapes can be divided into wetland, lake and hillslope thermokarst [97,270]. Hillslope thermokarst currently covers only a small portion of about 5% of the northern permafrost region [270] but its spatial extent is expected to increase in the future, and it has the potential to emit about one-third of total carbon loss associated with abrupt thaw [99]. Upland thermokarst landforms are divided into three types: retrogressive thaw slumps (RTS), the most widespread and active form, active layer detachment (ALD) and thermal erosional gullies, collectively referred to as thermo-erosional features [11,97,268,269,270]. Retrogressive thaw slums are particularly common along riverbanks, coasts, and thermokarst lakes in the American Northwest and in the Siberian Arctic, but are also found on slopes on the Tibetan Plateau, where the ground is underlain by massive permafrost in areas of continuous permafrost [11,268,270,274,275,276,277,278] (Figure 1). Unlike the gradual thaw, which affects permafrost only centimeters at a time over decades, the abrupt thaw affects many meters at daily and annual intervals [275,279,280,281] and causes long-lasting feedbacks on hydrology, soil biochemical properties, redox conditions, soil and vegetation cover, SOM decomposition and erosion [125,213,218,263,264,265,266,267]. In particular, the ice-rich (up to 80 vol-%) Yedoma sediments deposited during the Weichselian Ice Age (≤MIS 5) in the Late Pleistocene are susceptible to abrupt permafrost thaw, leading to the formation of RTS in eastern Siberia. These loess-dominated silty and fine sandy sediments, formed under cold, arid conditions, store large amounts of N, as indicated by a low C/N ratio (median of 9.3) and easily degradable SOM and organic matter content of 4–10% [3,42,239,272,282,283,284,285].
In the Yedoma regions, RTS can be described by the main morphological components: (1) a steep, nearly vertical icy headwall that can be up to 25 m high, (2) a slump floor with a low slope (typically 2–15°) and (3) the exposed thaw mounds (in Russian ‘baydjarakhs’) within the slump floor (Figure 3). While the slump floor contains eroded and mixed Pleistocene permafrost, Holocene active layer sediments, and remnants of surface vegetation [213,257,269,286,287], thaw mounds contain only Pleistocene permafrost sediments as remnants of former ice-wedge polygon centers [257,280,287,288]. Soils of RTS were classified as Protic Cryosols due to the presence of permafrost and lack of soil horizon development, meaning that organic horizon is reduced or absent in homogenous soil material [269,286,287,289]. Compared to undisturbed permafrost, elevated soil temperatures and greater active layer thickness can be observed on non-vegetated exposed soils [88,218,269,286,290] with increased UV light exposure and photodegradation of organic matter [276]. After several decades of erosion, disturbed soils from RTS and hermos-erosion gullies still have lower SOM content with lower DOC and total nitrogen, lower soil moisture (leading to adjacent oxic and anoxic conditions), higher pH (around 7), and higher bulk density than undisturbed soils [29,88,213,218,266,269,286,289,290,291,292].
Different thaw stages of thermokarst features form a chronosequence from bare, freshly eroded to already stabilized areas revegetated by pioneer plants. Stabilization of RTS may occur when the headwall is no longer affected by coastal waves, when vegetation has recovered, or when other eroded sediments protect the ground-ice from thawing [269]. The vegetation on disturbed sites differs from that on undisturbed sites, which persists for centuries [11,125,218,264,266,269,289,290,291,293,294]. In the initial phase, erosion usually mobilizes large amounts of SOM into aquatic ecosystems, especially readily biodegradable carbon and nitrogen in the form of DOC and DON [210,281,293,295]. Based on model simulations, thermal erosional events are assumed to result in a net loss of 10% carbon and 5–7% of nitrogen and phosphorus in the ecosystem within 100 years [67]. Therefore, despite high N availability in the early decades, SOM and vegetation renewal may be nutrient limited at later vegetation stages [67].
3.2.2. C and N Mineralization and Inorganic N
Upland thermokarst exposes SOM to mineralization from long-term frozen Holocene and Pleistocene deposits, such as the ice-rich sediments of Yedoma. The reported decomposability of Yedoma is inconsistent, suggesting greater variability between geographic locations or microbial limitation of C mineralization in recently thawed sediments [186,296]. Lower, similar, or higher rates of C mineralization and thus gaseous C released as CO2 and CH4 have been described at hillslope thermokarst landforms compared to undisturbed neighboring sites [88,257,276,277,286,287,297]. In comparison to undisturbed soils, soils in hillslope thermokarst landscapes are generally characterized by low C/N ratios and higher but highly variable inorganic N availability, dominated by ammonium, [29,87,125,213,256]. The increased inorganic N content is most likely due to the following: (1) thermo-erosion exposes mineral soils and thaws permafrost subsoil layers, which typically contain higher concentrations of inorganic nitrogen (mainly ammonium) than topsoils [28,42,77,103,117,213], (2) physical mixing increases aeration and drainage, which promotes aerobic N mineralization [186,208,213], (3) reduced or absent uptake of plant nutrients due to disturbed vegetation. When permafrost thaws, the previously conserved ammonium and, to a lesser extent nitrate, are diluted with melted ice and mixed with freshly mineralized ammonium [213]. In general, the concentration of total dissolved nitrogen increases significantly in the early stage of thermokarst and decreases in the late phase [125,213,292] in association with decreasing SOC and total N [125]. A higher bioavailability of nitrogen at early stages is also indicated by early colonization of RTS by nitrophilous grasses (e.g., Alopecurus alpinus) [213,294]. The imbalance between the C/N ratio of resources (bulk soil) and microorganisms indicates greater microbial N limitation at the late stage [125].
The following summarized results are organized by major geographic region: In studies from America Northwest, it was found that not only DIN content, but also its composition and microbial N turnover rates depended on RTS stabilization. Young RTS soils (about five years after disturbance) showed equal amounts of ammonium and nitrate, but in older stages stabilized by revegetation (up to 150 years), only ammonium was found, in contrast to undisturbed sites where no DIN was detectable [292]. In conjunction with the highest DIN content, young RTS soils showed the highest gross N ammonification rates (280 ± 150 µg N dw−1 d−1 in soil incubations, −10–2 °C, six days [292]). Since the addition of vegetation leachate only increased the phosphorous content of microbial biomass but not C and N mineralization, the organisms seem to be limited to phosphorous and not to C and N [292]. In contrast, in the Canadian Arctic, Tanski et al. [213] found a decrease in ammonium and an increase in nitrate content with the progress of stabilization and revegetation. High nitrate concentrations were found primarily in fast-flowing mudflows and cracked surfaces, which are likely to have more oxygen. Larger nitrate pools in older, revegetated retrogressive thaw slumps than in younger thermokarst features could be additionally caused by colonization by N-fixing plants such as green alder and soapberry (Astragalus, Oxytropis in ref. [294], Sheperdia canadensis (L.) Nutt. in ref. [291]). However, other studies reported despite higher DIN contents in disturbed soils from thermo-erosion gullies, there were no differences in net N mineralization and N nitrification rates with median values around zero [29]. However, higher potential nitrification rates and suppressed denitrification were observed in the same thermo-erosion gullies than in undisturbed soils. In contrast to in situ measurements, model simulations of recovery from thermal erosion disturbances in the Alaskan tundra have assumed that nitrification is negligible since inorganic N availability is limited and ammonium released in the non-vegetated stage is immediately immobilized with only low inorganic losses instead of high DON losses [67]. At a thermo-erosion gully in Greenland, low DIN, negligible net nitrification, and negative net N mineralization were observed with slightly higher nitrification at disturbed sites [69].
At thermo-erosion gullies of the Tibet Plateau, DIN availability also depends on the age of the disturbed landform. The highest nitrate concentrations were found at the early vegetated stage (three years after collapse) with 2.7 ± 0.6 µg NO3−-N g dw−1 and at the exposed bare site with 4.5 ± 0.4 µg NO3--N g dw−1 in contrast to the low nitrate content at the older disturbed site and the undisturbed control site with intact vegetation cover [218].
In addition, RTS formed in the ice-rich Yedoma permafrost riverbanks in northeastern Siberia were found to have the highest ammonium content in recently thawed bare sediments (35.3 ± 8.2 µg NH4+-N g dw−1), but highest nitrate content after stabilization and revegetation (0.7 ± 0.3 µg NO3−-N g dw−1, RTS Lena River [87]; Table S1). When differentiating between subsides, soils of thaw mounds in particular had increased nitrate content with a higher DIN/DON ratio (means of all sites 27.7 ± 36.3 µg NO3−-N g dw−1, 0.4 ± 0.6 µg NH4+-N g dw−1, 4.9 ± 3.0 data of one site see at Table S1)). In contrast, mixed Holocene and Pleistocene sediments at the slump floors were mainly enriched in ammonium and had a lower DIN/DON ratio (means of all sites 8.3 ± 15.3 µg NO3−-N g dw−1, 9.4 ± 7.7 µg NH4+-N g dw−1, 0.8 ± 0.8, data of one site see at Table S1 [256]).
3.2.3. Gaseous N2O Loss and Based Microbial N Processes
Hillslope thermokarst landscapes have only recently been identified as a significant source of gaseous N losses in form of the GHG N2O. Abbott et al. [264] provided initial evidence and measured elevated N2O concentration in thermokarst features in upland soils in northern Alaska. In addition, N2O emissions were detected in thermokarst-affected soils of the Tibet Plateau. Exposed non-vegetated sites of thermo-erosion gullies with low soil moisture (~40%) emitted significantly higher amounts of N2O (72.60 ± 2.42 mg N2O-N m−2 d−1 in August) and CH4 (41.47 ± 12.10 mg CH4 m−2 d−1 in August) than in the vegetated parts of the thermo-erosion gully, but less than in the undisturbed, vegetated adjacent soils [277]. At a comparable site, but with higher soil moisture (~67%), differentiation in a thaw sequence showed the highest N2O emissions three years after initial disturbance ((1.97 ± 0.32 mg N2O-N m−2 d−1, 100 fold increase and 0.12 ± 0.01 mg N2O m−2 d−1, seven-fold increase from non-vegetated and vegetated sites in contrast to undisturbed sites, respectively [218]). However, in the middle (12 years) and late (20 years) stages, N2O emissions decreased and were comparable to undisturbed sites (0.017 ± 0.01 mg N2O-N m−2 d−1, [218]). N2O fluxes correlated positively with nitrate concentration and negatively with water content [266]. Significant correlations were also found with microbial parameters: N2O flux correlated positively with the copy number of denitrification genes (nirS but not nir K, nitrite reductase) and negatively with the abundance of the gene encoding N2O reduction (nosZ, N2O reductase). Overall, about 80% of the variability in N2O fluxes was explained by substrate availability and denitrifier gene abundance [218]. High N2O fluxes at the young stage (instead of N2) and low nosZ abundance (better expressed by the ratio of nirS + nirK/nosZ) were explained by lower pH (around five) at these sites, which suppresses N2O reductase similar to bare peat soils. CH4 was also emitted at the same site. However, in contrast to N2O emission, the highest CH4 fluxes (1.3 ± 0.5 mg CH4 m−2 d−1) were found at the late stage (20 years after collapse), associated with the highest amount of methanogen gene (mcrA, [266]). The global warming potential of N2O emissions after thermokarst formation was about 60% of CH4 emissions on a decal scale.
In addition, two RTSs on two major rivers of northeastern Siberia, namely Lena and Kolyma, in the ice-rich Yedoma permafrost region showed significant but highly variable N2O emissions. However, in contrast to the findings on the Tibet Plateau, the highest N2O emission rates (median 0.55 (0.13–6.29), mean 1.64 ± 2.61 mg N2O-N m−2 d−1) were found after drying (WFPS = 42–84%, mean of 60 ± 8), stabilization, and revegetation of slope sediments and emissions were significantly higher than at undisturbed soils and freshly thawed bare slumps [87] (Table 1 and Table S2, Figure 5A,B). Based on measured N2O emissions, N2O loss under optimal conditions may be 54.8 mg N2O-N m−2 per year, which is 0.14% of the initial inorganic N content of exposed Yedoma [87]. Marushchak et al. [87] reported from bare, disturbed slump floor sites with high water content (WFPS ≥ 67%), but also undisturbed, dry sites (WFPS = 6–15%, mean of 13 ± 6) an N2O uptake [87] (Table 1 and Table S2, Figure 5B) being in contrast to a study at the same site where even non-vegetated bare slump with intermediate water content (WFPS of 63%) had significant in situ N2O emissions (2.03 ± 1.39 mg N2O-N m−2 d−1) [256]. High N2O emissions on slump floor sites were detected only with measurable nitrate content (RTS Lena River [87]; Table S1). However, not only nitrate, but also water content might play an important role. On dry thaw mounds at another site, no N2O emission was detected at high nitrate content (39.4 ± 44.1 µg NO3−-N g dw−1), probable due to the lack of anaerobic microsites for denitrification (bare and moss-covered, WFPS~50%, RTS Kolyma River).
The net mineralization and net nitrification rates of slump floor soils measured in laboratory incubations increased with the thaw stage of RTS in Siberia. The lowest rates were observed on undisturbed, vegetated control sites (C/N 38), followed by young, non-vegetated disturbed sites (C/N ~15, both mainly with negative rates), and the highest rates were observed on revegetated, stabilized sites (gross N mineralization 15.1 ± 10.1 µg N g dw−1 d−1, net N mineralization 4.0 ± 4.9 µg N g dw−1 d−1, net nitrification 1.6 ± 1.5 µg N g dw−1 d−1, in aerobic incubations 4–5 °C, Table 1 and Table S1 [87,256]). Comparing of slump floor and thaw mounds soils, both sites showed similar net N mineralization in aerobic slurry incubations (Table 1 and Table S1, [256]). Strong positive correlations were observed between in situ N2O fluxes and net mineralization and net nitrification rates, whereas no correlation was found between in situ N2O fluxes and gross N mineralization rates [87].
Laboratory incubations confirmed the spatial in situ N2O emission pattern with higher N2O production under anoxic conditions, suggesting denitrification as the main source [87]. The highest anoxic N2O production rates were found on revegetated slump floor with rates up to 2.8 ± 1.8 µg N2O-N g dw−1 d−1 (WFPS 52 ± 9%) in contrast to undisturbed sites (0.01 ± 0.00 µg N2O-N g dw−1 d−1, WFPS 13 ± 6%, both with acetylene at 5 °C for six days [87], Table 1, Tables S1 and S2, Figure 5E,F). In contrast, in another study at the same RTS, N2O production was detected only on one bare slump floor site (0.02 ± 0.05 µg N2O-N g dw−1 d−1, WFPS 52–67%) and was high at all thaw mound sites (mean 0.07 ± 1.0 µg N2O-N g dw−1 d−1, WFPS 45–74%, in anaerobic laboratory incubations at 4 °C, 40 days [256]). In the same incubations, higher anaerobic CH4-production was observed in the slump floor than in the thaw mounds with only negligible CH4 production. After the addition of nitrate (110 µg NO3−-N g dw−1), which removed the probable N limitation, the two sites responded differently. Thaw mounds with old Yedoma material showed a decrease in anaerobic N2O production (probable due to N2 formation) [256], but a sharp increase in N2O production was observed in mixed slump floor samples ([87], with the highest rates of about 3.3 ± 0.4 µg N2O-N g dw−1 d−1 in ref. [256]). In all incubations, CH4 production was only detectable when N2O production was absent or very low, and after nitrate was added, CH4 production disappeared in slump floor samples, both suggesting that increased DIN availability could affect methanogenesis at sites affected by thermokarst.
N turnover and increases of N2O fluxes at different thaw stages of the RTS were accompanied by increases in the relative abundance of functional genes for nitrification, denitrification and dissimilatory nitrate reduction [87]. Ammonia oxidation functional genes, measured as total amoA, increased from 0.5 ± 1.0% and 1% in undisturbed soils (and freshly disturbed soils) to approximately 3.4 ± 1.0% and 7% in revegetated slump floor, in terms of captured functional N genes and total 16S rRNA, respectively (Table 1, Tables S1 and S2, Figure 5G,H). In contrast to an increase of bacterial amoA, there was no increase in archaeal amoA (Table 1 and Table S1). In addition to the nitrification genes, the functional genes of denitrification, nirS + nirK of nitrite reductases, increased from 15% to 29% (in % of functional N genes) with the increase of the ratio (nirS + nirK)/nosZ (Table 1, Tables S1 and S2, Figure 5G,H). However, there was no increase in norB (NO reductase). In addition, the functional gene of dissimilatory nitrate reduction DNRA, nrfA increased from ~1.8 to 3.2% (in % of captured functional N genes).
3.2.4. Lateral N Loss
High DIN availability in hillslope thermokarst landscapes may lead to lateral N losses to aquatic systems. Recent studies show that Arctic thermokarst features are hotspots for dissolved N losses and increase nutrient loading to wetlands, rivers, and lakes, which could stimulate primary production [29,88,208,211,212,264,281]. Thermokarst abruptly releases nutrients, temporarily increasing aquatic nutrient availability while decreasing terrestrial stocks [238]. Increased and sustained inorganic N leaching of ammonium, and in some cases, of nitrate was observed in thaw slumps, thermo-erosion gullies, and active layer detachments in thaw streams, rivers, and oceans compared to undisturbed areas. In addition, DON and other nutrients such as sulfate, phosphate, potassium, calcium, and magnesium were also leached [28,208,210,211,212,213]. It has been shown that nutrient leaching can continue for several decades after disturbance, but this varies on a regional scale and depends on the type of feature, age of the landscape, and season [29,211,212,264]. Nitrate output decreased in older, stabilized thermokarst features [264] and reached its maximum at the end of the season [212]. Isotopic evidence indicates that nitrate is effectively retained or removed by organic soils in undisturbed watersheds, in contrast to disturbed watersheds with large areas of mineral soils. Unlike organic soils, mineral soils facilitated the export of nitrogen from nitrification processes, while less N was immobilized by vegetation or removed by denitrification [211].
Total N release from thawing permafrost at an ice-rich Yedoma permafrost riverbank RTS in the central Lena River Delta in northeastern Siberia (with a length of 1.7 km) was estimated 1.7 kg N m−2 y−1 and associated with an inorganic N release as ammonium of 39 g N m−2 y−1 (between 2012 and 2019, [87]). This is a remarkably high amount of added N compared to the major external atmospheric N inputs by BNF (20–2000 mg m−2 y−1 [53,59,60,61] and N deposition (<200–300 mg m−2 y−1 [62,63]). This highlights the importance of thawing permafrost as a source of nutrients. At another 1.7 km long Yedoma cliff in the Lena Delta, 400 t N were eroded annually between 2015 and 2018 [281]. For an RTS along a riverbank in Yukon, Canada, with an area increase from 6000–10,000 m2, a total N loss of about 19.3 t per year was found over a three-year period [298].
In summary, these results show that disturbance on hillslope thermokarst landscapes can be substantial sources of N2O and DIN. Thawing of collapsed soils increases inorganic N content, N turnover rates, abundance of functional N genes, and N2O production only when optimal moisture conditions allow simultaneous aerobic processes for nitrate production and anaerobic processes for N2O production. Sub-sites of RTS, such as slump floor and thaw mounds, appear to have different levels of N availability. In particular, ammonium content at slump floors indicates the second level of N availability (Figure 2II), while high nitrate availability associated with high N2O production indicates the third level, the N hotspot (Figure 2III). In situ nitrate limitation of slump floor, unlike thaw mounds with typically high nitrate content, can be eliminated by leaching, which can increase total N2O loss [256].
3.3. Bare Soils in the Transition between Terrestrial and Aquatic Ecosystems
In the transition zone between terrestrial and aquatic ecosystems, young, initial soils without vegetation in floodplains have been formed by continuous fluvial deposition and erosion by river or the sea and are therefore often disturbed [11]. Preliminary evidence of N forms and microbial N-based processes suggest that these soils are likely N hotspots with high N availability. Alluvial soils on lakeshores and riverbanks of Arctic river deltas and coasts have deep active layers and relatively high soils temperatures, with large variations in soil properties like hydromorphology [299,300,301]. Soils in, e.g., the Lena River delta in northeastern Siberia, are stratified with layers of silt loam and sand containing low but more degradable allochtonic SOM [38,39,302,303,304].
Figure 5.
Biochemical traits of (A,C,E,G) N hotspots with high N availability and (B,D,F,H) adjacent control sites with N limitation using one described site as an example. (A,B) water-filled pore space (WFPS), C/N ratio (C,D) dissolved inorganic nitrogen (DIN, ammonium + nitrate), ratio of DIN to total N (DIN/TN) and nitrate. (E,F) microbial net N turnover: N mineralization, nitrification, denitrification, and (G,H) abundance of genes of key functional enzymes of nitrification (amo, ammonia monooxygenase in % of 16S rRNA and **log10 gdw−1), denitrification (nirS + nir K, nitrite reductases in % of 16S rRNA, *% of N genes and **log10 gdw−1) and (nirS + nirK)/nosz ratio (nitrite reductase/N2O reductase *** × 103) in subarctic bare (BP) and vegetated peatland (VP, references see Table 1), Arctic retrogressive thaw slump (RTS) and undisturbed site (URTS, references see Table S1), thermoerosion-gully (TEG) and undisturbed site (UTEG) on the Tibet Plateau [218], Arctic bare alluvial soils (AS) and vegetated floodplain (VP) [119,302,304] and animal-influenced permafrost affected soils of the Arctic (AIA) [234] and Antarctic (AIAA) [188,189,236] and non-influenced soils of Arctic (NIA) and Antarctic (NIAA). For more detail, see Table S2.

The nitrogen content of these soils varies between 0.3 and up to 1.4 kg m−2 [303]. Differences in frequency and duration of flood events can affect nitrogen cycling by creating temporal mosaics of oxic and anoxic conditions that are susceptible to nitrification and denitrification processes [305]. At a beach site on a Holocene terrace in the Lena Delta on Samoylov Island (Figure 3D), the alluvial soils are predominantly pH neutral with narrow C/N ratios (around 15). High inorganic nitrogen concentrations (>2 µg N g dw−1) were found in high amounts only in non-vegetated soils in sandy loam layers with more than 2% SOM. DIN quality changed during the summer season from mid-July to late August, with ammonium decreasing and nitrate content increasing to high levels of 89 ± 57 µg N g dw−1 (about 4.6% of TN) [302]. Therefore, nitrate content is comparable to known N hotspots [86,87,120,218] (Figure 5C, Table S2). In bare soils, DIN content correlated with a high potential net N mineralization (1.7 µg N g dw−1 d−1, 20–25 °C, [304]) and substrate-induced net nitrification rates (13.0 ± 0.3 µg N g dw−1 d−1, in situ temperature with mean of 5.2 °C, [119]). Both N turnover rates are in the range of the previous described N hotspots as RTS (for nitrification even five-fold higher [87], Figure 5E, Table S2). In contrast, only low microbial N turnover rates were observed at sparsely vegetated or non-vegetated beach sites (Figure 5F). Nitrification rates were performed by ammonia-oxidizing bacteria (AOB) rather than by archaea (AOA) and correlated with the abundance of the functional gene amoA of AOB but not AOA. The gene amoA accounted for 4.8% of 16S rRNA at bare sites, in contrast to 0.7% of vegetated sites [119], which is almost equal to the proportion detected at N hotspots of RTS [87] (Figure 5G, Table S2). All these biogeochemical traits indicate that these soils may have potential for N losses, but there was only preliminary evidence that these soils leach inorganic nitrogen into the Lena River or release N2O (aerobic N2O production in incubations [304], Figure 4D). Temperature elevation experiments on enriched Nitrosospira-like AOB showed that heating increased ammonia oxidation rates with Q10 values of about 4 (12–22 °C, with highest nitrifying activity at 22–30 °C). In contrast to these alluvial soils with SOM content lower than 2%, the bare riverbank sands of a neighboring island, which receive meltwater from the thawing Yedoma exposure, had only negative net microbial N turnover and negligible N2O fluxes, but significantly higher than the adjacent vegetated Holocene soils [87].
In addition to alluvial soils on beaches, there was further evidence of high N availability in bare soils sampled on vertical cliff faces. Soils containing high DIN content were measured, along with high potential net mineralization, nitrification rates, as well as aerobic N2O production [119,302,304]. On bare lakeshore soils in an Antarctic dry valley, high ammonium levels (300 µg N g dw−1) but only low nitrate levels were found in combination with high variable in situ N2O emission rates (highest rates: 1.49 mg N2O-N m−2 d−1, [306]) associated with high nitrification rates [307], indicating another likely N hotspot. High N2O emissions reduced CH4 emissions at this site [306].
3.4. Animal-Influenced Soils
Studies over the last decade have shown that animals, particularly seabirds in the Arctic and penguins and marine animals in the Antarctic, increase the input of external nitrogen in permafrost-affected soils through excretions. This external N input enhances the described traits of high N availability and is associated with N2O emissions (Figure 4E). A comparison of two cliffs inhabited by seabirds in the European High Arctic revealed that the cliff with higher bird density had higher in situ N2O fluxes (mean 0.40 ± 0.24 mg N2O-N m−2 d−1), which correlated with high potential denitrification rates (96 µg N g dw−1 d−1, 10 °C with acetylene) and high abundance of functional denitrification genes (nirS, nirK and nosZ) (Figure 5A,E,G, Table S2, at BL T-M site of [234]). In addition, these animal-influenced soil sites had higher nitrate (2270 µg N g dw−1) and ammonium contents (6 µg N g dw−1), lower C/N (~10), and higher δ15N in bulk soil (max. 19.4‰) compared to the other bird cliffs without N2O emissions and compared to the non-influenced tundra soils (Figure 5A–D). However, as soils far from bird colonies had low DIN and low δ15N contents in bulk soil and also did not emit N2O, but had high gene abundance of denitrifiers and denitrifying activity, soil N forms might be a better indicator of high N2O emissions than microbial traits for animal-influenced soils.
In addition, in maritime Antarctica, highly animal-influenced soils had comparably high N2O emissions (mean of penguin, seal and skua colony sites 0.22–0.88 mg N2O-N m−2 d−1 with mean of 0.38 ± 1.15 mg N2O-N m−2 d−1 of active penguin colony [236]), in contrast to the animal-lacking tundra (Figure 5A,B, Table S2, [235,236,237]). In addition, these animal-influenced soils had higher ammonium and nitrate content (e.g., with mean values of 55.4 ± 24.2 µg N g dw−1 and 90.2 ± 49.1 µg N g dw−1, respectively in penguin colony [236]), higher abundance of functional genes, and higher activities of nitrifiers and denitrifiers than uninfluenced soils [188,189] (Figure 5C,D,G,H, Table S2). Nitrogen input by animals increased the abundance of bacterial ammonia oxidizers (AOB amoA) and potential ammonia-oxidizing activity (e.g., mean value of 1.3 ± 0.3 µg N g dw−1 d−1 penguin colony, 24 h, 15 °C, Figure 5E,F), which was correlated with AOB amoA abundance, but decreased the abundance of archaeal functional genes (AOA amoA) [188]. The higher abundance of functional denitrification genes (nirS + nirK) and activities (e.g., mean value of 3.7 ± 2.8 µg N g dw−1 d−1 in penguin colony, 8 h, 10 °C) in ornithogenic soils indicate that nirS-encoding denitrifiers dominate in contrast to adjacent tundra soils [189] (Figure 5E–H, Table S2).
3.5. Wildfire-Affected Soils
Wildfires have rarely affected tundra permafrost soils of late, but they have increased in recent years and will increase rapidly with climate change [11,308,309,310]. Fires in boreal ecosystems and their effects on N availability, particularly short-term increases in DIN, have been studied more frequently, but data on N turnover, the abundance of N-cycling microorganisms, and N2O emissions in post-fire soils are scare [140,311,312]. In tundra ecosystems, wildfire effects on N availability are less studied, mainly in a single case, the largest fire in the Alaskan Arctic (2007) [238,313,314]. Fire increases the depth of active layer, even years after the fire [238,308], can cause thermokarst [315], remove vegetation, and alter nutrient status through combustion and ash residuals [313,316]. Recovery of the tundra ecosystem after wildfire is strongly influenced by nutrient losses from post-fire leaching and volatilization. In situ measurements [316], simulation of long-term recovery [317] and incubations experiments revealed high DIN content in soils with up to 14-fold increase in nitrate and four-fold increase in ammonium content [318] in the first few years after the fire. In addition, in the adjacent watersheds DOC, TDN and TDP were three times higher and ammonium was four-times higher, while nitrate content was lower even four years after the fire event [319]. Ten years after fire disturbance, watersheds did not have significantly elevated inorganic N anymore, but did have elevated dissolved organic nutrients (increase of 25% and 59% for organic C and N, respectively), and two to ten times higher lateral N flux than BNF and N deposition [238]. In situ measurements and long-term simulations showed that C and N contents (DIN, DON, SOM) decreased in soils disturbed by wildfire due to continuous loss [317]. For example, total ecosystem C stocks decreased by 5.7–31% and N stocks decreased by 34–18% within a decade in moderately and severely burned areas compared to unburned sites [238]. In contrast, low-intensity experimental fire did not affect soil C, N or P pools, but 15N labeling experiments showed an increase in N retention in the residual soil N pool due to increased microbial N assimilation in the dry heath tundra of western Greenland [320]. In this experiment, a three-fold increase of post-fire soil N2O emissions (5.54 ± 1.09 ng N2O-N m−2 d−1) under wet conditions with WFPS of 70% and a 51-fold increase of potential denitrification activity (0.84 µg N g dw−1 d−1, 10 °C with acetylene) were observed [318]. Fire makes nitrogen available by bypassing the N mineralization step rather than through the loss of vegetation [318] or through supply from external sources (BNF, N deposition, [317,321]). In long-term simulations, N mineralization was about 350% higher 200 years after fire than on control sites (46.6 mg N m−2 d−1). Higher DIN levels in soils and watersheds and simulated higher N mineralization are preliminary indications that burned permafrost soils are likely short-lived hotspots of N availability where microbial nitrification and denitrification rates and N2O emissions are likely elevated.
4. Hotspots of N Availability and Climate Change
4.1. Contribution of N Hotspots to Climate Change
As shown in the last chapters, hotspots with higher N availability are characterized by a more open N cycle and N imbalance caused by lower N immobilization compared to N mineralization, resulting in higher N susceptibility to vertical and lateral N transport. Therefore, hotspots of N availability have an important influence on climate change (1) directly through the formation of the potent GHG nitrous oxide (N2O) and (2) indirectly through dissolved N losses and N transport, which affect the C balance, C source functions (SOM decomposition and GHG emission of CO2 and CH4), and C sink functions (C uptake and storage) on-site or off-site of N hotspots.
As recently reviewed by Voigt et al. [82], vegetated permafrost-affected soils are generally small but distinct sources of N2O during growing season with a mean 150 ± 420 µg N2O-N m−2 d−1. Bare soils emitted significantly higher amounts with a mean of 1025 ± 1727 µg N2O-N m−2 d−1 (and all sites together with a mean of 288 ± 858 µg N2O-N m−2 d−1). Therefore, N2O fluxes from N hotspots summarized in this review, 1980 ± 3190 µg N2O-N m−2 d−1 from bare surfaces on permafrost peatlands, 1640 ± 2610 µg N2O-N m−2 d−1 from disturbed but revegetated RTS (Table 1), 1970 ± 320 µg N2O-N m−2 d−1 from thermo-erosion gully on the Tibet Plateau [218] are remarkable N sources. Voigt et al. [82] calculated that all permafrost regions could be a source of 0.14–1.27 Tg N2O-N y−1 (each calculated with mean), corresponding to 0.8–7.1% of the current global N2O-N budget (but not including currently found N2O emission of RTS). Recent estimates of N2O emissions at the pan-Artic scale using a terrestrial ecosystem model are twice as low [322], but in perspective of this review this seem to be an underestimate, as the representation of N cycling processes in high latitude soils in process models is still not fully developed. All in all, great uncertainty remains regarding the magnitude of N2O emissions from natural ecosystems [323]. Since the described hotspots of N availability are significant sources of N2O, they can contribute significantly to climate change [83]. Therefore, due to increased N2O emissions, N hotspots can have high non-C feedback on climate warming. The first back-of-the-envelope extrapolation of data from bare peat circles at a Russian study site to the entire Arctic suggests that emissions from these hotspots could be ~0.1 Tg N2O-N y−1, representing 4% of the global warming potential of Arctic CH4 emissions [214] and about 1% of natural N2O sources [324]. In mesocosm laboratory experiments involving these bare peat circles, N2O emission was 14% of CO2 emission under dry conditions [223]. More recently, bare peat soil circles have been described as likely sources of the atmospherically reactive gases nitric oxide (NO) and nitrous acid (HONO), which may therefore also play a critical role in N hotspots affecting atmospheric chemistry and climate [255]. For the hillslope thermokarst landscape types in the northern permafrost region, the upper end of pan-Arctic N2O emissions can be estimated using in situ N2O emissions (with a median of 54.8 mg N2O-N m−2 per year [87]) and area estimates of all three thermokarst landscape types at 0.91 × 10⁶ km2 [270]. This would be a maximum of N2O emission of ~0.05 Tg N2O-N y−1. This is about half the calculated N2O emissions from the N hotspot in bare peatland in the discontinuous permafrost region, but it does not include N2O emissions from hillslope thermokarst at the Tibetan plateau. The additional N hotspots proposed here, i.e., alluvial, animal influenced, and wildfire-affected soils, could have further implications for the global N2O budget due to their greater spatial extent.
In addition to gaseous loss, hotspots of N availability contain high amounts of inorganic N. In particular, alluvial soils likely leach dissolved N into adjacent N-poor terrestrial or aquatic ecosystems, as was observed on the hillslope thermokarst features. The relative location, timing, and magnitude of N release will likely determine whether these N fluxes are used by plants or organisms in the soil or are susceptible to transport [55]. Since N is a highly demanded nutrient by primary producers and SOM decomposers, it regulates ecosystem C cycling, determines whether permafrost soil functions as a net CO2 sink or source, and regulates microbial mediated CH4 production and emissions. However, how and to what extent nutrient availability affects the C balance in permafrost-affected ecosystems remains unclear today [47,50,52,55,89,90,91,92,93,94,95,96]. In general, the short-term change of SOM decomposition by addition of (in)organic forms is referred as priming effect [325]. However, reactions on N addition to permafrost-affected soils or stream water were contradictive and no, positive (increase of SOM decomposition) or negative priming (decrease of SOM decomposition) effect depending on extend of N limitation and SOM degradability was reported [52,71,125,326,327,328,329]. A positive priming effect was observed in C limited mineral and cryoturbated subsoils as microbes were investigated for their additional N in the production of extracellular enzymes to degrade SOM (N mining) [52,326,329]. In another study, the microbes invested additional N in their own growth instead of enhancing the degradation of SOM (negative priming) because their N requirements were met by N addition obviating the need to produce enzymes that degrade carbon-nitrogen compounds [330,331]. A negative priming effect was also found in disturbed permafrost soils with high N availability on the Tibetan Plateau [125]. Whether SOM degradation is enhanced by N is not clarified yet and depends on other nutrients such as phosphorous, as well as many environmental factors, such as soil minerals, acidity, redox state, water availability, vegetation cover, and changes in soil microbiome composition and functions [327,332,333,334]. Recently, model simulations including the mineral N pool locked within the permafrost have shown that uptake of additional nitrogen from thawing permafrost reduces N limitation of vegetation, resulting in a negative feedback on climate by slowing the rate of increase of atmospheric CO2 [335]. In contrast, the effect of N availability on net CH4 flux in permafrost-affected ecosystems is poorly studied [204,336,337,338]. Increased N availability could remove the N limitation of both methanogenic and methanotrophic microorganisms thus promoting both processes [339,340,341]. In contrast, CH4 production is inhibited by higher DIN content due to competition with denitrifiers and denitrification intermediates are toxic for methanogens and methanotrophs [11,339,342,343,344,345,346,347]. Nitrogen fertilization experiments stimulated N2O emission from Arctic soils [163,203,204] or had no effect [227,336] and increased NO [348].
It is not clear whether higher C release or uptake is induced by higher N availability at the hotspots described. Despite higher N availability, bare peat soils of permafrost peatlands usually had low net CO2 emissions than adjacent vegetated sites on peat plateau-which act as CO2 sinks [250], although soil microbial heterotrophic respiration, estimated using, e.g., an in situ 14C partitioning approach, was similar or lower in bare peat plateau than in vegetated surfaces [223,242,244]. However, the well-drained bare peat plateaus act as CH4 sinks or small sources in contrast to the surrounding waterlogged fens [223,252], and even in deeper water-saturated soil layers CH4 production is suppressed by nitrate content, which promotes N2O production [247]. Overall, bare peat surfaces apparently function as net C sources due to higher CO2 losses and little or no CH4 emissions. No clear effects on ecosystem respiration and CH4 fluxes were found for hillslope thermokarst N hotspots, with CO2 and CH4 release lower, similar, or higher than undisturbed sites depending on thermokarst stage, vegetation, and moisture conditions [88,257,277,286,287,297], but CH4 production was detected only in the absence of N2O [88,256]. Atmospheric CO2 uptake ceases when the vegetation cover is disturbed, but on the other hand, once stabilized, highly productive pioneer plants that feed on the nutrients released when permafrost thaws rapidly colonize these disturbed sites. Higher N availability in a Tibetan thermo-erosion gully had a negative priming effect caused by increased microbial metabolic efficiency, thus reducing carbon loss as CO2 [125].
4.2. Impact of Climate Change on N Hotspots
Permafrost regions are affected by drastic changes due to anthropogenic-induced climate change [11,97,98] with the average air temperature in the Arctic increasing by twice the global average over the past 100 years—Arctic amplification—which has serious ecosystem implications [349,350]. In addition, the fastest changes in temperature and precipitation are predicted to occur along the coasts of Arctic Ocean [270,351], affecting soils in the transition between terrestrial and aquatic ecosystems, particularly N hotspots on thaw slumps and alluvial soils. Furthermore, temperature increase favors thermokarst processes [99,100], leads to higher soil temperature, gradually deeper summer thawing of the active layer, loss of permafrost [5,352,353], and affects vegetation by lengthening the growing season [354] and shifting plant cover [355]. In addition, warming enhances soil microbial processes and causes changes in microbial communities [139,334,356,357,358,359]. Therefore, changes could directly increase the activity and abundance of microbial driven N processes and organisms, primarily by increase of temperature [119,155,196]. These studies showed that experimental warming increased nitrifying activities, and that most enriched nitrifiers were cold-adapted rather than psychrophilic. Thawing of permafrost releases long-stored SOM, and climate changes can accelerate decomposition processes that serve as source of C-containing GHG CO2 and CH4 [93,265,352,354,360,361,362,363,364], as well as N2O [82], further contributing to global warming through positive feedback processes [365].
There is evidence that climate change and associated permafrost degradation in tundra ecosystems increase N availability [15,45,108], partly through increased N mineralization due to temperature rise and lengthening of the growing season [75,78,102,104,366,367] and partly through the release of inorganic N from thawing permafrost [28,55,75,103,213]. The described hotspots of N availability may therefore illustrate how climate change will affect microbial N cycling in permafrost-affected ecosystems. Increased N availability combined with extremely biodegradable carbon inputs from permafrost degradation could increase N2O emission by providing substrates for microbial processes in combination with reduced plant demand [219,322]. In frozen permafrost samples, N cycle genes were generally present and increased after thawing, but there may be higher potential for N2O emissions due to the lack of a functional gene for converting N2O to N2 (nosZ gene) [139]. Recently, a meta-analysis has shown that experimental warming alters biogeochemistry in cold ecosystems, increasing N mineralization rates and N2O emissions, but does not affect N fixation and thus further N input [102]. The changes described are more closely linked to enzyme activities than to changes in the abundance of functional nitrification and denitrification genes or the total abundance of archaea or bacteria. Therefore, the activities of N-cycling organisms, which are used as traits for N availability, might be more affected by climate change than their gene abundances. Recently, it has been shown that climate induced N loss, combined with enhanced CO2 enrichment and an increased N demand by plants, is leading to a global decline of N availability of non-agricultural soils [105,368]. Initial evidence for a decline of N availability in permafrost-affected ecosystems was provided by a decline in δ15N in Arctic lake sediments [369], in wood rings of shrubs due to warming [370], and in leaves on a transect in the Tibetan Plateau due to increased N loss [95].
Climate change could have differential effects on the areal extent of N hotspots by reducing the extent of palsa and peat plateau areas due to palsa collapse and increasing thermokarst at hillslope landscapes. Reconstruction of habitat changes during the Holocene of subarctic peatlands in Fennoscandia indicates that bare permafrost peatlands had the greatest spatial extent about 2000 years ago and then declined [243]. Satellite data have shown that bare areas in Fennoscandia have decreased by about 20% within a decade (2007–2015, area of about 1 kha [243]) and in northern Norway by 33–71% over the past 60 years (1950–2010, area of 11 kha [371]). In addition, bioclimatic models have shown that Fennoscandia is no longer predicted to have a suitable climate for palsa and peat plateau by 2040 [372]. As a consequence, N hotspots in permafrost peatlands may be lost in the near future and degraded wet peatlands may instead act as N2O sinks [82,86,214]. However, large spatial variations are expected in permafrost peatland development, which may also lead to landscape desiccation [373] and thus displacement of other likely N hotspots. In contrast, hillslope thermokarst landscapes, particularly affected by RTS, have increased by 331% over the last two decades in northern Siberia [374] and by 617% over the past decade on the Tibetan Plateau [278] and will increase in area from 0.1–3% in permafrost region between 2000 and 2300 [99]. The expansion of the area will likely result in higher releases of N2O and nutrients, both of which are likely to provide positive climate feedbacks. In addition to the known N hotspots, the area of the likely alluvial N hotspot could also change due to sea level rise, and wildfire-affected soils will increase due to the projected increases in wildfire in the Arctic tundra [238,309,375,376], meaning that the spatial extent of both potential N2O hotspots will change.
Preliminary direct results from climate manipulation studies indicated that climate change might lead to increased N losses from bare peat soil circles. In laboratory experiments on thawing peat cores from bare and vegetated palsa surfaces, higher N2O release was observed in a dry scenario, representing a gradual deepening of the active layer, than in a wet scenario, representing a complete collapse of the palsa [248]. When gradual thawing reached the upper permafrost layer, the N2O emissions from bare peat increased fivefold compared to the fluxes during thawing of the active layer. The presence of vegetation did not prevent thaw-induced N2O release under dry conditions, in contrast to waterlogged conditions [248]. Since ammonium began to accumulate in the mesocosms immediately after thawing at the interface between active-layer and permafrost only in the dry scenario, N mineralization from freshly thawed peat appeared to be a longer-term major source of N2O [248]. The same authors showed the first in situ evidence for increasing N2O emissions upon warming of bare peat sites as well as vegetated peat surfaces [247]. Therefore, climate change will not only alter the area of certain N hotspots, but may also lead to increased N2O emissions from existing hotspots. However, these changes are highly dependent on the magnitude and direction of changes in hydrology and soil moisture content. In these experiments, in addition to N2O, CO2 emission increased after thawing regardless of moisture, and thawing also increased CH4 uptake under dry conditions (but remain neutral at higher moisture) [223]. Altogether, climate change that increases drought, heat, and vegetation stress on bare peat soils in particular could lead to higher GHG emissions, as suggested by bioclimatic model stimulations for palsa and peat environments [377,378]. In general, permafrost peatlands will be affected by climate change, as recent climate models shown. Using a modeled global warming stabilization scenario, Hugelius et al. [33] estimate that the current carbon sink of northern peatlands will be transformed into a carbon source when 0.8–1.9 million km2 of permafrost-affected peatland thaw, mainly through enhanced CH4 emissions, slightly enhanced CO2 emissions, and minor N2O losses, but they also predict losses of peat to fluvial systems of 0.4–09 Pg N. In addition, the simulation of increased N availability due to probable climate change by adding nitrate to disturbed soils of bare peatland soils and RTS resulted in increased N2O emission in incubation experiments of the described N hotspots [87,253,256]. Thus, if N availability from N hotspots increases, this could further increase N2O emissions. Overall, it is not yet clear how climate change will directly affect the biogeochemical properties of thermokarst sites through temperature or changes in moisture, but it could have a significant impact on the N cycling, as exposed sites on Yedoma in particular have high levels of inorganic N and labile organic matter, which increases N availability [42].
5. Conclusions and Perspectives
In the last two decades, certain sites in permafrost-affected soils have been identified as important sources of the potent greenhouse gas N2O (reviewed in [82]) and as sites of inorganic N leaching [28,210,213], both of which are associated with direct and indirect feedbacks on climate. Based on the synthesis information about these N hotspots and linking their geochemical properties to N losses, this review proposes that these hotspots of N losses are caused by high N availability. This confirms our hypothesis that tundra permafrost-affected soils are not always N-limited but show a great spatial diversity in terms of N availability. An open N cycle instead of closed N cycle is typical for hotspots of high N availability. We have shown that certain soil and microbial traits can be used to predict N availability status, especially at the highest level of N availability, the N hotspot level, and thus identify sites with high N loss. The characteristics of the N hotspots differed significantly from the adjacent non-N-releasing environments, which are associated with typical traits of the N-limitation level. The key traits of N hotspots with high N availability are as follows and should be used in combination:
- Soil properties: Low C/N below a threshold of 25 [29,86,87,120,202,234,247,255,256], high δ15N of bulk soil [234,304], WFPS around 60–70% [82,86,87,120,202,217,247,256] and high DIN [28,29,86,87,120,188,189,202,208,210,213,214,234,247,255,256,292,304], sometimes expressed as higher DIN/DON ratio [256]. Nitrogen loss often correlates with dominance of nitrate over ammonium [29,87,213,216,217,247,255,256], but at some sites a higher ammonium content was found in association with higher N2O emission [86,188,189,248,306]. Therefore, the total inorganic N content would be a better indicator for N loss.
- Microbial process rates measured in situ or in laboratory incubations correlated with N loss and were therefore appropriate traits of high N availability. They were gross [202,216] and net mineralization, the sum of ammonification and nitrification [87,304], gross [111,120,202] and net nitrification [29,69,87,119,188,304,307] and denitrification [189,205,234,254,256]. Since gross N turnover rates are also indicative of the total amount of circulating N and theses rates were higher than currently expected in this ecosystem [59], we propose to use net rates as an indicator of N limitation status instead. Net rates could provide a better indication of how much N might be lost from the tight N cycling system of permafrost-affected soils. However, net rates estimated using laboratory incubation techniques are highly dependent on conditions such as temperature and have inherent biases related to functional groups, so they do not characterize the contribution of, e.g., nitrifying organisms in the natural habitat [379]. Recently, however, in situ N2O flux rates from an N hotspot were shown to be highly correlated with anaerobic N2O production in laboratory incubation tests, as well as with net mineralization and net nitrification [87], so laboratory tests could be a good tool for predicting field fluxes.
- The abundance of functional genes or the detection of known 16S rRNA gene sequences of nitrifiers [119,120,188], denitrifiers [189,218], or both [86] have been correlated with high N2O losses in N hotspots. For nitrifiers, especially ammonia-oxidizing bacteria (AOB) and archaea (AOA), the gene amoA was mostly applied. However, gene AOA amoA abundance also dominated in permafrost-affected soils [118,120,147,182], but generally did not correlate with nitrification activity and N2O production rates. The reasons are that AOA do not exclusively use ammonia as substrate and that AOA produce N2O with about 30 times lower yields [129]. Therefore, it will likely be useful to distinguish between AOA and AOB amoA when using as traits for N2O production in the future. To predict N2O production by denitrifiers, high levels of their functional genes, mainly nirS + nirK genes of nitrite reductase, low levels of the gene nosZ (N2O reductase), or a high ratio of (nirS + nirK)/nosZ, were found in N hotspots in correlation with high N2O emission [205,218] and could therefore be a suitable microbial trait for N losses. In addition, metatranscriptomic analysis, which detects actively produced transcripts, could be another good tool to detect active microbial N cycling and N losses. This detection method has recently shown a correlation between denitrification activity and N2O production in permafrost-affected soils [136].
Because microbial traits were more often correlated with high gaseous N loss than with N leaching, it is not clear whether high lateral N loss can also be predicted by microbial traits. However, in any case, when analyzing large volumes of soils samples or using existing data to predict gaseous and lateral N losses, it would be appropriate to use only geochemical traits that are easier to measure and thus available for more sites.
Importantly, N hotspots in permafrost-affected soils were described for only a few study sites, and it can only be assumed that the results are representative of geochemically similar sites throughout the tundra permafrost-affected ecosystem. Therefore, the status of N availability, as well as process rates related to N cycling and sink/source character throughout the tundra biome, remain uncertain. More data are needed through in situ measurements combined with geomicrobiochemical properties to improve spatial and temporal resolution, especially for the non-growth period [82,380]. In addition, different revegetation stages of N hotspots and thus levels of N availability could be used for a more detailed analysis of plant nutrient requirements relative to their growth rates and the role of plant functional types. Although the current areal extent of N hotspots and their evolution in context of climate changes are not yet clear, increases in areal extent will result in N losses that will significantly affect regional biochemistry and the global climate. In addition, there is evidence of increased mineral N cycling and N losses with warming and climate-change-induced disturbances, but more observations, e.g., obtained through manipulation experiments, are urgently needed with a view to how climate change directly affects N processes in Arctic soils. Elevated N concentrations in formerly N-limited permafrost soils could affect the carbon cycle, but studies of C-N interactions, particularly the effects of N cycling processes on methanogenesis, are lacking. Knowledge of the existence, spatial extent, and biogeochemical properties of these N availability hotspots is important for understanding current and future GHG release of all three gases. The proposed N availability traits could be used to develop ecosystem models for simulating emissions of all three GHGs.
Supplementary Materials
The following are available online at https://www.mdpi.com/article/10.3390/nitrogen3030031/s1, Table S1: Detailed soil properties, gross and net N turnover rates, abundance of functional N genes, and production rates of greenhouse gases (GHG: N2O, CO2, CH4) and NO, HONO measured mainly in laboratory incubations of soil surface samples and in situ gas fluxes at two types of N availability hotspots: exemplified by a best described site of bare surfaces on permafrost peatland and thermokarst disturbed and revegetated retrogressive thaw slump (RTS), and undisturbed sites associated with the hotspots: vegetated surfaces on permafrost peatland and intact, fully vegetated soil adjacent to thaw slump, respectively. For RTS sites, a distinction was made between two subsites: slump floor (SF) and thaw mound (TM). Table S2: Biochemical traits of hotspots with high N availability and adjacent control sites with N limitation using the example of a study site: water-filled pore space (WFPS), C/N ratio, dissolved inorganic nitrogen (DIN, ammonium + nitrate) and nitrate, microbial net N turnover: N mineralization, nitrification, denitrification, and abundance of genes of key functional enzymes of nitrification (amo, ammonia monooxygenase), denitrification (nirS + nir K, nitrite reductases) and (nirS + nirK)/nosz ratio (nitrite reductase/N2O reductase) in subarctic bare (BP) and vegetated peatland (VP), Arctic retrogressive thaw slump (RTS) and undisturbed site (URTS), thermoerosion-gully (TEG) and undisturbed site (UTRG) on the Tibet Plateau, Arctic bare alluvial soils (AS) and vegetated floodplain (VP) and animal-influenced permafrost affected soils of the Arctic (AIA) and Antarctic (AIAA) and non-influenced soils of Arctic (NIA) and Antarctic (NIAA). References [381,382] are cited in the Supplementary Materials.
Author Contributions
Conceptualization, C.F.; writing—original draft preparation, C.F.; writing—review and editing, C.F., M.E.M., C.B., R.W. and T.S.; visualization, R.W. and C.F. All authors have read and agreed to the published version of the manuscript.
Funding
Work of M.E.M. was supported by the Academy of Finland in the frame of the Atmosphere and Climate Competence Center (ACCC) (no. 337550). CB acknowledges financial support by Deutsche Forschungsgemeinschaft through the Heisenberg program (DFG-BE 6485/1-1). T.S. was partly supported by the NERC-BMBF project EISPAC [#03F0809A].
Data Availability Statement
Figure 1 was produced and modified using the dataset (CC BY 3.0) of the circum-Arctic Map of Permafrost and Ground Ice Conditions by National Snow and Ice Data Center/World Data Center for Glaciology available online: https://databasin.org/datasets/1f624a31ab224835a78ad4bf11103419/ (accessed on 30 June 2022) [31].
Acknowledgments
Conflicts of Interest
The authors declare no conflict of interest.
References
- Tarnocai, C.; Canadell, J.G.; Schuur, E.A.G.; Kuhry, P.; Mazhitova, G.; Zimov, S. Soil organic carbon pools in the northern circumpolar permafrost region. Glob. Biogeochem. Cycles 2009, 23, GB2023. [Google Scholar] [CrossRef]
- Gruber, S. Derivation and analysis of a high-resolution estimate of global permafrost zonation. Cryosphere 2012, 6, 221–233. [Google Scholar] [CrossRef]
- Hugelius, G.; Strauss, J.; Zubrzycki, S.; Harden, J.W.; Schuur, E.A.G.; Ping, C.L.; Schirrmeister, L.; Grosse, G.; Michaelson, G.J.; Koven, C.D.; et al. Improved estimates show large circumpolar stocks of permafrost carbon while quantifying substantial uncertainty ranges and identifying remaining data gaps. Biogeosci. Discuss. 2014, 11, 4771–4822. [Google Scholar] [CrossRef]
- Hugelius, G.; Strauss, J.; Zubrzycki, S.; Harden, J.W.; Schuur, E.A.G.; Ping, C.L.; Schirrmeister, L.; Grosse, G.; Michaelson, G.J.; Koven, C.D.; et al. Estimated stocks of circumpolar permafrost carbon with quantified uncertainty ranges and identified data gaps. Biogeosciences 2014, 11, 6573–6593. [Google Scholar] [CrossRef]
- Aalto, J.; Karjalainen, O.; Hjort, J.; Luoto, M. Statistical forecasting of current and future circum-Arctic ground temperatures and active layer thickness. Geophys. Res. Lett. 2018, 45, 4889–4898. [Google Scholar] [CrossRef]
- Obu, J.; Westermanna, S.; Annett, B.; Berdnikovc, N.; Christiansen, H.H.; Dashtseren, A.; Delaloy, R.; Elberling, B.; Etzelmüller, B.; Kholodov, A.; et al. Northern Hemisphere permafrost map based on TTOP modelling for 2000–2016 at 1 km2 scale. Earth-Sci. Rev. 2019, 193, 299–316. [Google Scholar] [CrossRef]
- Marion, G.M.; Bockheim, J.G.; Brown, J. Arctic soils and the ITEX experiment. Glob. Chang. Biol. 1997, 3, 33–43. [Google Scholar] [CrossRef]
- Walker, D.A.; Raynolds, M.K.; Daniëls, F.J.A.; Einarsson, E.; Elvebakk, A.; Gould, W.A.; Katenin, A.E.; Kholod, S.S.; Markon, C.J.; Melnikov, E.S.; et al. The circumpolar Arctic vegetation map. J. Veg. Sci. 2005, 16, 267–282. [Google Scholar] [CrossRef]
- Olefeldt, D.; Turetsky, M.R.; Crill, P.M.; McGuire, A.D. Environmental and physical controls on northern terrestrial methane emissions across permafrost zones. Glob. Chang. Biol. 2013, 19, 589–603. [Google Scholar] [CrossRef]
- Beilman, D.W.; Vitt, D.H.; Halsey, L.A. Localized permafrost Peatlands in Western Canada: Definition, distributions, and degradation. Arct Antarct. Alp. Res. 2001, 33, 70–77. [Google Scholar] [CrossRef]
- van Huissteden, J. Thawing Permafrost-Permafrost Carbon in a Warming Arctic; Springer: Cham, Switzerland, 2020. [Google Scholar]
- Ping, C.L.; Jastrow, J.D.; Jorgenson, M.T.; Michaelson, G.J.; Shur, Y.L. Permafrost soils and carbon cycling. SOIL 2015, 1, 147–171. [Google Scholar] [CrossRef]
- Lipson, D.A.; Zona, D.; Raab, T.K.; Bozzolo, F.; Mauritz, M.; Oechel, W.C. Water-table height and microtopography control biogeochemical cycling in an Arctic coastal tundra ecosystem. Biogeosciences 2012, 9, 577–591. [Google Scholar] [CrossRef]
- Giblin, A.E.; Nadelhoffer, K.J.; Shaver, G.R.; Laundre, J.A.; McKerrow, A.J. Biogeochemical diversity along a riverside toposequence in Arctic Alaska. Ecol. Monogr. 1991, 61, 415–435. [Google Scholar] [CrossRef]
- Nadelhoffer, K.J.; Giblin, A.E.; Shaver, G.R.; Laundre, J.A. Effects of temperature and substrate quality on element mineralization in six Arctic soils. Ecology 1991, 72, 242–253. [Google Scholar] [CrossRef]
- Cheng, W.; Virginia, R.A.; Oberbauer, S.F.; Gillespie, C.T.; Reynolds, J.F.; Tenhunen, J.D. Soil nitrogen, microbial biomass, and respiration along an Arctic toposequence. Soil Sci. Soc. Am. J. 1998, 62, 654–662. [Google Scholar] [CrossRef]
- Björk, R.G.; Klemedtsson, L.; Molau, U.; Harndorf, J.; Ödman, A.M.; Giesler, R. Linkages between N turnover and plant community structure in a tundra landscape. Plant Soil 2007, 294, 247–261. [Google Scholar] [CrossRef]
- Minke, M.; Donner, N.; Karpov, N.S.; de Klerk, P.; Joosten, H. Distribution, diversity, development and dynamics of polygon mires: Examples from Northeast Yakutia (Siberia). Peatl. Int. 2007, 1, 36–40. [Google Scholar]
- Zona, D.; Lipson, D.A.; Zulueta, R.C.; Oberbauer, S.F.; Oechel, W.C. Microtopographic controls on ecosystem functioning in the Arctic Coastal Plain. J. Geophys. Res. Biogeosci. 2011, 116, G00i08. [Google Scholar] [CrossRef]
- Banerjee, S.; Siciliano, S.D. Factors driving potential ammonia oxidation in Canadian Arctic ecosystems: Does spatial scale matter? Appl. Environ. Microbiol. 2012, 78, 346–353. [Google Scholar] [CrossRef]
- Schädel, C.; Schuur, E.A.G.; Bracho, R.; Elberling, B.; Knoblauch, C.; Lee, H.; Luo, Y.; Shaver, G.R.; Turetsky, M.R. Circumpolar assessment of permafrost C quality and its vulnerability over time using long-term incubation data. Glob. Chang. Biol. 2014, 20, 641–652. [Google Scholar] [CrossRef]
- Treat, C.C.; Marushchak, M.E.; Voigt, C.; Zhang, Y.; Tan, Z.; Zhuang, Q.; Virtanen, T.A.; Räsänen, A.; Biasi, C.; Hugelius, G.; et al. Tundra landscape heterogeneity, not interannual variability, controls the decadal regional carbon balance in the Western Russian Arctic. Glob. Chang. Biol. 2018, 24, 5188–5204. [Google Scholar] [CrossRef] [PubMed]
- Weintraub, M.N.; Schimel, J.P. The seasonal dynamics of amino acids and other nutrients in Alaskan Arctic tundra soils. Biogeochemistry 2005, 73, 359–380. [Google Scholar] [CrossRef]
- Bardgett, R.D.; van der Wal, R.; Jónsdóttir, I.S.; Quirk, H.; Dutton, S. Temporal variability in plant and soil nitrogen pools in a high-Arctic ecosystem. Soil Biol. Biochem. 2007, 39, 2129–2137. [Google Scholar] [CrossRef]
- Lee, H.; Schuur, E.A.G.; Vogel, J.G. Soil CO2 production in upland tundra where permafrost is thawing. J. Geophys. Res. Biogeosci. 2010, 115, G01009. [Google Scholar] [CrossRef]
- Natali, S.M.; Schuur, E.A.G.; Trucco, C.; Pries, C.E.H.; Crummer, K.G.; Lopez, A.F.B. Effects of experimental warming of air, soil and permafrost on carbon balance in Alaskan tundra. Glob. Chang. Biol. 2011, 17, 1394–1407. [Google Scholar] [CrossRef]
- Stewart, K.J.; Coxson, D.; Siciliano, S.D. Small-scale spatial patterns in N2-fixation and nutrient availability in an Arctic hummock–hollow ecosystem. Soil Biol. Biochem. 2011, 43, 133–140. [Google Scholar] [CrossRef]
- Harms, T.K.; Jones, J. Thaw depth determines reaction and transport of inorganic nitrogen in valley bottom permafrost soils: Nitrogen cycling in permafrost soils. Glob. Chang. Biol. 2012, 18, 2958–2968. [Google Scholar] [CrossRef]
- Harms, T.K.; Abbott, B.W.; Jones, J.B. Thermo-erosion gullies increase nitrogen available for hydrologic export. Biogeochemistry 2014, 117, 299–311. [Google Scholar] [CrossRef]
- Norby, R.J.; Sloan, V.L.; Iversen, C.M.; Childs, J. Controls on fine-scale spatial and temporal variability of plant-available inorganic nitrogen in a polygonal tundra landscape. Ecosystems 2019, 22, 528–543. [Google Scholar] [CrossRef]
- Brown, J.; Ferrians, O.J., Jr.; Heginbottom, J.A.; Melnikov, E.S. Circum-Arctic Map of Permafrost and Ground Ice Conditions; National Snow and Ice Data Center/World Data Center for Glaciology: Boulder, CO, USA, 1998; revised February 2001; Available online: https://databasin.org/datasets/1f624a31ab224835a78ad4bf11103419/ (accessed on 30 June 2022).
- Ping, C.L.; Bockheim, J.G.; Kimble, J.M.; Michaelson, G.J.; Walker, D.A. Characteristics of cryogenic soils along a latitudinal transect in Arctic Alaska. J. Geophys. Res. Atmos. 1998, 103, 28917–28928. [Google Scholar] [CrossRef]
- Hugelius, G.; Loisel, J.; Chadburn, S.; Jackson, R.B.; Jones, M.; MacDonald, G.; Marushchak, M.; Olefeldt, D.; Packalen, M.; Siewert, M.B.; et al. Large stocks of peatland carbon and nitrogen are vulnerable to permafrost thaw. Proc. Natl. Acad. Sci. USA 2020, 117, 20438–20446. [Google Scholar] [CrossRef] [PubMed]
- Mishra, U.; Hugelius, G.; Shelef, E.; Yang, Y.; Strauss, J.; Lupachev, A.; Harden, J.W.; Jastrow, J.D.; Ping, C.-L.; Riley, W.J.; et al. Spatial heterogeneity and environmental predictors of permafrost region soil organic carbon stocks. Sci. Adv. 2021, 7, eaaz5236. [Google Scholar] [CrossRef] [PubMed]
- Post, W.M.; Zinke, P.J.; Stangenberger, A.G. Global patterns of soil nitrogen storage. Nature 1985, 317, 613–616. [Google Scholar] [CrossRef]
- Rodionov, A.; Flessa, H.; Grabe, M.; Kazansky, O.A.; Shibistova, O.; Guggenberger, G. Organic carbon and total nitrogen variability in permafrost-affected soils in a forest tundra ecotone. Eur. J. Soil Sci. 2007, 58, 1260–1272. [Google Scholar] [CrossRef]
- Harden, J.W.; Koven, C.D.; Ping, C.-L.; Hugelius, G.; David McGuire, A.; Camill, P.; Jorgenson, T.; Kuhry, P.; Michaelson, G.J.; O’Donnell, J.A.; et al. Field information links permafrost carbon to physical vulnerabilities of thawing. Geophys. Res. Lett. 2012, 39, L15704. [Google Scholar] [CrossRef]
- Zubrzycki, S.; Kutzbach, L.; Grosse, G.; Desyatkin, A.; Pfeiffer, E.M. Organic carbon and total nitrogen stocks in soils of the Lena River Delta. Biogeosciences 2013, 10, 3507–3524. [Google Scholar] [CrossRef]
- Fuchs, M.; Grosse, G.; Strauss, J.; Günther, F.; Grigoriev, M.; Maximov, G.M.; Hugelius, G. Carbon and nitrogen pools in thermokarst-affected permafrost landscapes in Arctic Siberia. Biogeosciences 2018, 15, 953–971. [Google Scholar] [CrossRef]
- Weintraub, M.N.; Schimel, J.P. Interactions between carbon and nitrogen mineralization and soil organic matter chemistry in Arctic tundra soils. Ecosystems 2003, 6, 129–143. [Google Scholar] [CrossRef]
- Strauss, J.; Abbott, B.W.; Beermann, F.; Biasi, C.; Fuchs, M.; Grosse, G.; Horn, M.A.; Liebner, S.; Sanders, T.; Schirrmeister, L.; et al. The nitrogen stock of the ice-rich yedoma domain. In Proceedings of the 5th European Conference on Permafrost, Chamonix-Mont-Blanc, France, 23 June–1 July 2018. [Google Scholar]
- Strauss, J.; Biasi, C.; Sanders, T.; Abbott, B.W.; Schneider von Deimling, T.; Voigt, C.; Winkel, M.; Marushchak, M.E.; Kou, D.; Fuchs, M.; et al. A globally relevant stock of soil nitrogen in the Yedoma permafrost domain. Nat. Commun. 2022. in review. [Google Scholar]
- Shaver, G.R.; Chapin, F.S., III. Response to fertilization by various plant growth forms in an Alaskan tundra: Nutrient accumulation and growth. Ecology 1980, 61, 662–675. [Google Scholar] [CrossRef]
- Jonasson, S. Nutrient content and dynamics in north Swedish shrub tundra areas. Ecography 1983, 6, 295–304. [Google Scholar] [CrossRef]
- Chapin, F.S., III; Shaver, G.R.; Giblin, A.E.; Nadelhoffer, K.J.; Laundre, J.A. Responses of Arctic tundra to experimental and observed changes in climate. Ecology 1995, 76, 694–711. [Google Scholar] [CrossRef]
- Chapin, F.S., III; Shaver, G.R. Physiological and growth responses of Arctic plants to a field experiment simulating climatic change. Ecology 1996, 77, 822–840. [Google Scholar] [CrossRef]
- Shaver, G.R.; Billings, W.D.; Stuart Chapin, F., III; Giblin, A.E.; Nadelhoffer, K.J.; Oechel, W.C.; Rastetter, E.B. Global change and the carbon balance of Arctic ecosystems. BioScience 1992, 42, 433–441. [Google Scholar] [CrossRef]
- Shaver, G.R.; Johnson, L.C.; Cades, D.H.; Murray, G.; Laundre, J.A.; Rastetter, E.B.; Nadelhoffer, K.J.; Giblin, A.E. Biomass and CO2 flux in wet sedge tundras: Responses to nutrients, temperature, and light. Ecol. Monogr. 1998, 68, 75–97. [Google Scholar] [CrossRef]
- Hobbie, S.E.; Nadelhoffer, K.J.; Högberg, P. A synthesis: The role of nutrients as constraints on carbon balances in boreal and Arctic regions. Plant Soil 2002, 242, 163–170. [Google Scholar] [CrossRef]
- Mack, M.C.; Schuur, E.A.G.; Bret-Harte, M.S.; Shaver, G.R.; Chapin, F.S., III. Ecosystem carbon storage in Arctic tundra reduced by long-term nutrient fertilization. Nature 2004, 431, 440–443. [Google Scholar] [CrossRef] [PubMed]
- Kaiser, C.; Meyer, H.; Biasi, C.; Rusalimova, O.; Barsukov, P.; Richter, A. Storage and mineralization of carbon and nitrogen in soils of a frost-boil tundra ecosystem in Siberia. Appl. Soil Ecol. 2005, 29, 173–183. [Google Scholar] [CrossRef]
- Sistla, S.A.; Asao, S.; Schimel, J.P. Detecting microbial N-limitation in tussock tundra soil: Implications for Arctic soil organic carbon cycling. Soil Biol. Biochem. 2012, 55, 78–84. [Google Scholar] [CrossRef]
- Stewart, K.J.; Grogan, P.; Coxson, D.S.; Siciliano, S.D. Topography as a key factor driving atmospheric nitrogen exchanges in Arctic terrestrial ecosystems. Soil Biol. Biochem. 2014, 70, 96–112. [Google Scholar] [CrossRef]
- Beermann, F.; Teltewskoi, A.; Fiencke, C.; Pfeiffer, E.M.; Kutzbach, L. Stoichiometric analysis of nutrient availability (N, P, K) within soils of polygonal tundra. Biogeochemistry 2015, 122, 211–227. [Google Scholar] [CrossRef]
- Salmon, V.G.; Schädel, C.; Bracho, R.; Pegoraro, E.; Celis, G.; Mauritz, M.; Mack, M.C.; Schuur, E.A.G. Adding depth to our understanding of nitrogen dynamics in permafrost soils. J. Geophys. Res. Biogeosci. 2018, 123, 2497–2512. [Google Scholar] [CrossRef]
- Du, E.; Terrer, C.; Pellegrini, A.F.A.; Ahlström, A.; van Lissa, C.J.; Zhao, X.; Xia, N.; Wu, X.; Jackson, R.B. Global patterns of terrestrial nitrogen and phosphorus limitation. Nat. Geosci. 2020, 13, 221–226. [Google Scholar] [CrossRef]
- Liu, X.-Y.; Koba, K.; Koyama, L.A.; Hobbie, S.E.; Weiss, M.S.; Inagaki, Y.; Shaver, G.R.; Giblin, A.E.; Hobara, S.; Nadelhoffer, K.J.; et al. Nitrate is an important nitrogen source for Arctic tundra plants. Proc. Natl. Acad. Sci. USA 2018, 115, 3398–3403. [Google Scholar] [CrossRef] [PubMed]
- Horn, M.A.; Hetz, A. Microbial nitrogen cycling in permafrost soils: Implications for atmospheric chemistry. In Microbial Life in the Cryosphere and Its Feedback on Global Change; Liebner, S., Ganzert, L., Eds.; Walter de Gruyter GmbH: Berlin, Germany; Boston, MA, USA, 2021; pp. 53–112. [Google Scholar]
- Ramm, E.; Liu, C.Y.; Ambus, P.; Butterbach-Bahl, K.; Hu, B.; Martikainen, P.J.; Marushchak, M.E.; Mueller, C.W.; Rennenberg, H.; Schloter, M.; et al. A review of the importance of mineral nitrogen cycling in the plant-soil-microbe system of permafrost-affected soils-changing the paradigm. Environ. Res. Lett. 2022, 17, 013004. [Google Scholar] [CrossRef]
- Cleveland, C.C.; Townsend, A.R.; Schimel, D.S.; Fisher, H.; Howarth, R.W.; Hedin, L.O.; Perakis, S.S.; Latty, E.F.; Von Fischer, J.C.; Elseroad, A.; et al. Global patterns of terrestrial biological nitrogen (N2) fixation in natural ecosystems. Glob. Biogeochem. Cycles 1999, 13, 623–645. [Google Scholar] [CrossRef]
- Hobara, S.; McCalley, C.; Koba, K.; Giblin, A.E.; Weiss, M.S.; Gettel, G.M.; Shaver, G.R. Nitrogen fixation in surface soils and vegetation in an Arctic tundra watershed: A key source of atmospheric nitrogen. Arct. Antarct. Alp. Res. 2006, 38, 363–372. [Google Scholar] [CrossRef]
- Bobbink, R.; Hicks, K.; Galloway, J.; Spranger, T.; Alkemade, R.; Ashmore, R.; Bustamante, M.; Cinderby, S.; Davidson, E.; Dentener, F.; et al. Global assessment of nitrogen deposition effects on terrestrial plant diversity: A synthesis. Ecol. Soc. Am. 2010, 20, 30–59. [Google Scholar] [CrossRef]
- Ackerman, D.; Millet, D.B.; Chen, X. global estimates of inorganic nitrogen deposition across four decades. Glob. Biogeochem. Cycles 2019, 33, 100–107. [Google Scholar] [CrossRef]
- Van Cleve, K.; Alexander, V. Nitrogen cycling in tundra and boreal ecosystems. Ecol. Bull. 1981, 33, 375–404. [Google Scholar]
- Schimel, J.P.; Bennett, J. Nitrogen mineralization: Challenges of a changing paradigm. Ecology 2004, 85, 591–602. [Google Scholar] [CrossRef]
- Buckeridge, K.M.; Zufelt, E.; Chu, H.Y.; Grogan, P. Soil nitrogen cycling rates in low Arctic shrub tundra are enhanced by litter feedbacks. Plant Soil 2010, 330, 407–421. [Google Scholar] [CrossRef]
- Pearce, A.R.; Rastetter, E.B.; Kwiatkowski, B.L.; Bowden, W.B.; Mack, M.C.; Jiang, Y. Recovery of Arctic tundra from thermal erosion disturbance is constrained by nutrient accumulation: A modeling analysis. Ecol. Appl. 2015, 25, 1271–1289. [Google Scholar] [CrossRef] [PubMed]
- Wild, B.; Schnecker, J.; Knoltsch, A.; Takriti, M.; Mooshammer, M.; Gentsch, N.; Mikutta, R.; Alves, R.J.; Gittel, A.; Lashchinskiy, N.; et al. Microbial nitrogen dynamics in organic and mineral soil horizons along a latitudinal transect in western Siberia. Glob. Biogeochem. Cycles 2015, 29, 567–582. [Google Scholar] [CrossRef]
- Pastor, A.; Poblador, S.; Skovsholt, L.J.; Riis, T. Microbial carbon and nitrogen processes in high-Arctic riparian soils. Permafr. Periglac. Process. 2020, 31, 223–236. [Google Scholar] [CrossRef]
- Jonasson, S.; Michelsen, A.; Schmidt, I.K. Coupling of nutrient cycling and carbon dynamics in the Arctic, integration of soil microbial and plant processes. Appl. Soil Ecol. 1999, 11, 135–146. [Google Scholar] [CrossRef]
- Wild, B.; Alves, R.J.E.; Bárta, J.; Čapek, P.; Gentsch, N.; Guggenberger, G.; Hugelius, G.; Knoltsch, A.; Kuhry, P.; Lashchinskiy, N.; et al. Amino acid production exceeds plant nitrogen demand in Siberian tundra. Environ. Res. Lett. 2018, 13, 034002. [Google Scholar] [CrossRef]
- Pedersen, E.P.; Elberling, B.; Michelsen, A. Foraging deeply: Depth-specific plant nitrogen uptake in response to climate-induced N-release and permafrost thaw in the High Arctic. Glob. Chang. Biol. 2020, 26, 6523–6536. [Google Scholar] [CrossRef]
- Kielland, K. Amino acid absorption by Arctic plants: Implications for plant nutrition and nitrogen cycling. Ecology 1994, 75, 2373–2383. [Google Scholar] [CrossRef]
- Chu, H.; Grogan, P. Soil microbial biomass, nutrient availability and nitrogen mineralization potential among vegetation-types in a low Arctic tundra landscape. Plant Soil 2010, 329, 411–420. [Google Scholar] [CrossRef]
- Keuper, F.; van Bodegom, P.M.; Dorrepaal, E.; Weedon, J.T.; van Hal, J.; van Logtestijn, R.S.P.; Aerts, R. A frozen feast: Thawing permafrost increases plant-available nitrogen in subarctic peatlands. Glob. Chang. Biol. 2012, 18, 1998–2007. [Google Scholar] [CrossRef]
- Wickland, K.P.; Waldrop, M.P.; Aiken, G.R.; Koch, J.C.; Jorgenson, M.T.; Striegl, R.G. Dissolved organic carbon and nitrogen release from boreal Holocene permafrost and seasonally frozen soils of Alaska. Environ. Res. Lett. 2018, 13, 065011. [Google Scholar] [CrossRef]
- Fouche, J.; Christiansen, C.T.; Lafreniere, M.J.; Grogan, P.; Lamoureux, S.F. Canadian permafrost stores large pools of ammonium and optically distinct dissolved organic matter. Nat. Commun. 2020, 11, 4500. [Google Scholar] [CrossRef]
- Schmidt, I.K.; Jonasson, S.; Shaver, G.R.; Michelsen, A.; Nordin, A. Mineralization and distribution of nutrients in plants and microbes in four Arctic ecosystems: Responses to warming. Plant Soil 2002, 242, 93–106. [Google Scholar] [CrossRef]
- Biasi, C.; Wanek, W.; Rusalimova, O.; Kaiser, C.; Meyer, H.; Barsukov, P.; Richter, A. Microtopography and plant-cover controls on nitrogen dynamics in hummock tundra ecosystems in siberia. Arct. Antarct. Alp. Res. 2005, 37, 435–443. [Google Scholar] [CrossRef]
- Sorensen, P.L.; Jonasson, S.; Michelsen, A. Nitrogen Fixation, Denitrification, and Ecosystem Nitrogen Pools in Relation to VegetationDevelopment in the Subarctic. Arct. Antarct. Alp. Res. 2006, 38, 263–272. [Google Scholar] [CrossRef]
- Kelley, A.M.; Epstein, H.E.; Ping, C.-L.; Walker, D.A. Soil nitrogen transformations associated with small patterned-ground features along a North American Arctic Transect. Permafr. Periglac. Process. 2012, 23, 196–206. [Google Scholar] [CrossRef]
- Voigt, C.; Marushchak, M.E.; Abbott, B.W.; Biasi, C.; Elberling, B.; Siciliano, S.D.; Sonnentag, O.; Stewart, K.J.; Yang, Y.; Martikainen, P.J. Nitrous oxide emissions from permafrost-affected soils. Nat. Rev. Earth Environ. 2020, 1, 420–434. [Google Scholar] [CrossRef]
- Solomon, S.; Qin, S.; Manning, M.; Alley, R.B.; Berntsen, T.; Bindoff, N.L.; Chen, Z.; Chidthaisong, A.; Gregory, J.M.; Hegerl, G.C.; et al. Technical Summary. In Climate Change 2007: The Physical Science Basis. Contribution of Working Group I to the Fourth Assessment Report of the Intergovernmental Panel on Climate Change; Solomon, S., Qin, S., Manning, M., Chen, Z., Marquis, M., Averyt, K.B., Tignor, M., Miller, H.L., Eds.; Cambridge University Press: Cambridge, UK; New York, NY, USA, 2007; pp. 19–91. [Google Scholar]
- Jones, J.B.; Petrone, K.C.; Finlay, J.C.; Hinzman, L.D.; Bolton, W.R. Nitrogen loss from watersheds of interior Alaska underlain with discontinuous permafrost. Geophys. Res. Lett. 2005, 32, L02401. [Google Scholar] [CrossRef]
- Petrone, K.C.; Jones, J.B.; Hinzman, L.D.; Boone, R.D. Seasonal export of carbon, nitrogen, and major solutes from Alaskan catchments with discontinuous permafrost. J. Geophys. Res. Biogeosci. 2006, 111, e2021GB007242. [Google Scholar] [CrossRef]
- Marushchak, M.E.; Pitkämäki, A.; Koponen, H.; Biasi, C.; Seppälä, M.; Martikainen, P.J. Hot spots for nitrous oxide emissions found in different types of permafrost peatlands. Glob. Chang. Biol. 2011, 17, 2601–2614. [Google Scholar] [CrossRef]
- Marushchak, M.E.; Kerttula, J.; Diáková, K.; Faguet, A.; Gil, J.; Grosse, G.; Knoblauch, C.; Laschinskiy, N.; Nykamb, M.; Martikainen, P.J.; et al. Thawing yedoma permafrost as a neglected nitrous oxide source. Nat. Commun. 2021, 12, 7107. [Google Scholar] [CrossRef] [PubMed]
- Abbott, B.W.; Jones, J.B. Permafrost collapse alters soil carbon stocks, respiration, CH4, and N2O in upland tundra. Glob. Chang. Biol. 2015, 21, 4570–4587. [Google Scholar] [CrossRef] [PubMed]
- Nowinski, N.S.; Trumbore, S.E.; Schuur, E.A.G.; Mack, M.C.; Shaver, G.R. Nutrient addition prompts rapid destabilization of organic matter in an Arctic tundra ecosystem. Ecosystems 2008, 11, 16–25. [Google Scholar] [CrossRef]
- Koyama, A.; Wallenstein, M.D.; Simpson, R.T.; Moore, J.C. Carbon-degrading enzyme activities stimulated by increased nutrient availability in Arctic tundra soils. PLoS ONE 2013, 8, e77212. [Google Scholar] [CrossRef]
- Koyama, A.; Wallenstein, M.D.; Simpson, R.T.; Moore, J.C. Soil bacterial community composition altered by increased nutrient availability in Arctic tundra soils. Front. Microbiol. 2014, 5, 516. [Google Scholar] [CrossRef]
- Chen, R.; Senbayram, M.; Blagodatsky, S.; Myachina, O.; Dittert, K.; Lin, X.; Blagodatskaya, E.; Kuzyakov, Y. Soil C and N availability determine the priming effect: Microbial N mining and stoichiometric decomposition theories. Glob. Chang. Biol. 2014, 20, 2356–2367. [Google Scholar] [CrossRef]
- Koven, C.D.; Lawrence, D.M.; Riley, W.J. Permafrost carbon−climate feedback is sensitive to deep soil carbon decomposability but not deep soil nitrogen dynamics. Proc. Natl. Acad. Sci. USA 2015, 112, 3752–3757. [Google Scholar] [CrossRef]
- Wieder, W.R.; Allison, S.D.; Davidson, E.A.; Georgiou, K.; Hararuk, O.; He, Y.; Hopkins, F.; Luo, Y.; Smith, M.J.; Sulman, B.; et al. Explicitly representing soil microbial processes in Earth system models. Glob. Biogeochem. Cycles 2015, 29, 1782–1800. [Google Scholar] [CrossRef]
- Kou, D.; Yang, G.; Li, F.; Feng, X.; Zhang, D.; Mao, C.; Zhang, Q.; Peng, Y.; Ji, C.; Zhu, Q.; et al. Progressive nitrogen limitation across the Tibetan alpine permafrost region. Nat. Commun. 2020, 11, 3331. [Google Scholar] [CrossRef]
- Terhaar, J.; Lauerwald, R.; Regnier, P.; Gruber, N.; Bopp, L. Around one third of current Arctic Ocean primary production sustained by rivers and coastal erosion. Nat. Commun. 2021, 12, 169. [Google Scholar] [CrossRef] [PubMed]
- Vonk, J.E.; Tank, S.E.; Bowden, W.B.; Laurion, I.; Vincent, W.F.; Alekseychik, P.; Amyot, M.; Billet, M.F.; Canario, J.; Cory, R.M.; et al. Reviews and syntheses: Effects of permafrost thaw on Arctic aquatic ecosystems. Biogeosciences 2015, 12, 7129–7167. [Google Scholar] [CrossRef]
- Loranty, M.M.; Abbott, B.W.; Blok, D.; Douglas, T.A.; Epstein, H.E.; Forbes, B.C.; Jones, B.M.; Kholodov, A.L.; Kropp, H.; Malhotra, A.; et al. Reviews and syntheses: Changing ecosystem influences on soil thermal regimes in northern high-latitude permafrost regions. Biogeosciences 2018, 15, 5287–5313. [Google Scholar] [CrossRef]
- Turetsky, M.R.; Abbott, B.W.; Jones, M.C.; Anthony, K.W.; Olefeldt, D.; Schuur, E.A.G.; Grosse, G.; Kuhry, P.; Hugelius, G.; Koven, C.; et al. Carbon release through abrupt permafrost thaw. Nat. Geosci. 2020, 13, 138–143. [Google Scholar] [CrossRef]
- Miner, K.R.; Turetsky, M.R.; Malina, E.; Bartsch, A.; Tamminen, J.; McGuire, A.D.; Fix, A.; Sweeney, C.; Elder, C.D.; Miller, C.E. Permafrost carbon emissions in a changing Arctic. Nat. Rev. Earth Environ. 2022, 3, 55–67. [Google Scholar] [CrossRef]
- Jansson, J.K.; Taş, N. The microbial ecology of permafrost. Nat. Rev. Microbiol. 2014, 12, 414–425. [Google Scholar] [CrossRef]
- Salazar, A.; Rousk, K.; Jónsdóttir, I.; Bellenger, J.-P.; Andrésson, Ó. Faster nitrogen cycling and more fungal and root biomass in cold ecosystems under experimental warming: A meta-analysis. Ecol. Soc. Am. 2020, 101, e02938. [Google Scholar] [CrossRef]
- Beermann, F.; Langer, M.; Wetterich, S.; Strauss, J.; Boike, J.; Fiencke, C.; Schirrmeister, L.; Pfeiffer, E.M.; Kutzbach, L. Permafrost thaw and liberation of inorganic nitrogen in eastern siberia. Permafr. Periglac. Process. 2017, 28, 605–618. [Google Scholar] [CrossRef]
- Schimel, J.P.; Bilbrough, C.; Welker, J.M. Increased snow depth affects microbial activity and nitrogen mineralization in two Arctic tundra communities. Soil Biol. Biochem. 2004, 36, 217–227. [Google Scholar] [CrossRef]
- Mason, R.E.; Craine, J.M.; Lany, N.K.; Jonard, M.; Ollinger, S.V.; Groffman, P.M.; Fulweiler, R.W.; Angerer, J.; Read, Q.D.; Reich, P.B.; et al. Evidence, causes, and consequences of declining nitrogen availability in terrestrial ecosystems. Science 2022, 376, eabh3767. [Google Scholar] [CrossRef]
- Biasi, C.; Meyer, H.; Rusalimova, O.; Hammerle, R.; Kaiser, C.; Baranyi, C.; Daims, H.; Lashchinsky, N.; Barsukov, P.; Richter, A. Initial effects of experimental warming on carbon exchange rates, plant growth and microbial dynamics of a lichen-rich dwarf shrub tundra in Siberia. Plant Soil 2008, 307, 191–205. [Google Scholar] [CrossRef]
- Finger, R.A.; Turetsky, M.R.; Kielland, K.; Ruess, R.W.; Mack, M.C.; Euskirchen, E.S. Effects of permafrost thaw on nitrogen availability and plant–soil interactions in a boreal Alaskan lowland. J. Ecol. 2016, 104, 1542–1554. [Google Scholar] [CrossRef]
- Salmon, V.G.; Soucy, P.; Mauritz, M.; Celis, G.; Natali, S.M.; Mack, M.C.; Schuur, E.A.G. Nitrogen availability increases in a tundra ecosystem during five years of experimental permafrost thaw. Glob. Chang. Biol. 2016, 22, 1927–1941. [Google Scholar] [CrossRef]
- Mao, C.; Kou, D.; Chen, L.; Qin, S.; Zhang, D.; Peng, Y.; Yang, Y. Permafrost nitrogen status and its determinants on the Tibetan Plateau. Glob. Chang. Biol. 2020, 26, 5290–5302. [Google Scholar] [CrossRef] [PubMed]
- Chen, Y.L.; Kou, D.; Li, F.; Ding, J.Z.; Yang, G.B.; Fang, K.; Yang, Y.H. Linkage of plant and abiotic properties to the abundance and activity of N-cycling microbial communities in Tibetan permafrost-affected regions. Plant Soil 2019, 434, 453–466. [Google Scholar] [CrossRef]
- Ramm, E.; Liu, C.; Mueller, C.; Gschwendtner, S.; Yue, H.; Wang, X.; Bachmann, J.; Bonhoff, J.A.; Ostler, U.; Schloter, M.; et al. Alder-induced stimulation of soil gross nitrogen turnover in a permafrost-affected peatland of Northeast China. Soil Biol. Biochem. 2022, 172, 108787. [Google Scholar] [CrossRef]
- Chapin, D.M. Nitrogen mineralization, nitrification, and denitrification in a high arctic lowland ecosystem, Devon Island, NWT, Canada. Arct. Alp. Res. 1996, 28, 85–92. [Google Scholar] [CrossRef]
- Amundson, R.; Austin, A.T.; Schuur, E.A.G.; Yoo, K.; Matzek, V.; Kendall, C.; Uebersax, A.; Brenner, D.; Baisden, W.T. Global patterns of the isotopic composition of soil and plant nitrogen. Glob. Biogeochem. Cycles 2003, 17, 1031. [Google Scholar] [CrossRef]
- Houlton, B.Z.; Bai, E. Imprint of denitrifying bacteria on the global terrestrial biosphere. Proc. Natl. Acad. Sci. USA 2009, 106, 21713–21716. [Google Scholar] [CrossRef]
- Malone, E.T.; Abbott, B.W.; Klaar, M.J.; Kidd, C.; Sebilo, M.; Milner, A.M.; Pinay, G. Decline in ecosystem δ13C and mid-successional nitrogen loss in a two-century postglacial chronosequence. Ecosystems 2018, 21, 1659–1675. [Google Scholar] [CrossRef]
- Schuur, E.; Crummer, K.; Vogel, J.; Mack, M. Plant species composition and productivity following permafrost thaw and thermokarst in Alaskan tundra. Ecosystems 2007, 10, 280–292. [Google Scholar] [CrossRef]
- Keuper, F.; Dorrepaal, E.; van Bodegom, P.M.; van Logtestijn, R.; Venhuizen, G.; van Hal, J.; Aerts, R. Experimentally increased nutrient availability at the permafrost thaw front selectively enhances biomass production of deep-rooting subarctic peatland species. Glob. Chang. Biol. 2017, 23, 4257–4266. [Google Scholar] [CrossRef] [PubMed]
- Alves, R.J.; Wanek, W.; Zappe, A.; Richter, A.; Svenning, M.M.; Schleper, C.; Urich, T. Nitrification rates in Arctic soils are associated with functionally distinct populations of ammonia-oxidizing archaea. ISME J. 2013, 7, 1620–1631. [Google Scholar] [CrossRef] [PubMed]
- Sanders, T.; Fiencke, C.; Hüpeden, J.; Pfeiffer, E.-M.; Spieck, E. Cold adapted nitrosospira sp.: A potential crucial contributor of ammonia oxidation in cryosols of permafrost-affected landscapes in northeast Siberia. Microorganisms 2019, 7, 699. [Google Scholar] [CrossRef]
- Siljanen, H.M.P.; Alves, R.J.E.; Ronkainen, J.G.; Lamprecht, R.E.; Bhattarai, H.R.; Bagnoud, A.; Marushchak, M.E.; Martikainen, P.J.; Schleper, C.; Biasi, C. Archaeal nitrification is a key driver of high nitrous oxide emissions from arctic peatlands. Soil Biol. Biochem. 2019, 137, 107539. [Google Scholar] [CrossRef]
- Song, Y.Y.; Liu, C.; Wang, X.W.; Ma, X.Y.; Jiang, L.; Zhu, J.P.; Gao, J.L.; Song, C.C. Microbial abundance as an indicator of soil carbon and nitrogen nutrient in permafrost peatlands. Ecol. Indic. 2020, 115, 106362. [Google Scholar] [CrossRef]
- Butterbach-Bahl, K.; Dannenmann, M. Soil carbon and nitrogen interactions and biosphere-atmosphere exchange of nitrous oxide and methane. In Recarbonization of the Biosphere; Lal, R., Hüttl, R.H., Braun, V.J., Lorenz, K., Schneider, B.U., Eds.; Springer: Dodrecht, The Netherlands; Heidelberg, Germany; New York, NY, USA; London, UK, 2012; pp. 429–444. [Google Scholar]
- Zhang, S.S.; Zheng, Q.; Noll, L.; Hu, Y.T.; Wanek, W. Environmental effects on soil microbial nitrogen use efficiency are controlled by allocation of organic nitrogen to microbial growth and regulate gross N mineralization. Soil Biol. Biochem. 2018, 135, 304–315. [Google Scholar] [CrossRef]
- Aber, J.D. Nitrogen cycling and nitrogen saturationin in temperate forest ecosystem. Trends Ecol. Evol. 1992, 7, 220–223. [Google Scholar] [CrossRef]
- Chen, L.; Liu, L.; Mao, C.; Qin, S.; Wang, J.; Liu, F.; Blagodatsky, S.; Yang, G.; Zhang, Q.; Zhang, D.; et al. Nitrogen availability regulates topsoil carbon dynamics after permafrost thaw by altering microbial metabolic efficiency. Nat. Commun. 2018, 9, 3951. [Google Scholar] [CrossRef]
- Klemedtsson, L.; Von Arnold, K.; Weslien, P.; Gundersen, P. Soil CN ratio as a scalar parameter to predict nitrous oxide emissions. Glob. Chang. Biol. 2005, 11, 1142–1147. [Google Scholar] [CrossRef]
- Davidson, E.A.; Keller, M.; Erickson, H.E.; Verchot, L.V.; Veldkamp, E. Testing a conceptual model of soil emissions of nitrous and nitric oxides. Bioscience 2000, 50, 667–680. [Google Scholar] [CrossRef]
- Kuypers, M.M.M.; Marchant, H.K.; Kartal, B. The microbial nitrogen-cycling network. Nat. Rev. Microbiol. 2018, 16, 263–276. [Google Scholar] [CrossRef] [PubMed]
- Prosser, J.I.; Hink, L.; Gubry-Rangin, C.; Nicol, G.W. Nitrous oxide production by ammonia oxidizers: Physiological diversity, niche differentiation and potential mitigation strategies. Glob. Chang. Biol. 2020, 26, 103–118. [Google Scholar] [CrossRef]
- Zumft, W.G. Cell biology and molecular basis of denitrification. Microbiol. Mol. Biol. Rev. 1997, 61, 533–616. [Google Scholar] [CrossRef]
- Banerjee, S.; Si, B.C.; Siciliano, S.D. Evidence of high microbial abundance and spatial dependency in three Arctic soil ecosystems. Soil Sci. Soc. Am. J. 2011, 75, 2227–2232. [Google Scholar] [CrossRef]
- Malard, L.A.; Pearce, D.A. Microbial diversity and biogeography in Arctic soils. Environ. Microbiol. Rep. 2018, 10, 611–625. [Google Scholar] [CrossRef] [PubMed]
- Crowther, T.W.; van den Hoogen, J.; Wan, J.; Mayes, M.A.; Keiser, A.D.; Mo, L.; Averill, C.; Maynard, D.S. The global soil community and its influence on biogeochemistry. Science 2019, 365, eaav0550. [Google Scholar] [CrossRef]
- Wilhelm, R.C.; Radtke, K.J.; Mykytczuk, N.C.; Greer, C.W.; Whyte, L.G. Life at the wedge: The activity and diversity of arctic ice wedge microbial communities. Astrobiology 2012, 12, 347–360. [Google Scholar] [CrossRef]
- Hultman, J.; Waldrop, M.P.; Mackelprang, R.; David, M.M.; McFarland, J.; Blazewicz, S.J.; Harden, J.; Turetsky, M.R.; McGuire, A.D.; Shah, M.B.; et al. Multi-omics of permafrost, active layer and thermokarst bog soil microbiomes. Nature 2015, 521, 208–212. [Google Scholar] [CrossRef]
- Altshuler, I.; Ronholm, J.; Layton, A.; Onstott, T.C.; Greer, C.W.; Whyte, L.G. Denitrifiers, nitrogen-fixing bacteria and N2O soil gas flux in high Arctic ice-wedge polygon cryosols. FEMS Microbiol. Ecol. 2019, 95, fiz049. [Google Scholar] [CrossRef]
- Raymond-Bouchard, I.; Whyte, L.G. From Transcriptomes to metatranscriptomes: Cold adaptation and active metabolisms of psychrophiles from cold environments. In Psychrophiles: From Biodiversity to Biotechnology; Margesin, R., Ed.; Springer International Publishing: Cham, Switzerland, 2017; pp. 437–457. [Google Scholar] [CrossRef]
- Margesin, R.; Collins, T. Microbial ecology of the cryosphere (glacial and permafrost habitats): Current knowledge. Appl. Microbiol. Biotechnol. 2019, 103, 2537–2549. [Google Scholar] [CrossRef] [PubMed]
- Mackelprang, R.; Waldrop, M.P.; DeAngelis, K.M.; David, M.M.; Chavarria, K.L.; Blazewicz, S.J.; Rubin, E.M.; Jansson, J.K. Metagenomic analysis of a permafrost microbial community reveals a rapid response to thaw. Nature 2011, 480, 368–371. [Google Scholar] [CrossRef] [PubMed]
- Taş, N.; Prestat, E.; McFarland, J.W.; Wickland, K.P.; Knight, R.; Berhe, A.A.; Jorgenson, T.; Waldrop, M.P.; Jansson, J.K. Impact of fire on active layer and permafrost microbial communities and metagenomes in an upland Alaskan boreal forest. ISME J. 2014, 8, 1904–1919. [Google Scholar] [CrossRef]
- Taş, N.; Prestat, E.; Wang, S.; Wu, Y.; Ulrich, C.; Kneafsey, T.; Tringe, S.G.; Torn, M.S.; Hubbard, S.S.; Jansson, J.K. Landscape topography structures the soil microbiome in arctic polygonal tundra. Nat. Commun. 2018, 9, 777. [Google Scholar] [CrossRef] [PubMed]
- Deng, J.; Gu, Y.; Zhang, J.; Xue, K.; Qin, Y.; Yuan, M.; Yin, H.; He, Z.; Wu, L.; Schuur, E.A.; et al. Shifts of tundra bacterial and archaeal communities along a permafrost thaw gradient in Alaska. Mol. Ecol. 2015, 24, 222–234. [Google Scholar] [CrossRef]
- Müller, O.; Bang-Andreasen, T.; White, R.A., III; Elberling, B.; Taş, N.; Kneafsey, T.; Jansson, J.K.; Øvreås, L. Disentangling the complexity of permafrost soil by using high resolution profiling of microbial community composition, key functions and respiration rates. Environ. Microbiol. 2018, 20, 4328–4342. [Google Scholar] [CrossRef]
- Rivkina, E.M.; Friedmann, E.I.; McKay, C.P.; Gilichinsky, D.A. Metabolic activity of permafrost bacteria below the freezing point. Appl. Environ. Microbiol. 2000, 66, 3230–3233. [Google Scholar] [CrossRef]
- Khmelenina, V.N.; Makutina, V.A.; Khalyuzhnaya, M.G.; Rivkina, E.M.; Gilichinsky, D.A.; Trotsenko, Y.A. Dicovery of viable methanotrophic bacteria in permafrost sediments of Northeast Siberia. Dokl. Biol. Sci. 2002, 384, 235–237. [Google Scholar] [CrossRef]
- Gilichinsky, D.; Rivkina, E.; Shcherbakova, V.; Laurinavichuis, K.; Tiedje, J. Supercooled water brines within permafrost—An unknown ecological niche for microorganisms: A model for astrobiology. Astrobiology 2003, 3, 331–341. [Google Scholar] [CrossRef]
- Frank-Fahle, B.A.; Yergeau, É.; Greer, C.W.; Lantuit, H.; Wagner, D. Microbial functional potential and community composition in permafrost-affected soils of the NW Canadian Arctic. PLoS ONE 2014, 9, e84761. [Google Scholar] [CrossRef]
- Tuorto, S.J.; Darias, P.; McGuinness, L.R.; Panikov, N.; Zhang, T.; Häggblom, M.M.; Kerkhof, L.J. Bacterial genome replication at subzero temperatures in permafrost. ISME J. 2014, 8, 139–149. [Google Scholar] [CrossRef]
- Kim, H.M.; Lee, M.J.; Jung, J.Y.; Hwang, C.Y.; Kim, M.; Ro, H.-M.; Chun, J.; Lee, Y.K. Vertical distribution of bacterial community is associated with the degree of soil organic matter decomposition in the active layer of moist acidic tundra. J. Microbiol. 2016, 54, 713–723. [Google Scholar] [CrossRef]
- Altshuler, I.; Goordial, J.; Whyte, L.G. Microbial life in permafrost. In Psychrophiles: From Biodiversity to Biotechnology; Margesin, R., Ed.; Springer International Publishing: Cham, Switzerland, 2017; pp. 153–179. [Google Scholar] [CrossRef]
- Mackelprang, R.; Burkert, A.; Haw, M.; Mahendrarajah, T.; Conaway, C.H.; Douglas, T.A.; Waldrop, M.P. Microbial survival strategies in ancient permafrost: Insights from metagenomics. ISME J. 2017, 11, 2305–2318. [Google Scholar] [CrossRef]
- Gilichinsky, D.A.; Vorobyova, E.A.; Erokhina, L.G.; Fyordorov-Davydov, D.G.; Chaikovskaya, N.R.; Fyordorov-Dayvdov, D.G. Long-term preservation of microbial ecosystems in permafrost. Adv. Space Res. 1992, 12, 255–263. [Google Scholar] [CrossRef]
- Gilichinsky, D.A.; Soina, V.S.; Petrova, M.A. Cryoprotective properties of water in the Earth cryolithosphere and its role in exobiology. Orig. Life Evol. Biosph. 1993, 23, 65–75. [Google Scholar] [CrossRef] [PubMed]
- Gilichinsky, D.; Wagener, S. Microbial Life in Permafrost-a Historical Review. Permafr. Periglac. Process. 1995, 6, 243–250. [Google Scholar] [CrossRef]
- Alawi, M.; Lipski, A.; Sanders, T.; Pfeiffer, E.M.; Spieck, E. Cultivation of a novel cold-adapted nitrite oxidizing betaproteobacterium from the Siberian Arctic. ISME J. 2007, 1, 256–264. [Google Scholar] [CrossRef]
- Wallenstein, M.D.; McMahon, S.K.; Schimel, J.P. Seasonal variation in enzyme activities and temperature sensitivities in Arctic tundra soils. Glob. Chang. Biol. 2009, 15, 1631–1639. [Google Scholar] [CrossRef]
- McMahon, S.K.; Wallenstein, M.D.; Schimel, J.P. A cross-seasonal comparison of active and total bacterial community composition in Arctic tundra soil using bromodeoxyuridine labeling. Soil Biol. Biochem. 2011, 43, 287–295. [Google Scholar] [CrossRef]
- Sistla, S.A.; Schimel, J.P. Seasonal patterns of microbial extracellular enzyme activities in an arctic tundra soil: Identifying direct and indirect effects of long-term summer warming. Soil Biol. Biochem. 2013, 66, 119–129. [Google Scholar] [CrossRef]
- Buckeridge, K.M.; Banerjee, S.; Siciliano, S.D.; Grogan, P. The seasonal pattern of soil microbial community structure in mesic low arctic tundra. Soil Biol. Biochem. 2013, 65, 338–347. [Google Scholar] [CrossRef]
- Schostag, M.; Stibal, M.; Jacobsen, C.S.; Bælum, J.; Taş, N.; Elberling, B.; Jansson, J.K.; Semenchuk, P.; Priemé, A. Distinct summer and winter bacterial communities in the active layer of Svalbard permafrost revealed by DNA- and RNA-based analyses. Front. Microbiol. 2015, 6, 399. [Google Scholar] [CrossRef] [PubMed]
- Hill, R.; Saetnan, E.R.; Scullion, J.; Gwynn-Jones, D.; Ostle, N.; Edwards, A. Temporal and spatial influences incur reconfiguration of Arctic heathland soil bacterial community structure. Environ. Microbiol. 2016, 18, 1942–1953. [Google Scholar] [CrossRef] [PubMed]
- Martikainen, P. Heterotrophic nitrification—An eternal mystery in the nitrogen cycle. Soil Biol. Biochem. 2022, 168, 108611. [Google Scholar] [CrossRef]
- Ma, W.K.; Schautz, A.; Fishback, L.A.E.; Bedard-Haughn, A.; Farrell, R.E.; Siciliano, S.D. Assessing the potential of ammonia oxidizing bacteria to produce nitrous oxide in soils of a high arctic lowland ecosystem on Devon Island, Canada. Soil Biol. Biochem. 2007, 39, 2001–2013. [Google Scholar] [CrossRef]
- Booth, M.S.; Stark, J.M.; Rastetter, E. Controls on nitrogen cycling in terrestrial ecosystems: A synthetic analysis of literature data. Ecol. Monogr. 2005, 75, 139–157. [Google Scholar] [CrossRef]
- Surey, R.; Lippold, E.; Heilek, S.; Sauheitl, L.; Henjes, S.; Horn, M.A.; Mueller, C.W.; Merbach, I.; Kaiser, K.; Bottcher, J.; et al. Differences in labile soil organic matter explain potential denitrification and denitrifying communities in a long-term fertilization experiment. Appl. Soil Ecol. 2020, 153, 103630. [Google Scholar] [CrossRef]
- Koch, H.; van Kessel, M.A.H.J.; Lucker, S. Complete nitrification: Insights into the ecophysiology of comammox Nitrospira. Appl. Microbiol. Biotechnol. 2019, 103, 177–189. [Google Scholar] [CrossRef]
- Wagner, D.; Spieck, E.; Bock, E.; Pfeiffer, E.-M. Microbial life in terrestrial permafrost: Methanogenesis and nitrification in gelisols as potentials for exobiological processes. In Astrobiology: The Quest for the Conditions of Life; Horneck, G., Baumstark-Khan, C., Eds.; Springer: Berlin, Germany; New York, NY, USA, 2001; pp. 143–159. [Google Scholar]
- Bartosch, S.; Hartwig, C.; Spieck, E.; Bock, E. Immunological detection of nitrospira-like bacteria in various soils. Microb. Ecol. 2002, 43, 26–33. [Google Scholar] [CrossRef]
- Binkley, D.; Stottlemyer, R.; Suarez, F.; Cortina, J. Soil nitrogen availability in some arctic ecosystems in northwest Alaska: Responses to temperature and moisture. Ecoscience 1994, 1, 64–70. [Google Scholar] [CrossRef]
- Atkin, O.K. Reassessing the nitrogen relations of Arctic plants: A mini-review. Plant Cell Environ. 1996, 19, 695–704. [Google Scholar] [CrossRef]
- Wilson, K.; Sprent, J.I.; Hopkins, D.W. Nitrification in Antarctic soils. Nature 1997, 385, 404. [Google Scholar] [CrossRef]
- Hart, S.C.; Gunther, A.J. In situ estimates of annual net nitrogen mineralization and nitrification in a subarctic watershed. Oecologia 1989, 80, 284–288. [Google Scholar] [CrossRef]
- Jones, D.L.; Kielland, K. Soil amino acid turnover dominates the nitrogen flux in permafrost-dominated taiga forest soils. Soil Biol. Biochem. 2002, 34, 209–219. [Google Scholar] [CrossRef]
- Yergeau, E.; Hogues, H.; Whyte, L.G.; Greer, C.W. The functional potential of high Arctic permafrost revealed by metagenomic sequencing, qPCR and microarray analyses. ISME J. 2010, 4, 1206–1214. [Google Scholar] [CrossRef]
- Liebner, S.; Harder, J.; Wagner, D. Bacterial diversity and community structure in polygonal tundra soils from Samoylov Island, Lena Delta, Siberia. Int. Microbiol. 2008, 11, 195–202. [Google Scholar] [CrossRef]
- Pester, M.; Rattei, T.; Flechl, S.; Grongroft, A.; Richter, A.; Overmann, J.; Reinhold-Hurek, B.; Loy, A.; Wagner, M. amoA-based consensus phylogeny of ammonia-oxidizing archaea and deep sequencing of amoA genes from soils of four different geographic regions. Environ. Microbiol. 2012, 14, 525–539. [Google Scholar] [CrossRef]
- Magalhães, C.M.; Machado, A.; Frank-Fahle, B.; Lee, C.K.; Cary, S.C. The ecological dichotomy of ammonia-oxidizing archaea and bacteria in the hyper-arid soils of the Antarctic Dry Valleys. Front. Microbiol. 2014, 5, 515. [Google Scholar] [CrossRef]
- Hayashi, K.; Shimomura, Y.; Morimoto, S.; Uchida, M.; Nakatsubo, T.; Hayatsu, M. Characteristics of ammonia oxidation potentials and ammonia oxidizers in mineral soil under Salix polaris–moss vegetation in Ny-Ålesund, Svalbard. Polar Biol. 2016, 39, 725–741. [Google Scholar] [CrossRef]
- Hayashi, K.; Tanabe, Y.; Fujitake, N.; Kida, M.; Wang, Y.; Hayatsu, M.; Kudoh, S. Ammonia oxidation potentials and ammonia oxidizers of lichen-moss vegetated soils at two ice-free areas in east antarctica. Microbes Environ. 2020, 35, ME19126. [Google Scholar] [CrossRef]
- Barnard, S.; Van Goethem, M.W.; de Scally, S.Z.; Cowan, D.A.; van Rensburg, P.J.; Claassens, S.; Makhalanyane, T.P. Increased temperatures alter viable microbial biomass, ammonia oxidizing bacteria and extracellular enzymatic activities in Antarctic soils. FEMS Microbiol. Ecol. 2020, 96, fiaa065. [Google Scholar] [CrossRef] [PubMed]
- Pessi, I.S.; Viitamäki, S.; Virkkala, A.-M.; Eronen-Rasimus, E.; Delmont, T.O.; Marushchak, M.E.; Luoto, M.; Hultman, J. In-depth characterization of denitrifier communities across different soil ecosystems in the tundra. Biorxiv 2022, 17, 30. [Google Scholar] [CrossRef]
- Pessi, I.S.; Rutanen, A.; Hultmanl, J. Candidatus Nitrosopolaris, a genus of putative ammonia oxidizing archaea with a polar/alpine distribution. Biorxiv 2021. preprint. [Google Scholar] [CrossRef]
- Stackhouse, B.T.; Vishnivetskaya, T.A.; Layton, A.; Chauhan, A.; Pfiffner, S.; Mykytczuk, N.C.; Sanders, R.; Whyte, L.G.; Hedin, L.; Saad, N.; et al. Effects of simulated spring thaw of permafrost from mineral cryosol on CO2 emissions and atmospheric CH4 uptake. J. Geophys. Res. Biogeosci. 2015, 120, 1764–1784. [Google Scholar] [CrossRef]
- Xue, Y.; Jonassen, I.; Øvreås, L.; Taş, N. Bacterial and archaeal metagenome-assembled genome sequences from svalbard permafrost. Microbiol. Resour. Announc. 2019, 8, e00516-19. [Google Scholar] [CrossRef] [PubMed]
- Mackelprang, R.; Saleska, S.R.; Jacobsen, C.S.; Jansson, J.K.; Tas, N. Permafrost meta-omics and climate change. Annu Rev. Earth Planet. Sci. 2016, 44, 439–462. [Google Scholar] [CrossRef]
- Monteux, S.; Keuper, F.; Fontaine, S.; Gavazov, K.; Hallin, S.; Juhanson, J.; Krab, E.J.; Revaillot, S.; Verbruggen, E.; Walz, J.; et al. Carbon and nitrogen cycling in Yedoma permafrost controlled by microbial functional limitations. Nat. Geosci. 2020, 13, 794–798. [Google Scholar] [CrossRef]
- Aigle, A.; Prosser, J.I.; Gubry-Rangin, C. The application of high-throughput sequencing technology to analysis of amoA phylogeny and environmental niche specialisation of terrestrial bacterial ammonia-oxidisers. Environ. Microbiome 2019, 14, 1–10. [Google Scholar] [CrossRef]
- Wang, Q.; Zhu, R.; Zheng, Y.; Bao, T.; Hou, L. Effects of sea animal colonization on the coupling between dynamics and activity of soil ammonia-oxidizing bacteria and archaea in maritime Antarctica. Biogeosciences 2019, 16, 4113–4128. [Google Scholar] [CrossRef]
- Dai, H.T.; Zhu, R.B.; Sun, B.W.; Che, C.S.; Hou, L.J. Effects of sea animal activities on tundra soil denitrification and nirS- and nirK-encoding denitrifier community in maritime antarctica. Front. Microbiol. 2020, 11, 573302. [Google Scholar] [CrossRef]
- Alves, R.J.E.; Kerou, M.; Zappe, A.; Bittner, R.; Abby, S.S.; Schmidt, H.A.; Pfeifer, K.; Schleper, C. Ammonia Oxidation by the Arctic Terrestrial Thaumarchaeote Candidatus Nitrosocosmicus arcticus Is Stimulated by Increasing Temperatures. Front. Microbiol. 2019, 10, 1571. [Google Scholar] [CrossRef] [PubMed]
- Kits, K.D.; Jung, M.Y.; Vierheilig, J.; Pjevac, P.; Sedlacek, C.J.; Liu, S.; Herbold, C.; Stein, L.Y.; Richter, A.; Wissel, H.; et al. Low yield and abiotic origin of N2O formed by the complete nitrifier Nitrospira inopinata. Nat. Commun. 2019, 10, 1836. [Google Scholar] [CrossRef] [PubMed]
- Stein, L.Y. The long-term relationship between microbial metabolism and greenhouse gases. Trends Microbiol. 2020, 28, 500–511. [Google Scholar] [CrossRef] [PubMed]
- Inatomi, M.; Hajima, T.; Ito, A. Fraction of nitrous oxide production in nitrification and its effect on total soil emission: A meta-analysis and global-scale sensitivity analysis using a process-based model. PLoS ONE 2019, 14, e0219159. [Google Scholar] [CrossRef] [PubMed]
- Pärn, J.; Verhoeven, J.T.A.; Butterbach-Bahl, K.; Dise, N.B.; Ullah, S.; Aasa, A.; Egorov, S.; Espenberg, M.; Järveoja, J.; Jauhiainen, J.; et al. Nitrogen-rich organic soils under warm well-drained conditions are global nitrous oxide emission hotspots. Nat. Commun. 2018, 9, 1135. [Google Scholar] [CrossRef]
- Bouskill, N.; Tang, J.; Riley, W.; Brodie, E. Trait-based representation of biological nitrification: Model development, testing, and predicted community composition. Front. Microbiol. 2012, 3, 364. [Google Scholar] [CrossRef]
- Keuter, S.; Koch, H.; Sass, K.; Wegen, S.; Lee, N.; Lucker, S.; Spieck, E. Some like it cold: The cellular organization and physiological limits of cold-tolerant nitrite-oxidizing Nitrotoga. Environ. Microbiol. 2022, 24, 2059–2077. [Google Scholar] [CrossRef]
- Zumft, W.G.; Kroneck, P.M. Respiratory transformation of nitrous oxide (N2O) to dinitrogen by Bacteria and Archaea. Adv. Microb. Physiol. 2007, 52, 107–227. [Google Scholar] [CrossRef]
- Shoun, H.; Fushinobu, S.; Jiang, L.; Kim, S.W.; Wakagi, T. Fungal denitrification and nitric oxide reductase cytochrome P450nor. Philos. Trans. R. Soc. B Biol. Sci. 2012, 367, 1186–1194. [Google Scholar] [CrossRef]
- Simek, M.; Cooper, J.E. The influence of soil pH on denitrification: Progress towards the understanding of this interaction over the last 50 years. Eur. J. Soil Sci. 2002, 53, 345–354. [Google Scholar] [CrossRef]
- Dalal, R.C.; Allen, D.E. Greenhouse gas fluxes from natural ecosystems. Aust. J. Bot. 2008, 56, 369–407. [Google Scholar] [CrossRef]
- Scheer, C.; Fuchs, K.; Pelster, D.E.; Butterbach-Bahl, K. Estimating global terrestrial denitrification from measured N2O: (N2O + N2) product ratios. Curr. Opin. Environ. Sustain. 2020, 47, 72–80. [Google Scholar] [CrossRef]
- Gil, J.; Marushchak, M.E.; Rutting, T.; Baggs, E.M.; Perez, T.; Novakovskiy, A.; Trubnikova, T.; Kaverin, D.; Martikainen, P.J.; Biasi, C. Sources of nitrous oxide and the fate of mineral nitrogen in subarctic permafrost peat soils. Biogeosciences 2022, 19, 2683–2698. [Google Scholar] [CrossRef]
- Siciliano, S.D.; Ma, W.K.; Ferguson, S.; Farrell, R.E. Nitrifier dominance of Arctic soil nitrous oxide emissions arises due to fungal competition with denitrifiers for nitrate. Soil Biol. Biochem. 2009, 41, 1104–1110. [Google Scholar] [CrossRef]
- Christensen, T.R. Potential and actual trace gas fluxes in Arctic terrestrial ecosystems. Polar Res. 1999, 18, 199–206. [Google Scholar] [CrossRef]
- Palmer, K.; Biasi, C.; Horn, M.A. Contrasting denitrifier communities relate to contrasting N2O emission patterns from acidic peat soils in arctic tundra. ISME J. 2012, 6, 1058–1077. [Google Scholar] [CrossRef]
- Yang, S.Z.; Liebner, S.; Walz, J.; Knoblauch, C.; Bornemann, T.L.V.; Probst, A.J.; Wagner, D.; Jetten, M.S.M.; in ‘t Zandt, M.H. Effects of a long-term anoxic warming scenario on microbial community structure and functional potential of permafrost-affected soil. Permafr. Periglac. Process. 2021, 32, 641–656. [Google Scholar] [CrossRef]
- Frey, K.E.; McClelland, J.W.; Holmes, R.M.; Smith, L.C. Impacts of climate warming and permafrost thaw on the riverine transport of nitrogen and phosphorus to the Kara Sea. J. Geophys. Res. Biogeosci. 2007, 112, G04S58. [Google Scholar] [CrossRef]
- Bowden, W.B.; Gooseff, M.N.; Balser, A.; Green, A.; Peterson, B.J.; Bradford, J. Sediment and nutrient delivery from thermokarst features in the foothills of the North Slope, Alaska: Potential impacts on headwater stream ecosystems. J. Geophys. Res. Biogeosci. 2008, 113, G02026. [Google Scholar] [CrossRef]
- McNamara, J.P.; Kane, D.L.; Hobbie, J.E.; Kling, G.W. Hydrologic and biogeochemical controls on the spatial and temporal patterns of nitrogen and phosphorus in the Kuparuk River, arctic Alaska. Hydrol. Process. Int. J. 2008, 22, 3294–3309. [Google Scholar] [CrossRef]
- Abbott, B.W.; Larouche, J.R.; Jones, J.B.; Bowden, W.B.; Balser, A.W. Elevated dissolved organic carbon biodegradability from thawing and collapsing permafrost. J. Geophys. Res. Biogeosci. 2014, 119, 2049–2063. [Google Scholar] [CrossRef]
- Louiseize, N.L.; Lafrenière, M.J.; Hastings, M.G. Stable isotopic evidence of enhanced export of microbially derived NO3-following active layer slope disturbance in the Canadian High Arctic. Biogeochemistry 2014, 121, 565–580. [Google Scholar] [CrossRef]
- Lafreniere, M.J.; Louiseize, N.L.; Lamoureux, S.F. Active layer slope disturbances affect seasonality and composition of dissolved nitrogen export from High Arctic headwater catchments. Arct. Sci. 2017, 3, 429–450. [Google Scholar] [CrossRef]
- Tanski, G.; Lantuit, H.; Ruttor, S.; Knoblauch, C.; Radosavljevic, B.; Strauss, J.; Wolter, J.; Irrgang, A.M.; Ramage, J.; Fritz, M. Transformation of terrestrial organic matter along thermokarst-affected permafrost coasts in the Arctic. Sci. Total Environ. 2017, 581–582, 434–447. [Google Scholar] [CrossRef]
- Repo, M.E.; Susiluoto, S.; Lind, S.E.; Jokinen, S.; Elsakov, V.; Biasi, C.; Virtanen, T.; Martikainen, P.J. Large N2O emissions from cryoturbated peat soil in tundra. Nat. Geosci. 2009, 2, 189–192. [Google Scholar] [CrossRef]
- Marushchak, M.E.; Voigt, C.; Gil, J.; Lamprecht, R.; Trubnikova, T.; Kaverin, D.; Martikainen, P.J.; Biasi, C. Which factors control the interannual variability of nitrous oxide fluxes in subarctic European Russian tundra? In Proceedings of the 20th EGU Gerneral Assembly, Vienna, Austria, 4–13 April 2018. [Google Scholar]
- Diáková, K.; Biasi, C.; Čapek, P.; Martikainen, P.J.; Marushchak, M.E.; Patova, E.N.; Šantrůčková, H. Variation in N2 fixation in subarctic tundra in relation to landscape position and nitrogen pools and fluxes. Arct. Antarct. Alp. Res. 2016, 48, 111–125. [Google Scholar] [CrossRef]
- Gil, J.; Pérez, T.; Boering, K.; Martikainen, P.J.; Biasi, C. Mechanisms responsible for high N2O emissions from subarctic permafrost peatlands studied via stable isotope techniques. Glob. Biogeochem. Cycles 2017, 31, 172–189. [Google Scholar] [CrossRef]
- Yang, G.; Peng, Y.; Marushchak, M.E.; Chen, Y.; Wang, G.; Li, F.; Zhang, D.; Wang, J.; Yu, J.; Liu, L.; et al. Magnitude and pathways of increased nitrous oxide emissions from uplands following permafrost thaw. Environ. Sci. Technol. 2018, 52, 9162–9169. [Google Scholar] [CrossRef]
- Elberling, B.; Christiansen, H.H.; Hansen, B.U. High nitrous oxide production from thawing permafrost. Nat. Geosci. 2010, 3, 332–335. [Google Scholar] [CrossRef]
- Jonasson, S.; Chapin, F.S.; Shaver, G.R. Biogeochemistry in the Arctic: Patterns, processes, and controls. In Global Biogeochemical Cycles in the Climate System; Schulze, E.-D., Heimann, M., Harrison, S., Holland, E., Lloyd, J., Prentice, I.C., Schimel, D., Eds.; Academic Press: San Diego, CA, USA, 2001; pp. 139–150. [Google Scholar] [CrossRef]
- Wild, B.; Schnecker, J.; Bárta, J.; Čapek, P.; Guggenberger, G.; Hofhansl, F.; Kaiser, C.; Lashchinsky, N.; Mikutta, R.; Mooshammer, M.; et al. Nitrogen dynamics in turbic cryosols from Siberia and Greenland. Soil Biol. Biochem. 2013, 67, 85–93. [Google Scholar] [CrossRef]
- Heikoop, J.M.; Throckmorton, H.M.; Newman, B.D.; Perkins, G.B.; Iversen, C.M.; Roy Chowdhury, T.; Romanovsky, V.; Graham, D.E.; Norby, R.J.; Wilson, C.J.; et al. Isotopic identification of soil and permafrost nitrate sources in an Arctic tundra ecosystem. J. Geophys. Res. Biogeosci. 2015, 120, 1000–1017. [Google Scholar] [CrossRef]
- Voigt, C.; Marushchak, M.E.; Mastepanov, M.; Lamprecht, R.E.; Christensen, T.R.; Dorodnikov, M.; Jackowicz-Korczyński, M.; Lindgren, A.; Lohila, A.; Nykänen, H.; et al. Ecosystem carbon response of an Arctic peatland to simulated permafrost thaw. Glob. Chang. Biol. 2019, 25, 1746–1764. [Google Scholar] [CrossRef]
- Grogan, P.; Jonasson, S. Controls on annual nitrogen cycling in the understory of a subarctic birch forest. Ecology 2003, 84, 202–218. [Google Scholar] [CrossRef]
- Glanville, H.C.; Hill, P.W.; Maccarone, L.D.; Golyshin, P.N.; Murphy, D.V.; Jones, D.L. Temperature and water controls on vegetation emergence, microbial dynamics, and soil carbon and nitrogen fluxes in a high Arctic tundra ecosystem. Funct. Ecol. 2012, 26, 1366–1380. [Google Scholar] [CrossRef]
- Westergaard-Nielsen, A.; Balstrom, T.; Treier, U.A.; Normand, S.; Elberling, B. Estimating meltwater retention and associated nitrate redistribution during snowmelt in an Arctic tundra landscape. Environ. Res. Lett. 2020, 15, 034025. [Google Scholar] [CrossRef]
- Rasmussen, L.H.; Zhang, W.; Ambus, P.; Jansson, P.-E.; Kitzler, B.; Elberling, B. Nitrogen transport in a tundra landscape: The effects of early and late growing season lateral N inputs on arctic soil and plant N pools and N2O Fluxes. Biogeochemistry 2021, 157, 69–84. [Google Scholar] [CrossRef]
- Treat, C.C.; Wollheim, W.M.; Varner, R.K.; Bowden, W.B. Longer thaw seasons increase nitrogen availability for leaching during fall in tundra soils. Environ. Res. Lett. 2016, 11, 064013. [Google Scholar] [CrossRef]
- Shogren, A.J.; Zarnetske, J.P.; Abbott, B.W.; Iannucci, F.; Bowden, W.B. We cannot shrug off the shoulder seasons: Addressing knowledge and data gaps in an Arctic headwater. Environ. Res. Lett. 2020, 15, 104027. [Google Scholar] [CrossRef]
- Hobbie, S.E.; Chapin, F.S. Winter regulation of tundra litter carbon and nitrogen dynamics. Biogeochemistry 1996, 35, 327–338. [Google Scholar] [CrossRef]
- Schimel, J.P.; Clein, J.S. Microbial response to freeze-thaw cycles in tundra and taiga soils. Soil Biol. Biochem. 1996, 28, 1061–1066. [Google Scholar] [CrossRef]
- Herrmann, A.; Witter, E. Sources of C and N contributing to the flush in mineralization upon freeze-thaw cycles in soils. Soil Biol. Biochem. 2002, 34, 1495–1505. [Google Scholar] [CrossRef]
- Edwards, K.A.; McCulloch, J.; Kershaw, G.P.; Jefferies, R.L. Soil microbial and nutrient dynamics in a wet Arctic sedge meadow in late winter and early spring. Soil Biol. Biochem. 2006, 38, 2843–2851. [Google Scholar] [CrossRef]
- Hayashi, K.; Tanabe, Y.; Ono, K.; Loonen, M.J.J.E.; Asano, M.; Fujitani, H.; Tokida, T.; Uchida, M.; Hayatsu, M. Seabird-affected taluses are denitrification hotspots and potential N2O emitters in the High Arctic. Sci. Rep. 2018, 8, 17261. [Google Scholar] [CrossRef]
- Zhu, R.B.; Liu, Y.H.; Xu, H.; Ma, J.; Zhao, S.P.; Sun, L.G. Nitrous oxide emissions from sea animal colonies in the maritime Antarctic. Geophys. Res. Lett. 2008, 35, L09807. [Google Scholar] [CrossRef]
- Zhu, R.B.; Liu, Y.S.; Xu, H.; Ma, D.W.; Jiang, S. Marine animals significantly increase tundra N2O and CH4 emissions in maritime Antarctica. J. Geophys. Res. Biogeosci. 2013, 118, 1773–1792. [Google Scholar] [CrossRef]
- Sun, L.G.; Zhu, R.B.; Xie, Z.Q.; Xing, G.X. Emissions of nitrous oxide and methane from Antarctic Tundra: Role of penguin dropping deposition. Atmos. Environ. 2002, 36, 4977–4982. [Google Scholar] [CrossRef]
- Abbott, B.W.; Rocha, A.V.; Shogren, A.; Zarnetske, J.P.; Iannucci, F.; Bowden, W.B.; Bratsman, S.P.; Patch, L.; Watts, R.; Fulweber, R.; et al. Tundra wildfire triggers sustained lateral nutrient loss in Alaskan Arctic. Glob. Chang. Biol. 2021, 27, 1408–1430. [Google Scholar] [CrossRef]
- Schirrmeister, L.; Kunitsky, V.; Grosse, G.; Wetterich, S.; Meyer, H.; Schwamborn, G.; Babiy, O.; Derevyagin, A.; Siegert, C. Sedimentary characteristics and origin of the Late Pleistocene Ice Complex on north-east Siberian Arctic coastal lowlands and islands A review. Quart. Int. 2011, 241, 3–25. [Google Scholar] [CrossRef]
- Seppala, M. Synthesis of studies of palsa formation underlining the importance of local environmental and physical characteristics. Quat. Res. 2011, 75, 366–370. [Google Scholar] [CrossRef]
- Kaverin, D.A.; Pastukhov, A.V.; Lapteva, E.M.; Biasi, C.; Marushchak, M.; Martikainen, P. Morphology and properties of the soils of permafrost peatlands in the southeast of the Bol’shezemel’skaya tundra. Eurasian Soil Sci. 2016, 49, 498–511. [Google Scholar] [CrossRef]
- Yakushev, A.V.; Matyshak, G.V.; Tarkhov, M.O.; Kachalkin, A.V.; Sefilyan, A.R.; Petrov, D.G. Microbiological characteristics of bare peat circles on flat-topped peat mounds in the north of Western Siberia. Eurasian Soil Sci. 2019, 52, 1081–1090. [Google Scholar] [CrossRef]
- Valiranta, M.; Marushchak, M.E.; Tuovinen, J.P.; Lohila, A.; Biasi, C.; Voigt, C.; Zhang, H.; Piilo, S.; Virtanen, T.; Rasanen, A.; et al. Warming climate forcing impact from a sub-arctic peatland as a result of late Holocene permafrost aggradation and initiation of bare peat surfaces. Quat. Sci. Rev. 2021, 264, 107022. [Google Scholar] [CrossRef]
- Biasi, C.; Jokinen, S.; Marushchak, M.E.; Hämäläinen, K.; Trubnikova, T.; Oinonen, M.; Martikainen, P.J. microbial respiration in arctic upland and peat soils as a source of atmospheric carbon dioxide. Ecosystems 2014, 17, 112–126. [Google Scholar] [CrossRef]
- Sannel, A.B.K.; Kuhry, P. Long-term stability of permafrost in subarctic peat plateaus, west-central Canada. Holocene 2008, 18, 589–601. [Google Scholar] [CrossRef]
- Hugelius, G. Spatial upscaling using thematic maps: An analysis of uncertainties in permafrost soil carbon estimates. Glob. Biogeochem. Cycles 2012, 26, 1–15. [Google Scholar] [CrossRef]
- Voigt, C.; Lamprecht, R.E.; Marushchak, M.E.; Lind, S.E.; Novakovskiy, A.; Aurela, M.; Martikainen, P.J.; Biasi, C. Warming of subarctic tundra increases emissions of all three important greenhouse gases–carbon dioxide, methane, and nitrous oxide. Glob. Chang. Biol. 2017, 23, 3121–3138. [Google Scholar] [CrossRef]
- Voigt, C.; Marushchak, M.E.; Lamprecht, R.E.; Jackowicz-Korczyński, M.; Lindgren, A.; Mastepanov, M.; Granlund, L.; Christensen, T.R.; Tahvanainen, T.; Martikainen, P.J.; et al. Increased nitrous oxide emissions from Arctic peatlands after permafrost thaw. Proc. Natl. Acad. Sci. USA 2017, 114, 6238–6243. [Google Scholar] [CrossRef]
- Hugelius, G.; Virtanen, T.; Kaverin, D.; Pastukhov, A.; Rivkin, F.; Marchenko, S.; Romanovsky, V.; Kuhry, P. High-resolution mapping of ecosystem carbon storage and potential effects of permafrost thaw in periglacial terrain, European Russian Arctic. J. Geophys. Res. Biogeosci. 2011, 116, G03024. [Google Scholar] [CrossRef]
- Marushchak, M.E.; Kiepe, I.; Biasi, C.; Elsakov, V.; Friborg, T.; Johansson, T.; Soegaard, H.; Virtanen, T.; Martikainen, P.J. Carbon dioxide balance of subarctic tundra from plot to regional scales. Biogeosciences 2013, 10, 437–452. [Google Scholar] [CrossRef]
- Marushchak, M.E.; Friborg, T.; Biasi, C.; Herbst, M.; Johansson, T.; Kiepe, I.; Liimatainen, M.; Lind, S.E.; Martikainen, P.J.; Virtanen, T.; et al. Methane dynamics in the subarctic tundra: Combining stable isotope analyses, plot- and ecosystem-scale flux measurements. Biogeosciences 2016, 13, 597–608. [Google Scholar] [CrossRef]
- Flessa, H.; Rodionov, A.; Guggenberger, G.; Fuchs, H.; Magdon, P.; Shibistova, O.; Zrazhevskaya, G.; Mikheyeva, N.; Kasansky, O.A.; Blodau, C. Landscape controls of CH4 fluxes in a catchment of the forest tundra ecotone in northern Siberia. Glob. Chang. Biol. 2008, 14, 2040–2056. [Google Scholar] [CrossRef]
- Hetz, S.A.; Horn, M.A. Burkholderiaceae are key acetate assimilators during complete denitrification in acidic cryoturbated peat circles of the Arctic tundra. Front. Microbiol. 2021, 12, 628269. [Google Scholar] [CrossRef] [PubMed]
- Palmer, K.; Horn, M.A. Actinobacterial nitrate reducers and proteobacterial denitrifiers are abundant in N2O-metabolizing palsa peat. Appl. Environ. Microbiol. 2012, 78, 5584–5596. [Google Scholar] [CrossRef]
- Bhattarai, H.R.; Marushchak, M.E.; Ronkainen, J.; Lamprecht, R.E.; Siljanen, H.M.P.; Martikainen, P.J.; Biasi, C.; Maljanen, M. Emissions of atmospherically reactive gases nitrous acid and nitric oxide from Arctic permafrost peatlands. Environ. Res. Lett. 2022, 17, 024034. [Google Scholar] [CrossRef]
- Wegner, R.; Fiencke, C.; Knoblauch, C.; Sauerland, L.; Beer, C. Rapid permafrost thaw removes nitrogen limitation and rises the potential of N2O emissions. Nitrogen 2022. (submitted). [Google Scholar]
- Melchert, J.O.; Wischhöfer, P.; Knoblauch, C.; Eckhard, T.; Liebner, S.; Rethemeyer, J. Sources of CO2 produced in freshly thawed Pleistocene-age Yedoma permafrost. Front. Earth Sci. 2022, 9, 737237. [Google Scholar] [CrossRef]
- Hetz, S.A.; Poehlein, A.; Horn, M.A. Whole-genome sequences of two new caballeronia strains isolated from cryoturbated peat circles of the permafrost-affected eastern european tundra. Microbiol Resour. Announc. 2020, 9, e00731-20. [Google Scholar] [CrossRef] [PubMed]
- Gubry-Rangin, C.; Nicol, G.W.; Prosser, J.I. Archaea rather than bacteria control nitrifcation in two agricultural acidic soils. FEMS Microbiol. Ecol. 2010, 74, 566–574. [Google Scholar] [CrossRef]
- Prosser, J.I.; Nicol, G.W. Archaeal and bacterial ammonia-oxidisers in soil: The quest for niche specialisation and differentiation. Trends Microbiol. 2012, 20, 523–531. [Google Scholar] [CrossRef]
- Zhang, L.M.; Hu, H.W.; Shen, J.P.; He, J.Z. Ammonia-oxidizing archaea have more important role than ammonia-oxidizing bacteria in ammonia oxidation of strongly acidic soils. ISME J. 2012, 6, 1032–1045. [Google Scholar] [CrossRef]
- Wang, H.; Bagnoud, A.; Ponce-Toledo, R.I.; Kerou, M.; Weil, M.; Schleper, C.; Urich, T. Linking 16S rRNA gene classification to amoA Gene taxonomy reveals environmental distribution of ammonia-oxidizing archaeal clades in peatland soils. Msystems 2021, 6, e0054621. [Google Scholar] [CrossRef]
- Pautler, B.G.; Simpson, A.J.; Mcnally, D.J.; Lamoureux, S.F.; Simpson, M.J. Arctic permafrost active layer detachments stimulate microbial activity and degradation of soil organic matter. Env. Sci. Technol. 2010, 44, 4076–4082. [Google Scholar] [CrossRef] [PubMed]
- Abbott, B.W.; Jones, J.B.; Godsey, S.E.; Larouche, J.R.; Bowden, W.B. Patterns and persistence of hydrologic carbon and nutrient export from collapsing upland permafrost. Biogeosci. Discuss. 2015, 12, 3725–3740. [Google Scholar] [CrossRef]
- Schuur, E.A.G.; McGuire, A.D.; Schädel, C.; Grosse, G.; Harden, J.W.; Hayes, D.J.; Hugelius, G.; Koven, C.D.; Kuhry, P.; Lawrence, D.M.; et al. Climate change and the permafrost carbon feedback. Nature 2015, 520, 171–179. [Google Scholar] [CrossRef] [PubMed]
- Yang, G.; Peng, Y.; Olefeldt, D.; Chen, Y.; Wang, G.; Li, F.; Zhang, D.; Wang, J.; Yu, J.; Liu, L.; et al. Changes in methane flux along a permafrost thaw sequence on the tibetan plateau. Environ. Sci. Technol. 2018, 52, 1244–1252. [Google Scholar] [CrossRef]
- Verdonen, M.; Berner, L.T.; Forbes, B.C.; Kumpula, T. Periglacial vegetation dynamics in Arctic Russia: Decadal analysis of tundra regeneration on landslides with time series satellite imagery. Environ. Res. Lett. 2020, 15, 105020. [Google Scholar] [CrossRef]
- Kokelj, S.V.; Jorgenson, M.T. Advances in thermokarst research. Permafr. Periglac. Process. 2013, 24, 108–119. [Google Scholar] [CrossRef]
- Lantuit, H.; Pollard, W.H.; Couture, N.; Fritz, M.; Schirrmeister, L.; Meyer, H.; Hubberten, H.W. Modern and late holocene retrogressive thaw slump activity on the yukon coastal plain and Herschel Island, Yukon Territory, Canada. Permafr. Periglac. Process. 2012, 23, 39–51. [Google Scholar] [CrossRef]
- Olefeldt, D.; Goswami, S.; Grosse, G.; Hayes, D.; Hugelius, G.; Kuhry, P.; McGuire, A.D.; Romanovsky, V.E.; Sannel, A.B.; Schuur, E.A.; et al. Circumpolar distribution and carbon storage of thermokarst landscapes. Nat. Commun. 2016, 7, 13043. [Google Scholar] [CrossRef]
- Zhang, T.; Heginbottom, J.A.; Barry, R.G.; Brown, J. Further statistics on the distribution of permafrost and ground ice in the Northern Hemisphere1. Polar Geogr. 2000, 24, 126–131. [Google Scholar] [CrossRef]
- Grosse, G.; Harden, J.; Turetsky, M.; McGuire, A.D.; Camill, P.; Tarnocai, C.; Frolking, S.; Schuur, E.A.G.; Jorgenson, T.; Marchenko, S.; et al. Vulnerability of high-latitude soil organic carbon in North America to disturbance. J. Geophys. Res. Biogeosci. 2011, 116, G00k06. [Google Scholar] [CrossRef]
- Slater, A.G.; Lawrence, D.M. Diagnosing present and future permafrost from climate models. J. Clim. 2013, 26, 5608–5623. [Google Scholar] [CrossRef]
- Lacelle, D.; Bjornson, J.; Lauriol, B. Climatic and geomorphic factors affecting contemporary (1950–2004) activity of retrogressive thaw slumps on the Aklavik Plateau, Richardson Mountains, NWT, Canada. Permafr. Periglac. Process. 2010, 21, 1–15. [Google Scholar] [CrossRef]
- Lacelle, D.; Brooker, A.; Fraser, R.H.; Kokelj, S.V. Distribution and growth of thaw slumps in the Richardson Mountains-Peel Plateau region, northwestern Canada. Geomorphology 2015, 235, 40–51. [Google Scholar] [CrossRef]
- Mu, C.; Zhang, T.; Zhang, X.; Li, L.; Guo, H.; Zhao, Q.; Cao, L.; Wu, Q.; Cheng, G. Carbon loss and chemical changes from permafrost collapse in the northern Tibetan Plateau. J. Geophys. Res. Biogeosci. 2016, 121, 1781–1791. [Google Scholar] [CrossRef]
- Mu, C.C.; Abbott, B.W.; Zhao, Q.; Su, H.; Wang, S.F.; Wu, Q.B.; Zhang, T.J.; Wu, X.D. Permafrost collapse shifts alpine tundra to a carbon source but reduces N2O and CH4 release on the northern Qinghai-Tibetan Plateau. Geophys. Res. Lett. 2017, 44, 8945–8952. [Google Scholar] [CrossRef]
- Luo, J.; Niu, F.J.; Lin, Z.J.; Liu, M.H.; Yin, G.A. Recent acceleration of thaw slumping in permafrost terrain of Qinghai-Tibet Plateau: An example from the Beiluhe Region. Geomorphology 2019, 341, 79–85. [Google Scholar] [CrossRef]
- Lantuit, H.; Atkinson, D.; Paul Overduin, P.; Grigoriev, M.; Rachold, V.; Grosse, G.; Hubberten, H.-W. Coastal erosion dynamics on the permafrost-dominated Bykovsky Peninsula, north Siberia, 1951–2006. Polar Res. 2011, 30, 7341. [Google Scholar] [CrossRef]
- Stettner, S.; Beamish, A.; Bartsch, A.; Heim, B.; Grosse, G.; Roth, A.; Lantuit, H. Monitoring inter-and intra-seasonal dynamics of rapidly degrading ice-rich permafrost riverbanks in the Lena Delta with TerraSAR-X time series. Remote Sens. 2017, 10, 51. [Google Scholar] [CrossRef]
- Fuchs, M.; Nitze, I.; Strauss, J.; Gunther, F.; Wetterich, S.; Kizyakov, A.; Fritz, M.; Opel, T.; Grigoriev, M.N.; Maksimov, G.T.; et al. Rapid fluvio-thermal erosion of a yedoma permafrost cliff in the lena river delta. Front. Earth Sci. 2020, 8, 336. [Google Scholar] [CrossRef]
- Czudek, T.; Demek, J. Thermokarst in Siberia and its influence on the development of lowland relief. Quart. Res. 1970, 1, 103–120. [Google Scholar] [CrossRef]
- Strauss, J.; Schirrmeister, L.; Mangelsdorf, K.; Eichhorn, L.; Wetterich, S.; Herzschuh, U. Organic-matter quality of deep permafrost carbon–A study from Arctic Siberia. Biogeosciences 2015, 12, 2227–2245. [Google Scholar] [CrossRef]
- Strauss, J.; Schirrmeister, L.; Grosse, G.; Fortier, D.; Hugelius, G.; Knoblauch, C.; Romanovsky, V.; Schädel, C.; Schneider von Deimling, T.; Schuur, E.A.G.; et al. Deep Yedoma permafrost: A synthesis of depositional characteristics and carbon vulnerability. Earth-Sci. Rev. 2017, 172, 75–86. [Google Scholar] [CrossRef]
- Zimov, S.A.; Schuur, E.A.G.; Chapin, F.S. Permafrost and the global carbon budget. Science 2006, 312, 1612–1613. [Google Scholar] [CrossRef] [PubMed]
- Jensen, A.E.; Lohse, K.A.; Crosby, B.T.; Mora, C.I. Variations in soil carbon dioxide efflux across a thaw slump chronosequence in northwestern Alaska. Environ. Res. Lett. 2014, 9, 025001. [Google Scholar] [CrossRef]
- Knoblauch, C.; Beer, C.; Schuett, A.; Sauerland, L.; Liebner, S.; Steinhof, A.; Rethemeyer, J.; Grigoriev, M.N.; Faguet, A.; Pfeiffer, E.M. Carbon dioxide and methane release following abrupt thaw of pleistocene permafrost deposits in Arctic siberia. J. Geophys. Res. Biogeosci. 2021, 126, e2021JG006543. [Google Scholar] [CrossRef]
- Kanevskiy, M.; Shur, Y.; Strauss, J.; Jorgenson, T.; Fortier, D.; Stephani, E.; Vasiliev, A. Patterns and rates of riverbank erosion involving ice-rich permafrost (yedoma) in northern Alaska. Geomorphology 2016, 253, 370–384. [Google Scholar] [CrossRef]
- Pizano, C.; Barón, A.F.; Schuur, E.A.G.; Crummer, K.G.; Mack, M.C. Effects of thermo-erosional disturbance on surface soil carbon and nitrogen dynamics in upland arctic tundra. Environ. Res. Lett. 2014, 9, 075006. [Google Scholar] [CrossRef]
- Burn, C.R.; Friele, P.A. Geomorphology, vegetation succession, soil characteristics and permafrost in retrogressive thaw slumps near mayo, Yukon Territory. Arctic 1989, 42, 31–40. [Google Scholar] [CrossRef]
- Lantz, T.C.; Kokelj, S.V.; Gergel, S.E.; Henry, G.H.R. Relative impacts of disturbance and temperature: Persistent changes in microenvironment and vegetation in retrogressive thaw slumps. Glob. Chang. Biol. 2009, 15, 1664–1675. [Google Scholar] [CrossRef]
- Buckeridge, K.M.; Schaeffer, S.M.; Schimel, J.P. Vegetation leachate during Arctic thaw enhances soil microbial phosphorus. Ecosystems 2016, 19, 477–489. [Google Scholar] [CrossRef]
- Lantuit, H.; Pollard, W.H. Fifty years of coastal erosion and retrogressive thaw slump activity on Herschel Island, southern Beaufort Sea, Yukon Territory, Canada. Geomorphology 2008, 95, 84–102. [Google Scholar] [CrossRef]
- Cray, H.A.; Pollard, W.H. Vegetation recovery patterns following permafrost disturbance in a Low Arctic setting: Case study of Herschel Island, Yukon, Canada. Arct. Antarct. Alp. Res. 2015, 47, 99–113. [Google Scholar] [CrossRef]
- Vonk, J.E.; Mann, P.J.; Davydov, S.; Davydova, A.; Spencer, R.G.M.; Schade, J.; Sobczak, W.V.; Zimov, N.; Zimov, S.; Bulygina, E.; et al. High biolability of ancient permafrost carbon upon thaw. Geophys. Res. Lett. 2013, 40, 2689–2693. [Google Scholar] [CrossRef]
- Knoblauch, C.; Beer, C.; Liebner, S.; Grigoriev, M.N.; Pfeiffer, E.-M. Methane production as key to the greenhouse gas budget of thawing permafrost. Nat. Clim. Chang. 2018, 8, 309–312. [Google Scholar] [CrossRef]
- Tanski, G.; Wagner, D.; Knoblauch, C.; Fritz, M.; Sachs, T.; Lantuit, H. Rapid CO2 Release from eroding permafrost in seawater. Geophys. Res. Lett. 2019, 46, 11244–11252. [Google Scholar] [CrossRef]
- Turner, K.W.; Pearce, M.D.; Hughes, D.D. detailed characterization and monitoring of a retrogressive thaw slump from remotely piloted aircraft systems and identifying associated influence on carbon and nitrogen export. Remote Sens. 2021, 13, 171. [Google Scholar] [CrossRef]
- Everett, K.R. Evolution of the soil landscape in the sand region of the Arctic Coastal Plain as exemplified at Atkasook, Alaska. Arctic. Arctic 1979, 32, 207–223. [Google Scholar] [CrossRef]
- Schickhoff, U.; Walker, M.D.; Walker, D.A. Riparian willow communities on the Arctic Slope of Alaska and their environmental relationships: A classification and ordination analysis. Phytocoenologia 2002, 32, 145–204. [Google Scholar] [CrossRef]
- Dobrovol’ski, G.V.; Balabko, P.N.; Stasjuk, N.V.; Bykova, E.P. Alluvial soils of river floodplains and deltas and their zonal differences. Arid Ecosyst. 2011, 1, 119–124. [Google Scholar] [CrossRef]
- Sanders, T.; Fiencke, C.; Pfeiffer, E.-M. Small-scale variability of dissolved inorganic nitrogen (DIN), C/N ratios and ammonia oxidizing capacities in various permafrost affected soils of Samoylov Island, Lena River Delta, Northeast Siberia. Polarforschung 2010, 80, 23–35. [Google Scholar]
- Polyakov, V.; Orlova, K.; Abakumov, E. Soils of the lena river delta, Yakutia, Russia: Diversity, characteristics and humic acids molecular composition. Polarforschung 2019, 88, 135–150. [Google Scholar] [CrossRef]
- Sanders, T.; Fiencke, C.; Fuchs, M.; Haugk, C.; Juhls, B.; Mollenhauer, G.; Ogneva, O.; Overduin, P.; Palmtag, J.; Povazhniy, V.; et al. Seasonal nitrogen fluxes of the Lena River Delta. Ambio 2021, 51, 423–438. [Google Scholar] [CrossRef] [PubMed]
- Pinay, G.; Bernal, S.; Abbott, B.W.; Lupon, A.; Marti, E.; Sabater, F.; Krause, S. Riparian corridors: A new conceptual framework for assessing nitrogen buffering across biomes. Front. Environ. Sci. 2018, 6, 47. [Google Scholar] [CrossRef]
- Gregorich, E.G.; Hopkins, D.W.; Elberling, B.; Sparrow, A.D.; Novis, P.; Greenfield, L.G.; Rochette, P. Emission of CO2, CH4 and N2O from lakeshore soils in an Antarctic dry valley. Soil Biol. Biochem. 2006, 38, 3120–3129. [Google Scholar] [CrossRef]
- Hopkins, D.W.; Sparrow, A.D.; Elberling, B.; Gregorich, E.G.; Novis, P.M.; Greenfiled, L.G.; Tilston, E.L. Carbon, nitrogen and temperature controls on microbial activity in soils from an Antarctic dry valley. Soil Biol. Biochem. 2006, 38, 3120–3140. [Google Scholar] [CrossRef]
- Rocha, A.V.; Loranty, M.M.; Higuera, P.E.; Mack, M.C.; Hu, F.S.; Jones, B.M.; Breen, A.L.; Rastetter, E.B.; Goetz, S.J.; Shaver, G.R. The footprint of Alaskan tundra fires during the past half-century: Implications for surface properties and radiative forcing. Environ. Res. Lett. 2012, 7, 044039. [Google Scholar] [CrossRef]
- Hu, F.S.; Higuera, P.E.; Duffy, P.; Chipman, M.L.; Rocha, A.V.; Young, A.M.; Kelly, R.; Dietze, M.C. Arctic tundra fires: Natural variability and responses to climate change. Front. Ecol. Environ. 2015, 13, 369–377. [Google Scholar] [CrossRef]
- Young, A.M.; Higuera, P.E.; Duffy, P.A.; Hu, F.S. Climatic thresholds shape northern high-latitude fire regimes and imply vulnerability to future climate change. Ecography 2017, 40, 606–617. [Google Scholar] [CrossRef]
- Koster, E.; Koster, K.; Berninger, F.; Aaltonen, H.; Zhou, X.; Pumpanen, J. Carbon dioxide, methane and nitrous oxide fluxes from a fire chronosequence in subarctic boreal forests of Canada. Sci. Total Environ. 2017, 601–602, 895–905. [Google Scholar] [CrossRef]
- Rodríguez-Cardona, B.M.; Coble, A.A.; Wymore, A.S.; Kolosov, R.; Podgorski, D.C.; Zito, P.; Spencer, R.G.M.; Prokushkin, A.S.; McDowell, W.H. Wildfres lead to decreased carbon and increased nitrogen concentrations in upland arctic streams. Nature 2020, 10, 1–9. [Google Scholar] [CrossRef]
- Mack, M.C.; Bret-Harte, M.S.; Hollingsworth, T.N.; Jandt, R.R.; Schuur, E.A.; Shaver, G.R.; Verbyla, D.L. Carbon loss from an unprecedented Arctic tundra wildfire. Nature 2011, 475, 489–492. [Google Scholar] [CrossRef] [PubMed]
- Higuera, P.E.; Chipman, M.L.; Barnes, J.L.; Urban, M.A.; Hu, F.S. Variability of tundra fire regimes in Arctic Alaska: Millennial-scale patterns and ecological implications. Ecol. Appl. 2011, 21, 3211–3226. [Google Scholar] [CrossRef]
- Jones, B.M.; Grosse, G.; Arp, C.D.; Miller, E.; Liu, L.; Hayes, D.J.; Larsen, C.F. Recent Arctic tundra fire initiates widespread thermokarst development. Sci. Rep. 2015, 5, 15865. [Google Scholar] [CrossRef]
- Bret-Harte, M.S.; Mack, M.C.; Shaver, G.R.; Huebner, D.C.; Johnston, M.; Mojica, C.A.; Pizano, C.; Reiskind, J.A. The response of Arctic vegetation and soils following an unusually severe tundra fire. Philos. Trans. R. Soc. B Biol. Sci. 2013, 368, 20120490. [Google Scholar] [CrossRef]
- Jiang, Y.; Rastetter, E.B.; Rocha, A.V.; Pearce, A.R.; Kwiatkowski, B.L.; Shaver, G.R. Modeling carbon-nutrient interactions during the early recovery of tundra after fire. Ecol. Appl. 2015, 25, 1640–1652. [Google Scholar] [CrossRef] [PubMed]
- Xu, W.; Lambaek, A.; Holm, S.S.; Furbo-Halken, A.; Elberling, B.; Ambus, P.L. Effects of experimental fire in combination with climate warming on greenhouse gas fluxes in Arctic tundra soils. Sci. Total Environ. 2021, 795, 148847. [Google Scholar] [CrossRef]
- Larouche, J.R.; Abbott, B.W.; Bowden, W.B.; Jones, J.B. The role of watershed characteristics, permafrost thaw, and wildfire on dissolved organic carbon biodegradability and water chemistry in Arctic headwater streams. Biogeosciences 2015, 12, 4221–4233. [Google Scholar] [CrossRef]
- Xu, W.Y.; Elberling, B.; Ambus, P.L. Fire increases soil nitrogen retention and alters nitrogen uptake patterns among dominant shrub species in an Arctic dry heath tundra. Sci. Total Environ. 2022, 807, 150990. [Google Scholar] [CrossRef]
- Jiang, Y.; Rastetter, E.B.; Shaver, G.R.; Rocha, A.V.; Zhuang, Q.; Kwiatkowski, B.L. Modeling long-term changes in tundra carbon balance following wildfire, climate change, and potential nutrient addition. Ecol. Appl. 2016, 27, 105–117. [Google Scholar] [CrossRef]
- Lacroix, F.; Zaehle, S.; Caldararu, S.; Schaller, J.; Stimmler, P.; Holl, D.; Kutzbach, L.; Göckede, M. Decoupling of permafrost thaw and vegetation growth could mean both ongoing nutrient limitation and an emergent source of N2O in high latitudes. Earth Space Sci. Open Arch. 2022, preprint. [Google Scholar] [CrossRef]
- Tian, H.; Yang, J.; Lu, C.; Xu, R.; Canadell, J.G.; Jackson, R.B.; Arneth, A.; Chang, J.; Chen, G.; Ciais, P.; et al. The Global N2O Model Intercomparison Project. Bull. Am. Meteorol. Soc. 2018, 99, 1231–1251. [Google Scholar] [CrossRef]
- Syakila, A.; Kroeze, C. The global nitrous oxide budget revisited. Greenh. Gas. Meas. Manag. 2011, 1, 17–26. [Google Scholar] [CrossRef]
- Kuzyakov, Y.; Friedel, J.K.; Stahr, K. Review of mechanisms and quantification of priming effects. Soil Biol. Biochem. 2000, 32, 1485–1498. [Google Scholar] [CrossRef]
- Wild, B.; Schnecker, J.; Alves, R.J.E.; Barsukov, P.; Bárta, J.; Čapek, P.; Gentsch, N.; Gittel, A.; Guggenberger, G.; Lashchinskiy, N.; et al. Input of easily available organic C and N stimulates microbial decomposition of soil organic matter in arctic permafrost soil. Soil Biol. Biochem. 2014, 75, 143–151. [Google Scholar] [CrossRef] [PubMed]
- Wologo, E.; Shakil, S.; Zolkos, S.; Textor, S.; Ewing, S.; Klassen, J.; Spencer, R.G.M.; Podgorski, D.C.; Tank, S.E.; Baker, M.A.; et al. Stream dissolved organic matter in permafrost regions shows surprising compositional similarities but negative priming and nutrient effects. Glob. Biogeochem. Cycles 2021, 35, e2020GB006719. [Google Scholar] [CrossRef]
- Lavoie, M.; Mack, M.C.; Schuur, E.A.G. Effects of elevated nitrogen and temperature on carbon and nitrogen dynamics in Alaskan arctic and boreal soils. J. Geophys. Res. Biogeosci. 2011, 116, G03013. [Google Scholar] [CrossRef]
- Wild, B.; Gentsch, N.; Čapek, P.; Diáková, K.; Alves, R.J.E.; Bárta, J.; Gittel, A.; Hugelius, G.; Knoltsch, A.; Kuhry, P.; et al. Plant-derived compounds stimulate the decomposition of organic matter in arctic permafrost soils. Sci. Rep. 2016, 6, 25607. [Google Scholar] [CrossRef]
- Manzoni, S.; Taylor, P.; Richter, A.; Porporato, A.; Agren, G.I. Environmental and stoichiometric controls on microbial carbon-use efficiency in soils. New Phytol. 2012, 196, 79–91. [Google Scholar] [CrossRef]
- Craine, J.M.; Morrow, C.; Fierer, N. Microbial nitrogen limitation increases decomposition. Ecology 2007, 88, 2105–2113. [Google Scholar] [CrossRef]
- Cavicchioli, R.; Ripple, W.J.; Timmis, K.N.; Azam, F.; Bakken, L.R.; Baylis, M.; Behrenfeld, M.J.; Boetius, A.; Boyd, P.W.; Classen, A.T.; et al. Scientists’ warning to humanity: Microorganisms and climate change. Nat. Rev. Microbiol. 2019, 17, 569–586. [Google Scholar] [CrossRef] [PubMed]
- Kicklighter, D.W.; Melillo, J.M.; Monier, E.; Sokolov, A.P.; Zhuang, Q. Future nitrogen availability and its effect on carbon sequestration in Northern Eurasia. Nat. Commun. 2019, 10, 3024. [Google Scholar] [CrossRef] [PubMed]
- Kwon, M.J.; Jung, J.Y.; Tripathi, B.M.; Gockede, M.; Lee, Y.K.; Kim, M. Dynamics of microbial communities and CO2 and CH4 fluxes in the tundra ecosystems of the changing Arctic. J. Microbiol. 2019, 57, 325–336. [Google Scholar] [CrossRef] [PubMed]
- Burke, E.; Chadburn, S.; Huntingford, C. Thawing permafrost as a nitrogen fertiliser: Implications for climate feedbacks. Nitrogen 2022, 3, 353–375. [Google Scholar] [CrossRef]
- Lamb, E.G.; Han, S.; Lanoil, B.D.; Henry, G.H.R.; Brummell, M.E.; Banerjee, S.; Siciliano, S.D. A High Arctic soil ecosystem resists long-term environmental manipulations. Glob. Chang. Biol. 2011, 17, 3187–3194. [Google Scholar] [CrossRef]
- Chen, X.; Wang, G.; Zhang, T.; Mao, T.; Wei, D.; Hu, Z.; Song, C. Effects of warming and nitrogen fertilization on GHG flux in the permafrost region of an alpine meadow. Atmos Environ. 2017, 157, 111–124. [Google Scholar] [CrossRef]
- Kashi, N.N.; Hobbie, E.A.; Varner, R.K.; Wymore, A.S.; Ernakovich, J.G.; Giesler, R. Nutrients alter methane production and oxidation in a thawing permafrost mire. Ecosystems 2022. [Google Scholar] [CrossRef]
- Bodelier, P.L.E.; Laanbroek, H.J. Nitrogen as a regulatory factor of methane oxidation in soils and sediments. FEMS Microbiol. Ecol. 2004, 47, 265–277. [Google Scholar] [CrossRef]
- Bodelier, P.L.E. Interactions between nitrogenous fertilizers and methane cycling in wetland and upland soils. Curr. Opin. Environ. Sustain. 2011, 3, 379–388. [Google Scholar] [CrossRef]
- Bodelier, P.L.E.; Steenbergh, A.K. Interactions between methane and the nitrogen cycle in light of climate change. Curr. Opin. Environ. Sustain. 2014, 9–10, 26–36. [Google Scholar] [CrossRef]
- Klüber, H.D.; Conrad, R. Effects of nitrate, nitrite, NO and N2O on methanogenesis and other redox processes in anoxic rice field soil. FEMS Microbiol. Ecol. 1998, 25, 301–318. [Google Scholar] [CrossRef]
- Klueber, H.D.; Conrad, R. Inhibitory effects of nitrate, nitrite, NO and N2O on methanogenesis by Methanosarcina barkeri and Methanobacterium bryantii. FEMS Microbiol. Ecol. 1998, 25, 331–339. [Google Scholar] [CrossRef]
- Conrad, R. Importance of hydrogenotrophic, aceticlastic and methylotrophic methanogenesis for methane production in terrestrial, aquatic and other anoxic environments: A mini review. Pedosphere 2020, 30, 25–39. [Google Scholar] [CrossRef]
- King, G.M. Ecological aspects of methane oxidation, a key determinant of global methane dynamics. Adv. Microb. Ecol. 1992, 12, 431–468. [Google Scholar] [CrossRef]
- Stein, L.Y.; Roy, R.; Dunfield, P.F. Aerobic methanotrophy and nitrification: Processes and connections. In Encyclopedia of Life Sciences (eLS); Battista, J., Bynum, W., Cooper, D., Delves, P.J., Harper, D., Jansson, R., Kehrer-Sawatzki, H., Levitan, I., Melino, G., Phillips, G., et al., Eds.; John Wiley and Sons: Chichester, UK, 2012; pp. 1–11. [Google Scholar] [CrossRef]
- Lee, E.Y. Methanotrophs-Microbiology Fundamentals and Biotechnological Applications; Springer: Münster, Germany, 2019; Volume 32. [Google Scholar]
- Yonemura, S.; Uchida, M.; Iwahana, G.; Kim, Y.; Yoshikawa, K. Technical advances in measuring greenhouse gas emissions from thawing permafrost soils in the laboratory. Polar Sci. 2019, 19, 137–145. [Google Scholar] [CrossRef]
- Box, J.E.; Colgan, W.T.; Christensen, T.R.; Schmidt, N.M.; Lund, M.; Parmentier, F.J.W.; Brown, R.; Bhatt, U.S.; Euskirchen, E.S.; Romanovsky, V.E.; et al. Key indicators of Arctic climate change: 1971–2017. Environ. Res. Lett. 2019, 14, 045010. [Google Scholar] [CrossRef]
- Smith, D.M.; Screen, J.A.; Deser, C.; Cohen, J.; Fyfe, J.C.; Garcia-Serrano, J.; Jung, T.; Kattsov, V.; Matei, D.; Msadek, R.; et al. The Polar Amplification Model Intercomparison Project (PAMIP) contribution to CMIP6: Investigating the causes and consequences of polar amplification. Geosci. Model. Dev. 2019, 12, 1139–1164. [Google Scholar] [CrossRef]
- Irrgang, A.M.; Bendixen, M.; Farquharson, L.M.; Baranskaya, A.V.; Erikson, L.H.; Gibbs, A.E.; Ogorodov, S.A.; Overduin, P.P.; Lantuit, H.; Grigoriev, M.; et al. Drivers, dynamics and impacts of changing Arctic coasts. Nat. Rev. Earth Environ. 2022, 3, 39–54. [Google Scholar] [CrossRef]
- McGuire, A.D.; Lawrence, D.M.; Koven, C.; Clein, J.S.; Burke, E.; Chen, G.; Jafarov, E.; MacDougall, A.H.; Marchenko, S.; Nicolsky, D.; et al. Dependence of the evolution of carbon dynamics in the northern permafrost region on the trajectory of climate change. Proc. Natl. Acad. Sci. USA 2018, 115, 3882–3887. [Google Scholar] [CrossRef]
- Biskaborn, B.K.; Smith, S.L.; Noetzli, J.; Matthes, H.; Vieira, G.; Streletskiy, D.A.; Schoeneich, P.; Romanovsky, V.E.; Lewkowicz, A.G.; Abramov, A.; et al. Permafrost is warming at a global scale. Nat. Commun. 2019, 10, 264. [Google Scholar] [CrossRef]
- Koven, C.D.; Ringeval, B.; Friedlingstein, P.; Ciais, P.; Cadule, P.; Khvorostyanov, D.; Krinner, G.; Tarnocai, C. Permafrost carbon-climate feedbacks accelerate global warming. Proc. Natl. Acad. Sci. USA 2011, 108, 14769–14774. [Google Scholar] [CrossRef] [PubMed]
- Pearson, R.G.; Phillips, S.J.; Loranty, M.M.; Beck, P.S.A.; Damoulas, T.; Knight, S.J.; Goetz, S.J. Shifts in Arctic vegetation and associated feedbacks under climate change. Nat. Clim. Chang. 2013, 3, 673–677. [Google Scholar] [CrossRef]
- Panikov, N.S. Understanding and prediction of soil microbial community dynamics under global change. Appl. Soil Ecol. 1999, 11, 161–176. [Google Scholar] [CrossRef]
- Meyer, H.; Kaiser, C.; Biasi, C.; Hämmerle, R.; Rusalimova, O.; Lashchinsky, N.; Baranyi, C.; Daims, H.; Barsukov, P.; Richter, A. Soil carbon and nitrogen dynamics along a latitudinal transect in Western Siberia, Russia. Biogeochemistry 2006, 81, 239–252. [Google Scholar] [CrossRef]
- Walker, T.W.N.; Kaiser, C.; Strasser, F.; Herbold, C.W.; Leblans, N.I.W.; Woebken, D.; Janssens, I.A.; Sigurdsson, B.D.; Richter, A. Microbial temperature sensitivity and biomass change explain soil carbon loss with warming. Nat. Clim. Chang. 2018, 8, 885–889. [Google Scholar] [CrossRef] [PubMed]
- Ernakovich, J.G.; Barbato, R.A.; Rich, V.I.; Schadel, C.; Hewitt, R.E.; Doherty, S.J.; Whalen, E.D.; Abbott, B.W.; Barta, J.; Biasi, C.; et al. Microbiome assembly in thawing permafrost and its feedbacks to climate. Glob. Chang. Biol. 2022, 28, 5007–5026. [Google Scholar] [CrossRef]
- McGuire, A.D.; Anderson, L.G.; Christensen, T.R.; Dallimore, S.; Guo, L.D.; Hayes, D.J.; Heimann, M.; Lorenson, T.D.; Macdonald, R.W.; Roulet, N. Sensitivity of the carbon cycle in the Arctic to climate change. Ecol. Monogr. 2009, 79, 523–555. [Google Scholar] [CrossRef]
- McGuire, A.D.; Christensen, T.R.; Hayes, D.; Heroult, A.; Euskirchen, E.; Kimball, J.S.; Koven, C.; Lafleur, P.; Miller, P.A.; Oechel, W.; et al. An assessment of the carbon balance of Arctic tundra: Comparisons among observations, process models, and atmospheric inversions. Biogeosciences 2012, 9, 3185–3204. [Google Scholar] [CrossRef]
- Schuur, E.A.G.; Abbott, B.W.; Bowden, W.B.; Brovkin, V.; Camill, P.; Canadell, J.G.; Chanton, J.P.; Chapin, F.S.; Christensen, T.R.; Ciais, P.; et al. Expert assessment of vulnerability of permafrost carbon to climate change. Clim. Chang. 2013, 119, 359–374. [Google Scholar] [CrossRef]
- Treat, C.C.; Natali, S.M.; Ernakovich, J.; Iversen, C.M.; Lupascu, M.; McGuire, A.D.; Norby, R.J.; Roy Chowdhury, T.; Richter, A.; Šantrůčková, H.; et al. A pan-Arctic synthesis of CH4 and CO2 production from anoxic soil incubations. Glob. Chang. Biol. 2015, 21, 2787–2803. [Google Scholar] [CrossRef]
- Dutta, K.; Schuur, E.A.G.; Neff, J.C.; Zimov, S.A. Potential carbon release from permafrost soils of Northeastern Siberia. Glob. Chang. Biol. 2006, 12, 2336–2351. [Google Scholar] [CrossRef]
- Schaefer, K.; Lantuit, H.; Romanovsky, V.E.; Schuur, E.A.G.; Witt, R. The impact of the permafrost carbon feedback on global climate. Environ. Res. Lett. 2014, 9, 085003. [Google Scholar] [CrossRef]
- Rustad, L.E.; Campbell, J.L.; Marion, G.M.; Norby, R.J.; Mitchell, M.J.; Hartley, A.E.; Cornelissen, J.H.C.; Gurevitch, J.; Gcte-News. A meta-analysis of the response of soil respiration, net nitrogen mineralization, and aboveground plant growth to experimental ecosystem warming. Oecologia 2001, 126, 543–562. [Google Scholar] [CrossRef] [PubMed]
- Schaeffer, S.M.; Sharp, E.; Schimel, J.P.; Welker, J.M. Soil-plant N processes in a High Arctic ecosystem, NW Greenland are altered by long-term experimental warming and higher rainfall. Glob. Chang. Biol. 2013, 19, 3529–3539. [Google Scholar] [CrossRef] [PubMed]
- Craine, J.M.; Elmore, A.J.; Wang, L.; Aranibar, J.; Bauters, M.; Boeckx, P.; Crowley, B.E.; Dawes, M.A.; Delzon, S.; Fajardo, A.; et al. Isotopic evidence for oligotrophication of terrestrial ecosystems. Nat. Ecol. Evol. 2018, 2, 1735–1744. [Google Scholar] [CrossRef]
- Holtgrieve, G.W.; Schindler, D.E.; Hobbs, W.O.; Leavitt, P.R.; Ward, E.J.; Bunting, L.; Chen, G.; Finney, B.P.; Gregory-Eaves, I.; Holmgren, S.; et al. A coherent signature of anthropogenic nitrogen deposition to remote watersheds of the Northern Hemisphere. Science 2011, 334, 1545–1548. [Google Scholar] [CrossRef]
- Martin, A.C.; Macias-Fauria, M.; Bonsall, M.B.; Forbes, B.C.; Zetterberg, P.; Jeffers, E.S. Common mechanisms explain nitrogen-dependent growth of Arctic shrubs over three decades despite heterogeneous trends and declines in soil nitrogen availability. New Phytol. 2021, 233, 670–686. [Google Scholar] [CrossRef]
- Borge, A.F.; Westermann, S.; Solheim, I.; Etzelmuller, B. Strong degradation of palsas and peat plateaus in northern Norway during the last 60 years. Cryosphere 2017, 11, 1–16. [Google Scholar] [CrossRef]
- Fewster, R.E.; Morris, P.J.; Ivanovic, R.F.; Swindles, G.T.; Peregon, A.M.; Smith, C.J. Imminent loss of climate space for permafrost peatlands in Europe and Western Siberia. Nat. Clim. Chang. 2022, 12, 373–379. [Google Scholar] [CrossRef]
- Liljedahl, A.K.; Boike, J.; Daanen, R.P.; Fedorov, A.N.; Frost, G.V.; Grosse, G.; Hinzman, L.D.; Iijma, Y.; Jorgenson, J.C.; Matveyeva, N.; et al. Pan-Arctic ice-wedge degradation in warming permafrost and its influence on tundra hydrology. Nat. Geosci. 2016, 9, 312–318. [Google Scholar] [CrossRef]
- Runge, A.; Nitze, I.; Grosse, G. Remote sensing annual dynamics of rapid permafrost thaw disturbances with LandTrendr. Remote Sens. Environ. 2022, 268, 112752. [Google Scholar] [CrossRef]
- Abbott, B.W.; Jones, J.B.; Schuur, E.A.G.; Chapin, F.S.; Bowden, W.B.; Bret-Harte, M.S.; Epstein, H.E.; Flannigan, M.D.; Harms, T.K.; Hollingsworth, T.N.; et al. Biomass offsets little or none of permafrost carbon release from soils, streams, and wildfire: An expert assessment. Environ. Res. Lett. 2016, 11, 034014. [Google Scholar] [CrossRef]
- Hu, F.S.; Higuera, P.E.; Walsh, J.E.; Chapman, W.L.; Duffy, P.A.; Brubaker, L.B.; Chipman, M.L. Tundra burning in Alaska: Linkages to climatic change and sea ice retreat. J. Geophys. Res. Biogeosci. 2010, 115, G04002. [Google Scholar] [CrossRef]
- Luoto, M.; Fronzek, S.; Zuidhoff, F.S. Spatial modelling of palsa mires in relation to climate in northern Europe. Earth Surf. Process. Landf. J. Br. Geomorphol. Res. Group 2004, 29, 1373–1387. [Google Scholar] [CrossRef]
- Fronzek, S.; Luoto, M.; Carter, T.R. Potential effect of climate change on the distribution of palsa mires in subarctic Fennoscandia. Clim. Res. 2006, 32, 1–12. [Google Scholar] [CrossRef]
- Hazard, C.; Prosser, J.I.; Nicol, G.W. Use and abuse of potential rates in soil microbiology. Soil Biol. Biochem. 2021, 157, 108242. [Google Scholar] [CrossRef]
- Shogren, A.J.; Zarnetske, J.P.; Abbott, B.W.; Iannucci, F.; Medvedeff, A.; Cairns, S.; Duda, M.J.; Bowden, W.B. Arctic concentration–discharge relationships for dissolved organic carbon and nitrate vary with landscape and season. Limnol. Oceanogr. 2020, 66, S197–S215. [Google Scholar] [CrossRef]
- Wegner, R.; (Universität Hamburg, Hamburg, Germany). Personal communications, 2022.
- Marushchak, M.; (University of Eastern Finland, Kuopio, Finland). Personal communications, 2022.
Figure 1.
Map of study sites of N hotspots in the Arctic and the Antarctic in the continuous and discontinuous permafrost zone summarized in this review. Study sites of permafrost peatlands are marked in red, the sites of hillslope thermokarst in yellow, sites of alluvial soils in green and animal-influenced sites in purple. Maps modified after Brown et al. [31].

Figure 2.
Levels of N availability in permafrost-affected soils. (I) N limitation level with tight, mainly organic N cycle dominated by depolymerization and zero or negative net N ammonification rates. Plants and soil organisms compete strongly for dissolved organic N (DON) and ammonium in soils with high soil organic matter (SOM) content and high C/N ratio in bulk soil, which is mainly controlled by high water content. (II) Intermediate N level with more open N cycle, indicated by positive net N ammonification, therefore higher ammonium content and lower N competition. (III) N hotspot level with lower N immobilization (uptake) and therefore more available N for net inorganic N turnover and therefore more open N cycling with aerobic nitrification and anaerobic denitrification, both processes producing the gases nitric oxide (NO) and nitrous oxide (N2O) (in addition to N2 of denitrification) with the highly mobile nitrate for leaching as an intermediate product. This N level is characterized by a low C/N ratio <25 in bulk soil and intermediate moisture. Due to high inorganic N forms ammonium and nitrate, this level is called N hotspot of N availability.
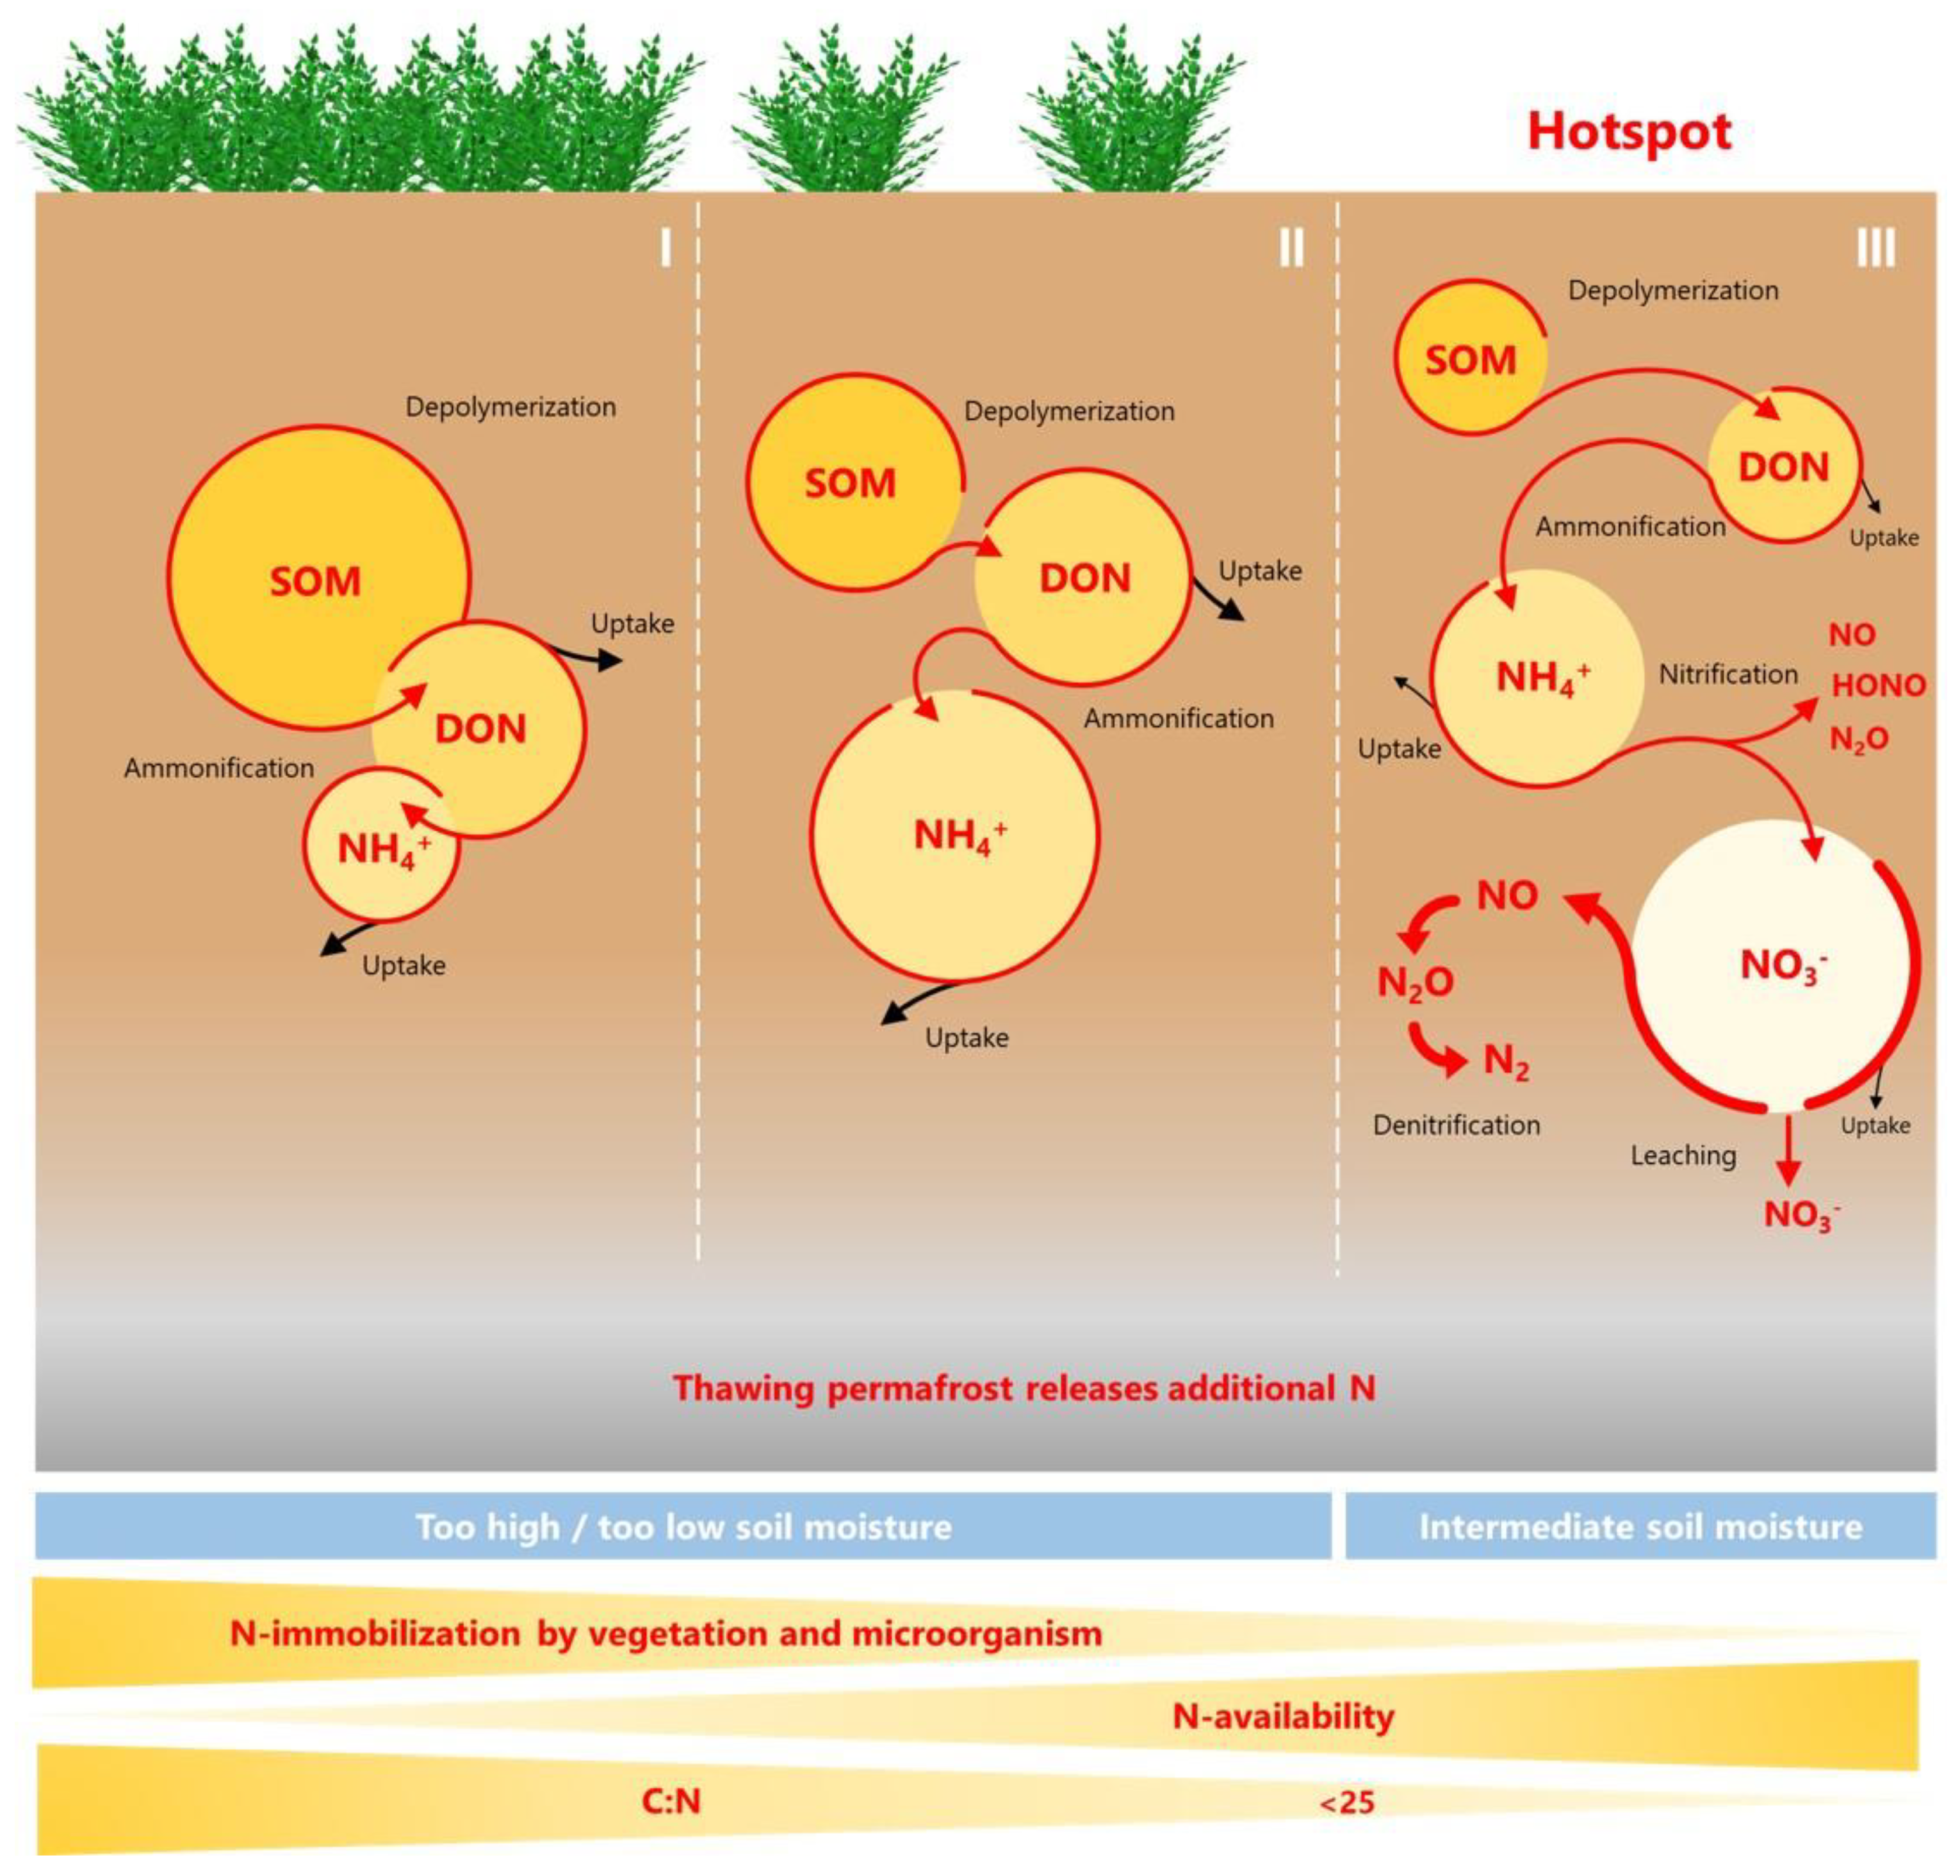
Figure 3.
Photographs of hotspots with high N availability. (A) permafrost peatland in Seida, Komi Republic, Russia (N 67°03′, E 62°57′) with bare peat and vegetation on the frozen peat plateau (July 2010, Maija Marushchak), (B) palsa mire in Utsjoki, Finland (N 67°45′, E 27°00′) with bare and vegetated palsa underlied by permafrost and wet fen surface without permafrost (August 2009, Maija Marushchak), (C) retrogressive thaw slump on Kurungnakh Island, Lena River Delta, Russia (N 72°20, E 126°17′), with bare and revegetated slump floor and thaw mounds (July 2016, Alexander Schütt), (D) alluvial soils on Samoylov Island, Lena River Delta, Russia, (N 72°22, E 126°28′) with bare bright organic-poor and dark organic-rich soil surfaces (July 2008, Claudia Fiencke).

Figure 4.
Hotspots of high N availability in a schematic permafrost landscape of a tundra ecosystem with (A) permafrost peat plateaus and palsas with bare peat surfaces in the discontinuous permafrost zone; hillslope thermokarst landscapes such as (B) retrogressive thaw slump in the continuous and (C) thermo-erosion gully in the discontinuous permafrost zone, (D) alluvial soils in the transition between terrestrial and aquatic ecosystems, and the occurrence of (E) animal-influenced soils and (F) wildfire throughout ecosystem. Blue arrows indicate known gaseous (N2O, NO, HONOH) and red arrows indicate lateral N (DIN, DON and TN) fluxes, black arrows indicate probability of N2O loss. N form without arrow describes enrichment in soil. DIN = dissolved inorganic, DON = dissolved organic nitrogen, TN = total nitrogen, ? = the N2O emission is largely unresolved.

Publisher’s Note: MDPI stays neutral with regard to jurisdictional claims in published maps and institutional affiliations. |
© 2022 by the authors. Licensee MDPI, Basel, Switzerland. This article is an open access article distributed under the terms and conditions of the Creative Commons Attribution (CC BY) license (https://creativecommons.org/licenses/by/4.0/).
Share and Cite
MDPI and ACS Style
Fiencke, C.; Marushchak, M.E.; Sanders, T.; Wegner, R.; Beer, C. Microbiogeochemical Traits to Identify Nitrogen Hotspots in Permafrost Regions. Nitrogen 2022, 3, 458-501. https://doi.org/10.3390/nitrogen3030031
AMA Style
Fiencke C, Marushchak ME, Sanders T, Wegner R, Beer C. Microbiogeochemical Traits to Identify Nitrogen Hotspots in Permafrost Regions. Nitrogen. 2022; 3(3):458-501. https://doi.org/10.3390/nitrogen3030031
Chicago/Turabian StyleFiencke, Claudia, Maija E. Marushchak, Tina Sanders, Rica Wegner, and Christian Beer. 2022. "Microbiogeochemical Traits to Identify Nitrogen Hotspots in Permafrost Regions" Nitrogen 3, no. 3: 458-501. https://doi.org/10.3390/nitrogen3030031