
Tree Species Influence Nitrate and Nitrous Oxide Production in Forested Riparian Soils
by
 , and
, and
Charlene N. Kelly
1,*,
Elizabeth A. Matejczyk
2,
Emma G. Fox-Fogle
2,
Jason A. Hubbart
1 and
Timothy P. Driscoll
2 1
Division of Forestry and Natural Resources, West Virginia University, Morgantown, WV 26508, USA
2
Department of Biology, West Virginia University, Morgantown, WV 26508, USA
*
Author to whom correspondence should be addressed.
Nitrogen 2023, 4(4), 311-330; https://doi.org/10.3390/nitrogen4040023
Submission received: 9 October 2023
/
Revised: 26 October 2023
/
Accepted: 27 October 2023
/
Published: 6 November 2023
Abstract
:Abundance of soil microbial nitrogen (N) cycling genes responsible for nitrification, denitrification, and nitrous oxide reduction may vary with tree species and N inputs, and these variables may be used to predict or mediate nitrate (NO3−) and nitrous oxide (N2O) from soil. Nitrification and denitrification rates have also been linked to tree mycorrhizal associations, as soil beneath species associated with arbuscular mycorrhiza (AM) shows greater nitrification rates than species forming ectomycorrhizal (ECM) associations. In this study, we integrated N microbial functional gene abundance in the soil influenced by six tree species in two sub-catchments receiving either high or low N inputs. The soils beneath the two ECM-associated tree species and the four AM-associated tree species were analyzed for inorganic N content and potential N2O flux and microbial gene abundance (nirK and nosZ) was quantified using qPCR techniques. Other parameters measured include soil pH, moisture, and organic matter. We determined that tree species influence NO3− and N2O production in riparian soils, particularly under high N enrichment. The soil beneath black cherry had the lowest pH, NO3− concentration, potential N2O production, and OM, though this result did not occur in the low N catchment. The strongest predictors of soil NO3− and N2O across the study sites were N enrichment and pH, respectively. These results provide a framework for species selection in managed riparian zones to minimize NO3− and N2O production and improve riparian function.
1. Introduction
Vegetated riparian zones, or the area of transition between land and water, are critical areas of management of nitrogenous pollutants, namely nitrate (NO3−) and nitrous oxide (N2O gas; [1,2]). Owing to their bioremediation potential, establishing such zones is considered a best management practice (BMP) priority in agricultural, urban, and forested landscapes [3,4]. Plants, soils, and microbial communities in these zones can store, assimilate, immobilize, and/or reduce NO3− and N2O, preventing them from entering aquatic systems and the atmosphere. However, these riparian management zones exhibit a wide variation in their capacity to store and/or transform N-containing compounds, differing as a function of N load, hydraulic gradient, soil texture, and hydrologic variables [5,6] and with differences in plant type (e.g., grass vs. trees), which are not consistent [7].
1.1. Nitrogen Pollutants
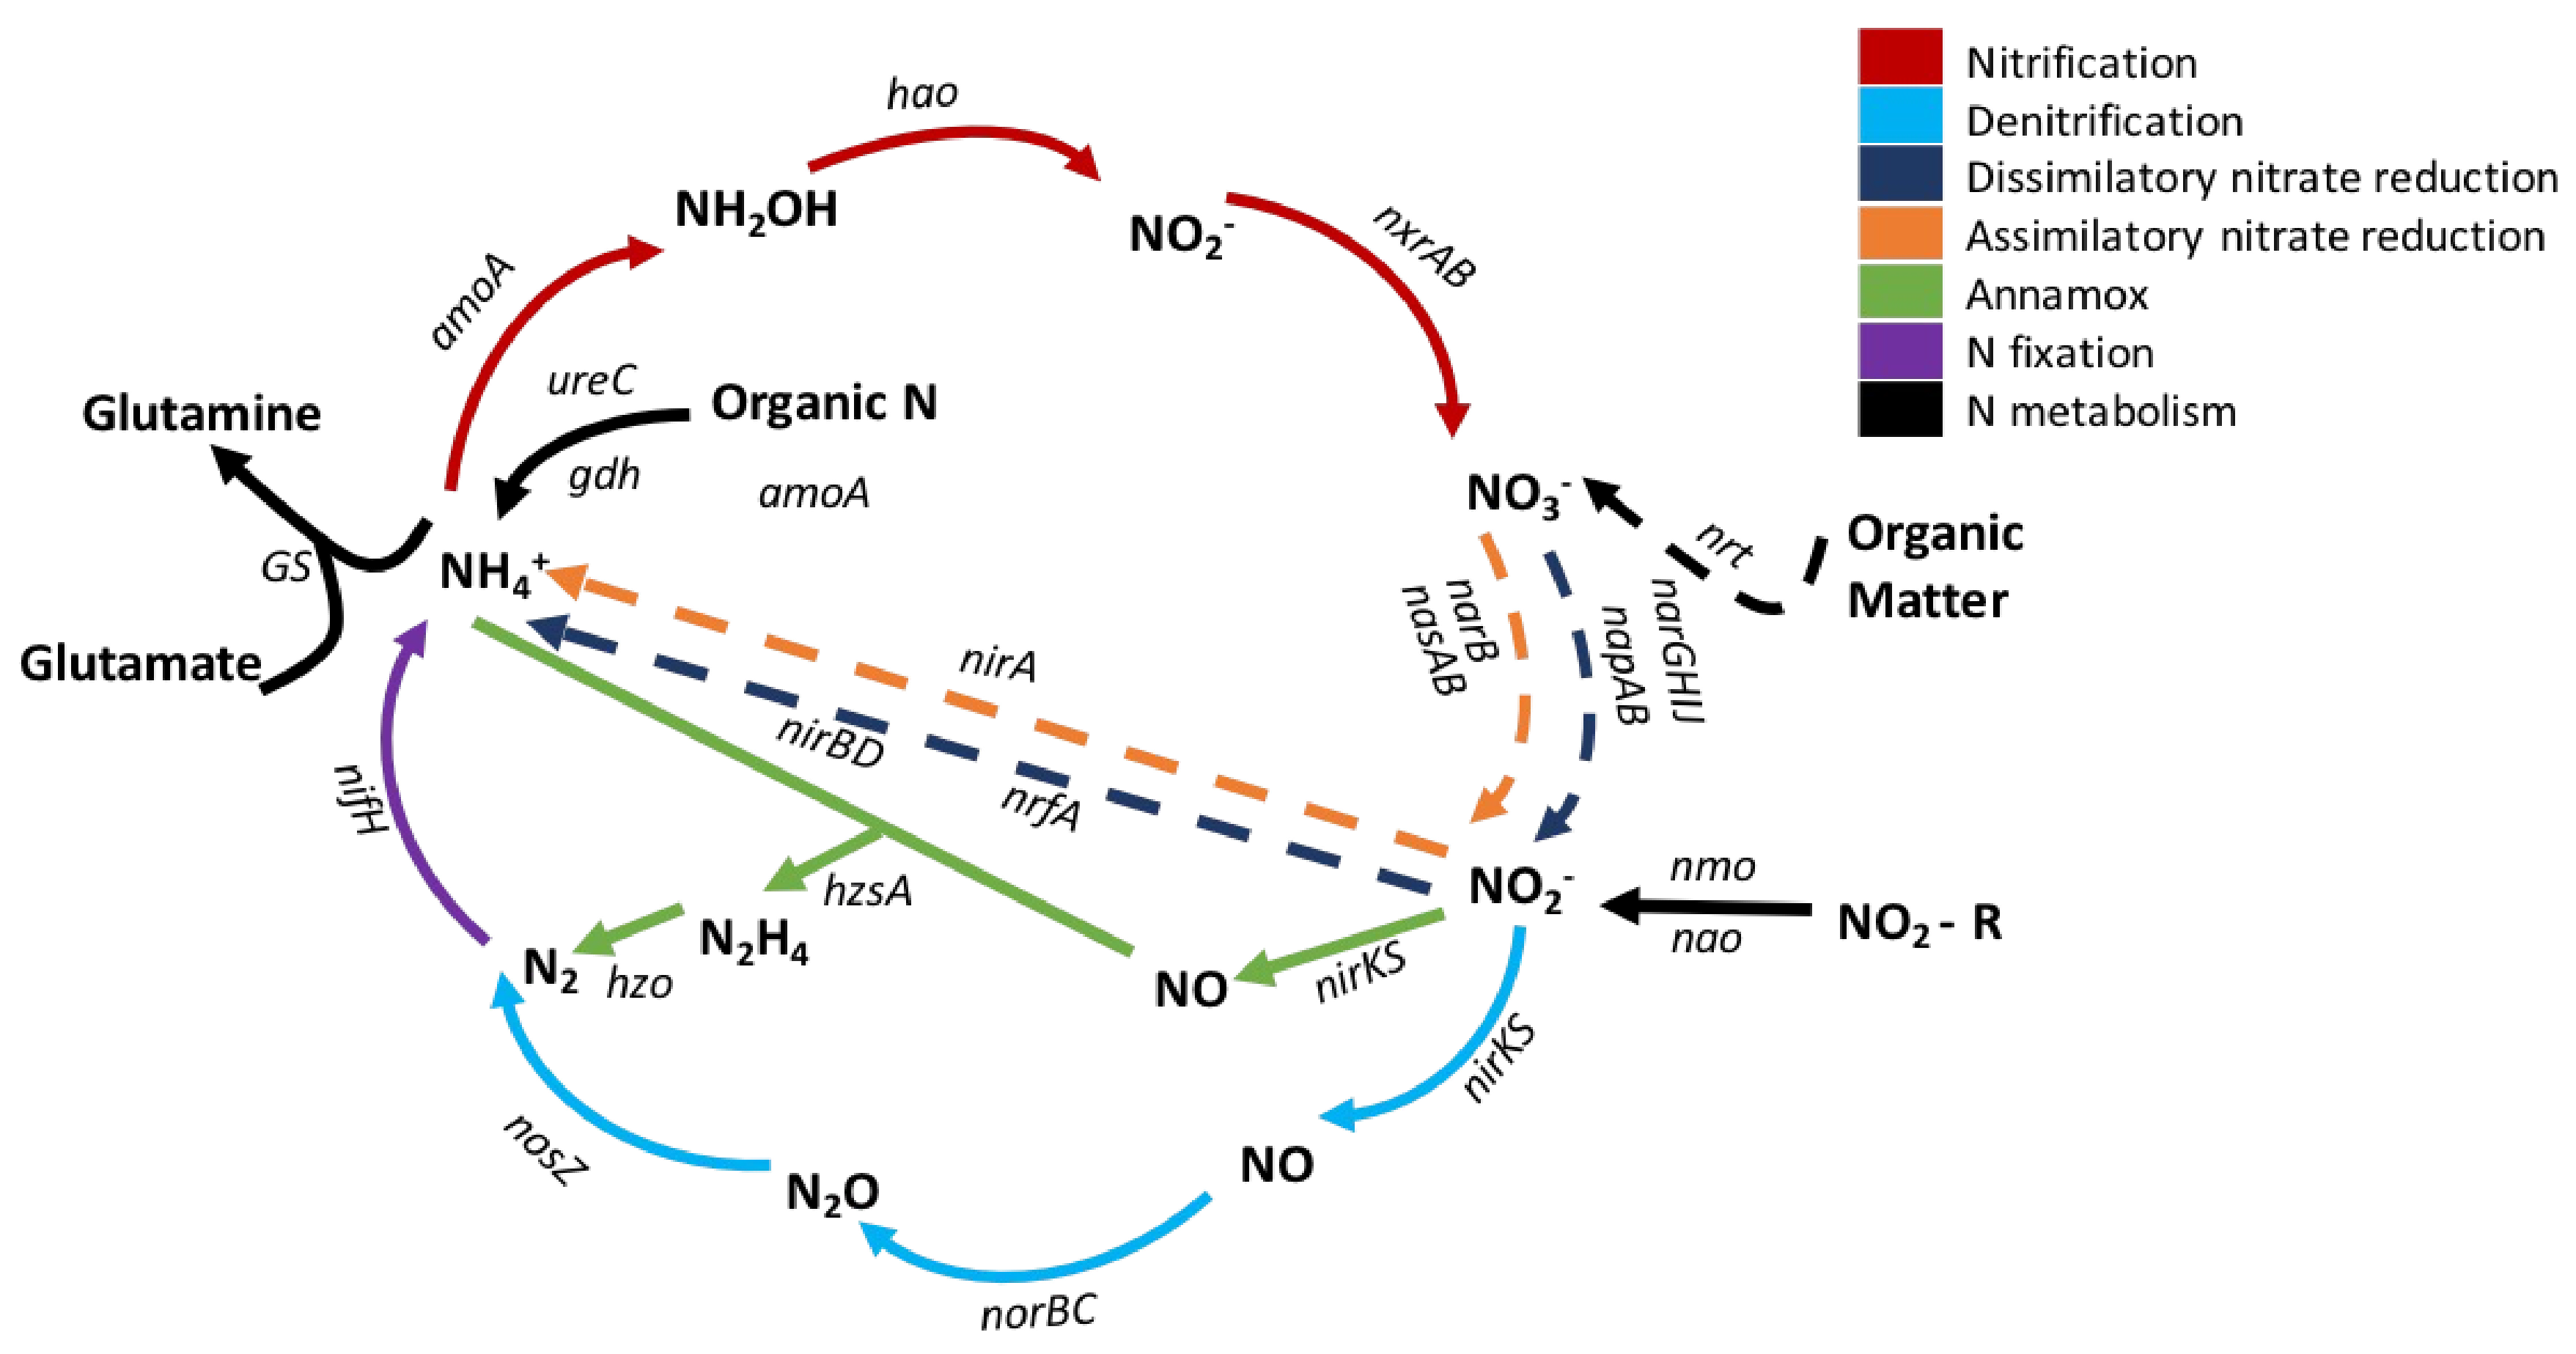
Soil nitrification and denitrification are microbially mediated steps in the N cycle, and both processes can create nitrogenous pollutants in the environment (Figure 1). One product of nitrification is NO3−, a highly mobile form of N, which may be easily transported to aquatic ecosystems and lead to eutrophication, toxic algal blooms and oxygen depletion, and degraded habitability of waterways (e.g., dead zones in the Gulf of Mexico and the Chesapeake Bay, toxic algal blooms in the Great Lakes, the Ohio River, and the Florida coastline). Additionally, NO3− can infiltrate groundwater, affecting drinking water sources. Transport of NO3− from the soil profile may also deplete soil fertility by leaching soil nutrients such as calcium and magnesium and through increasing soil acidity via base cation depletion [8]. It is ultimately estimated that more than 100,000 miles of rivers and streams, approximately 1.01 million ha of lakes, reservoirs, and ponds, and more than 800 mi2 of bays and estuaries in the United States have impaired water quality because of N and nutrient pollution [9].
Nitrification, denitrification, and dissimilatory nitrate reduction to ammonium (DNRA) are microbial processes that can produce N2O, which accounts for approximately 10% of total greenhouse gas emissions [10]. Recently, there has been great interest in quantifying specific sources of N2O as N2O gas is the largest stratospheric ozone-depleting substance emitted through human activities [11,12] and has a 300-fold greater influence on global warming processes than carbon dioxide (CO2; [13,14]). It is estimated that more than 65% of the global N2O production comes from microbial nitrification and denitrification processes in soils, which have increased with greater N soil deposition as a result of anthropogenic influences, e.g., increasing use of agricultural fertilizers, intensive grazing on pastureland, and atmospheric deposition of N [15]. N2O production may also be enhanced by greater soil carbon (C) content, as has been demonstrated in soils of no-till agriculture, in poorly aerated soil, and in riparian zones, where the soil C content is relatively greater [12,16,17,18]. The chemical quality of the C present may alter denitrification processes as well, as the addition of labile C substrates can decrease N2O:N2 product ratios, thus lowering the GHG emission potential [19]. Critically, N2O can be either an intermediate or end product in the denitrification process as N2O can be further reduced to inert N2 gas if the denitrifying microbes possess the nosZ gene that encodes enzyme nitrous oxide reductase (Figure 1). However, ~33% of the microbial denitrifying population lacks this gene, resulting in a truncated denitrification process and emission of N2O [12], which is likely common in acidified soils, as the assembly of the nitrous oxide reductase enzyme is disrupted in low-pH systems [20,21]. Hence, the microbial population may either be a sink (if N2O is reduced to N2) or a source of N2O emissions from soil [22,23].
Figure 1.
Products and processes of the nitrogen cycle. Functional genes associated with each step of the cycle are in italics. Image adapted from [24].
Figure 1.
Products and processes of the nitrogen cycle. Functional genes associated with each step of the cycle are in italics. Image adapted from [24].

1.2. Use of the Genes Associated with the N Cycle to Predict Process Rates
The abundance of functional microbial genes associated with N cycling in soil (Figure 1) can be a strong predictor of N cycling rates [25,26,27,28]. Although some uncertainty and decoupled gene abundance–process rate relationships are reported [29], other studies suggest that measures of functional gene abundance provide a powerful index to predict rates of biogeochemical processes, especially N process rates [20,21,22,23,25,26,27,28,29,30]. For example, across a vegetation gradient in Alaska, functional gene abundances were the variables most predictive of nitrification and denitrification rates, even when many other factors were considered (e.g., pH, organic matter content, N availability) [28]. That work showed that the potential nitrification rate was best explained by the abundance of the amoA bacterial gene, followed by ammonium content. Potential denitrification rates were best explained directly by the nosZ gene abundance and indirectly by nir and nirS gene abundance and nitrate content [28]. The ratio of nirK + nirS:nosZ gene abundance can also predict relative N2O production [30,31].
1.3. Tree Species Influence on N Cycling
Vegetation-mediated variation in N cycling has been documented [32,33,34,35,36,37,38,39,40]. For example, soils beneath oaks, spruces, and American chestnuts (Quercus, Picea spp., Castanea dentata, respectively) have slower N mineralization rates and thus a lower availability of N relative to soils beneath maples and yellow poplars (Acer spp. and Liriodendron tulipifera) which have much faster N mineralization and greater inorganic N availability [38,40]. In a watershed comparison study, nitrification processes between soils influenced by Norway spruce or mixed hardwoods determined that net NO3−N production was nine times higher in the hardwood-associated soil (mean = 183.51 mg N kg/28 d) than in the spruce-influenced soil (mean = 18.97 mg N kg/28 d) and, further, differences in the net NO3−N production were attributed to differences in the quality of soil substrates that are available for microbial metabolism [38]. Moreover, a laboratory incubation study showed 5–8 times greater N2O production potential in soils developed beneath grassland (1.36 mg N2O kg/h) relative to soils beneath six tree species in central Siberia. Further, of the six tree species, the soil beneath larch and cedar had the greatest N2O production potential (0.25 and 0.35 mg N2O kg/h, respectively), above that beneath spruce, aspen, birch, and pine [41].
One of the primary influences that trees have on soil microbiomes is through inputs of organic matter, both above and below ground, which varies by tree species in quantity and chemical composition [36,42,43,44]. This variability in organic matter quantity and chemical composition is hypothesized to be the main driver for differential microbial and/or sorption processes by which nutrient bioavailability and/or storage are determined [45,46]. On a larger scale, forested watersheds dominated by different tree species may result in a differential export of NO3− to streams draining the watershed. For example, watersheds dominated by oaks or spruce have significantly lower stream NO3− concentrations and annual export of N relative to maple- or poplar-dominated watersheds [38,40,47]. However, little is known regarding the influence of tree species on N2O emissions at the landscape scale [41].
A framework for predicting N availability (and potential for NO3− and N2O production) associated with tree species has been developed based on the type of symbiotic mycorrhizal fungi associated with the tree [39]. Trees with ectomycorrhizal (ECM; e.g., Quercus spp.) associations generally have poorer quality litter (e.g., high C:N, high lignin:N), slower below-ground N cycling, and low net NO3− production when compared to trees with arbuscular mycorrhizal (AM; e.g., Acer spp.) associations [48,49,50]. Trees with AM associations commonly have a greater inorganic NO3− availability in the soil relative to ECM-associated trees [49] and, importantly, greater NO3− availability has been linked to greater N2O production from the soil, e.g., the “Hole-in-Pipe” model [16,51,52]. It is plausible that riparian zone management practices within the above-described AM/ECM framework may inhibit nitrification and lead to positive environmental outcomes, as nitrification inhibition often leads to an associated decline in N2O production [31]. For example, mycorrhizal fungi can independently access forms of N, and the mycorrhizal community also influences the bacterial community structure in the soil [53]. This suggests a potential feedback mechanism tied to mycorrhizal fungi community structure and microbial N cycling to produce NO3− and N2O gas. However, tree species-mediated influence on N cycling has not been consistent across the landscape and may be additionally related to the N load influencing the plant–soil system [47].
1.4. N Fertilization Influence on N Cycling
High N availability resulting from anthropogenic sources such as elevated atmospheric N deposition or agricultural application of fertilizers has altered soil fungal and bacterial communities and function; namely, decreased microbial respiration [54,55] and biomass [56] and altered archaeal [57], bacterial [57,58,59], and fungal [60,61,62] community composition. Decreased abundance and diversity of N cycling assemblages under elevated N deposition in northern USA hardwood forests have been reported, affecting assimilation, denitrification, and nitrification potential rates [63,64]. Regarding the N deposition gradient in Alaska, USA, Lilleskov et al. (2002) [65] reported a dramatic decline in the ECM fungal species richness associated with Picea glauca with increasing N availability and selection against ECM species specialized for N uptake under N-limited conditions. Avrahami et al. (2002) [66] showed that ammonium fertilization induced a shift in the soil-denitrifying community. Conversely, no change in the ammonia-oxidizing community in an incubation study ultimately resulted in an increased N2O emission rate. The source or type of N fertilizer may also alter soil communities. For example, Enwall et al. (2005) [29] described that organic (cattle manure and sewage sludge) applications induced the greatest potential denitrification and respiration rates compared to inorganic (Ca(NO3)2 and (NH4)2SO4) amendments. These changes in N cycling process rates occurred concomitantly with changes in the total soil N content and soil pH after 56 years of treatment. Similarly, alterations of the microbial community composition stemming from elevated atmospheric N deposition likely result from declines in plant allocation of C-based exudates below ground [62]. Although many studies focus on how anthropogenic N enrichment may affect microbial populations, impacts on specific microbial communities responsible for soil N cycling processes are poorly understood [63,64], especially as influenced by different tree species.
In this study, we sampled soils beneath six native deciduous trees in the West Run Watershed located in Morgantown, West Virginia, USA, to assess tree species influence on the abundance of soil microbial N cycling functional genes in two forested sub-catchments. One sub-catchment is influenced by agricultural runoff and was compared to an adjacent reference sub-catchment that does not receive agriculture runoff (i.e., relatively high and low N inputs). We quantified the abundance of soil microbial functional genes related to denitrification (nosZ, nirK) in the soils sampled beneath the two ECM-associated trees and the four AM-associated trees. We also measured soil NH4+, NO3−, and potential N2O production to investigate relationships between gene abundance and N cycling products. The objective was to identify the influence of tree species and mycorrhizal association on the N cycling capacities of below-ground soil microbial communities under relatively high and low N levels. We hypothesized that:
- N enrichment would contribute to greater NH4+, NO3−, and N2O concentrations that correspond to greater abundances of corresponding microbial functional genes in the N cycle.
- Soil microbial N cycling gene abundance would differ significantly between tree species, specifically related to mycorrhizal association. We anticipated that the AM-dominant soils would likely contain greater abundances of nirK and NO3− relative to the ECM soils due to high quality, low C:N ratio as compared to the AM litter.
- Soil influenced by tree species associated with AM fungi would contain a higher nirK:nosZ ratio, indicative of greater potential for N2O production due to incomplete nitrous oxide reduction by nosZ relative to trees associated with ECM fungi, especially in areas of high N.
A greater understanding of soil microbial communities and their associated N cycling capacities beneath specific tree species can help inform current ecosystem modeling strategies and support riparian buffer zone BMPs to improve water and air quality in heavily disturbed and N-polluted ecosystems.
2. Materials and Methods
2.1. Study Area
The West Run Watershed (23 km2) in Monongalia County, West Virginia, United States, is a tributary of the upper Monongahela River and is characterized by mixed land use, including farming, urban development, and forest cover [67]. Our sampling area was located downstream of the West Virginia University Animal Husbandry Farm, in a wooded area of approximately 107 acres (known as the WVU Woodlot) west of the farm. The soil is classified as Clarksburg silt loam, fine-loamy, mixed, superactive, and mesic Oxyaquic Fragiudalfs, derived from siltstone, sandstone, and limestone on a 5% northeast-facing slope (USDA Web Soil Survey, accessed May 2020); Morgantown, West Virginia (elevation 315 m), with a mild temperate climate characterized by warm summers (warmest monthly mean > 22 °C) and cold winters (coldest monthly mean < 0 °C) and an average annual precipitation of 106.2 cm [67]. The West Virginia University Animal Husbandry Farm is in the upper reaches of one sub-catchment that supports grazing livestock. Vegetation in the catchment is predominantly cove hardwoods of various ages, including sugar maple (Acer saccharum), red maple (A. rubrum), and tulip poplar (Liriodendron tulipifera), and some isolated plantings of conifers including Douglas fir (Pseudotsuga menziesii), Norway spruce (Picea abies), and bald cypress (Taxodium distichum).
2.2. Soil Collection, Processing, and Analysis
To investigate how tree species influence N transformations, A-horizon (0–10 cm) soil samples were collected in August 2020 beneath four individuals of six dominant native deciduous tree species in proximity to two stream drainages that flow into West Run Creek (n = 4 replicates; n = 6 tree species; n = 2 sub-catchments; N = 48). One sub-catchment receives runoff from the University Farm, and the other sub-catchment drains from a relatively undisturbed forested area (these areas are denoted as high N and low N, respectively). Six native deciduous tree species were selected for this study, representing two ECM-associated and four AM-associated tree species. The ECM-associated species were Quercus rubra (Northern red oak; REOA) and Fagus grandifolia (American beech; AMBE) and the AM-associated species were Acer saccharum (sugar maple; SUMA), Liriodendron tulipifera (tulip poplar; TUPO), Platanus occidentalis (American sycamore; AMSY), and Prunus serotina (black cherry; BLCH).
Field-moist soils were sieved through a 2 mm mesh to remove rocks and large roots, and the subsamples were stored at either 4 °C or −20 °C. Soil pH was measured using a 0.01 M CaCl2 solution in a 1:2 slurry (5 g soil:10 mL CaCl2). The samples were shaken for 1 h and allowed to settle for 1 h prior to reading pH (Hanna Instruments). Gravimetric soil moisture content was quantified by drying field-moist soils for 24 h at 105 °C. Soil organic matter (SOM) was quantified via combustion in a muffle furnace at 500 °C for 12 h via loss-on-ignition. To determine soil NO3− and NH4+ concentrations, 10 g of soil were extracted with 40 mL of 2 M KCl, followed by colorimetric analysis in clear 96-well plates. The NO3− concentration was determined using a 2:1:1 solution of vanadium chloride (VCl3), 2% sulfanilamide, and 0.1% N-(1-naphthyl)-ethylenediamine dihydrochloride (NEDD). The NH4+ concentration was determined using 150 µL sodium salicylate and 150 µL sodium hydroxide bleach solution. The samples were incubated at room temperature (~20 °C) for 50 min for color development and analyzed in quadruplicate. Concentration (ppm) was determined via absorbance on a plate reader (Synergy HTX plate reader, Biotech, Winooski, Vermont) at 540 nm for NO3− and 650 nm for NH4+. Standard curves were generated using the known standards for each replicate plate under the same conditions. All the calculations were corrected for soil moisture content.
Potential soil N2O flux was measured using a dissolved N2O microsensor (Unisense, Germany) [68,69]. Into 40 mL glass vials, 10 g field-moist soils and 35 mL nutrient solution containing KNO3 and glucose (Kellogg Biological Station) [70,71,72] were added. Following the same protocol, a control for each sample was also analyzed, with 35 mL nutrient solution and no soil. The vials were incubated at 22 °C and the N2O (mg/mL) concentrations were recorded after 90 s of equilibration at 18, 24, and 30 h utilizing the Unisense Microsensor by placing the microsensor needle through the rubber septum of each vial. All the N2O concentrations were corrected for background values by subtracting control from the sample values, and all N2O concentrations were normalized to the weight of the soil sample dried at 105 °C.
2.3. Genetic Analysis of nosZ and nirK in Soil Samples
Total genomic DNA was extracted from 0.25 g field-moist soil samples using a DNeasy Powersoil Kit (Qiagen, Hilden, Germany) following the manufacturer’s protocol. The final DNA concentrations were measured with a Qubit fluorometer (Thermo Fisher Scientific, Waltham, MA, USA) using 197 µL buffer and 3 µL extraction using a dsDNA HS Assay kit and the standard protocols. An end-point polymerase chain reaction (PCR) was run on four microbial functional genes (Table 1 and Table 2) involved in N processing using an AmpliTaq Gold Master Mix (Thermo Fisher) for nosZ and nirK using reference strains Alcaligenes faecalis and Paracoccus denitrificans, respectively, as templates ([73,74]; NRRL, USDA). The PCR was performed in a 25 µL reaction volume using 12.5 µL master mix (2× concentration) (Thermo Fisher), 9.5 µL dH2O, 1 µL forward primer (10 µM), 1 µL reverse primer (10 µM), and reference strain template using the following conditions: Stage 1: 95 °C for 1 min; Stage 2: 95 °C for 1 min, 55 °C for 30 s, and 72 °C for 30 s for 35 cycles; and Stage 3: 72 °C for 7 min and 4 °C hold. We ran the PCR with amoA-1F and amoA-2R and reference strain Pseudomonas fluorecens to amplify amoA [75,76]. We also ran the PCR using A189 and A682 primers for amoA using Pseudomonas fluorecens as a template according to [77] and [78]. We also followed procedures outlined in [79] using GenAOAF/GenAOAR and amoA1F/GenAOB2R primer sets, Pseudomonas fluorescens as a template, and touchdown PCR (52–64 °C) with both AmpliTaq Gold and GoTaq Green Master Mixes. The standard PCR was performed for nirS using nirS4F/nirS5R and Cd3aF/nirSR3cd* primer sets using Pseudomonas stutzeri as a template and the AmpliTaq Gold Master Mix [60,80,81].
Gel electrophoresis was used to confirm DNA band size and reaction specificity for each PCR reaction. Bands corresponding to expected product sizes for nosZ and nirK were excised and purified using a Wizard Gel Purification kit (Promega, Madison, WI, USA). Subsequent cloning was performed using a TA Cloning kit pCR2.1. TOPO plasmids were transformed into E. coli-competent cells, subsequently spread on agar plates using Super Optimal broth (SOC) media, and incubated at 37 °C overnight. Plasmid DNA from individual colonies was extracted with a Zyppy Wash kit (Thermo Fisher), and the plasmid DNA concentration (ng/µL) was confirmed using a Qubit fluorometer as described above. All plasmid-transformed genes were sequenced by Sanger sequencing using M13 primers to confirm the identity of each insert (Genomics Core Lab at West Virginia University).
Standard curves for nirK and nosZ were determined using the cloned products via real-time quantitative PCR (qPCR) following the protocol outlined in [82]; a qPCR was run with a 10 µL final volume containing 2 µL PCR grade water, 0.5 µL each forward and reverse primers (total primer concentration = 500 nM), 5 µL of SYBR qPCR 2× master mix, and 1 µL template using the following conditions: Stage 1: 95 °C for 5 min, 1×; Stage 2: 95 °C for 20 s and 60 °C for 45 s, 35×; and Stage 3: 95 °C for 15 s for 1×. The qPCR samples were run in triplicate. Using the same conditions, a qPCR was then run for each soil sample DNA extraction, and using the respective standard curve equations, the gene copy number was calculated [82]. All the calculations were corrected for soil moisture content so that gene copy numbers were standardized to g of dry soil.
2.4. Data Analysis
Differences in soil pH, SOM, percent moisture content, NO3− concentration, NH4+ concentration, N2O production, and nirK and nosZ gene copy numbers attributed to tree species or N level were analyzed using nonparametric tests due to a lack of normal distribution of all the variables. When comparing two distinct groups (N level), the Wilcoxon two-sample test was applied using a normal approximation. When more than two groups were compared (tree species comparison), a pairwise Wilcoxon two-sample test was applied, followed by the Kruskal–Wallis test to compare the effect of tree species within a sub-catchment. For ease of interpretation, data are presented as calculated means and standard errors. Separate analyses were run for each sub-catchment. Statistical analyses were performed using RStudio version 1.4 at the α = 0.05 significance level. In addition to the nonparametric statistical analysis we performed, we used SAS-JMP v. 11.0 (SAS Institute, Cary, NC, USA) to develop a predictive model using backward stepwise regression to determine important variables for predicting measured NO3−, NH4+, and N2O concentrations compared to environmental variables including soil pH, moisture, SOM, nirK gene abundance, nosZ gene abundance, mycorrhizal associations, tree species, and location (relatively high or low N). The statistical model determines which soil variables best predict the NO3−, NH4+, and N2O concentrations. The conditions selected for stepwise regression included the minimum BIC stopping rule with whole effects for inclusion of categorical data, and the parameters were included at α = 0.10. Mean response values by tree species were separated using Tukey’s HSD at α = 0.05.
This study design is an example of pseudo-replication in that the sampling areas of high and low N deposition are not replicated at the catchment scale. These data should be interpreted with that in mind, and therefore, the results may not be extrapolated to other locations [83].
3. Results
3.1. Nitrate and Ammonium
The NO3− concentration was significantly higher (p < 0.001) in the high-N catchment compared to the low-N catchment (43.01 and 15.67 mg N/kg soil, respectively; p < 0.001; Table 1). Within the high-N catchment, tree species influenced the NO3− concentration in soils, as soil NO3− beneath American beech (49.59 mg N/kg soil) was significantly lower than that beneath sugar maple (61.35 mg N/kg soil) and significantly higher than that beneath American sycamore (23.41 mg N/kg soil) (p = 0.029; Figure 2) and the NO3− concentration for American sycamore and black cherry (16.10 mg N/kg soil) was significantly lower than for northern red oak (63.72 mg N/kg soil) and sugar maple (61.35 mg N/kg soil) (p = 0.029; Figure 2). In the low-N catchment, the NO3− concentration was not significantly different between tree species (p = 0.140; Figure 2), nor did the NO3− concentration vary significantly between the ECM and AM fungal associations (0.444; Figure 3). In the high-N catchment, the NO3− concentration was significantly higher in the soils beneath the ECM-associated species relative to the AM species (56.65 and 36.19 mg N/kg soil, respectively; p = 0.023; Figure 3).
The NH4+ concentration was also significantly greater in the soil from the high-N sub-catchment relative to the low-N catchment (6.49 and 4.03 mg N/kg soil, respectively; p = 0.009; Table 1). Tree species influenced soil NH4+ in both catchments. In the high-N catchment, the NH4+ concentration was significantly higher for northern red oak (10.56 mg N/kg soil) compared to black cherry (4.22 mg N/kg soil) and sugar maple (3.37 mg N/kg soil) (p = 0.029; Figure 2). In the low-N catchment, NH4+ was significantly lower in the soil beneath American sycamore (1.18 mg N/kg soil) compared to that beneath northern red oak (5.79 mg N/kg soil), American beech (6.21 mg N/kg soil), and black cherry (4.68 mg N/kg soil) and significantly lower for sugar maple (2.22 mg N/kg soil) compared to black cherry (4.68 mg N/kg soil) (p = 0.029; Figure 2). NH4+ was significantly higher in ECM compared to AM (6.00 and 3.04 mg N/kg soil, respectively) in the low-N catchment (p = 0.01; Figure 3), though NH4+ was not significantly different between the ECM- and AM-associated species in the high-N catchment (p = 0.076).
3.2. Soil pH, Soil Organic Matter, and Soil Moisture
Soil pH was not significantly different (CI = 0.05) between the high- and low-N catchments (p = 0.613; Table 1). Tree species influenced soil pH within the high-N catchment and was lowest in the soil beneath black cherry (3.89) and highest for sugar maple (4.86) (p = 0.029; data not shown). Soil pH was not significantly different between tree species in the low-N catchment or between the ECM and AM fungal associations in either the high- or low-N catchment (p = 0.50 and p = 0.759, respectively).
The SOM content was similar between the high and low catchments (p = 0.069; Table 1). Within the high-N catchment, SOM was significantly higher in the soil beneath red oak relative to black cherry (18.66% and 9.89%, respectively; p = 0.029; data not shown). The SOM content did not differ between tree species in the low-N catchment (p > 0.05). SOM was not significantly different between the ECM and AM fungal associations in either the high- or low-N catchment (p = 0.12 and p = 0.928, respectively).
The soil moisture content was also similar between the high and low catchments (p = 0.05; Table 1). Within the low-N catchment, soil moisture was significantly higher in the soil beneath black cherry compared to sugar maple (0.35 and 0.23 g/g soil, respectively; p = 0.029). Soil moisture did not differ between tree species in the high-N catchment or between the ECM and AM fungal associations in either the high- or low-N catchment (p = 0.417 for both catchments).
3.3. Potential N2O Production
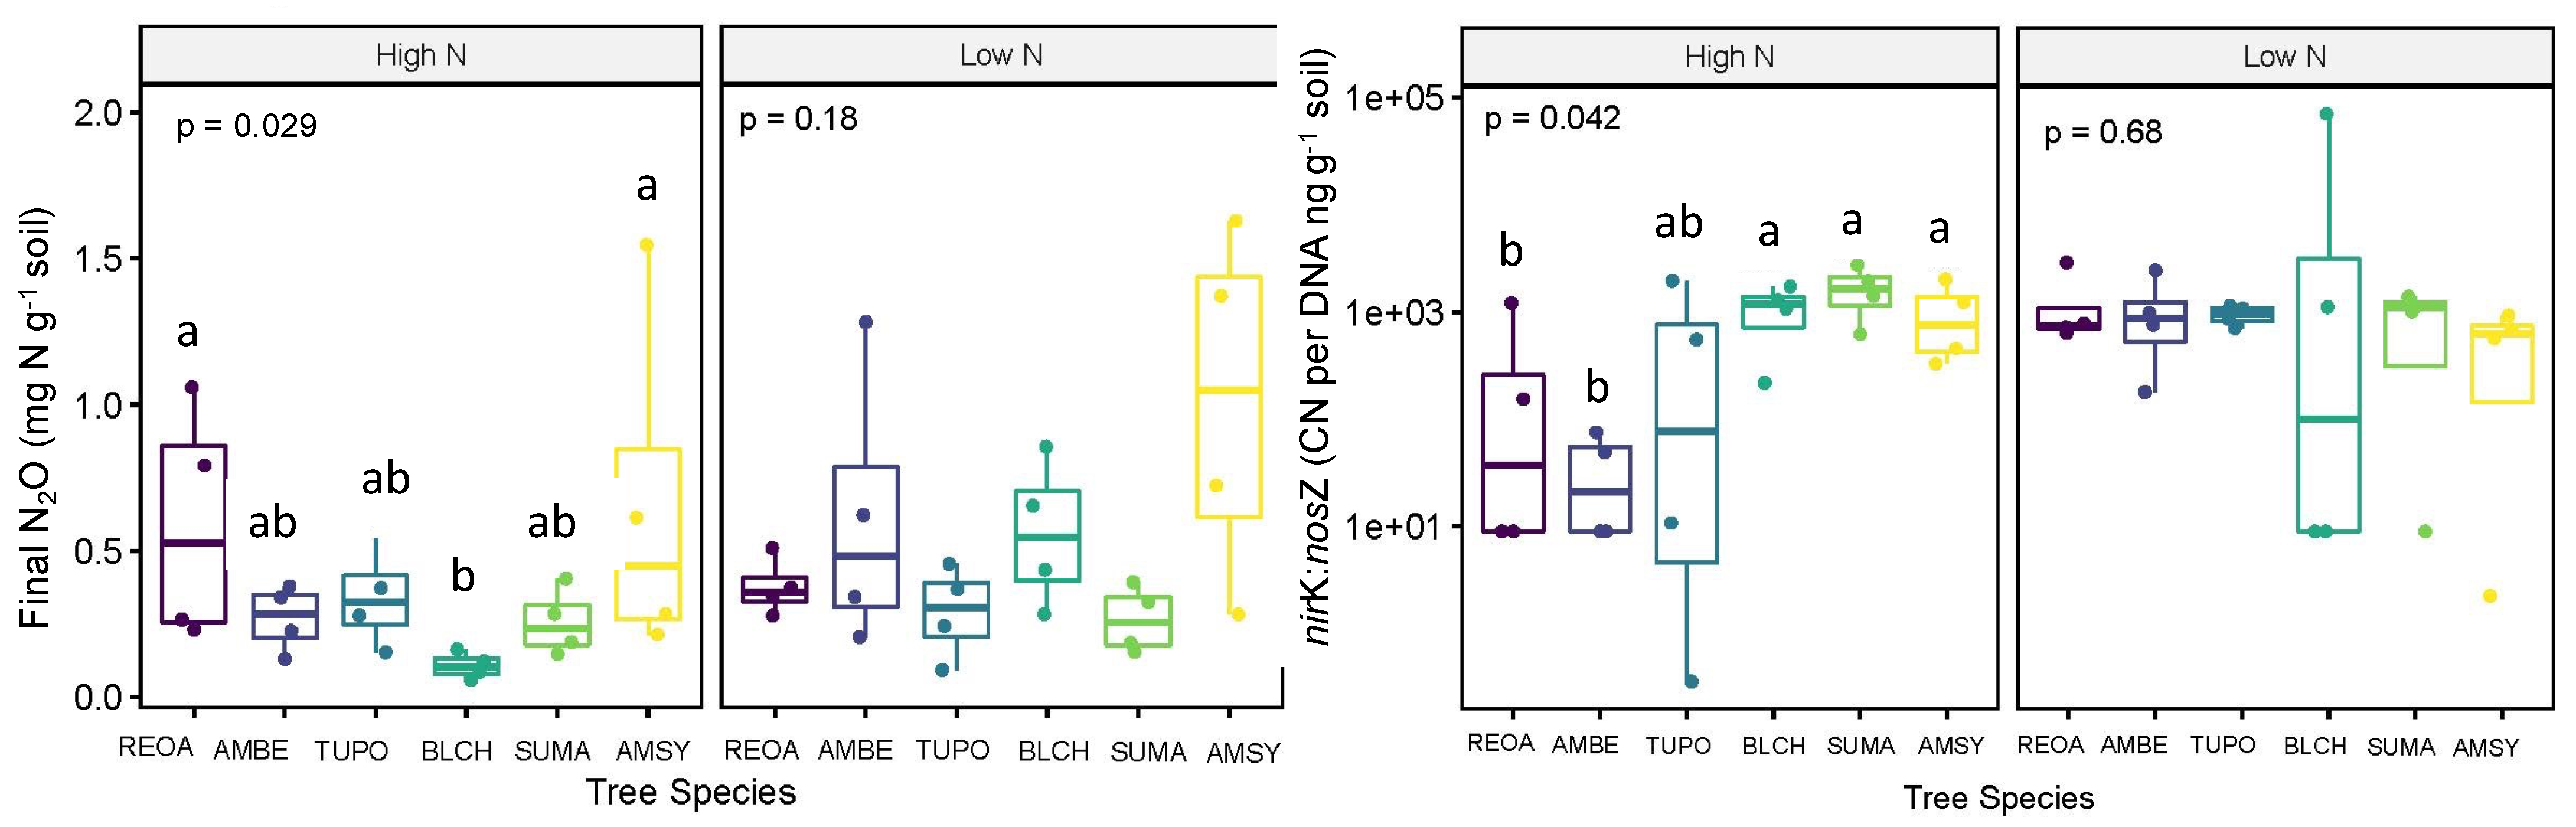
The potential N2O production after 30 h of incubation was similar between high- and low-N catchments (p = 0.053; Table 1). N2O production was significantly lower in the soil beneath black cherry (0.11 mg N/kg soil) compared to American sycamore (0.66 mg N/kg soil) and northern red oak (0.59 mg N/kg soil) (p = 0.029; Figure 4) in the high-N catchment. Potential N2O did not vary between tree species in the low-N catchment (Figure 4) or between the ECM and AM fungal associations in either the high- or low-N catchment (p = 0.350 and p = 0.976, respectively).
3.4. Target N Cycling Genes
Abundance of the nosZ gene (copy number) was similar between the high- and low-N catchments (p = 0.112; Table 1). In the high-N catchment, nosZ abundance did vary by tree species (p = 0.029), where nosZ was significantly higher in soil beneath American sycamore (4.96E+09 CN per ng DNA/g soil) compared to black cherry (1.29E+09 CN per ng DNA/g soil) (p = 0.029). Abundance of the nosZ gene did not vary between tree species in the low-N catchment or between the ECM and AM fungal associations in the high- or low-N catchments (p = 0.192; p = 0.350, respectively).
Abundance of the nirK gene was also similar between the high- and low-N catchments (p = 0.103; Table 1). In the high-N catchment, nirK abundance did vary by species (p = 0.029), where nirK was significantly lower in the soil beneath American beech (7.93E+10 CN per ng DNA/g soil) compared to American sycamore (6.27E+12 CN per ng DNA/g soil) and sugar maple (9.10E+12 CN per ng DNA/g soil) in the high-N catchment (p = 0.029). Abundance of nirK was not significantly different between tree species in the low-N catchment. Abundance of the nirK gene was significantly higher in the soil beneath the AM-associated trees compared to the ECM ones (4.97E+12 and 1.02E+12 CN per ng DNA/g soil, respectively) in the high catchment (p = 0.011). However, nirK abundance did not vary by the fungal association in the low-N catchment (p = 0.610).
The ratio of nirK:nosZ was not significantly different between the high- and low-N catchments (p = 0.496; Table 1). Within the high-N catchment, nirK:nosZ varied by tree species, where it was higher in the soil beneath American sycamore (1008.52 CN per ng DNA/g soil), sugar maple (1677.09 CN per ng DNA/g soil), and black cherry (1078.05 CN per ng DNA/g soil) compared to American beech (35.48 CN per ng DNA/g soil) (p = 0.029; Figure 3). The nirK:nosZ ratio did not differ between tree species in the low-N catchment (Figure 3). The nirK:nosZ ratio was significantly higher in the soil beneath the AM-associated trees (1098.06 CN per ng DNA/g soil) compared to the ECM ones (190.81 CN per ng DNA/g soil) in the high-N catchment, though the ratio did not vary by fungal association in the low-N catchment (p = 0.005 and p = 0.783, respectively; Figure 3).
Despite repeated attempts using different primer sets, PCR conditions, and polymerase formulations, we were unable to amplify usable targets within the nirS or amoA genes. As a result, quantification of the nirS and amoA gene abundances using qPCR was not achieved.
3.5. Relationships between Gene Abundance and Soil Parameters
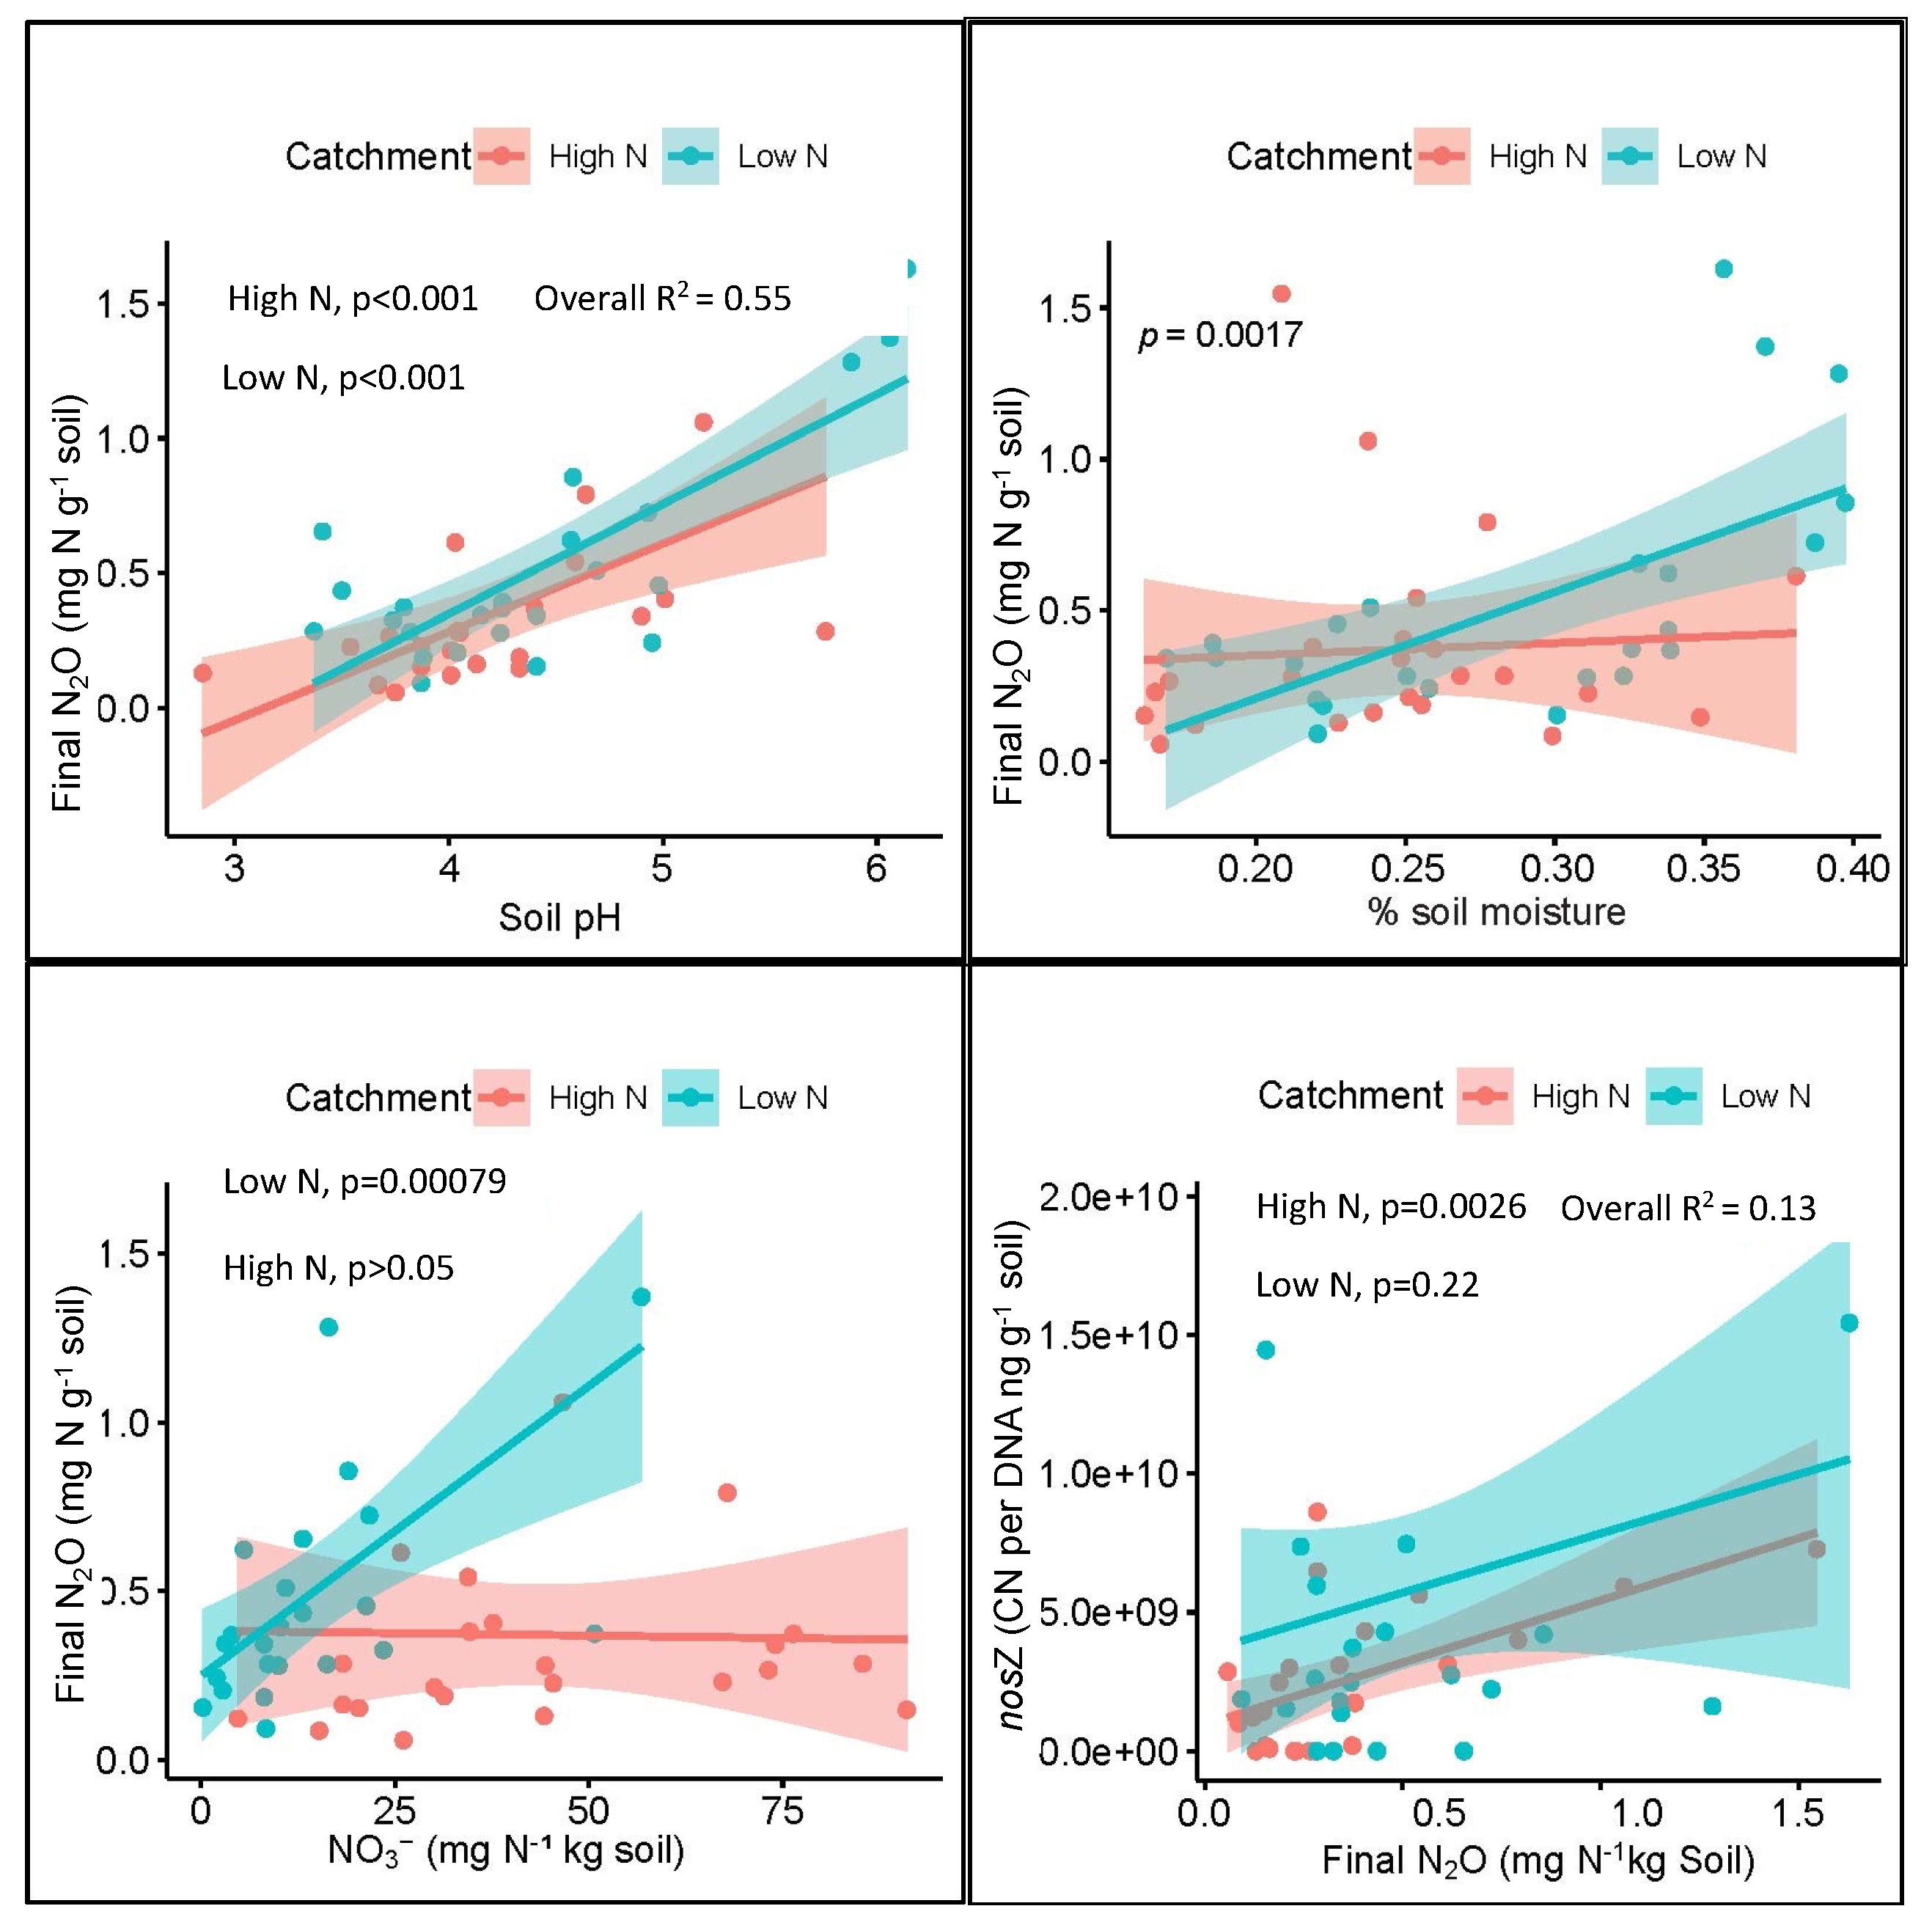
Soil pH was positively correlated to the nosZ and nirK copy number (p < 0.001 and p = 0.001, respectively; Figure 5) across all the samples. Within the catchments, the nosZ copy number and soil pH were positively correlated in both the high- and low-N catchments (p = 0.042 and p < 0.001, respectively). Soil pH and nirK gene abundance were also positively correlated in the high-N catchment (p < 0.001), but this relationship did not occur in soil from the low-N catchment (p = 0.250).
There was a negative relationship between the NH4+ concentration and the nosZ copy number across all the samples (p = 0.001). The low-N catchment showed a greater nosZ copy number with lower levels of the NH4+ concentration compared to those in the high-N catchment (p < 0.001; p = 0.230). A significant positive correlation was noted between nosZ abundance and potential N2O production across all the samples (p = 0.011). The high-N catchment displayed a significant positive relationship with the nosZ copy number and N2O (p = 0.003; Figure 5). The nosZ copy number and N2O did not display a significant relationship in the low-N catchment (p = 0.220; Figure 5). No significant relationship was found in nosZ and NO3− in the high- or low-N catchments.
The soil NH4+ concentration was negatively correlated to nirK abundance across all the samples (p = 0.003), largely driven by a strong, significant negative relationship in the low-N catchment (p = 0.003). Abundance of nirK was not related to increased potential N2O production among all the samples (p = 0.089), though within the catchments, a significant positive relationship between nirK and N2O was noted in the high-N catchment (p = 0.045). The soil NO3− concentration was unrelated to nirK gene abundance across all samples.
The nirK:nosZ ratio was not related to NO3−, NH4+, or N2O in either the high- or low-N catchment. Within the high-N catchment, nirK:nosZ did exhibit a significant positive relationship with soil pH (p = 0.002) and a significant negative relationship with the soil NH4+ content (p = 0.033). These relationships were not present in the low-N catchment.
Within the low-N catchment, soil moisture and potential N2O exhibited a strong significant positive relationship (p < 0.001; Figure 5), although this relationship was not present in the high-N catchment.
Soil pH was positively correlated to potential N2O production and had a significant positive relationship across all the samples (p < 0.001; Figure 5) and from samples within both the low- and high-N catchments (p < 0.001 for both catchments). Soil pH was negatively correlated to the soil NH4+ content across all the samples (p = 0.004), and in the low-N catchment, a significant negative relationship between the NH4+ concentration and pH occurred (p = 0.022), and a significant positive relationship between soil pH and NO3− was noted in the low-N catchment samples (p = 0.033). Potential N2O production and the soil NO3− content were not related across all the samples, but a significant positive relationship was noted in the low-N catchment (p < 0.001; Figure 5). No relationship occurred between potential N2O and the soil NH4+ content among or within the high- and low-N catchments (p = 0.1).
From the stepwise regression analysis including all the predictive variables, we found that the strongest predictor of soil NO3− in our data was location (high N/low N), followed by soil moisture (p < 0.001 and = 0.009, respectively; Table 2). Tree species was also an important factor for soil NO3− (p = 0.033); overall, the greatest soil NO3− concentration was noted in the soil beneath oak, and the lowest NO3− was found beneath cherry (Table 3). The strongest predictor of soil NH4+ was the SOM content, followed by soil pH (Table 2; p = 0.015 and 0.021, respectively). Abundance of the nosZ gene and tree species were also important in predicting soil NH4+. The greatest soil NH4+ was, again, found in the soil beneath oak, the lowest—beneath cherry (Table 3). The strongest predictor of potential N2O production was soil pH (increasing pH resulted in a greater N2O), followed by the SOM content (Table 2; p < 0.001 and = 0.016, respectively). Additional significant predictors of N2O were location (p = 0.036) and tree species (p = 0.015). The greatest potential N2O production occurred in the soils beneath sycamore and the least N2O was produced in the soil beneath sugar maple (Table 3).
4. Discussion
N fertilization and deposition contribute to pollution of ecosystems, pose threats to water and air quality [84,85], contribute to global climate change [10], and are of special consideration in ecosystem management and stream remediation efforts [86]. Our objective was to investigate relationships between the abundance of microbial functional genes critical to key N transformations and soil N process rates in soils beneath six tree species in stream catchments containing relatively high and low N inputs. Given the differences in N inputs between our high- and low-N sampling locations, differences in N cycling were expected. Soil NO3− and NH4+ content were greater in the high-N catchment (Table 1), likely resulting from additional N influx from fertilizer and manure runoff from agricultural operations in the upper reaches of the sub-catchment. This is consistent with previous studies in the West Run Watershed. Martin et al. (2021) [87] found a positive association with stream NO3− concentrations in the West Run Watershed areas impacted by agriculture [67,87].
Although we found no significant differences in soil pH, soil organic matter content, soil moisture, cumulative N2O concentration, nosZ and nirK gene abundance, or nirK:nosZ gene abundance between the two sub-catchments, there were considerable differences within the high- and low-N catchments between tree species and mycorrhizal association. Furthermore, these differences were not consistent between the catchments. We predicted that the soil microbial functional gene abundance would be significantly different between tree species, specifically related to mycorrhizal association, in that the soil beneath the AM-associated tree species (L. tulipifera, P. serotina, A. saccharum, P. occidentalis) would contain a greater abundance of nirK compared to nosZ relative to the ECM-associated tree species (Q. rubra and F. grandifolia). The NO3− concentration was significantly higher beneath the ECM-associated tree species in the high-N catchment (Figure 3) and NH4+ was significantly higher beneath the ECM species in the low-N catchment (Figure 3). We expected that the NO3− and NH4+ concentrations would be higher beneath the AM-associated tree species in the high-N catchment due to fast decomposition of high-quality litter pools and rapid N mineralization from organic to inorganic N forms [39].
Our findings may reflect slower inorganic N processing by ECM-associated tree species with N enrichment that results in higher retention of inorganic N relative to AM-associated tree species. ECM-associated tree species likely process inorganic N in the low-N catchment so that it does not accumulate in the soil as it would with N enrichment [39]. Elevated NH4+ in the soil beneath ECM-associated tree species in the low-N catchment (Figure 3) may be attributable to the same mechanism, in that ECM-associated tree species typically promote soil with less NO3− leaching and low inorganic N availability [39]. This is partially supported here by the significantly higher NH4+ concentration in the low N catchment beneath American beech, an ECM-associated species, compared to black cherry, sugar maple, and American sycamore (Figure 2). Similarly, in the high-N catchment, the NH4+ concentration was significantly higher in the soil beneath ECM-associated northern red oak compared to black cherry and sugar maple (Figure 2). A metagenomic study which compared the abundance of genes associated with the key N pathways as influenced by three tree species indicated that the soil microbiome below ECM-associated American chestnut contained the lowest abundances of the amoA functional gene, which encodes enzymes involved in nitrification, and of the functional genes nirK, norB, and nosZ, which encode enzymes involved in the denitrification pathway. In the dissimilatory nitrate reduction to ammonium pathway, chestnut soils contained the lowest gene abundance of nitrate reductase genes narJ and napA as well as nitrite reductase genes nrfA and nrfH [88]. The measured process rates from incubated soil and litter reflected the low functional gene abundances in the chestnut soils, as N mineralization was lowest in the chestnut soil (7.84 mg N/kg) relative to that of AM-associated cherry (11.51) and ECM-associated oak soils (12.02). Indeed, functional gene abundances were significantly correlated to N mineralization rates and inorganic N availability in that study.
In the high-N catchment, the measured parameters of soil pH, OM, NO3−, NH4+, potential N2O production, nosZ, and nirK gene abundance, nirK:nosZ, exhibited significant differences as a function of tree species. Perhaps most notably, the soil beneath black cherry had the lowest pH, NO3− concentration, potential N2O production, and OM in the high-N catchment (Figure 2 and Figure 3). This effect was not observed in the low-N catchment. Black cherry is an AM-associated tree species and is considered an N-demanding species [89]. It has been associated with greater soil N mineralization rates, resulting in greater available NO3− and NO3− losses relative to ECM-associated tree species [90,91].
Abundance of the nirK gene in the high-N catchment was significantly higher in the soil beneath sugar maple compared to those beneath American beech and American sycamore. This may be related to faster N mineralization and nitrification relative to neighboring tree species [40]. Likewise, the high nirK:nosZ ratio for black cherry, sugar maple, and American sycamore compared to American beech in this catchment may be attributed to the influence of the mycorrhizal fungal association. This is consistent with the hypothesis that AM soils would likely contain greater abundances of nirK and nirK:nosZ and thus elevated levels of NH4+ and NO3− relative to ECM soils due to a greater access to NH4+ pools in the high-N catchment [49]. In the low-N catchment, nirK, nosZ, and nirK:nosZ did not differ between tree species, perhaps due to the similar pH across the catchment [92].
4.1. Relationships of Environmental Variables to Gene Abundance
We hypothesized that N enrichment would correspond to greater concentrations of NH4+, NO3−, and N2O and greater abundances of microbial N cycling functional genes nosZ and nirK. We also assumed that N enrichment would contribute to lower soil pH by oxidizing NH4+ compounds [93]. Although soil pH was not distinct between the high- and low-N catchments (Table 1), N enrichment likely contributed to species-specific changes in soil pH that appear to influence other variables in each catchment. Significantly positive correlations with soil pH were displayed by nirK, nosZ, nirK:nosZ copy number, and potential N2O production (e.g., Figure 5). On the other hand, NH4+ displayed a significant negative correlation with soil pH, likely due to ammonification causing soil acidification and potentially contributing to altered functionality of nirK and nosZ [94,95]. Several studies have found altered transcription processes encoding nirK and nosZ due to low pH in pure culture and soil [21,92,96]. Liu et al. (2014) [21] documented N2O reductase inhibition (nosZ) at pH < 6.1. This reduction in functionality of nirK and nosZ may contribute to differences in N cycle rates. Reduced nirK functionality results in lower nitrate reductase, and the reduction of nosZ functionality has been linked to incomplete reduction of N2O to N2 gas, especially in high N conditions with lowered pH [92]. Soil pH and N2O also displayed a significant positive relationship in our results, possibly due to greater functionality of nirK in higher-pH soils (Figure 5).
Inconsistent with our hypothesis, N2O production increased with increasing nosZ abundance (Figure 5), especially in high-N areas. We predicted that increasing nirK and nirK:nosZ would contribute to greater N2O production due to the incomplete reduction of N2O to N2 by nosZ, especially beneath AM-associated tree species due to high N conditions and a greater access to NH4+ pools. N2O and nirK did exhibit a positive relationship, supporting our hypothesis. The positive relationship between N2O and nosZ may be related to the influence of soil pH and soil moisture in the denitrification process outweighing any alterations in functionality of nitrous oxide reduction by nosZ [16,52,92].
Lower cumulative N2O production is further related to the soil moisture content, as evidenced by the significant positive relationship between relative soil moisture and the final N2O concentration (Figure 5). This is supported by the hole-in-pipe mechanism of production where wetter soil contributes to more N2O [16,52]. In this study, potential N2O production was not related to either NO3− or NH4+ in either high- or low-N catchment, although N2O and NO3− showed a slight positive relationship in the low-N catchment. This relationship between potential N2O production and soil NO3− may be a result of NO3− being further reduced to N2O by abundant nirK. The nirK:nosZ ratio was unrelated to N2O production among the samples or within the catchments.
4.2. Limitations and Future Directions
A potential limitation of this study is the sample size. We collected and processed 48 soil samples in total, 24 from the high-N catchment and 24 from the low-N catchment. Within the catchments, we sampled beneath four individuals from each of the six tree species. Given the number of considerable outliers and large variance in some of the measured parameters, a larger sample size would have provided a higher analytical power to discern more subtle effects. Additionally, understory vegetation may have contributed to the variance in our data; other studies have shown that understory plants influence forest N cycling [89,97]. It is difficult to separate the influence of understory vegetation, soil conditions, and tree species because they are closely associated in a field setting.
Additionally, had our attempts in nirS and amoA quantification been successful, we may have identified stronger links with the NO3− and NH4+ concentrations and implications of nitrification and denitrification rates [15,76,98]. A more comprehensive soil metagenomic analysis may lead to a more comprehensive understanding of the N-related genes in our study [99].
4.3. Limitations of Quantifying Gene Abundance
Quantitative PCR measures the presence of a gene, but it does not measure the function or turnover. Thus, the copy numbers of nosZ and nirK measured here may include genes that are not currently active [100]. With gene abundance measures, we may be underestimating or overestimating their influence on NO3− and N2O production. This may explain the lack of congruence between gene abundance values and the NH4+, NO3−, or N2O concentration [100]. In future studies, it may be useful to consider measures of gene expression, protein levels (or turnover), enzymatic processes, or additional N functional genes and related pathways.
5. Conclusions
We determined that tree species influence NO3− and N2O production in riparian soils, particularly under high N enrichment. Soil acidification, likely from elevated NH4+, is related to decreasing nirK and nosZ gene abundance and potentially to reduced functionality of these genes. However, a weak relationship occurred between gene abundance and N process rates. The mycorrhizal association was not a consistent predictor of NO3− or N2O production, with AM-associated black cherry driving lower than expected AM-associated NO3− and N2O. ECM-associated tree species appear to be retaining more soil inorganic N, as reflected by greater abundances of NH4+ beneath American beech and northern red oak trees, and these species should be of consideration when implementing BMPs to improve N retention in riparian buffer zones. The strongest predictors of soil NO3− and N2O across study sites were N enrichment and pH, respectively. Quantitative PCR is useful for quantifying the presence of genes but not necessarily the extent of their function and, when combined with other types of genetic analysis, may be useful in predicting N cycling that may be considered when implementing N pollution remediation in riparian buffer zones and forested ecosystems.
Author Contributions
Conceptualization, C.N.K. and T.P.D.; methodology, C.N.K., T.P.D. and J.A.H.; software, E.A.M. and E.G.F.-F.; validation, C.N.K. and T.P.D.; formal analysis, E.A.M. and E.G.F.-F.; investigation, E.A.M. and E.G.F.-F.; resources, C.N.K. and T.P.D.; data curation, E.A.M. and E.G.F.-F.; writing—original draft preparation, E.A.M. and C.N.K.; writing—review and editing, C.N.K., T.P.D. and J.A.H.; visualization, E.A.M.; supervision, C.N.K. and T.P.D.; project administration, J.A.H.; funding acquisition, C.N.K. All authors have read and agreed to the published version of the manuscript.
Funding
This research was funded by West Virginia University, USDA NIFA McIntire-Stennis Project #WVA00821, and the Brown Faculty Enhancement Award 2020 for the Davis College of Agriculture, Natural Resources, and Design.
Data Availability Statement
Publicly available datasets were analyzed in this study. These data can be found at URL https://docs.google.com/spreadsheets/d/1fmCHvLULy4G4f7aFYjAFWg_0fblsdA7Y/edit?usp=sharing&ouid=114202210634754963074&rtpof=true&sd=true (accessed 15 October 2023).
Acknowledgments
Authors acknowledge Jonathan R. Cumming for the review of an earlier version of this manuscript.
Conflicts of Interest
The authors declare no conflict of interest. The funders had no role in the design of the study; in the collection, analyses, or interpretation of data; in the writing of the manuscript; or in the decision to publish the results.
References
- Groffman, P.M.; Gold, A.J.; Addy, K. Nitrous oxide production in riparian zones and its importance to national emission inventories. Chemosphere-Glob. Chang. Sci. 2000, 2, 291–299. [Google Scholar] [CrossRef]
- Wiseman, J.D.; Burchell, M.R.; Grabow, G.L.; Osmond, D.L.; Messer, T.L. Groundwater nitrate concentration reductions in a riparian buffer enrolled in the NC Conservation Reserve Enhancement Program. JAWRA J. Am. Water Resour. Assoc. 2014, 50, 653–664. [Google Scholar] [CrossRef]
- Shepard, J.P. Water quality protection in bioenergy production: The US system of forestry best management practices. Biomass Bioenergy 2006, 30, 378–384. [Google Scholar] [CrossRef]
- Stutter, M.I.; Chardon, W.J.; Kronvang, B. Riparian buffer strips as a multifunctional management tool in agricultural landscapes: Introduction. J. Environ. Qual. 2012, 41, 297–303. [Google Scholar] [CrossRef] [PubMed]
- Cirmo, C.P.; McDonnell, J.J. Linking the hydrologic and biogeochemical controls of nitrogen transport in near-stream zones of temperate-forested catchments: A review. J. Hydrol. 1997, 199, 88–120. [Google Scholar] [CrossRef]
- Sabater, S.; Butturini, A.; Clement, J.-C.; Burt, T.; Dowrick, D.; Hefting, M.; Matre, V.; Pinay, G.; Postolache, C.; Rzepecki, M.; et al. Nitrogen removal by riparian buffers along a European climatic gradient: Patterns and factors of variation. Ecosystems 2003, 6, 0020–0030. [Google Scholar] [CrossRef]
- Hefting, M.M.; Clement, J.-C.; Bienkowski, P.; Dowrick, D.; Guenat, C.; Butturini, A.; Topa, S.; Pinay, G.; Verhoeven, J.T. The role of vegetation and litter in the nitrogen dynamics of riparian buffer zones in Europe. Ecol. Eng. 2005, 24, 465–482. [Google Scholar] [CrossRef]
- Fenn, M.E. Nitrogen excess in North American ecosystems: Predisposing factors, ecosystem responses, and management strategies. Ecol. Appl. 1998, 8, 706–733. [Google Scholar] [CrossRef]
- US Environmental Protection Agency. A Compilation of Cost Data Associated with the Impacts and Control of Nutrient Pollution; EPA 820-F-15-096; Office of Water: Washington, DC, USA, 2015.
- Wuebbles, D.J. Nitrous oxide: No laughing matter. Science 2009, 326, 56–57. [Google Scholar] [CrossRef]
- Ravishankara, A.R.; Daniel, J.S.; Portmann, R.W. Nitrous oxide (N2O): The dominant ozone-depleting substance emitted in the 21st century. Science 2009, 326, 123–125. [Google Scholar] [CrossRef]
- Giles, M.E.; Morley, N.J.; Baggs, E.M.; Daniell, T.J. Soil nitrate reducing processes–drivers, mechanisms for spatial variation, and significance for nitrous oxide production. Front. Microbiol. 2012, 3, 407. [Google Scholar] [CrossRef] [PubMed]
- Bates, B.; Kundzewicz, Z.W.; Wu, S.; Palutikof, J. Climate Change and Water: Technical Paper VI; Intergovernmental Panel on Climate Change (IPCC): Geneva, Switzerland, 2008.
- Richardson, D.; Felgate, H.; Watmough, N.; Thomson, A.; Baggs, E. Mitigating release of the potent greenhouse gas N 2 O from the nitrogen cycle–could enzymic regulation hold the key? Trends Biotechnol. 2009, 27, 388–397. [Google Scholar] [CrossRef] [PubMed]
- Zumft, W.G. Cell biology and molecular basis of denitrification. Microbiol. Mol. Biol. Rev. 1997, 61, 533–616. [Google Scholar] [PubMed]
- Firestone, M.K.; Davidson, E.A. Microbiological basis of NO and N2O production and consumption in soil. Exch. Trace Gases Between Terr. Ecosyst. Atmos. 1989, 47, 7–21. [Google Scholar]
- Rochette, P. No-till only increases N2O emissions in poorly-aerated soils. Soil Tillage Res. 2008, 101, 97–100. [Google Scholar] [CrossRef]
- Deslippe, J.R.; Jamali, H.; Jha, N.; Saggar, S. Denitrifier community size, structure and activity along a gradient of pasture to riparian soils. Soil Biol. Biochem. 2014, 71, 48–60. [Google Scholar] [CrossRef]
- Weier, K.L.; Doran, J.W.; Power, J.F.; Walters, D.T. Denitrification and the dinitrogen/nitrous oxide ratio as affected by soil water, available carbon, and nitrate. Soil Sci. Soc. Am. J. 1993, 57, 66–72. [Google Scholar] [CrossRef]
- Liu, B.; Mørkved, P.T.; Frostegård, Å.; Bakken, L.R. Denitrification gene pools, transcription and kinetics of NO, N2O and N2 production as affected by soil pH. FEMS Microbiol. Ecol. 2010, 72, 407–417. [Google Scholar] [CrossRef]
- Liu, B.; Frostegard, A.; Bakken, L. Impaired reduction of N2O to N2 in acid soils is due to a posttranscriptional interference with the expression of nosZ. mBio 2014, 5, e01383-14. [Google Scholar] [CrossRef]
- Philippot, L.; Andert, J.; Jones, C.M.; Bru, D.; Hallin, S. Importance of denitrifiers lacking the genes encoding the nitrous oxide reductase for N2O emissions from soil. Glob. Chang. Biol. 2011, 17, 1497–1504. [Google Scholar] [CrossRef]
- Jones, C.M.; Graf, D.R.; Bru, D.; Philippot, L.; Hallin, S. The unaccounted yet abundant nitrous oxide-reducing microbial community: A potential nitrous oxide sink. ISME J. 2013, 7, 417. [Google Scholar] [CrossRef] [PubMed]
- Tu, Q.; He, Z.; Wu, L.; Xue, K.; Xie, G.; Chain, P.; Reich, P.B.; Hobbie, S.E.; Zhou, J. Metagenomic reconstruction of nitrogen cycling pathways in a CO2-enriched grassland ecosystem. Soil Biol. Biochem. 2017, 106, 99–108. [Google Scholar] [CrossRef]
- Patra, A.K.; Abbadie, L.; Clays-Josserand, A.; Degrange, V.; Grayston, S.J.; Loiseau, P.; Louault, F.; Mahmood, S.; Nazaret, S.; Philippot, L.; et al. Effects of grazing on microbial functional groups involved in soil N dynamics. Ecol. Monogr. 2005, 75, 65–80. [Google Scholar] [CrossRef]
- Throbäck, I.N.; Johansson, M.; Rosenquist, M.; Pell, M.; Hansson, M.; Hallin, S. Silver (Ag+) reduces denitrification and induces enrichment of novel nirK genotypes in soil. FEMS Microbiol. Lett. 2007, 270, 189–194. [Google Scholar] [CrossRef] [PubMed]
- Hallin, S.; Jones, C.M.; Schloter, M.; Philippot, L. Relationship between N-cycling communities and ecosystem functioning in a 50-year-old fertilization experiment. ISME J. 2009, 3, 597. [Google Scholar] [CrossRef] [PubMed]
- Petersen, D.G.; Blazewicz, S.J.; Firestone, M.; Herman, D.J.; Turetsky, M.; Waldrop, M. Abundance of microbial genes associated with nitrogen cycling as indices of biogeochemical process rates across a vegetation gradient in Alaska. Environ. Microbiol. 2012, 14, 993–1008. [Google Scholar] [CrossRef] [PubMed]
- Enwall, K.; Philippot, L.; Hallin, S. Activity and composition of the denitrifying bacterial community respond differently to long-term fertilization. Appl. Environ. Microbiol. 2005, 71, 8335–8343. [Google Scholar] [CrossRef]
- Philippot, L.; Raaijmakers, J.M.; Lemanceau, P.; Van Der Putten, W.H. Going back to the roots: The microbial ecology of the rhizosphere. Nat. Rev. Microbiol. 2013, 11, 789. [Google Scholar] [CrossRef]
- Jha, N.; Saggar, S.; Giltrap, D.; Tillman, R.; Deslippe, J. Soil properties impacting denitrifier community size, structure, and activity in New Zealand dairy-grazed pasture. Biogeosciences 2017, 14, 4243–4253. [Google Scholar] [CrossRef]
- Robertson, G.P. Nitrification in forested ecosystems. Philos. Trans. R. Soc. Lond. 1982, 296, 445–457. [Google Scholar]
- Finzi, A.C.; Canham, C.D. Non-additive effects of litter mixtures on net N mineralization in a southern New England forest. For. Ecol. Manag. 1998, 105, 129–136. [Google Scholar] [CrossRef]
- Stark, J.M.; Hart, S.C. High rates of nitrification and nitrate turnover in undisturbed coniferous forests. Nature 1997, 385, 61–65. [Google Scholar] [CrossRef]
- Fitzhugh, R.D.; Lovett, G.M.; Venterea, R.T. Biotic and abiotic immobilization of ammonium, nitrite, and nitrate in soils developed under different tree species in the Catskill Mountains, New York, USA. Glob. Chang. Biol. 2003, 9, 1591–1601. [Google Scholar] [CrossRef]
- Lovett, G.M.; Weathers, K.C.; Arthur, M.A.; Schultz, J.C. Nitrogen cycling in a northern hardwood forest: Do species matter? Biogeochemistry 2004, 67, 289–308. [Google Scholar] [CrossRef]
- Christenson, L.M.; Lovett, G.M.; Weathers, K.C.; Arthur, M.A. The influence of tree species, nitrogen fertilization, and soil C to N ratio on gross soil nitrogen transformations. Soil Sci. Soc. Am. J. 2009, 73, 638–646. [Google Scholar] [CrossRef]
- Kelly, C.N.; Schoenholtz, S.H.; Adams, M.B. Soil properties associated with net nitrification following watershed conversion from Appalachian hardwoods to Norway spruce. Plant Soil 2011, 344, 361–376. [Google Scholar] [CrossRef]
- Phillips, R.P.; Brzostek, E.; Midgley, M.G. The mycorrhizal-associated nutrient economy: A new framework for predicting carbon–nutrient couplings in temperate forests. New Phytol. 2013, 199, 41–51. [Google Scholar] [CrossRef]
- Peterjohn, W.T.; Harlacher, M.A.; Chris, M.J.; Adams, M.B. Testing associations between tree species and nitrate availability: Do consistent patterns exist across spatial scales? For. Ecol. Manag. 2015, 358, 335–343. [Google Scholar] [CrossRef]
- Menyailo, O.V.; Huwe, B. Activity of denitrification and dynamics of N2O release in soils under six tree species and grassland in central Siberia. J. Plant Nutr. Soil Sci. 1999, 162, 533–538. [Google Scholar] [CrossRef]
- Melillo, J.M.; Naimen, R.J.; Aber, J.D.; Eschleman, K.N. The influence of substrate quality and stream size on wood decomposition dynamics. Oecologia 1983, 58, 281–285. [Google Scholar] [CrossRef]
- Binkley, D. The influence of tree species on forest soils: Processes and patterns. In Proceedings of the Trees and Soil Workshop, Lincoln University, 28 February–2 March 1994; Mead, D.J., Cornforth, I.S., Eds.; Agronomy Society of New Zealand Special Publication No. 10. Lincoln University Press: Canterbury, UK, 1995. [Google Scholar]
- Sun, T.; Hobbie, S.E.; Berg, B.; Zhang, H.; Wang, Q.; Wang, Z.; Hättenschwiler, S. Contrasting dynamics and trait controls in first-order root compared with leaf litter decomposition. Proc. Natl. Acad. Sci. USA 2018, 115, 10392–10397. [Google Scholar] [CrossRef] [PubMed]
- Melillo, J.M.; Aber, J.D.; Linkins, A.E.; Ricca, A.; Fry, B.; Nadelhoffer, K.J. Carbon and nitrogen dynamics along the decay continuum: Plant litter to soil organic matter. Plant Soil 1989, 115, 189–198. [Google Scholar] [CrossRef]
- Rotkin-Ellman, M.; Addy, K.; Gold, A.J.; Groffman, P.M. Tree species, root decomposition and subsurface denitrification potential in riparian wetlands. Plant Soil 2004, 263, 335–344. [Google Scholar] [CrossRef]
- Templer, P.H.; Lovett, G.M.; Weathers, K.C.; Findlay, S.E.; Dawson, T.E. Influence of tree species on forest nitrogen retention in the Catskill Mountains, New York, USA. Ecosystems 2005, 8, 1–16. [Google Scholar] [CrossRef]
- Vesterdal, L.; Clarke, N.; Sigurdsson, B.D.; Gundersen, P. Do tree species influence soil carbonstocks in temperate and boreal forests? For. Ecol. Manag. 2013, 309, 4–18. [Google Scholar] [CrossRef]
- Averill, C.; Turner, B.L.; Finzi, A.C. Mycorrhiza-mediated competition between plants and decomposers drives soil carbon storage. Nature 2014, 505, 543. [Google Scholar] [CrossRef] [PubMed]
- Yin, H.; Wheeler, E.; Phillips, R.P. Root-induced changes in nutrient cycling in forests depend on exudation rates. Soil Biol. Biochem. 2014, 78, 213–221. [Google Scholar] [CrossRef]
- Matson, P.A.; Vitousek, P.M. Cross-system comparisons of soil nitrogen transformations and nitrous oxide flux in tropical forest ecosystems. Glob. Biogeochem. Cycles 1987, 1, 163–170. [Google Scholar] [CrossRef]
- Davidson, E.A.; Keller, M.; Erickson, H.E.; Verchot, L.V.; Veldkamp, E. Testing a conceptual model of soil emissions of nitrous and nitric oxides: Using two functions based on soil nitrogen availability and soil water content, the hole-in-the-pipe model characterizes a large fraction of the observed variation of nitric oxide and nitrous oxide emissions from soils. AIBS Bull. 2000, 50, 667–680. [Google Scholar]
- Nuccio, E.E.; Hodge, A.; Pett-Ridge, J.; Herman, D.J.; Weber, P.K.; Firestone, M.K. An arbuscular mycorrhizal fungus significantly modifies the soil bacterial community and nitrogen cycling during litter decomposition. Environ. Microbiol. 2013, 15, 1870–1881. [Google Scholar] [CrossRef]
- Burton, A.J.; Pregitzer, K.S.; Crawford, J.N.; Zogg, G.P.; Zak, D.R. Simulated chronic NO3−deposition reduces soil respiration in northern hardwood forests. Glob. Chang. Biol. 2004, 10, 1080–1091. [Google Scholar] [CrossRef]
- Janssens, I.A.; Dieleman, W.; Luyssaert, S.; Subke, J.A.; Reichstein, M.; Ceulemans, R.; Ciais, P.; Dolman, A.J.; Grace, J.; Matteucci, G.; et al. Reduction of forest soil respiration in response to nitrogen deposition. Nat. Geosci. 2010, 3, 315. [Google Scholar] [CrossRef]
- Wallenstein, M.D.; McNulty, S.; Fernandez, I.J.; Boggs, J.; Schlesinger, W.H. Nitrogen fertilization decreases forest soil fungal and bacterial biomass in three long-term experiments. For. Ecol. Manag. 2006, 222, 459–468. [Google Scholar] [CrossRef]
- Nemergut, D.R.; Townsend, A.R.; Sattin, S.R.; Freeman, K.R.; Fierer, N.; Neff, J.C.; Bowman, W.D.; Schadt, C.W.; Weintraub, M.N.; Schmidt, S.K. The effects of chronic nitrogen fertilization on alpine tundra soil microbial communities: Implications for carbon and nitrogen cycling. Environ. Microbiol. 2008, 10, 3093–4105. [Google Scholar] [CrossRef] [PubMed]
- Eisenlord, S.D.; Zak, D.R. Simulated atmospheric nitrogen deposition alters actinobacterial community composition in forest soils. Soil Sci. Soc. Am. J. 2010, 74, 1157–1166. [Google Scholar] [CrossRef]
- Fierer, N.; Lauber, C.L.; Ramirez, K.S.; Zaneveld, J.; Bradford, M.A.; Knight, R. Comparative metagenomic, phylogenetic and physiological analyses of soil microbial communities across nitrogen gradients. ISME J. 2012, 6, 1007. [Google Scholar] [CrossRef] [PubMed]
- Allison, S.D.; Hanson, C.A.; Treseder, K.K. Nitrogen fertilization reduces diversity and alters community structure of active fungi in boreal ecosystems. Soil Biol. Biochem. 2007, 39, 1. [Google Scholar] [CrossRef]
- Edwards, I.P.; Zak, D.R.; Kellner, H.; Eisenlord, S.D.; Pregitzer, K.S. Simulated atmospheric N deposition alters fungal community composition and suppresses ligninolytic gene expression in a northern hardwood forest. PLoS ONE 2011, 6, e20421. [Google Scholar] [CrossRef]
- Carrara, J.E.; Walter, C.A.; Hawkins, J.S.; Peterjohn, W.T.; Averill, C.; Brzostek, E.R. Interactions among plants, bacteria, and fungi reduce extracellular enzyme activities under long-term N fertilization. Glob. Chang. Biol. 2018, 24, 2721–2734. [Google Scholar] [CrossRef]
- Freedman, Z.; Eisenlord, S.D.; Zak, D.R.; Xue, K.; He, Z.; Zhou, J. Towards a molecular understanding of N cycling in northern hardwood forests under future rates of N deposition. Soil Biol. Biochem. 2013, 66, 130–138. [Google Scholar] [CrossRef]
- Freedman, Z.B.; Upchurch, R.A.; Zak, D.R.; Cline, L.C. Anthropogenic N deposition slows decay by favoring bacterial metabolism: Insights from metagenomic analyses. Front. Microbiol. 2016, 7, 259. [Google Scholar] [CrossRef] [PubMed]
- Lilleskov, E.A.; Fahey, T.J.; Horton, T.R.; Lovett, G.M. Belowground ectomycorrhizal fungal community change over a nitrogen deposition gradient in Alaska. Ecology 2002, 83, 104–115. [Google Scholar] [CrossRef]
- Avrahami, S.; Conrad, R.; Braker, G. Effect of soil ammonium concentration on N2O release and on the community structure of ammonia oxidizers and denitrifiers. Appl. Environ. Microbiol. 2002, 68, 5685–5692. [Google Scholar] [CrossRef] [PubMed]
- Kellner, E.; Hubbart, J.; Stephan, K.; Morrissey, E.; Freedman, Z.; Kutta, E.; Kelly, C. Characterization of sub-watershed-scale stream chemistry regimes in an Appalachian mixed-land-use watershed. Environ. Monit. Assess. 2018, 190, 586. [Google Scholar] [CrossRef] [PubMed]
- Estavillo, J.; Merino, P.; Pinot, M.; Yamulki, S.; Gebauer, G.; Sapek, A.; Corre, W. Short term effect of ploughing permanent pasture on N2O production from nitrification and denitrification. Plant Soil 2002, 239, 253–265. [Google Scholar] [CrossRef]
- Meyer, R.L.; Allen, D.E.; Schmidt, S. Nitrification and denitrification as sources of sediment nitrous oxide production: A microsensor approach. Mar. Chem. 2008, 110, 68–76. [Google Scholar] [CrossRef]
- Butterbach-Bahl, K.; Baggs, E.M.; Dannenmann, M.; Kiese, R.; Zechmeister-Boltenstern, S. Nitrous oxide emissions from soils: How well do we understand the processes and theircontrols? Phil. Trans. R. Soc. B 2013, 368, 20130122. [Google Scholar] [CrossRef] [PubMed]
- Liu, R.; Hu, H.; Suter, H.; Hayden, H.L.; He, J.; Mele, P.; Chen, D. Nitrification is a primary driver of nitrous oxide production in laboratory microcosms from different land-use soils. Front. Microbiol. 2016, 7, 1373. [Google Scholar] [CrossRef]
- Kaden, U.S.; Fuchs, E.; Hecht, C.; Hein, T.; Rupp, H.; Scholz, M.; Schulz-Zunkel, C. Advancement of the Acetylene Inhibition Technique Using Time Series Analysis on Air-Dried Floodplain Soils to Quantify Denitrification Potential. Geosciences 2020, 10, 431. [Google Scholar] [CrossRef]
- Henry, S.; Bru, D.; Stres, B.; Hallet, S.; Philippot, L. Quantitative detection of the nosZ gene, encoding nitrous oxide reductase, and comparison of the abundances of 16S rRNA, narG, nirK, and nosZ genes in soils. Appl. Environ. Microbiol. 2006, 72, 5181–5189. [Google Scholar] [CrossRef]
- Jung, J.; Choi, S.; Jung, H.; Scow, K.M.; Park, W. Primers for amplification of nitrous oxide reductase genes associated with Firmicutes and Bacteroidetes in organic-compound-rich soils. Microbiology 2013, 159 Pt 2, 307. [Google Scholar] [CrossRef] [PubMed]
- Rotthauwe, J.H.; Witzel, K.P.; Liesack, W. The ammonia monooxygenase structural gene amoA as a functional marker: Molecular fine-scale analysis of natural ammonia-oxidizing populations. Appl. Environ. Microbiol. 1997, 63, 4704–4712. [Google Scholar] [CrossRef] [PubMed]
- Levy-Booth, D.J.; Prescott, C.E.; Grayston, S.J. Microbial functional genes involved in nitrogen fixation, nitrification and denitrification in forest ecosystems. Soil Biol. Biochem. 2014, 75, 11–25. [Google Scholar] [CrossRef]
- Holmes, A.J.; Costello, A.; Lidstrom, M.E.; Murrell, J.C. Evidence that participate methane monooxygenase and ammonia monooxygenase may be evolutionarily related. FEMS Microbiol. Lett. 1995, 132, 203–208. [Google Scholar] [CrossRef] [PubMed]
- Jensen, S.; Holmes, A.; Olsen, R.; Murrell, J.C. Detection of Methane Oxidizing Bacteria in Forest Soil by Monooxygenase PCR Amplification. Microb. Ecol. 2000, 39, 282–289. [Google Scholar] [PubMed]
- Meinhardt, K.A.; Bertagnolli, A.; Pannu, M.W.; Strand, S.E.; Brown, S.L.; Stahl, D.A. Evaluation of revised polymerase chain reaction primers for more inclusive quantification of ammonia-oxidizing archaea and bacteria. Environ. Microbiol. 2015, 7, 354–363. [Google Scholar] [CrossRef] [PubMed]
- Michotey, V.; Méjean, V.; Bonin, P. Comparison of methods for quantification of cytochrome cd 1-denitrifying bacteria in environmental marine samples. Appl. Environ. Microbiol. 2000, 66, 1564–1571. [Google Scholar] [CrossRef]
- Throbäck, I.N.; Enwall, K.; Jarvis, Å.; Hallin, S. Reassessing PCR primers targeting nirS, nirK and nosZ genes for community surveys of denitrifying bacteria with DGGE. FEMS Microbiol. Ecol. 2004, 49, 401–417. [Google Scholar] [CrossRef]
- Kelly, C.N.; Koos, J.; Griggs, T.; Freedman, Z.B. Prescribed defoliation strategies influence soil carbon and nitrous oxide potential in pastures. Agron. J. 2022, 114, 2264–2279. [Google Scholar] [CrossRef]
- Hurlbert, S.H. Pseudoreplication and the design of ecological field experiments. Ecol. Monogr. 1984, 54, 187–211. [Google Scholar] [CrossRef]
- Matson, P.; Lohse, K.A.; Hall, S.J. The globalization of nitrogen deposition: Consequences for terrestrial ecosystems. Ambio 2002, 31, 113–119. [Google Scholar] [CrossRef] [PubMed]
- Sobota, D.J.; Compton, J.E.; McCrackin, M.L.; Singh, S. Cost of reactive nitrogen release from human activities to the environment in the United States. Environ. Res. Lett. 2015, 10, 025006. [Google Scholar] [CrossRef]
- Suddick, E.C.; Six, J. An estimation of annual nitrous oxide emissions and soil quality following the amendment of high temperature walnut shell biochar and compost to a small-scale vegetable crop rotation. Sci. Total Environ. 2013, 465, 298–307. [Google Scholar] [CrossRef] [PubMed]
- Martin, G.; Dang, C.; Morrissey, E.; Hubbart, J.; Kellner, E.; Kelly, C.; Stephan, K.; Freedman, Z. Stream sediment bacterial communities exhibit temporally-consistent and distinct thresholds to land use change in a mixed-use watershed. FEMS Microbiol. 2021, 97, fiaa256. [Google Scholar] [CrossRef] [PubMed]
- Kelly, C.N.; Schwaner, G.W.; Cumming, J.R.; Driscoll, T.P. Metagenomic reconstruction of nitrogen and carbon cycling pathways in forest soil: Influence of different hardwood tree species. Soil Biol. Biochem. 2021, 156, 108226. [Google Scholar] [CrossRef]
- Eisenhut, S.E.; Holásková, I.; Stephan, K. Role of Tree Species, the Herb Layer and Watershed Characteristics in Nitrate Assimilation in a Central Appalachian Hardwood Forest. Nitrogen 2022, 3, 333–352. [Google Scholar] [CrossRef]
- Royo, A.A.; Vickers, L.A.; Long, R.P.; Ristau, T.E.; Stoleson, S.H.; Stout, S.L. The forest of unintended consequences: Anthropogenic actions trigger the rise and fall of black cherry. BioScience 2021, 71, 683–696. [Google Scholar] [CrossRef]
- Schwaner, G.W.; Kelly, C.N. American chestnut soil carbon and nitrogen dynamics: Implications for ecosystem response following restoration. Pedobiologia 2019, 75, 24–33. [Google Scholar] [CrossRef]
- Brenzinger, K.; Dörsch, P.; Braker, G. pH-driven shifts in overall and transcriptionally active denitrifiers control gaseous product stoichiometry in growth experiments with extracted bacteria from soil. Front. Microbiol. 2015, 6, 961. [Google Scholar] [CrossRef]
- Grennfelt, P.; Hultberg, H. Effects of nitrogen deposition on the acidification of terrestrial and aquatic ecosystems. Water Air Soil Pollut. 1986, 30, 945–963. [Google Scholar] [CrossRef]
- Morales, S.E.; Cosart, T.; Holben, W.E. Bacterial gene abundances as indicators of greenhouse gas emission in soils. ISME J. 2010, 4, 799–808. [Google Scholar] [CrossRef] [PubMed]
- Cai, Z.; Wang, B.; Xu, M.; Zhang, H.; Zhang, L.; Gao, S. Nitrification and acidification from urea application in red soil (Ferralic Cambisol) after different long-term fertilization treatments. J. Soils Sediments 2014, 14, 1526–1536. [Google Scholar] [CrossRef]
- Bergaust, L.; Mao, Y.; Bakken, L.R.; Frostegard, A. Denitrification response patterns during the transition to anoxic respiration and posttranscriptional effects of suboptimal pH on nitrogen oxide reductase in Paracoccus denitrificans. Appl. Environ. Microbiol. 2010, 76, 6387–6396. [Google Scholar] [CrossRef] [PubMed]
- Gilliam, F.S.; Welch, N.T.; Phillips, A.H.; Billmyer, J.H.; Peterjohn, W.T.; Fowler, Z.K.; Walter, C.A.; Burnham, M.B.; May, J.D.; Adams, M.B. Twenty-five-year response of the herbaceous layer of a temperate hardwood forest to elevated nitrogen deposition. Ecosphere 2016, 7, e01250. [Google Scholar] [CrossRef]
- Sterngren, A.E.; Hallin, S.; Bengtson, P. Archaeal ammonia oxidizers dominate in numbers, but bacteria drive gross nitrification in N-amended grassland soil. Front. Microbiol. 2015, 6, 1350. [Google Scholar] [CrossRef] [PubMed]
- Nesme, J.; Achouak, W.; Agathos, S.N.; Bailey, M.; Baldrian, P.; Brunel, D.; Frostegård, Å.; Heulin, T.; Jansson, J.K.; Jurkevitch, E.; et al. Back to the future of soil metagenomics. Front. Microbiol. 2016, 7, 73. [Google Scholar] [CrossRef] [PubMed]
- Wertz, S.; Leigh, A.K.; Grayston, S.J. Effects of long-term fertilization of forest soils on potential nitrification and on the abundance and community structure of ammonia oxidizers and nitrite oxidizers. FEMS Microbiol. Ecol. 2012, 79, 142–154. [Google Scholar] [CrossRef]
Figure 2.
Soil nitrate and ammonium content in the high- and low-N catchments as influenced by tree species. The mean values marked with different letters indicate significant differences determined by Tukey’s HSD mean separation at α = 0.05.
Figure 2.
Soil nitrate and ammonium content in the high- and low-N catchments as influenced by tree species. The mean values marked with different letters indicate significant differences determined by Tukey’s HSD mean separation at α = 0.05.
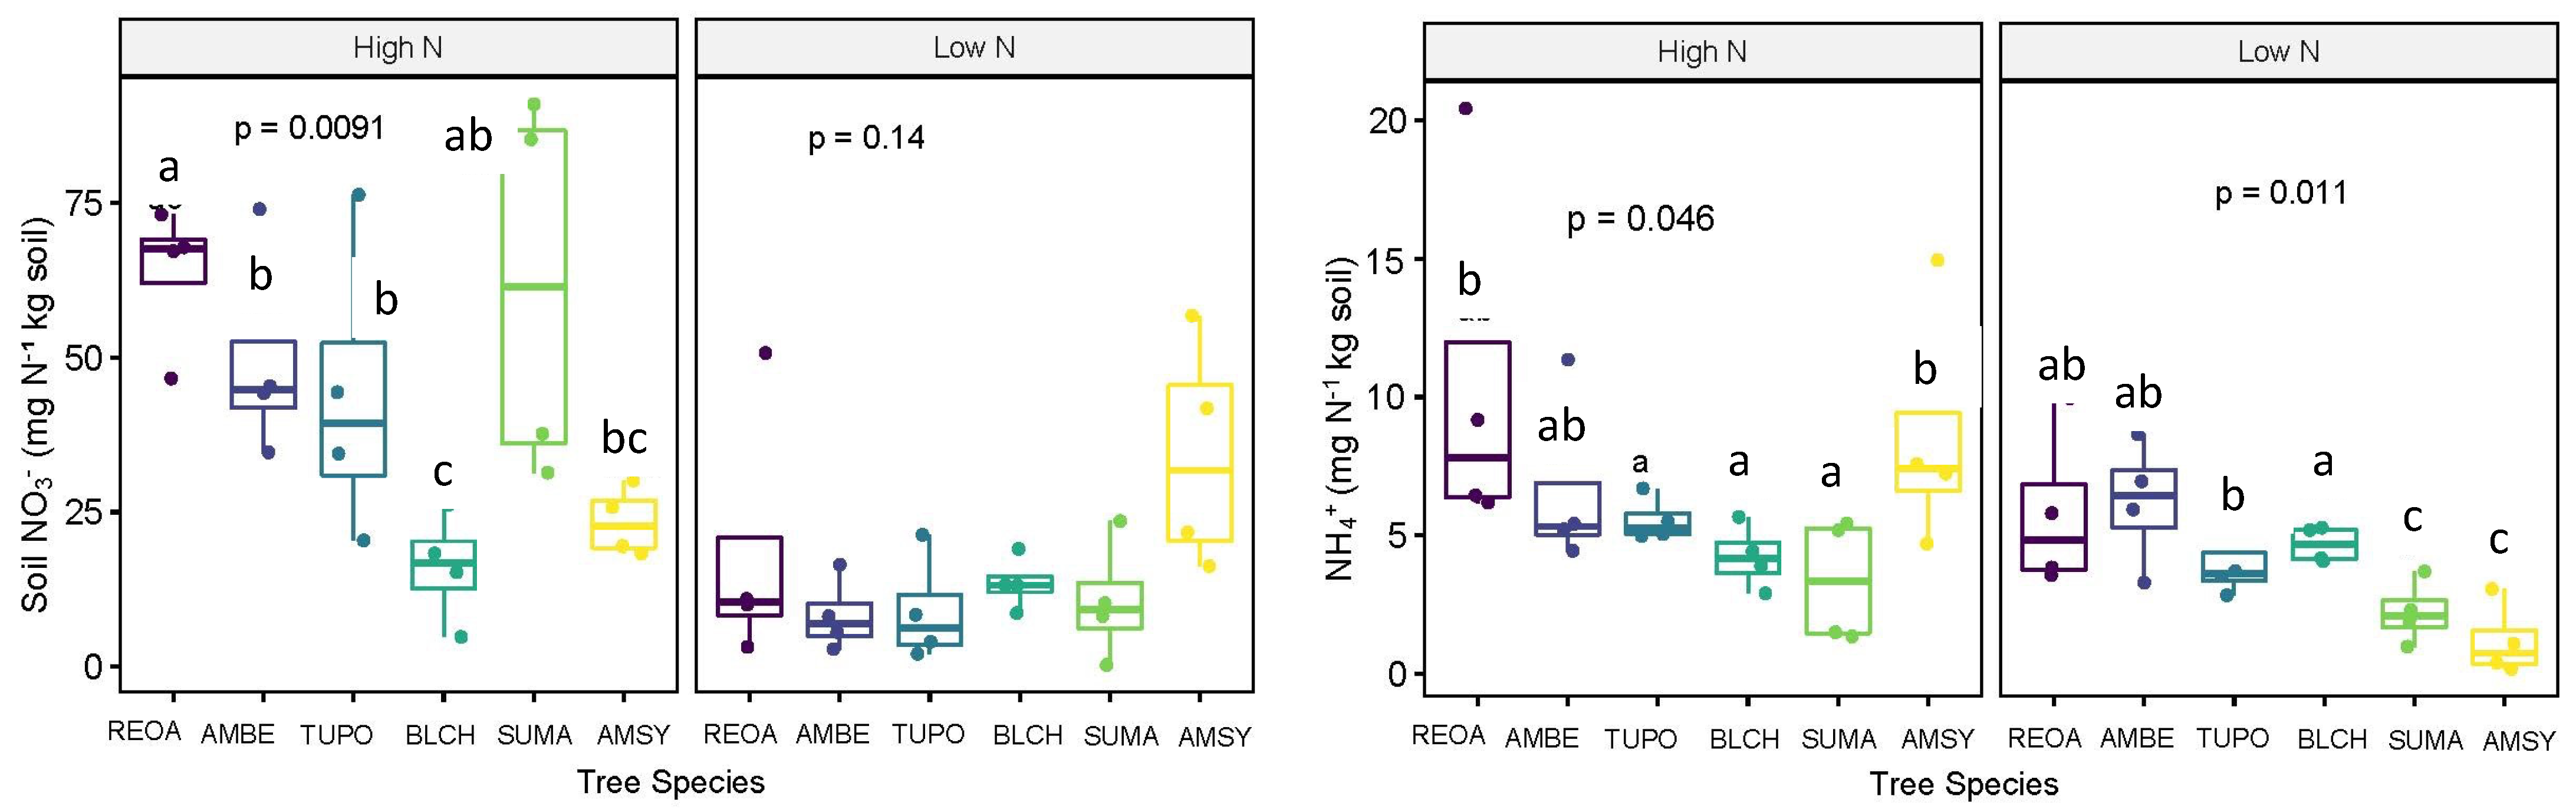
Figure 3.
Soil nitrate and ammonium content and nirK:nosZ gene abundance ratio in the high- and low-N catchments as influenced by mycorrhizal fungal association (ECM or AM). The mean values marked with different letters indicate significant differences determined by Tukey’s HSD mean separation at α = 0.05.

Figure 4.
Soil nitrous oxide production and nirK:nosZ gene abundance ratio in the high- and low-N catchments as influenced by tree species. The mean values marked with different letters indicate significant differences determined by Tukey’s HSD mean separation at α = 0.05.
Figure 4.
Soil nitrous oxide production and nirK:nosZ gene abundance ratio in the high- and low-N catchments as influenced by tree species. The mean values marked with different letters indicate significant differences determined by Tukey’s HSD mean separation at α = 0.05.

Figure 5.
Correlative relationships between nitrous oxide production and soil pH, soil moisture, soil nitrate content, and nosZ gene abundance in the high- and low-N catchments.
Figure 5.
Correlative relationships between nitrous oxide production and soil pH, soil moisture, soil nitrate content, and nosZ gene abundance in the high- and low-N catchments.

Table 1.
Mean values of the measured parameters across the low- and high-N sub-catchments. The parameters marked by an asterisk indicate significantly different values by location at α = 0.05.
Table 1.
Mean values of the measured parameters across the low- and high-N sub-catchments. The parameters marked by an asterisk indicate significantly different values by location at α = 0.05.
| Low N | High N | |
|---|---|---|
| Soil NO3− (mg N/kg soil) * | 15.66 (3.02) | 43.01 (5.02) |
| Soil NH4+ (mg N/kg soil) * | 4.03 (0.50) | 6.49 (0.84) |
| Soil pHCaCl2 | 4.41 (0.16) | 4.27 (0.13) |
| Soil OMLOI (%) | 13.19 (0.67) | 15.59 (1.08) |
| Soil moisture (%) * | 28.75 (1.47) | 24.49 (1.14) |
| nirK (1012 copy number) | 5.64 (1.48) | 3.65 (1.20) |
| nosZ (109 copy number) | 5.78 (1.34) | 2.61 (0.53) |
| N2O production (mg/kg/30 h) | 0.51 (0.08) | 0.37 (0.07) |
Table 2.
Stepwise regression model parameters included to predict soil NO3−, NH4+, and potential N2O production. The overall model adjusted R2 and model p-values are presented inclusive of the variables listed for each dependent variable.
Table 2.
Stepwise regression model parameters included to predict soil NO3−, NH4+, and potential N2O production. The overall model adjusted R2 and model p-values are presented inclusive of the variables listed for each dependent variable.
| Predicted Dependent Variable | Explanatory Independent Variable | F Ratio | Parameter p-Value | Model Adjusted R2 | Model p-Value |
|---|---|---|---|---|---|
| Soil NO3− (mg N/kg soil) | Tree species | 2.72 | 0.033 | 0.442 | <0.001 |
| Location | 33.89 | <0.001 | |||
| Soil moisture | 7.37 | 0.009 | |||
| Soil NH4+ (mg N/kg soil) | Tree species | 2.19 | 0.075 | 0.444 | |
| nosZ gene abundance | 3.93 | ||||
| Soil pH | 5.78 | 0.021 | |||
| Soil OM | 6.44 | 0.015 | |||
| Potential N2O (mg N/kg soil) | Tree species | 3.31 | 0.015 | 0.686 | <0.001 |
| Location | 4.73 | 0.036 | |||
| Soil pH | 63.77 | <0.001 | |||
| Soil OM | 6.33 | 0.016 |
Table 3.
Mean response of the measured soil NO3−, NH4+, and potential N2O production by tree species across both catchments as significant parameters in predictive regression models. Significant differences in the mean response for each variable are noted by different letters (Tukey’s HSD α < 0.05).
| Predicted Dependent Variable | Tree Species | Mean Response |
|---|---|---|
| Soil NO3− (mg N/kg soil) | Sycamore (AMSY) | 28.77 ab |
| Cherry (BLCH) | 14.79 b | |
| Oak (REOA) | 41.21 a | |
| Beech (AMBE) | 28.91 ab | |
| Poplar (TUPO) | 26.41 ab | |
| Sugar maple (SUMA) | 35.94 ab | |
| Soil NH4+ (mg N/kg soil) | Sycamore (AMSY) | 4.90 ab |
| Cherry (BLCH) | 4.45 b | |
| Oak (REOA) | 8.17 a | |
| Beech (AMBE) | 6.40 ab | |
| Poplar (TUPO) | 4.83 ab | |
| Sugar maple (SUMA) | 2.79 ab | |
| Potential N2O (mg N/kg soil/30 h) | Sycamore (AMSY) | 0.83 a |
| Cherry (BLCH) | 0.33 ab | |
| Oak (REOA) | 0.48 ab | |
| Beech (AMBE) | 0.44 ab | |
| Poplar (TUPO) | 0.31 ab | |
| Sugar maple (SUMA) | 0.26 b |
Disclaimer/Publisher’s Note: The statements, opinions and data contained in all publications are solely those of the individual author(s) and contributor(s) and not of MDPI and/or the editor(s). MDPI and/or the editor(s) disclaim responsibility for any injury to people or property resulting from any ideas, methods, instructions or products referred to in the content. |
© 2023 by the authors. Licensee MDPI, Basel, Switzerland. This article is an open access article distributed under the terms and conditions of the Creative Commons Attribution (CC BY) license (https://creativecommons.org/licenses/by/4.0/).
Share and Cite
MDPI and ACS Style
Kelly, C.N.; Matejczyk, E.A.; Fox-Fogle, E.G.; Hubbart, J.A.; Driscoll, T.P. Tree Species Influence Nitrate and Nitrous Oxide Production in Forested Riparian Soils. Nitrogen 2023, 4, 311-330. https://doi.org/10.3390/nitrogen4040023
AMA Style
Kelly CN, Matejczyk EA, Fox-Fogle EG, Hubbart JA, Driscoll TP. Tree Species Influence Nitrate and Nitrous Oxide Production in Forested Riparian Soils. Nitrogen. 2023; 4(4):311-330. https://doi.org/10.3390/nitrogen4040023
Chicago/Turabian StyleKelly, Charlene N., Elizabeth A. Matejczyk, Emma G. Fox-Fogle, Jason A. Hubbart, and Timothy P. Driscoll. 2023. "Tree Species Influence Nitrate and Nitrous Oxide Production in Forested Riparian Soils" Nitrogen 4, no. 4: 311-330. https://doi.org/10.3390/nitrogen4040023