Article

Influence of Pasture Stocking Method on Surface Runoff and Nutrient Loss in the US Upper Midwest

by
Eric O. Young
1,*,
Jessica F. Sherman
1,
Brooke R. Bembeneck
2,
Randall D. Jackson
3,
Jason S. Cavadini
4 and
Matthew S. Akins
1
1
USDA-ARS Institute for Environmentally Integrated Dairy Management Research, Marshfield, WI 54449, USA
2
Marathon County Department of Conservation, Planning & Zoning, Wausau, WI 54403, USA
3
Department of Plant & Agroecosystem Sciences, University of Wisconsin-Madison, Madison, WI 53706, USA
4
Division of Extension, University of Wisconsin-Madison, Stratford, WI 54484, USA
*
Author to whom correspondence should be addressed.
Nitrogen 2023, 4(4), 350-368; https://doi.org/10.3390/nitrogen4040025
Submission received: 30 September 2023 / Revised: 9 November 2023 / Accepted: 14 November 2023 / Published: 16 November 2023

Abstract

:
Grazing and hay forage crops reduce erosion compared to annual crops, but few studies have compared soil and nutrient loss among grazing systems compared to a control. We evaluated runoff water quality and nutrient loss among three grazing systems and a hay crop production field with manure application (control) using a paired watershed design. Four edge-of-field sites at a research farm in central Wisconsin were managed as hay during calibration (2013–2018) followed by a grazing treatment phase (2018–2020). Grazing treatments of different stocking methods included continuous stocking (CS), primary paddock stocking (PPS), and adaptive multi-paddock stocking (AMPS). Runoff, sediment, nitrogen (N), and phosphorus (P) loads were monitored year-round. Grazing increased average runoff volume by as much as 1.7-fold depending on stocking method and tended to decrease event mean N and P concentrations. CS had larger mean sediment (2.0-fold), total N (1.9-fold), and total P loads (1.2-fold) compared to the control and had the lowest average pasture forage mass. AMPS had lower N and P loss as a percentage of that applied from manure application/livestock excretion (1.3 and 1.6%, respectively) compared to the control (2.5 and 2.1%), PPS (2.5 and 2.6%), and CS (3.2 and 3.0%). Stocking method had a marked impact on nutrient loss in runoff from these systems, suggesting water quality models should account for pasture management, but nutrient losses from all perennial forage systems were small relative to previous data from annual cropping systems.

1. Introduction

Pastureland can simultaneously provide forage for grazing animals and environmental benefits by reducing or eliminating soil erosion, compared to annual crops producing livestock feed [1,2,3]. In addition, pastureland can build soil carbon and reduce nutrient losses like nitrogen (N) and phosphorus (P) in surface runoff and subsurface leaching, while enhancing biodiversity and reducing flooding, compared to annual cropping systems [1,2,3,4,5,6,7,8,9,10].
Pastureland refers to the production of forage plants (including combinations of grasses legumes, and forbs) for grazing animals or harvested feed [11]. In terms of managed grazing, pastureland and grasslands are often considered the same. Grazing systems are defined by specific combinations of farms, soils, plant communities, livestock/animals, and stocking/management methods along with unique economic and social dimensions that contribute to overall farm goals [11].
Management of pastureland varies widely according to geography, climate, and soils. An important farm-specific pasture management factor is stocking method, which refers to techniques that manipulate animals in space and time for planned farming objectives [11]. Continuous stocking is a common grazing management practice that gives livestock unrestricted access to pasture. Rotational stocking, on the other hand, divides pastures into three or more smaller units with permanent or temporary fencing to manage livestock access and thus forage consumption and excreta return [3,11]. Rotational stocking attempts to increase forage growth and animal performance and offers additional ecosystems services, but entails more intensive management [2,3,7,8,9]. In contrast, continuous stocking requires less management by the farmer but can result in overgrazing and in the degradation of forage growth, soil and water resources, and animal performance over time [3,4].
Faust et al. [12] noted a lack of information about water quality in relation to grazing management and integrated crop–livestock systems and stressed the need for more research addressing linkages between grazing systems and runoff water quality. In general, studies report that grazing animals on pasture or forage fields compared to a condition of no grazing can accelerate erosion and lead to N and P loss in runoff [12,13,14,15,16,17,18,19,20]. Livestock can also cause soil compaction, potentially decreasing infiltration, increasing runoff, and exacerbating nutrient losses [17,18,21,22]. Daniel et al. [19] performed rainfall-runoff simulations and showed that grazed winter wheat generated threefold more sediment loss than ungrazed plots. With respect to farm- and field-scale N and P losses in runoff, the relative importance of pastures as a nutrient source is not well understood compared to other sources, such as annual crops receiving manure and other concentrated sources like barnyards [23]. Grazing livestock excrete urine and feces that can serve as a source of N and P in runoff waters and nearby surface waters depending on hydrology and grazing practices.
In addition to livestock impacts on runoff nutrient loss, studies have also demonstrated the importance of other site factors affecting nutrient losses from pastureland, including soil fertility and P availability, timing and amount of fertilizer applications in relation to runoff events, ground cover, soil type, and slopes [22,23,24,25,26,27,28,29]. In a two-year edge-of-field runoff study in southwestern Wisconsin, USA, Vadas et al. [23] monitored eight pastures used for non-lactating dairy or beef cows (at a stocking rate of 2.7 animal units ha−1) and reported low average annual total N (2.9 kg ha−1) and P loads (1 kg ha−1) in surface runoff attributed to well-established pasture.
Of the few studies assessing pasture stocking management on runoff water quality, several report a link between stocking density and runoff water quality [14,15,16,24,30]. Schepers et al. [13] reported that surface runoff water quality measures (total N, P, chemical oxygen demand) were related to the density of grazing livestock from a large cow-calf pasture in Nebraska, USA. Lyons et al. [30] reported that riparian areas in southwestern Wisconsin, USA, that were subjected to intensive rotational grazing had significantly lower soil erosion rates compared to riparian areas with continuous stocking. In a watershed modeling study, Park et al. [16] simulated different levels of grazing management including heavy/light continuous and adaptive multi-paddock stocking on ranch pastureland in north central Texas, USA. They estimated that changing from the baseline condition of heavy continuous grazing to multi-paddock could decrease runoff and sediment loss by 47 and 40%, respectively, and total N and P loads by 35 and 34%, respectively (over a 33-year simulation). In contrast, Capece et al. [24] studied water quality and P losses from 16 large, improved summer and winter beef cow pastures in Florida, USA, across low to high stocking rates (0.6 to 2.1 animal units ha−1). No relationship between stocking density and P loss was reported; however, high background soil P concentrations appeared to have had an overriding effect on P loss.
Many dairy operations use grazing on some level, from continuous stocking of larger pastures with non-lactating cows and dairy heifers on permanent lots to more intensively managed rotational stocking of lactating and non-lactating cows. Few studies have measured both N and P loss in runoff from pastures year-round in cold climates, particularly in dairy systems. There is a need to better quantify field-scale nutrient losses and edge-of-field runoff water quality risk in pasture systems, since much of the research on runoff water quality risk and nutrient loss has been conducted in annual cropping systems [23,29]. The objective of our study was to quantify runoff, sediment, N, and P loss differences between hay and grazing management systems using a small, paired watershed design. Four edge-of-field sites were managed as harvested hay during calibration (2013–2018) followed by three grazing treatments (2018–2020). Surface runoff, sediment, total N, ammonium-N, nitrate-N, total P, and dissolved P were monitored year-round (including capturing all major snowmelt events). A paired watershed design was used to compare concentrations and loads during the calibration and treatment phases and to compare each individual stocking method to the control condition (hay crop production).

2. Materials and Methods

2.1. Site Description

This study was conducted at four long-term edge-of-field monitoring stations at the University of Wisconsin/USDA-ARS Marshfield Agricultural Research Station near Stratford, Wisconsin, USA. The paired watersheds were mapped as somewhat poorly drained Withee silt loam (fine-loamy, mixed, superactive, frigid Aquic Glossudalfs; 1–3% slope) with a dense B-horizon at ~50 cm depth resulting in high runoff potential. The 30-year average annual temperature and precipitation were 6.9 °C and 831 mm, respectively. Each field/watershed was approximately 1.6 ha in size and surrounded by an earthen berm to contain and direct surface runoff to individual H-flume. Watersheds were referred to individually as M1, M2, M3, and M4. The average slope was approximately 2% for M1, M2, and M4 but was 0.25% for the lower 1/3 of watershed M3 and 3% for the upper 2/3 of the area. Therefore, the lower third of field M3 was more imperfectly drained, with visible standing water after heavy rainfall and snowmelt events. More detail on site topography, original site design/layout, and sampling stations is presented elsewhere [31,32].

2.2. Hay Field Treatments and Manure Applications

From 2006 to 2012 watersheds were managed in a corn silage cropping system experiment with different manure application treatments during a calibration and watershed treatment study phase [31,32]. In spring 2012, on 16 May 2012, watersheds were tilled and seeded with a grass and legume mixture consisting of 6.7 kg ha−1 of alfalfa (Medicago sativa L.) and 11.2 kg ha−1 of meadow fescue (Festuca pratensis L.), with 107 kg ha−1 of oats (Avena sativa L.) as a nurse crop, using a grain drill. The seedbed was first prepared by chisel plowing followed by two passes with a field cultivator and one pass with a culti-mulcher implement for additional smoothing. Hay was harvested two to three times per year from the watersheds with the same number of liquid dairy manure applications applied after cuttings during 2012 to 2017. Manure applied during this time was tested for dry matter solids and N and P contents [33] and combined with manure application records from calibrated application tankers to enable estimates of total N and P applied each season. Hay yields of each watershed were also monitored.

2.3. Grazing System Treatments

In spring 2018, grazing treatments were established on three (M1, M3, and M4) of the four fields, while field M2 remained in hay. Field M2 was selected to be the control field because previous research indicated it was most representative of collective watershed conditions. At this time of the forage stand growth stage, little alfalfa remained, and the stand was dominated by meadow fescue, white clover (Trifolium repens), Alsike clover (T. hybridum), and cool-season grasses. The control treatment (control; field M2) remained in hay crop production, with harvest occurring two to three times per season as haylage or round bales. Liquid dairy manure was surface-applied after hay harvests one to two times per season, as it was during the calibration phase for all watersheds.
Each of the grazing systems consisted of 5 dairy heifers (mean starting weight = 227 kg) turned out to the watershed pastures during the season with an average whole pasture stocking density of approximately 1.42 animal units ha−1. Continuous stocking (CS; field M4) gave heifers complete access to the entire pasture all season. Forage was considered exhausted when 50% of available feed had been consumed or a pasture stubble height of ~10 cm had been achieved. A feed bunk was installed on the edge of the pasture with pre-weighed feed when animals required supplemental nutrition. Pasture forage was also supplemented with dry hay when heifers were turned out each spring to reduce feed transition issues.
The permanent-paddock stocking treatment (PPS; field M1) divided the pasture into three roughly equal areas with temporary fencing. Heifers were rotated through each paddock every 7 to 15 day depending on the amount of forage remaining (with the goal of leaving 10 cm of stubble). This system required a moderate level of time to manage fencing and move animals and is considered a rotational stocking method designed to provide adequate forage while reducing potential damage from overgrazing [34]. Forage was supplemented when heifers were turned onto pasture and as necessary, as with the CS system.
The adaptive multi-paddock stocking (AMPS; field M3) system consisted of temporary fencing to create areas large enough to support grazing by heifers for a period of 1 to 3 days depending on time of year and forage growth. This system required the most labor to manage but was designed to maximize forage utilization by animals while reducing the potential for soil disturbance from overgrazing-related processes [34]. Forage was supplemented when heifers were turned onto pasture with the other grazing systems. All pastures were periodically clipped using a disc bine or bush hog in the summer to manage weeds and maintain high quality forage by avoiding mature growth.
Each year, heifers were turned out to the watershed pastures for grazing from approximately the third week of May/early June until the third week of October. Days grazed during the season for 2018, 2019, and 2020 varied (136, 134, and 119 days, respectively); however, heifers remained on pasture for consecutive days during seasons on all three watersheds. Free-choice mineral including salt was available and above ground waterlines were installed each season to supply water to heifers via 189 L pressurized water tanks with float valves. In extended heat spells, or when animals required veterinary care, individual heifers were either returned to the pasture after treatment or replaced with another animal.
Pasture growth was monitored in 2018 and 2019 along with hay yields for the control field. Pasture biomass was estimated using a rising plate meter that measures average forage height per unit area. Forage height was converted to biomass using established linear regression equations to estimate standing biomass (kg dry matter ha−1) above a stubble height of 10 cm. Due to unequal sampling and distribution of forage related to the different stocking treatments, frequency of sampling varied among the stocking systems. Hay yields for the control watershed were measured by weighing the mass of forage harvested as hay crop silage or round bales using farm truck scales. Manure production along with total N and P inputs for the grazing phase were estimated based on average heifer weight and the number of grazing days based on Wisconsin guidelines specific to Wisconsin pastures [35].

2.4. Surface Runoff and Related Nutrient Measures

Runoff was sampled and monitored at gauging stations located at the low point of each watershed/field. Flume design and monitoring procedures were based on those used by the US Geological Survey with slight modifications [36]. Stations had 60 cm fiberglass H-flumes (Tracom, Jasper, GA, USA) to measure surface flows from each watershed. Flume frames were mounted on angle iron steel with threaded leveling rods. Flumes were integrated into the vegetated berms dividing watersheds with steel wingwalls. Electricity at the site provided sampling equipment with AC power (with DC backup) including flume and sample line heating elements to reduce snow and ice buildup. Flow meters and sampling equipment were housed and protected from weather in plastic sheds (1.8 × 2.1 × 2 m; Niagara model, Yardmate Series, Royal Outdoor Products, Inc. Middleburg Hts., OH).
Surface runoff volume was determined by measuring stage in H-flumes with an air bubbler/pressure transducer flow meter (ISCO Model 4230, Teledyne Isco, Inc., Lincoln, NE, USA). A bubbler PVC tube (3.175 mm i.d.) was attached to the floor of the flume 40 mm back from the outlet. Staff gages were also installed in the H-flumes to allow simultaneous comparison of stage with that from the flow meter. Flow-based runoff samples were collected by an automated 24-bottle (1 L) refrigerated sampler (ISCO 6712SR, Teledyne Isco, Inc.). A sampling tube (9.3 mm i.d.) was attached to the flume floor near the flume outlet and extended approximately 2 m to the automated sampler inside the enclosure, protected from freezing by heat tape and foam insulation. A CR1000 data logger (Campbell Scientific, Inc., Logan, UT, USA) was used to read and store data and control the runoff sampling collection scheme. Real time, two-way radio telemetry allowed remote communication with each runoff monitoring station and the weather station. A Campbell scientific software program, Loggernet (version 4.5), was used to connect with the wireless internet-connected system and communicate remotely with the field stations to read runoff data in real-time and modify the sampling program, if needed.
A weather station located 1000 m from the site measured precipitation with a tipping bucket rain gage, temperature, humidity, wind, and solar irradiance. Along with daily weather data, monthly average temperature and precipitation values were computed and compared to 30 year averages (1981–2010) to determine net annual deviation from normal for each year of the study.
Runoff samples from individual bottles from each runoff event were combined, subsampled, and analyzed for total dissolved solids (TDS) (Method 2540C; [37]), suspended solids (SS) (Method 3977-97B; [38]), total N, and total P (acid persulfate/autoclave method; [39]). A second sample (60 mL) was passed through a 0.45 μm pore size filter for dissolved reactive P (DRP) (Method 4500-P F; [37]), nitrate-N (Method 4500-NO3 F; [37]), and ammonium-N (phenolate method; [37]).
Soil samples from each watershed were taken each fall to assess organic matter content, pH, and plant-available P using standard procedures used at the University of Wisconsin Soil and Forage Laboratory [40]. Soil samples were obtained using a 2.5 cm diameter hand sampler at a depth of 10 cm. Twenty individual cores were collected from each watershed and composited, air-dried, and sieved (2 mm). Organic matter was measured by loss on ignition [41], pH by electrometric method (1:1, soil/water; [42]), and soil P by Bray-1 extractant [43].

2.5. Statistical Methods

To determine the effect of stocking treatments on runoff and nutrient loss compared to the control, a paired watershed analysis [44] was conducted using the Statistical Analysis System (SAS) [45]. This approach uses analysis of covariance to determine overall differences between control and treatment period regression equations, including slopes and intercepts. The method also generates mean predicted values to enable comparisons between calibration and treatment periods to test significance. All precipitation and seasonal events were used for the analysis (i.e., snowmelt, non-growing season, and growing events were all included). In this analysis, each stocking treatment was compared to the control, while treatments themselves were not compared statistically. Dependent variables analyzed in this study were volumetric surface runoff depth and runoff concentrations/loads of total N, ammonium-N, nitrate-N, total P (TP), dissolved reactive P (DRP), and suspended sediment (SS). Variables were transformed as needed to achieve normality prior to regression analysis but all data are presented on original scales for ease of interpretation. Simple linear regression was used to evaluate relationships between select dependent variables. Statistical significance was determined at p ≤ 0.10.

3. Results and Discussion

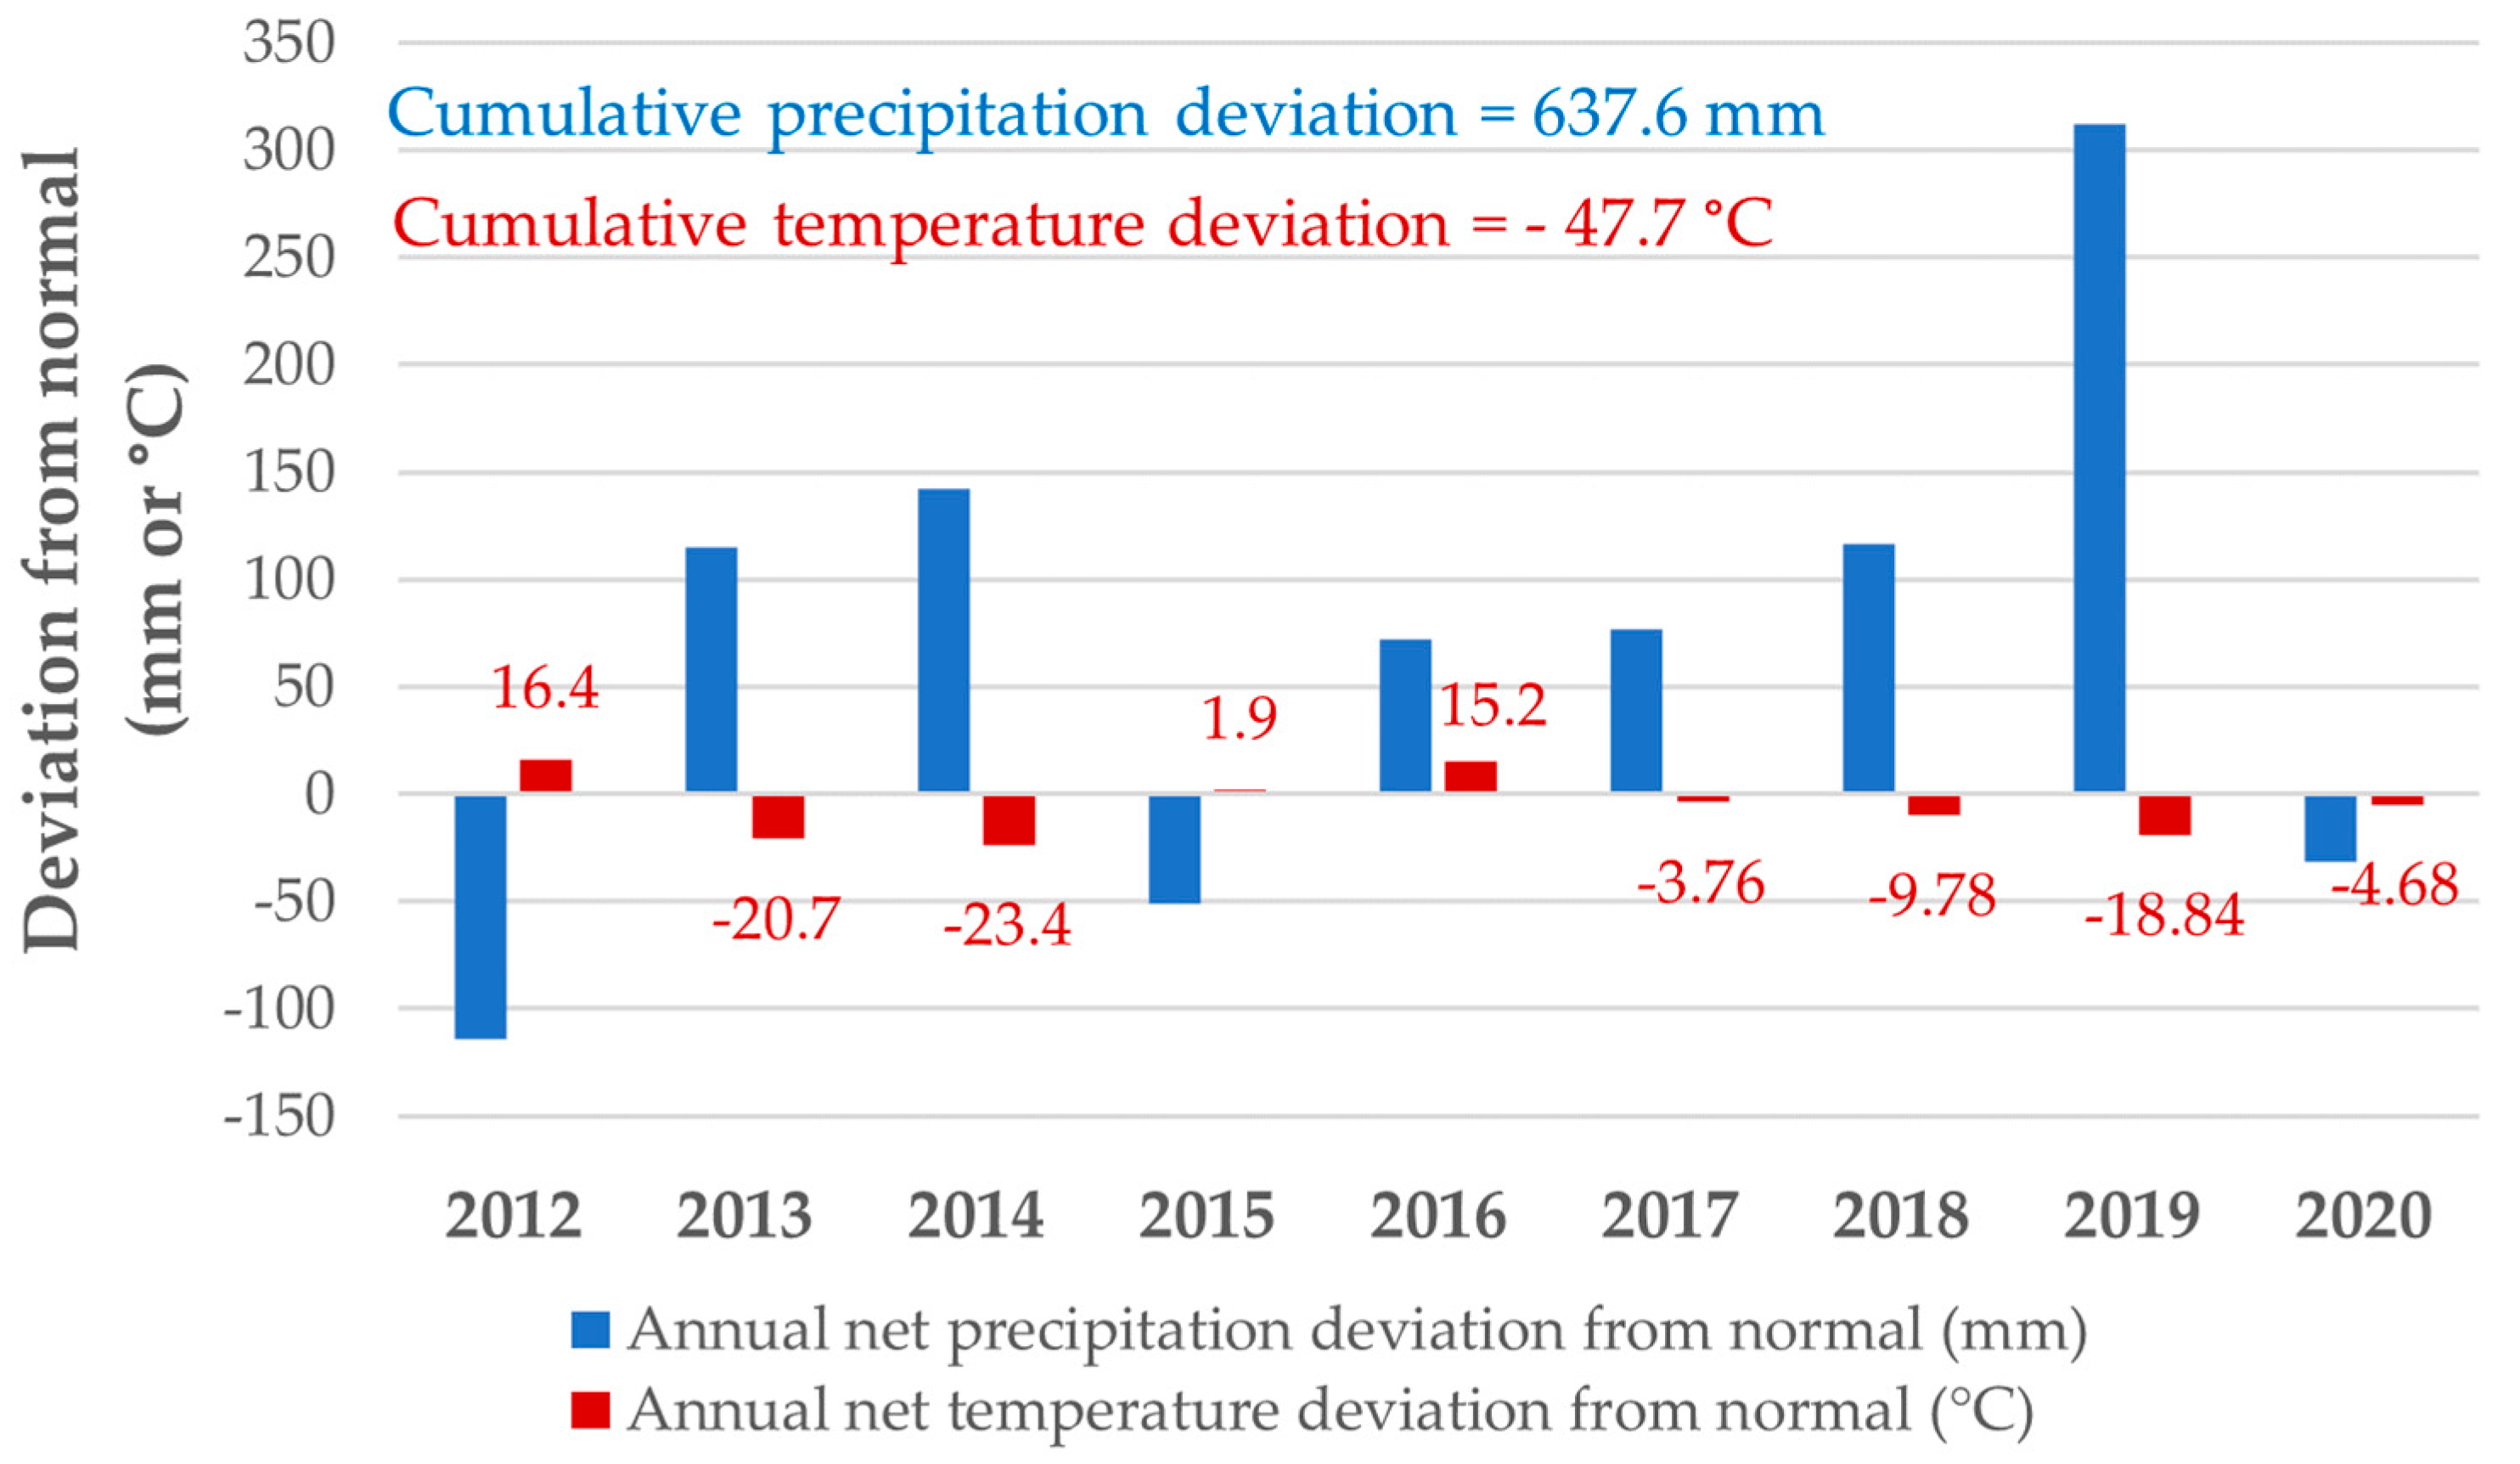
3.1. Weather Conditions

Weather over the study period was cooler than normal (six of nine years), with above-average precipitation (six of nine years) (Figure 1). The 2013, 2014, and 2019 seasons were particularly wet and cool, with near record snowfall in February and March 2019 and large snowmelt runoff events that spring. Cumulative precipitation and temperature deviations reflect net changes over the study period and indicate they were generally cooler and wetter than 30 year averages.

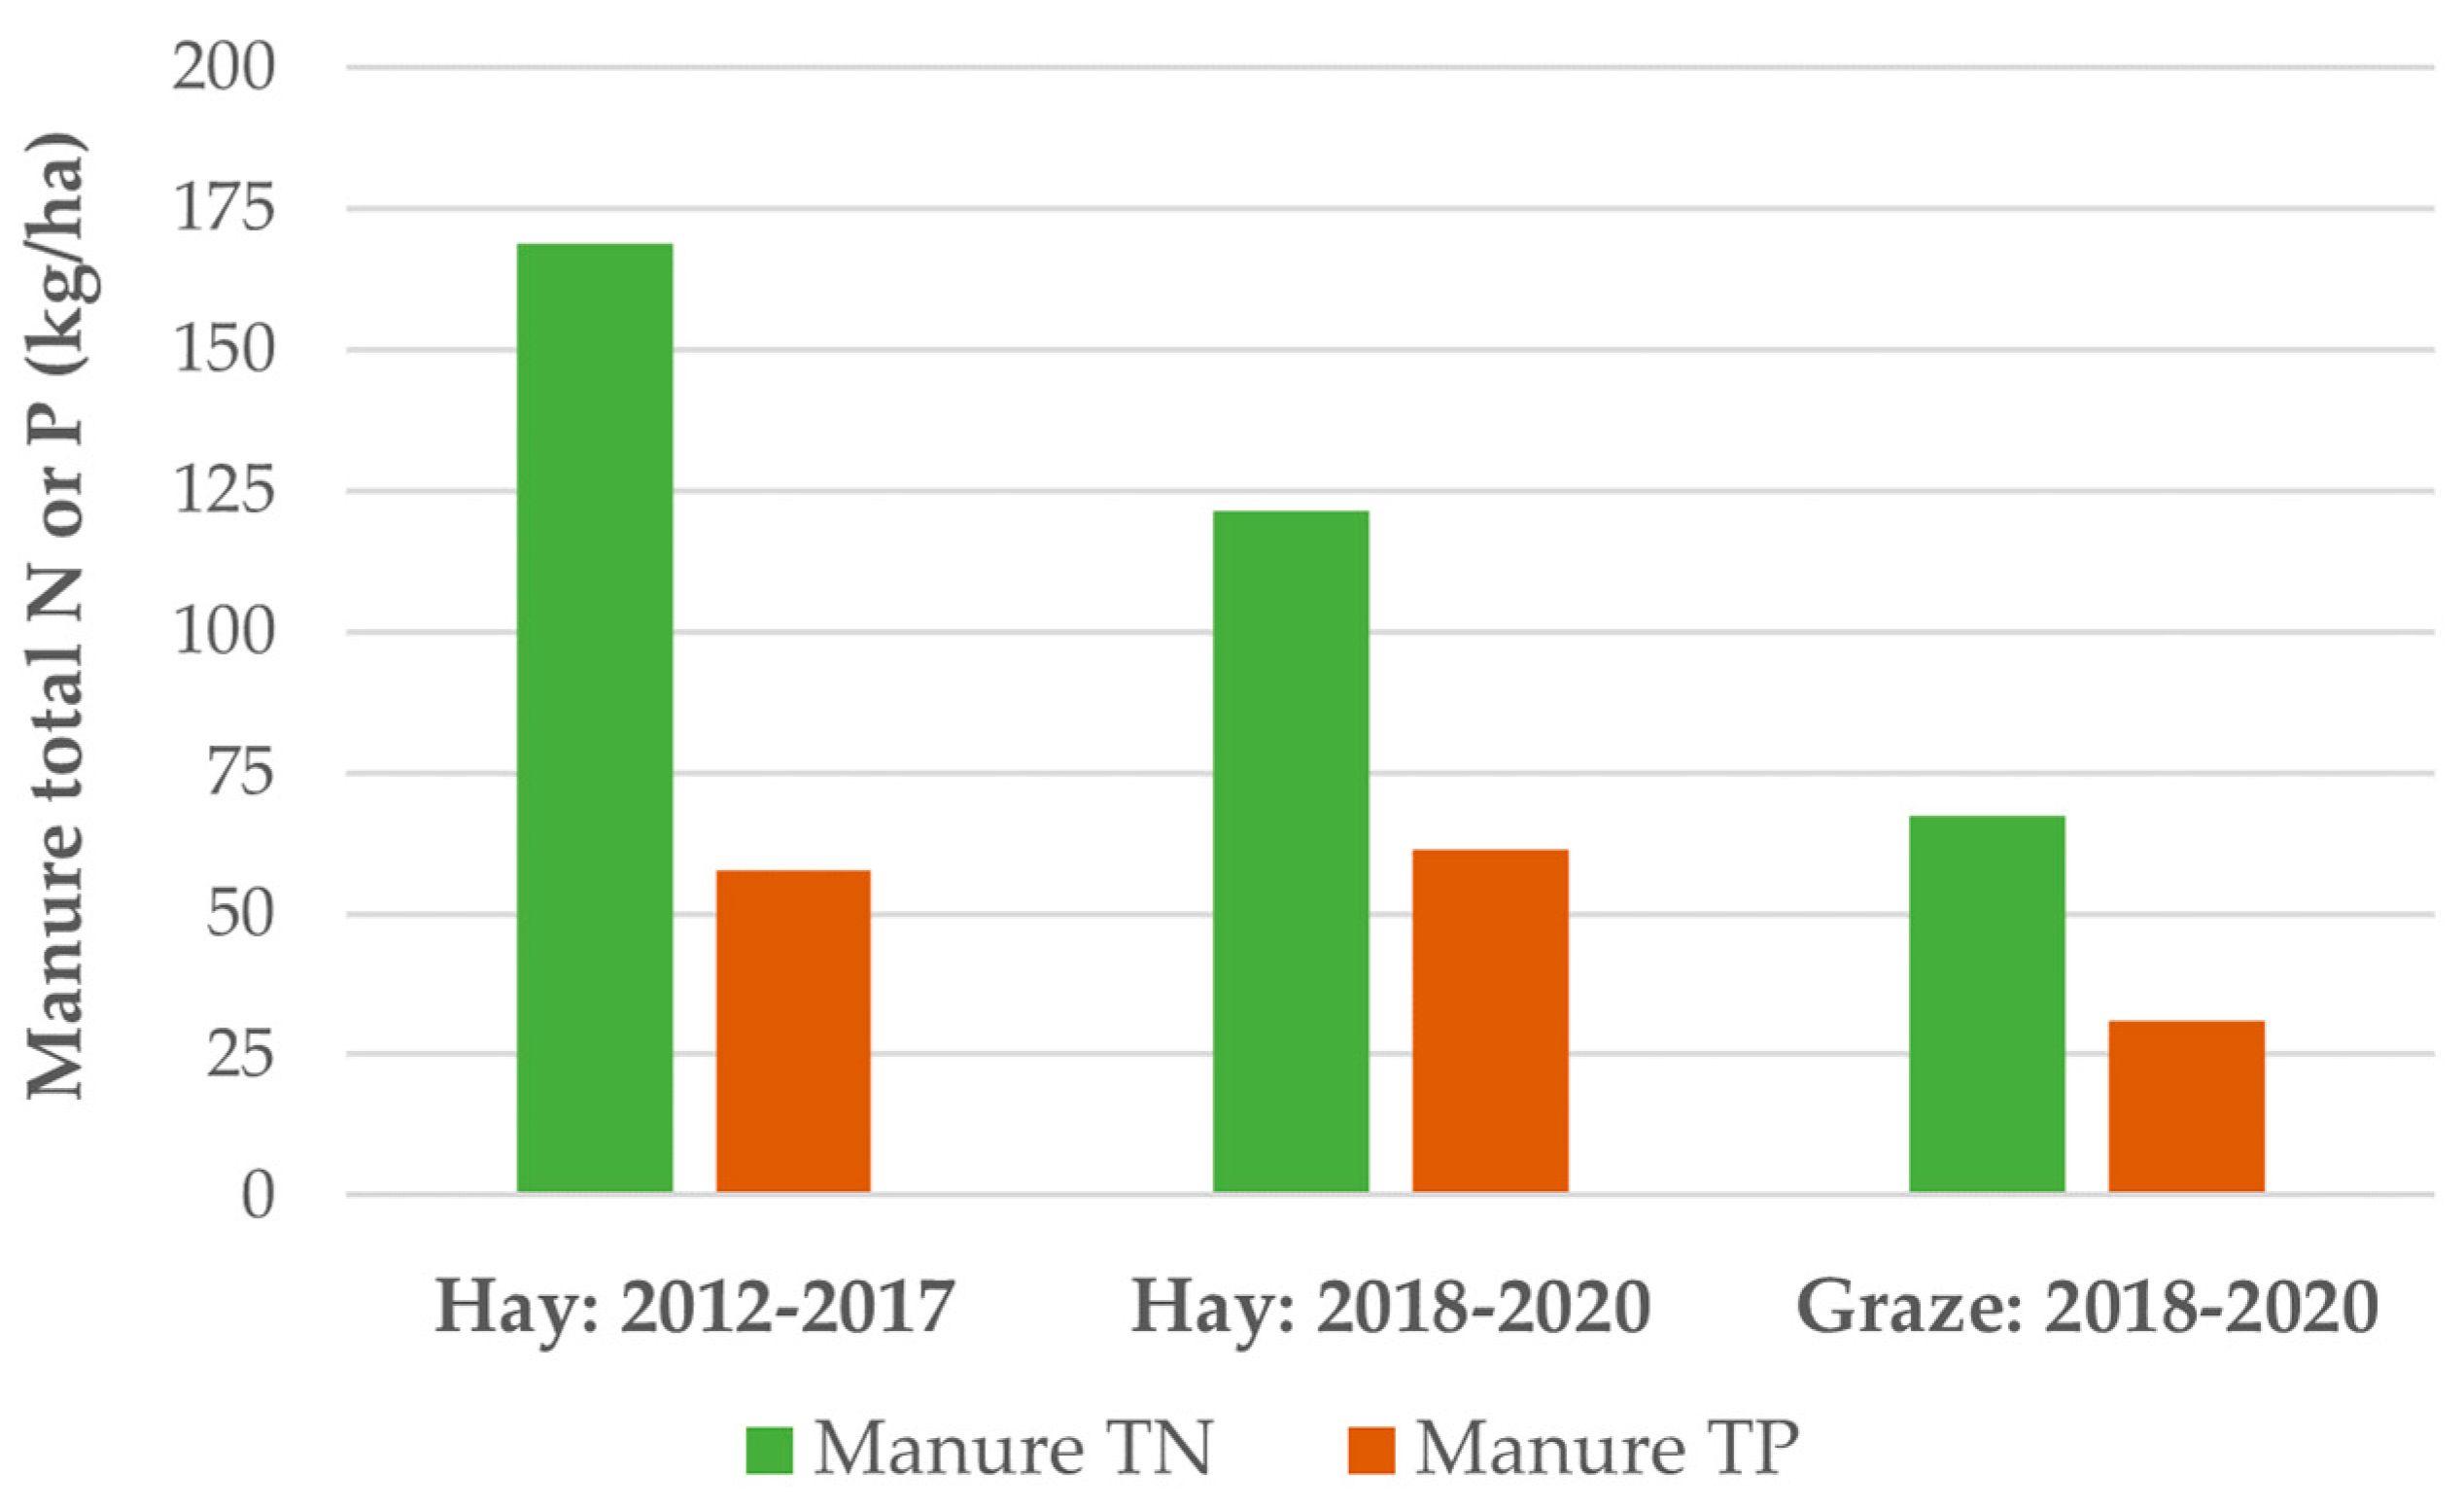
3.2. Manure Nitrogen and Phosphorus Inputs

Farm records were used to estimate annual total N and P contributions from liquid dairy manure applications. Average application of total N and P for the calibration and treatment phase showed that manure provided a substantial amount of these nutrients each year (Figure 2). Manure N and P excreted by heifers were also estimated for the grazing treatment phase (Figure 2). These estimates were the same for each grazing system, since they were based on the number of days spent grazing and average heifer weight. Compared to inputs from liquid manure to the control field, total N and P inputs from grazing heifers were substantially less (Figure 2).

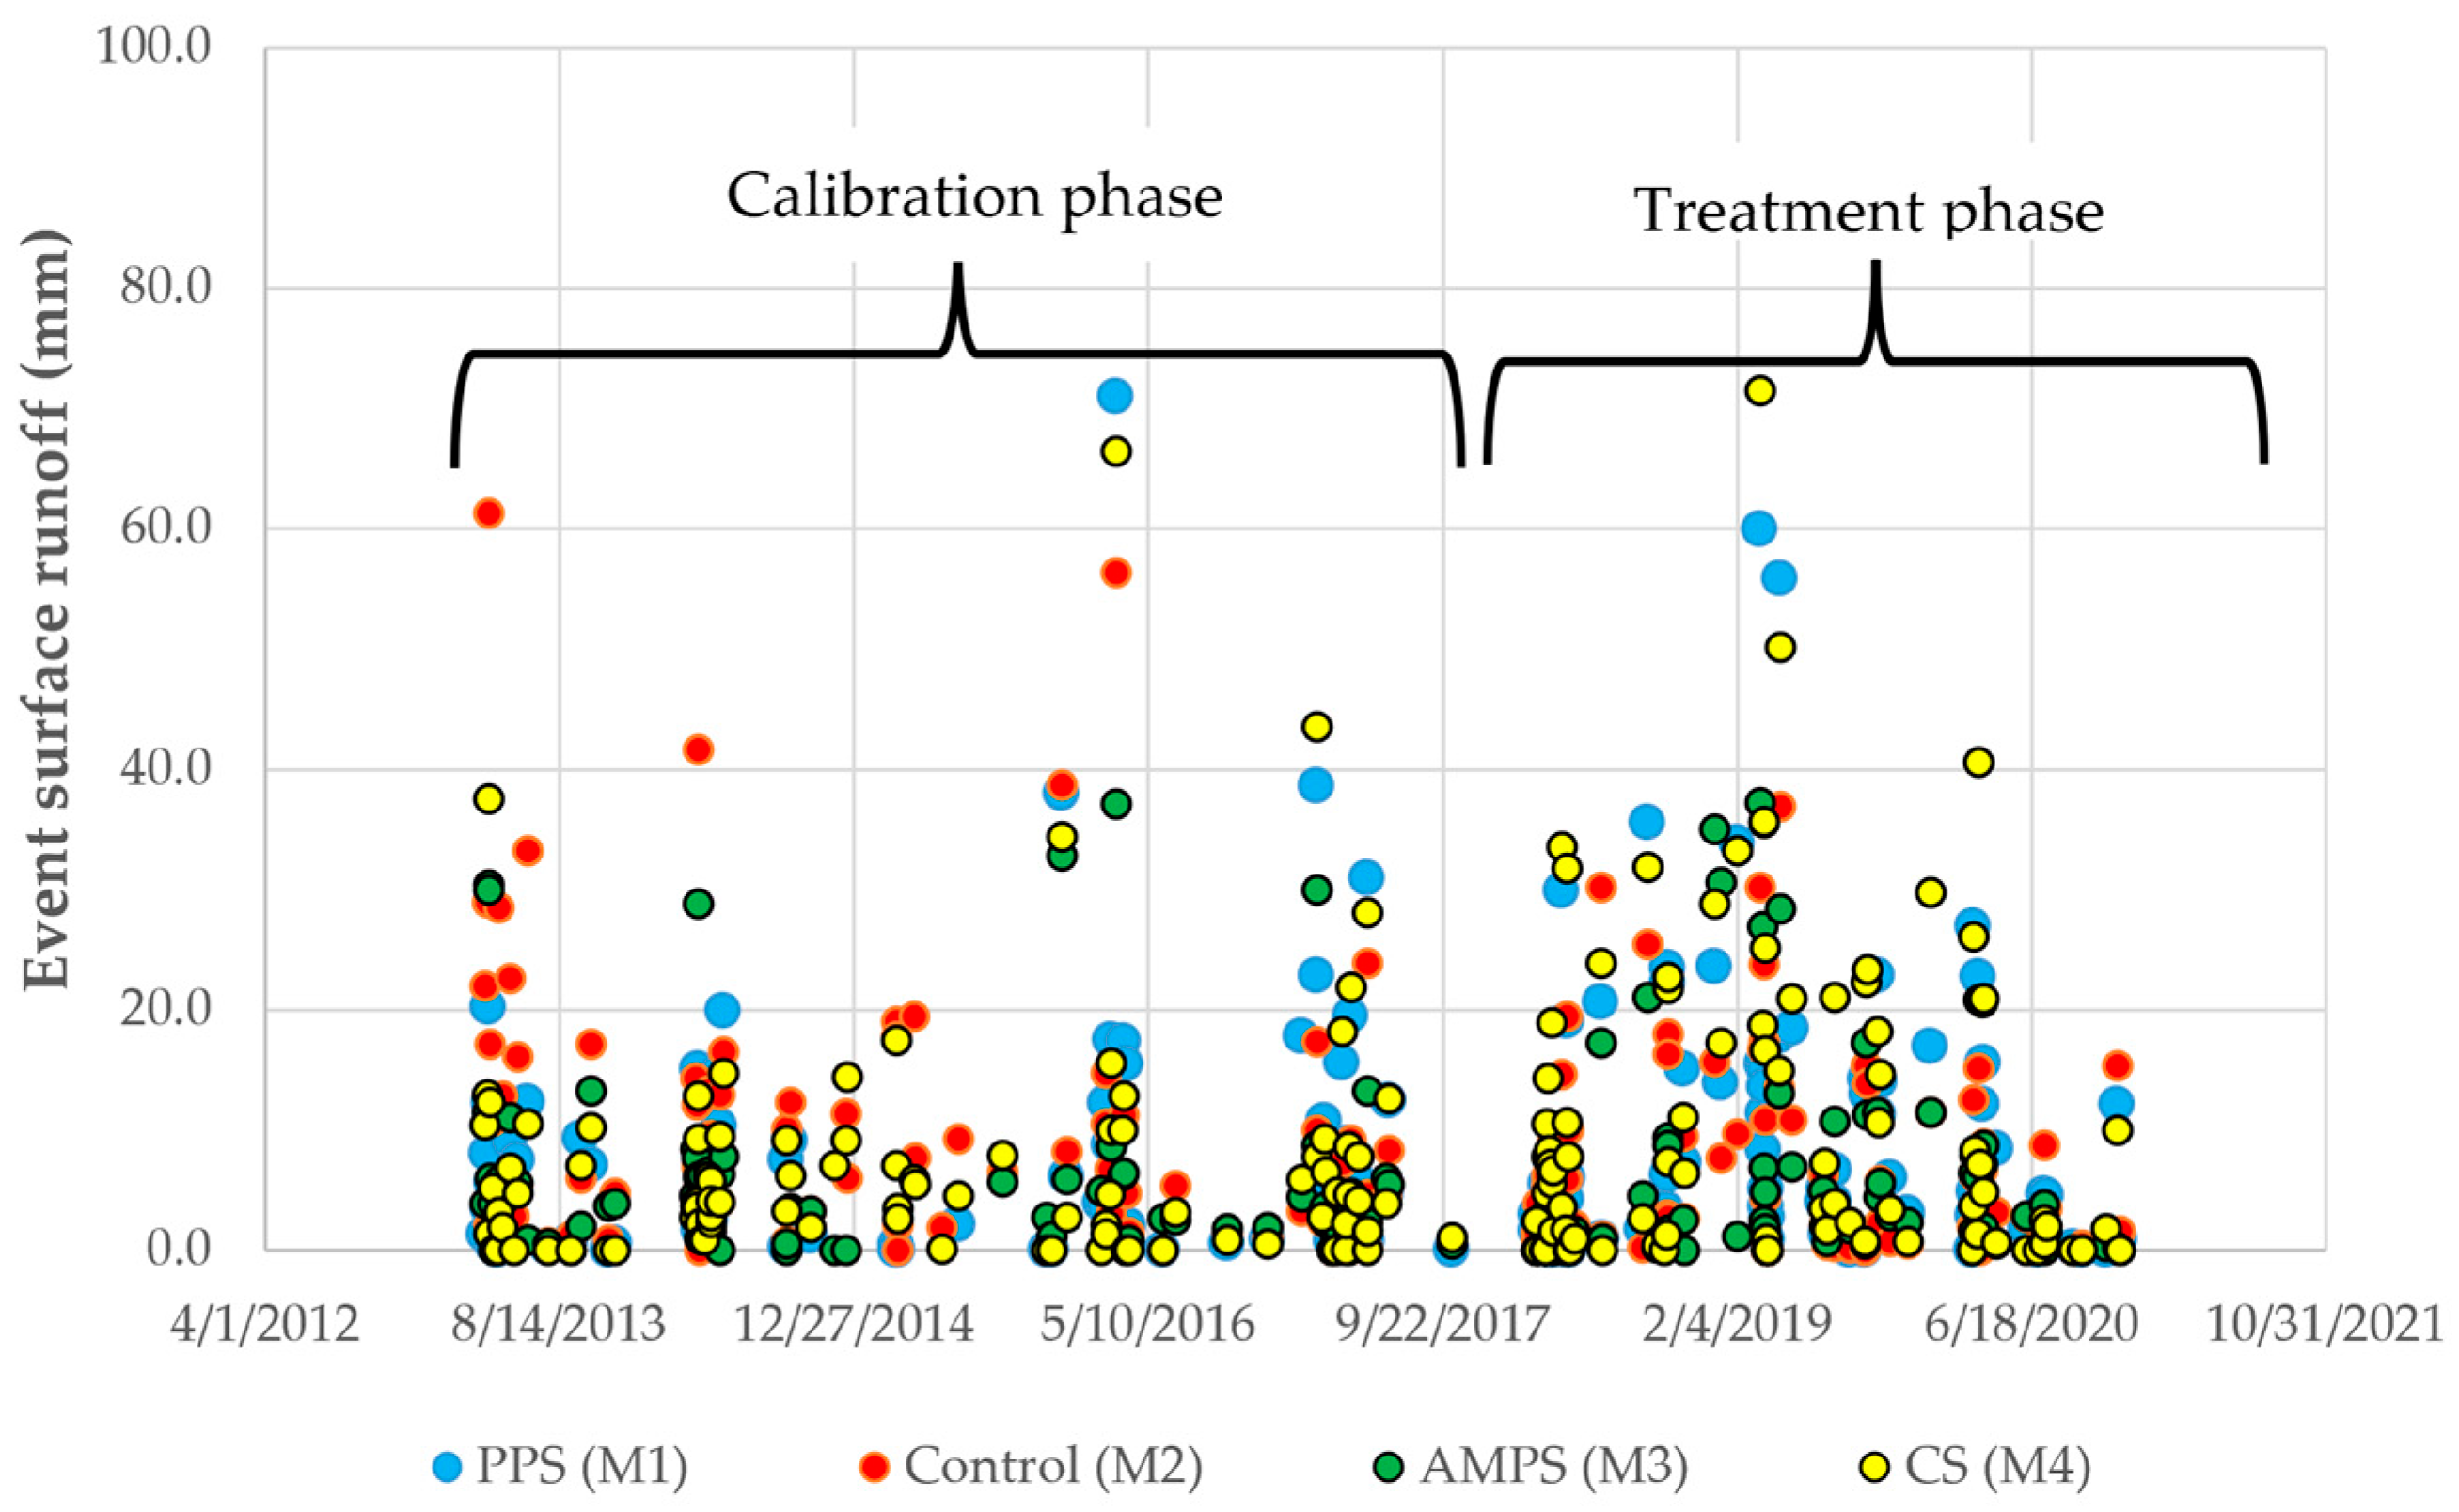
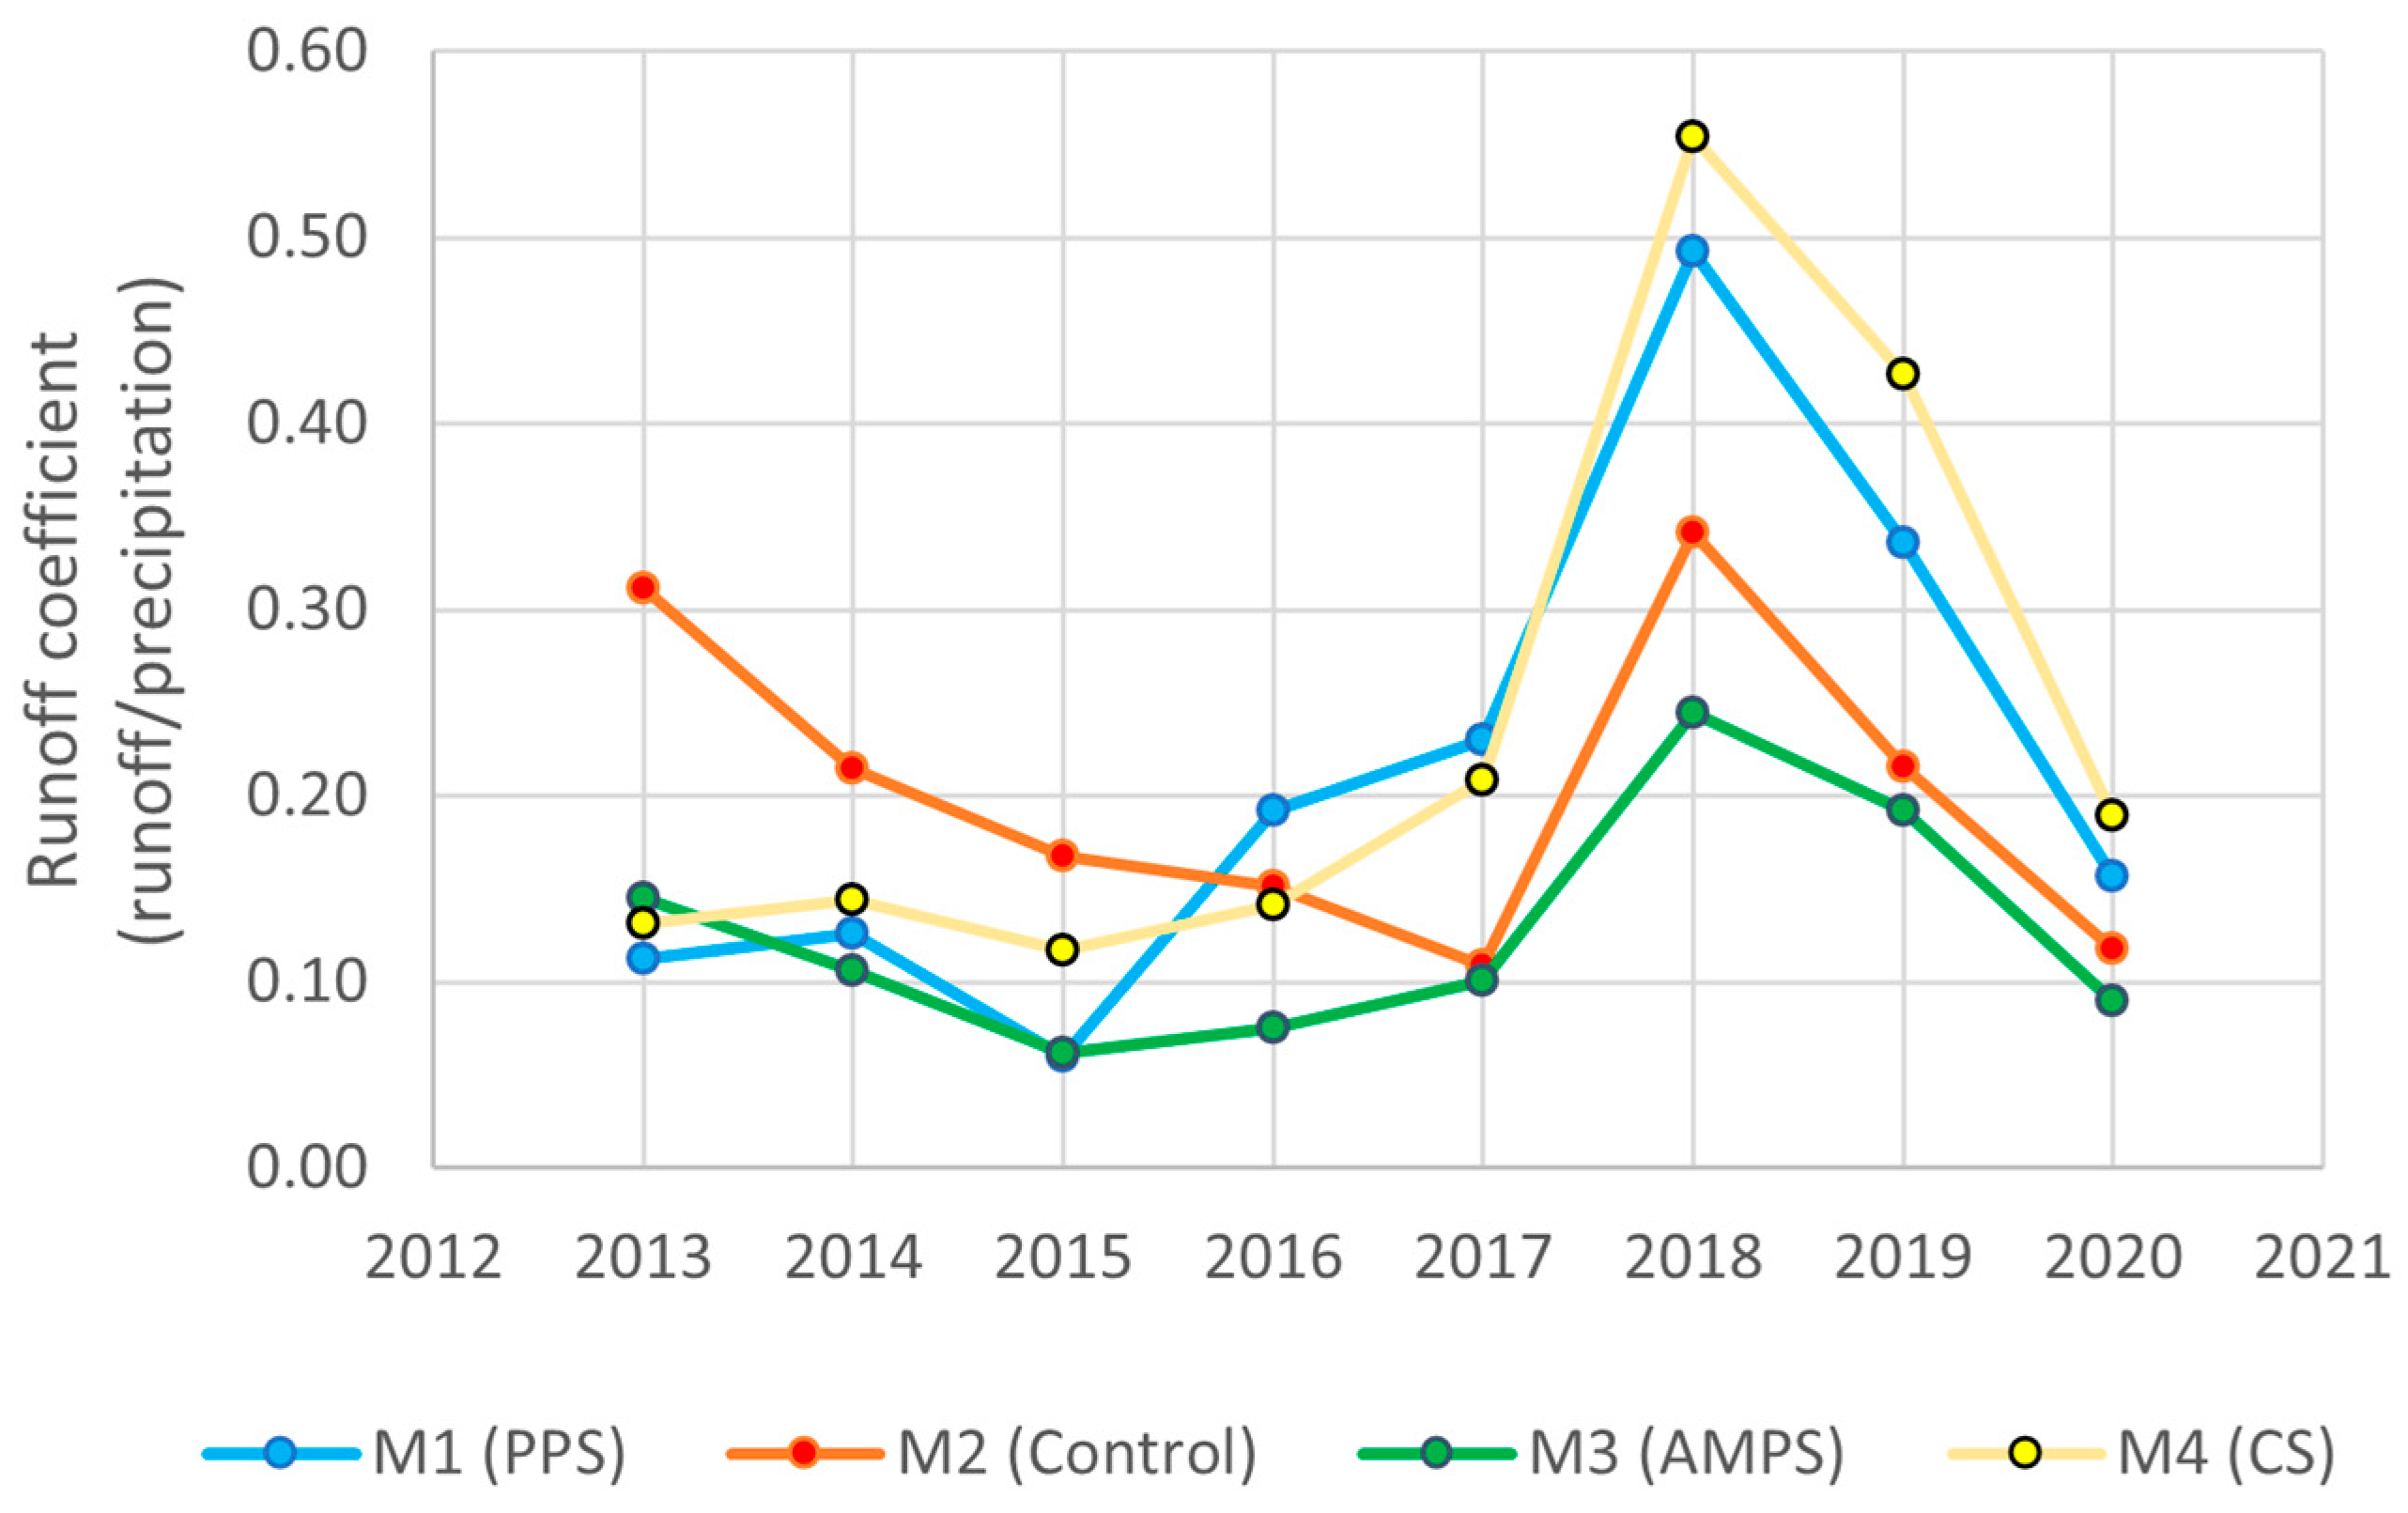
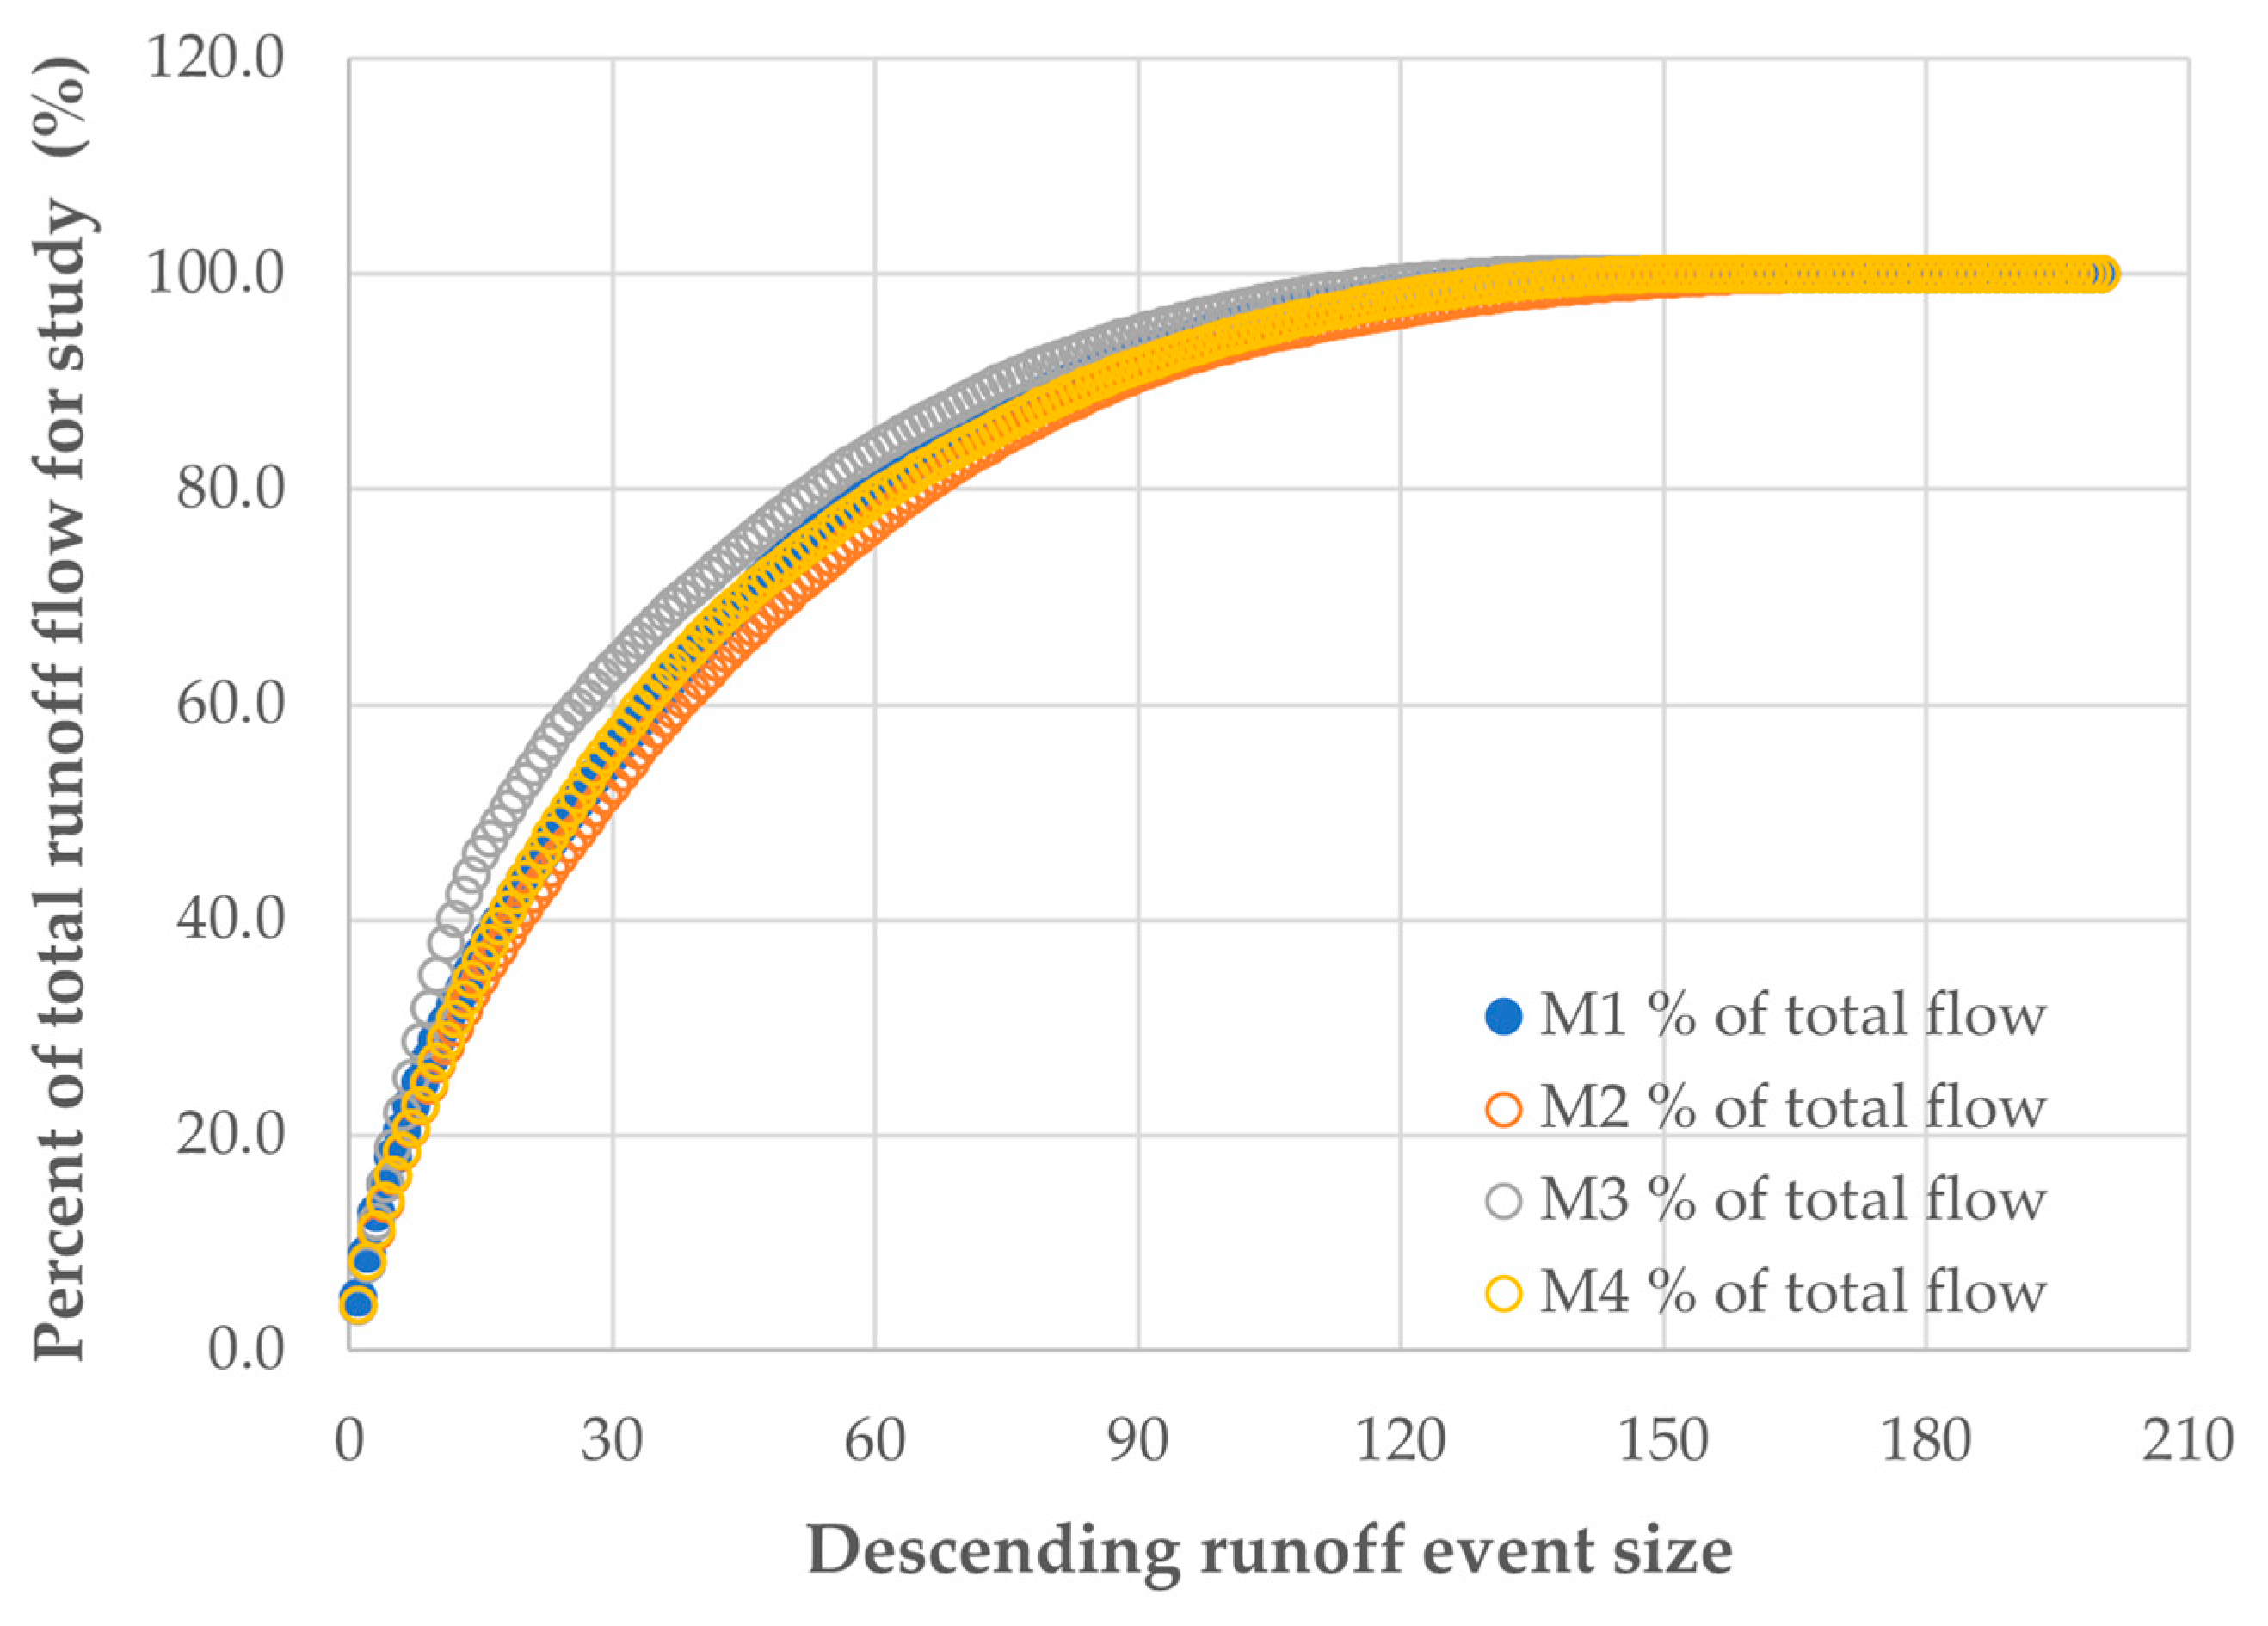
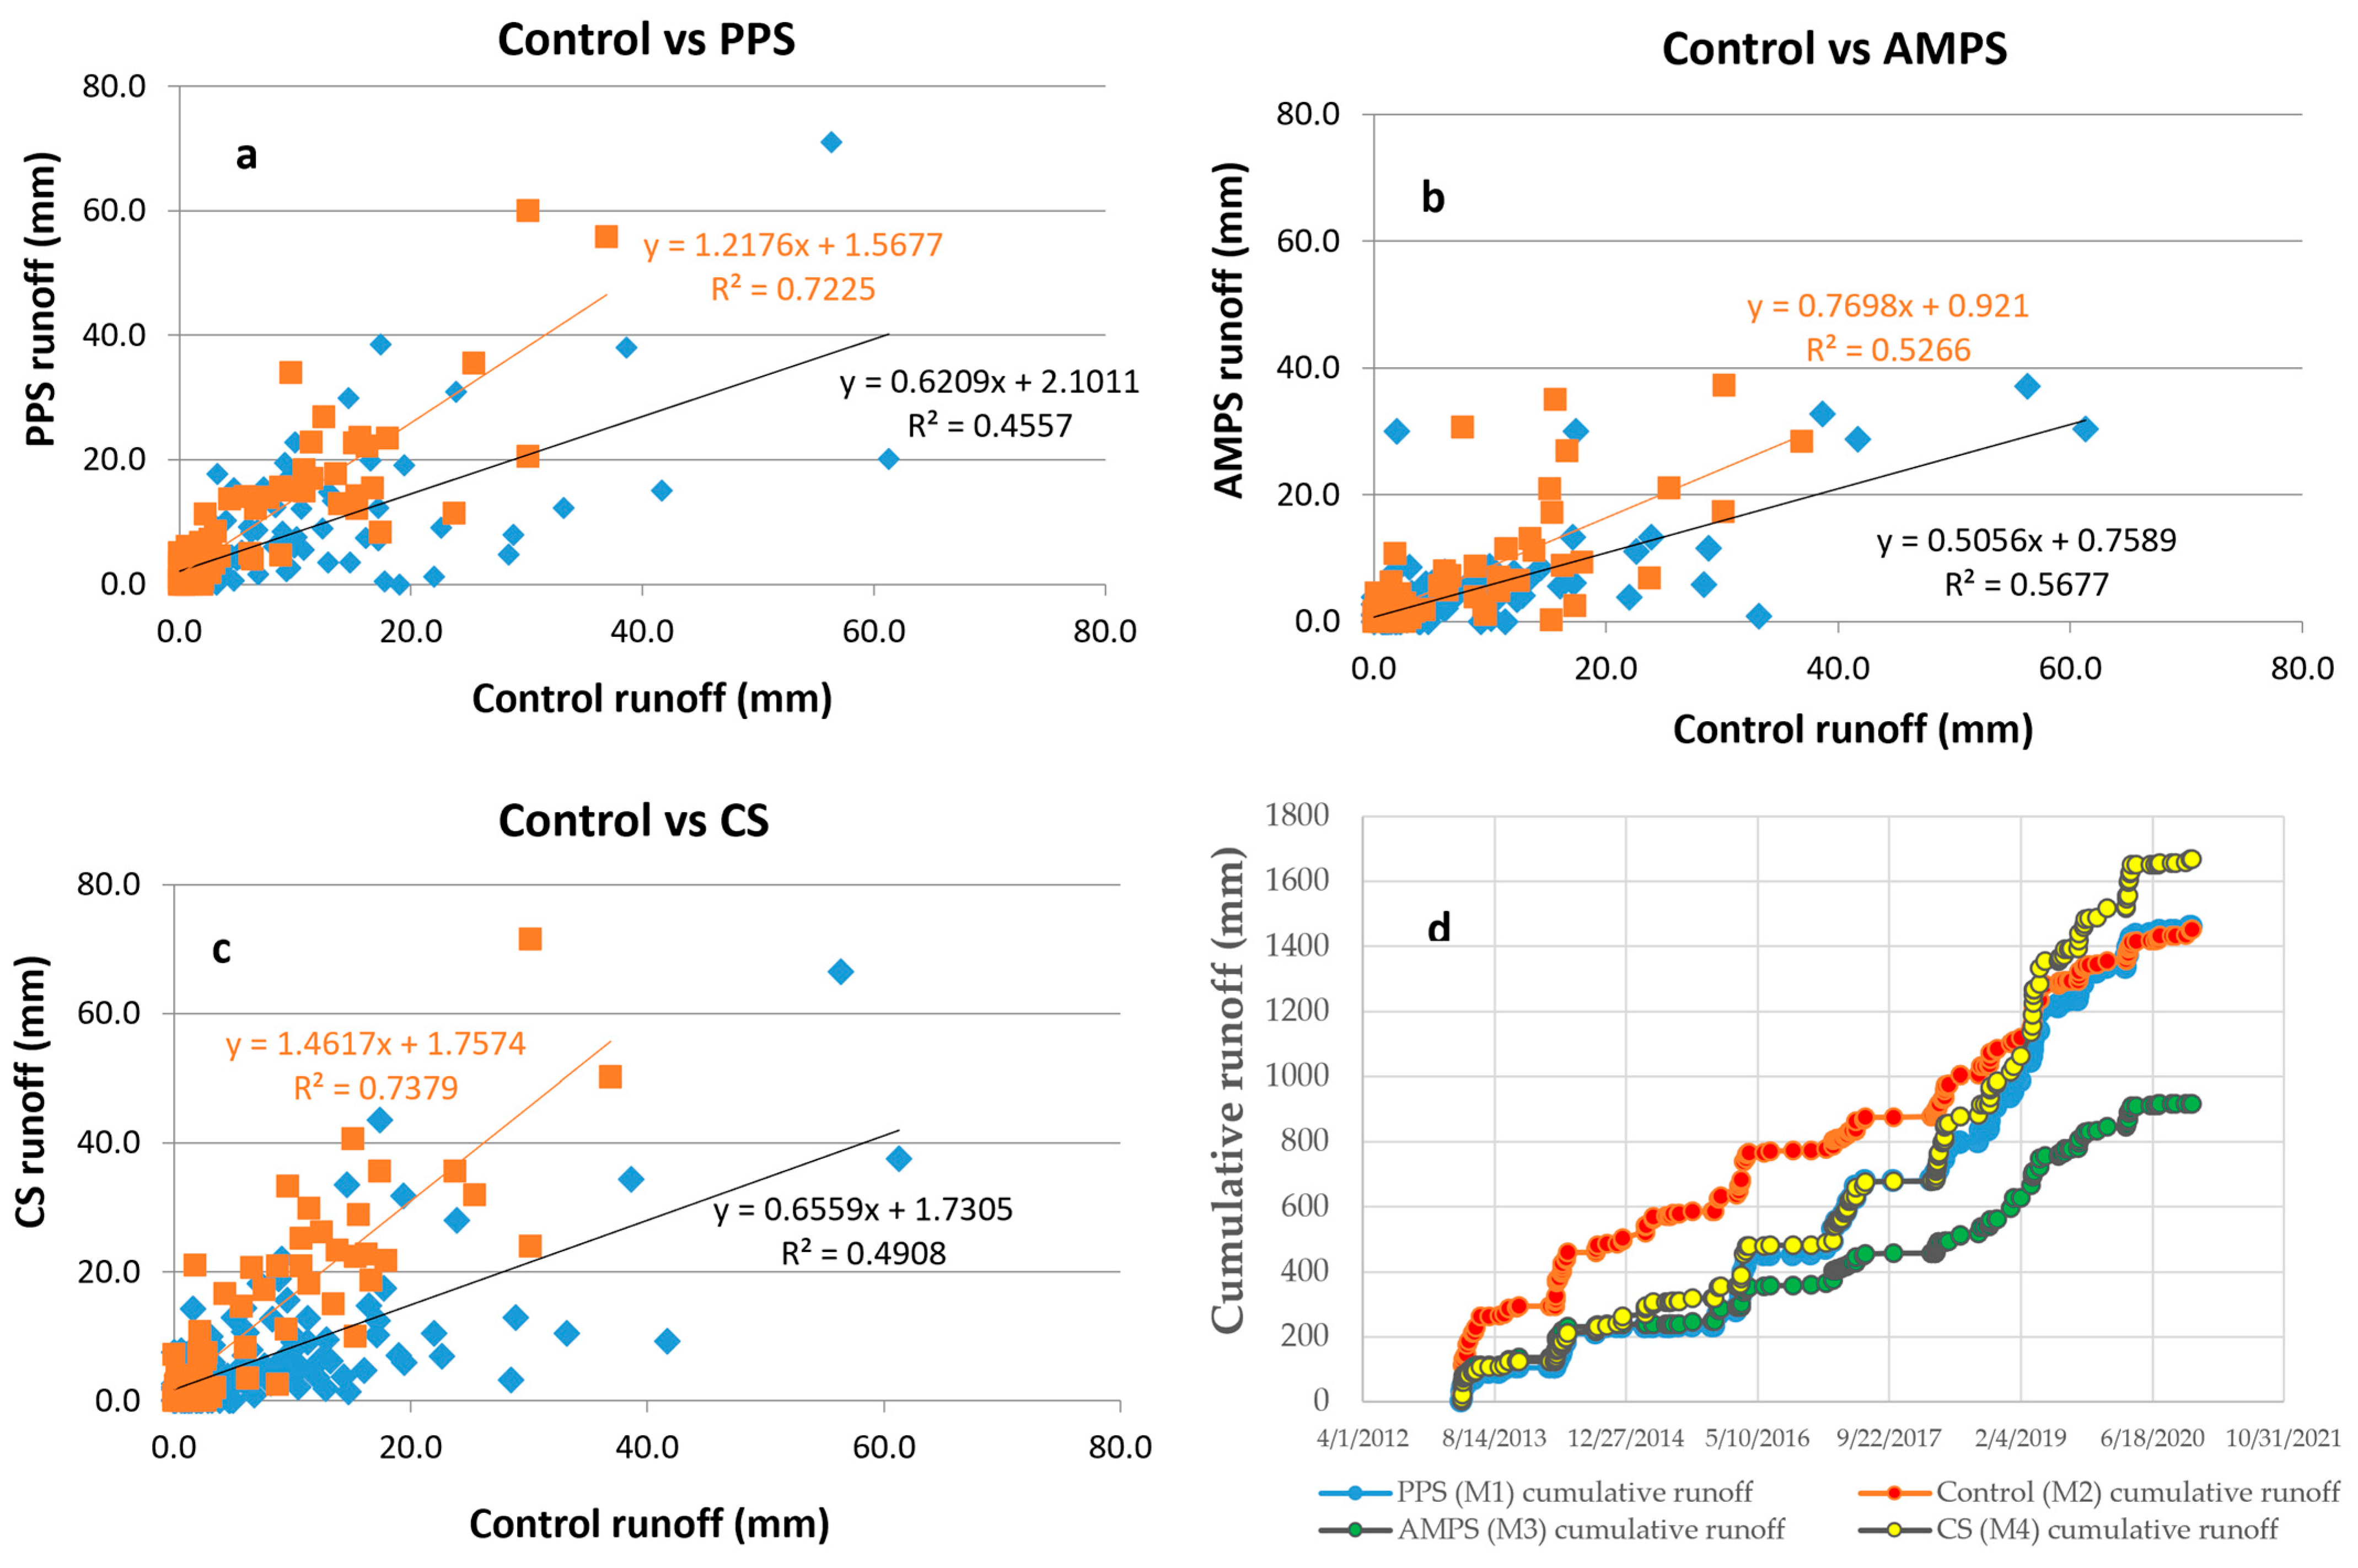
3.3. Surface Runoff Hydrology and Suspended Sediment Loss

Over the combined calibration and treatment periods (spring 2013 to fall 2020), there were 185 runoff events, during which at least one of the four watersheds had a surface runoff sample sufficient to trigger autosamplers. Individual runoff events varied widely depending on season and weather conditions (Figure 3), with mean event surface runoff across the watersheds ranging from 5.6 to 9.0 mm. There were several large runoff events associated with snowmelt events, particularly in spring 2019. Peak flow rates were generally associated with snowmelt and non-growing season events, when conditions favored greater runoff proportions from less evapotranspiration and high antecedent soil moisture [46,47].
Annual runoff coefficients (annual runoff/annual precipitation) varied over the study, sharply increasing across watersheds in 2018 (Figure 4). Runoff coefficients vary depending on soil drainage, management, and seasonal factors such as soil freezing and snowmelt [46,47,48]. Vandegrift and Stefan [48] showed that runoff coefficients across the state of Minnesota, USA, varied widely depending on soil properties, ranging from 0.40 in the northeast to <0.1 in the northwest. Slope and other site and soil physical properties, including soil texture and pore size distribution, can influence both seasonal and longer-term surface runoff coefficients at the field and watershed scales [12,14,15,17,18,46,47]. Since grazing treatments were initiated in June 2018, it is possible that treading and soil compaction by livestock contributed to larger runoff coefficients in 2018, particularly since the majority of precipitation and runoff occurred from June to December of that year (Figure 4). Grazing livestock can cause compaction and a reduction in infiltration, particularly when soils are wet and vulnerable to compaction and pugging [17,18,21].
Average event runoff also indicated that grazing significantly increased mean runoff compared to the control hay field, but this depended on the grazing system treatment. Average event runoff for CS and PPS were 1.7- and 1.4-fold greater than the control (Table 1, Figure 5). In Table 1 and subsequent tables, the first p-value (p1) tests if calibration versus treatment means differ (i.e., hay vs. grazing) for that variable; the second p-value (p2) tests if that variable differs from the control. The other p-values test for equal slopes and intercepts for calibration/treatment regression equations (p3 and p4). There was no difference in average event runoff between the control and AMPS (Table 1).
The landscape position/slope of field M3 (AMPS treatment) creates a swale/draw where surface runoff collects (as slope flattens out), effectively reducing runoff and runoff coefficients during infiltration and excess overland flow events compared to the other fields. This may partially account for the lack of a significant difference between AMPS and average runoff for the control (Table 1).
In contrast to runoff trends, grazing slightly decreased average event suspended sediment concentrations (SS) but had little impact on average event SS loads (Table 1). Three-year cumulative SS loads were similar among the control, PPS, and CS (250, 219, and 276 kg ha−1, respectively) whereas AMPS/M3 had much lower cumulative SS loads over the study (80 kg ha−1). Since cumulative runoff was 1.6- to 1.8-fold lower for M3/AMPS, it follows that cumulative SS loads would be proportionally lower (Table 1). As mentioned, surface runoff from watershed M3 is influenced by a shallow field draw where the slope flattens and water collects for larger runoff events. We hypothesize that this process could have slowed runoff water velocity, contributing to less overall flow leaving the field and lower cumulative SS load compared to the control.
Compared to annual crop systems with tillage, SS concentrations and loads reported here are very low. Using the same watersheds in a corn phase of the rotation, Sherman et al. [32] reported cumulative SS loads ranging from 4 to >11 Mg of SS over a 6 year study, with annual loading rates of 0.9 to 1.7 Mg ha−1 year−1; this represents an annual SS load increase of 42 to 50 times compared to the low erosion rates measured in the present study under hay/pasture (0.01 to 0.05 Mg ha−1 year−1), demonstrating the large reduction in erosion with perennial systems.
Wepking et al. [7] found that grasslands reduced nitrate leaching and P loss by 90 and 88%, respectively, using simulation models to compare ecosystem function tradeoffs among corn, corn–soybean, and grassland cropping systems from the Upper Midwest, supporting the large reduction in N and P loss we found when transitioning the paired watersheds in our study from corn to perennial grass hay and pastures. While establishing grasslands can contribute to important ecosystem services including potential water quality benefits, improvements can take decades to manifest after implementation at the watershed scale [8].
In our study, grazing vs. hay crop production influenced runoff hydrology and SS transport. Similar to other studies, our results indicated grazing increased average runoff amounts compared to no grazing/hay crop production. Moreover, CS significantly increased average event runoff over the control, with the largest overall quantity of runoff associated with the CS system over the study period. Elliot et al. [21] showed that livestock treading damage led to greater SS loss in New Zealand pastures from a decrease in hydraulic conductivity and proportional increases in runoff and SS loads. We hypothesize a similar mechanism occurred in our study, with larger runoff from CS. Lyons et al. [30] reported that continuous riparian grazing had greater SS transport to stream channels compared to riparian sites with rotational stocking. Sanjari et al. [14] also showed lower SS loss for time-controlled grazing (similar to rotational stocking) compared to continuous stocking in an Australian catchment-scale study. Collectively, these studies support our findings that CS increased runoff compared to rotational stocking (PPS and AMPS). Our results also showed that grazing decreased SS concentrations in general compared to the control, however these differences were small in comparison to the larger runoff induced by CS and PPS and therefore had little impact on SS loads.

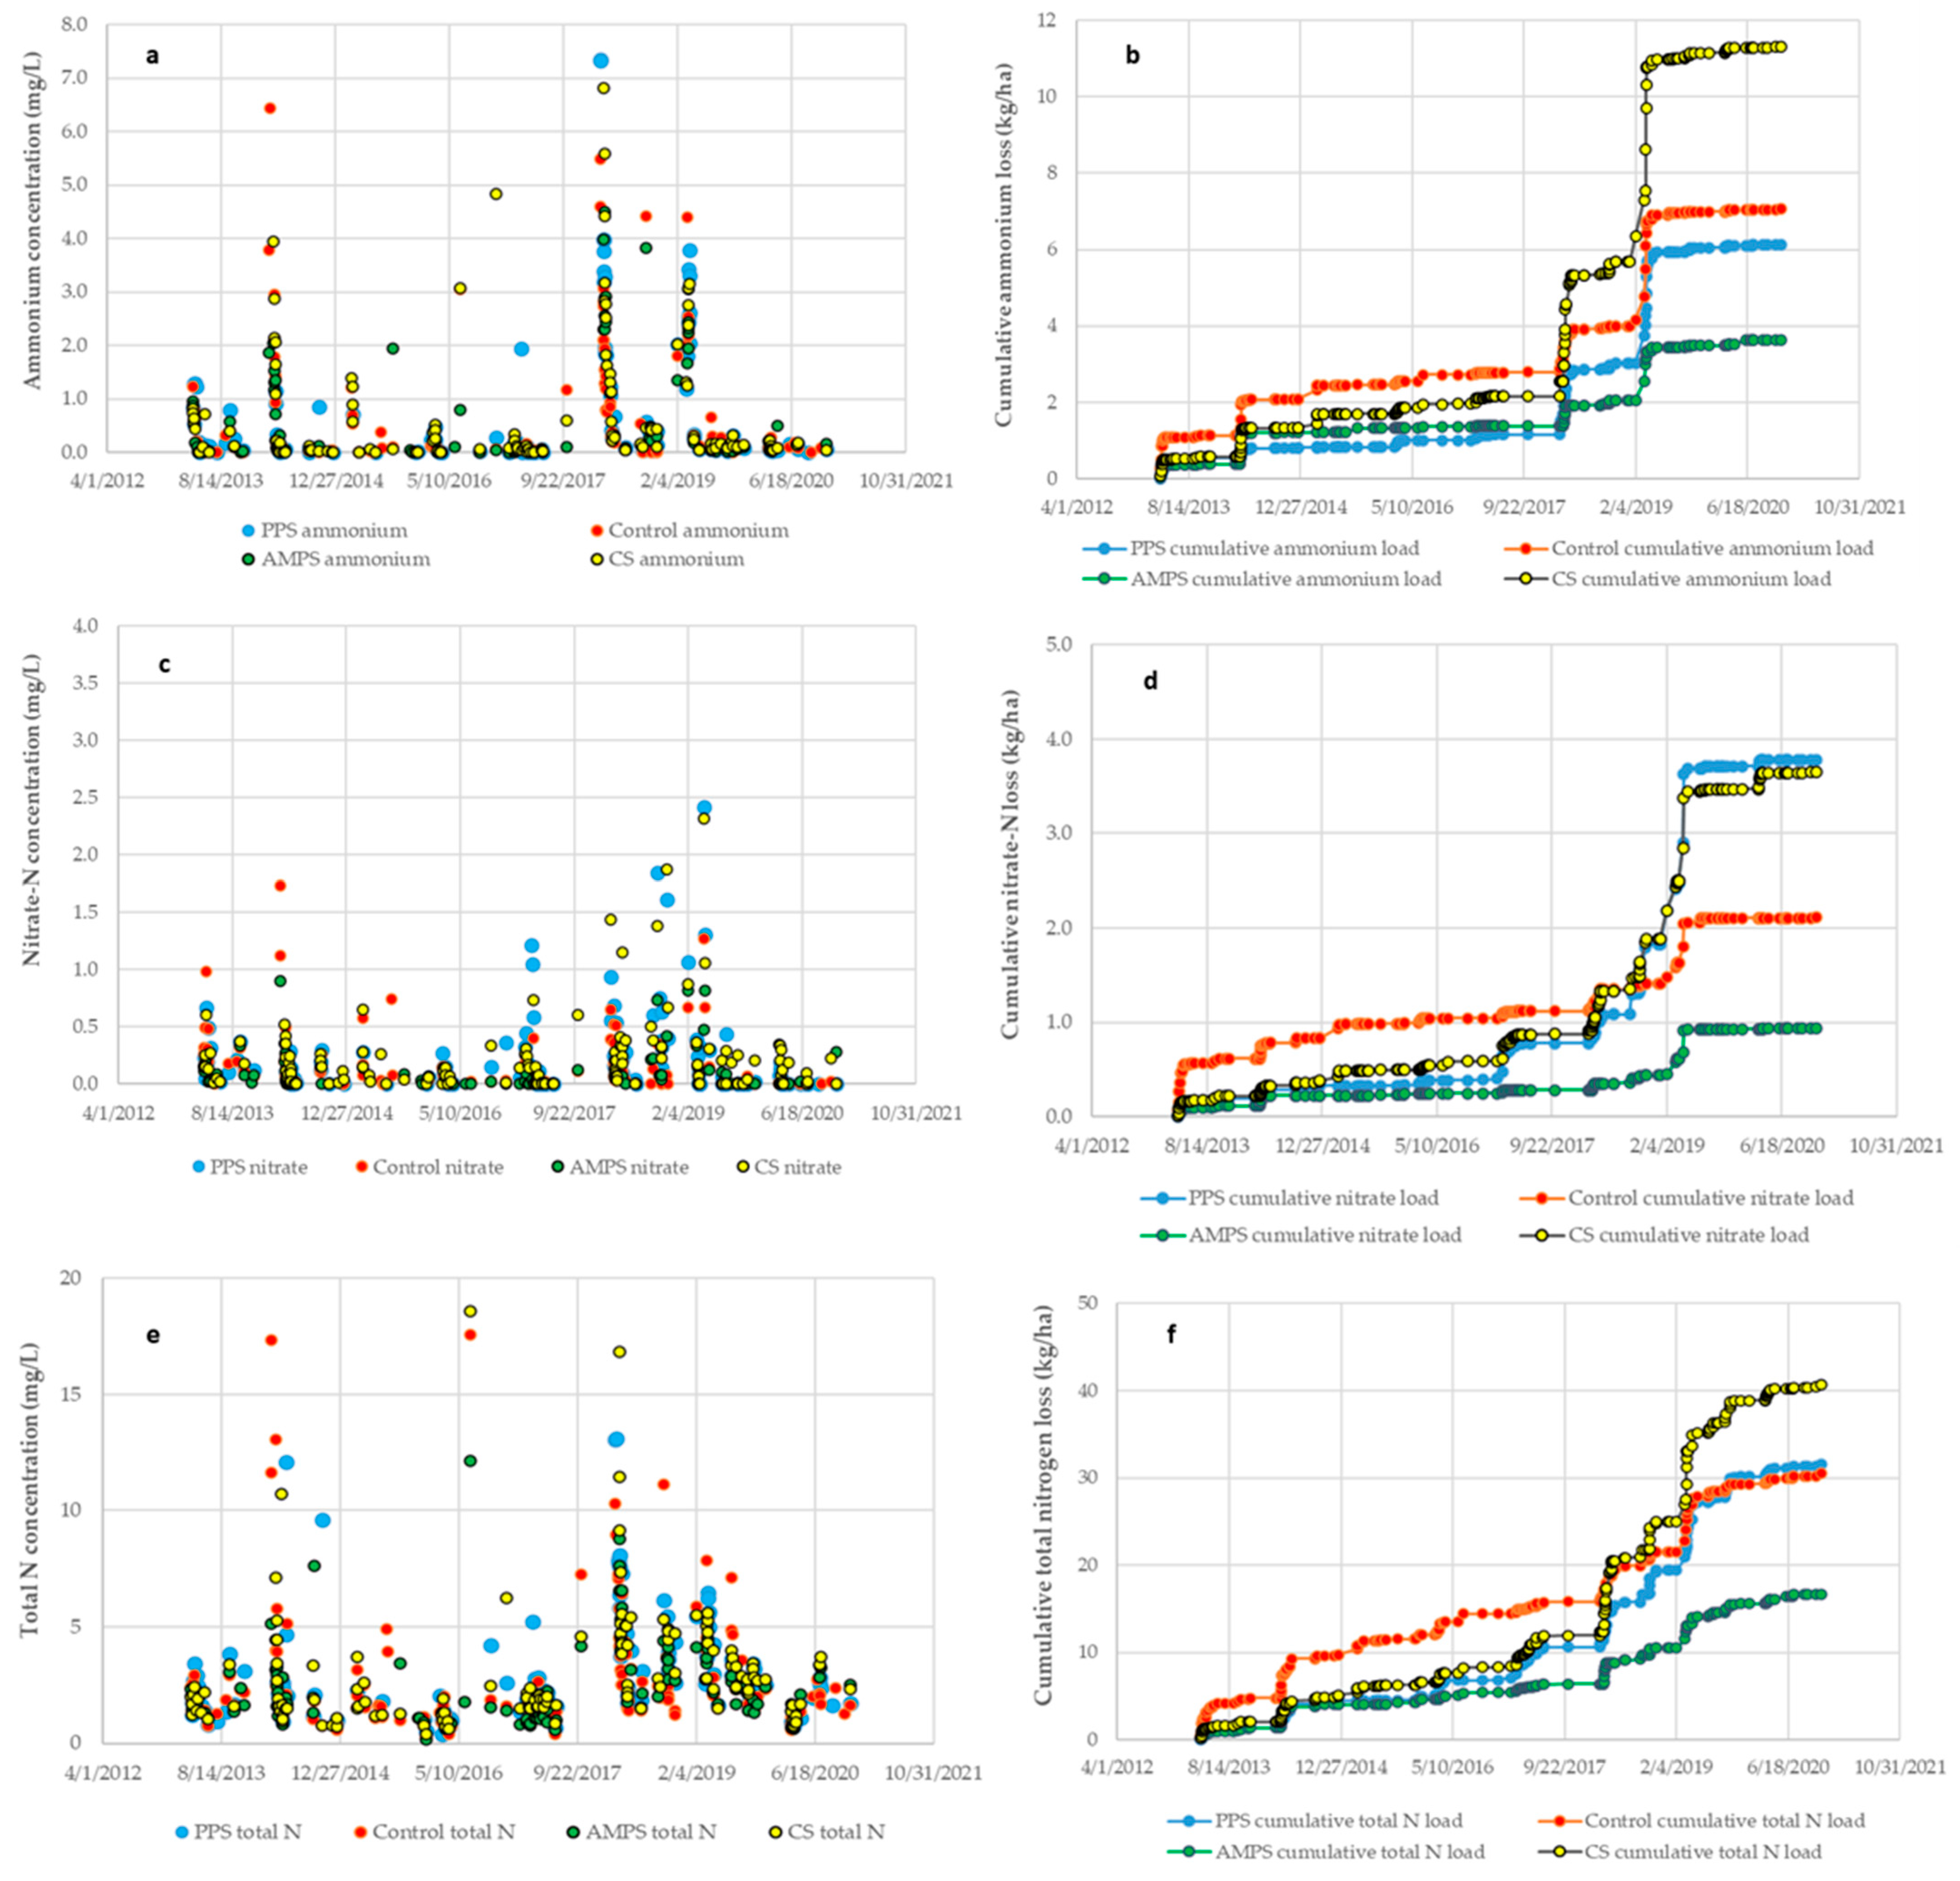
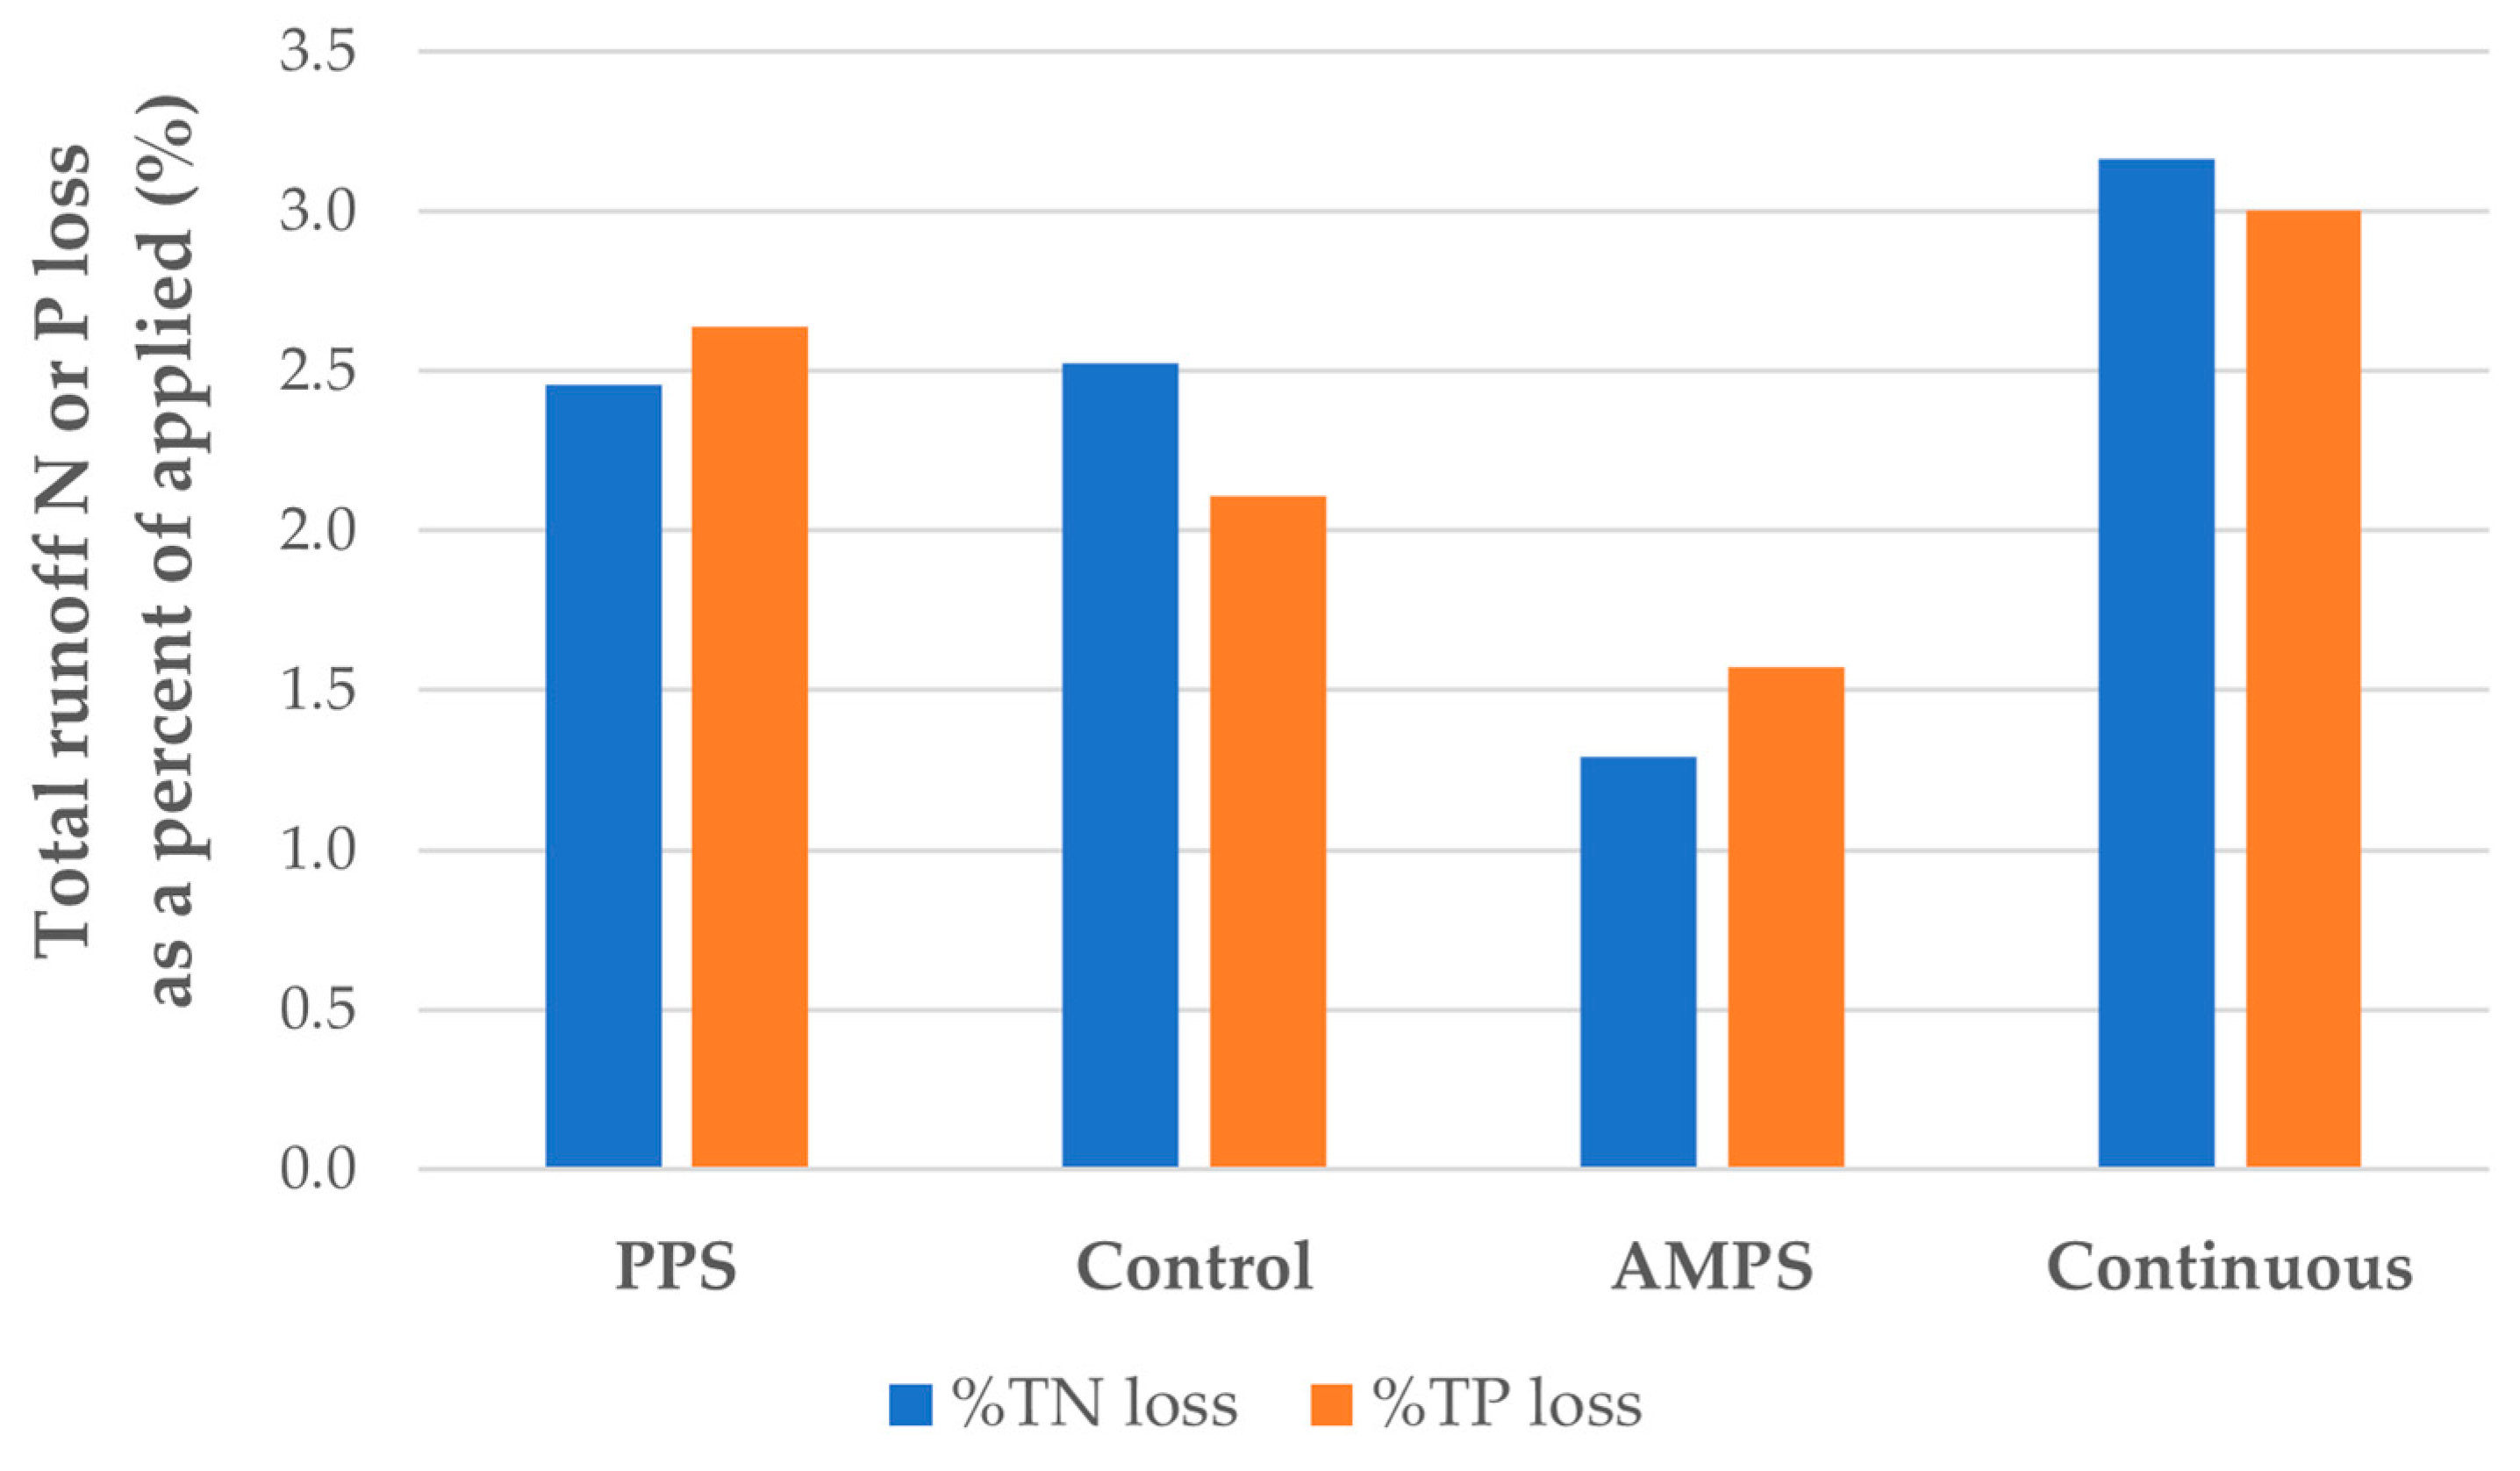
3.4. Nitrogen Concentrations and Loads

Concentrations of ammonium-N ranged from below detection limits to >7 mg L−1 over the study (Figure 6). Stocking treatments consistently decreased mean event load ammonium-N concentrations compared to the control hay field, though significance was only detected for slopes and intercepts not for mean values (Table 2). The CS system had from 1.7 to 3.3 times greater ammonium-N loads compared to PPS, AMPS, and was significantly greater than the control (Table 2) and also had the largest cumulative ammonium-N loss (Figure 6).
Nitrate-N concentrations in surface runoff were low; however, grazing significantly increased concentrations compared to the control (Table 2). Several of the regression equations for calibrations and treatment were not significant between control and grazing watersheds for nitrate-N concentrations/loads (probably related to the relatively narrow range of concentrations compared to other constituents). Notwithstanding, CS had higher event mean nitrate-N concentrations than the control and similar cumulative nitrate-N loads lost in surface runoff over the study (Figure 6).
Interestingly, event mean total N concentrations did not change much between calibration and treatment; however, CS had significantly greater total N concentration compared to the control and greater event mean total N load (Table 3). While not statistically comparable, CS had larger cumulative TN loss than other treatments (Figure 6), PPS and the control lost similar amounts, and AMPS lost 1.8- to 2.5-fold less total N than other treatments.
While a substantial amount of lost N was inorganic (i.e., ammonium-N + nitrate-N) and bioavailable, the majority of N was organic. Approximately 69% of the total N mass lost was organic N and thus would require microbial oxidation to inorganic N to be bioavailable. Other studies have shown a similar preponderance of organic-N in surface runoff compared to inorganic N in cold-climate dairy cropping systems [23,32,49,50]. Ammonium-N was still a substantial fraction of runoff N losses (31%) and considered a water quality risk [51]. However, our sites were relatively isolated from surface water bodies and mainly contributed runoff to adjoining grassed swales and seasonal surface water ditches. Nitrate-N concentrations were expected to be low since it is more prone to leaching and subsurface losses compared to ammonium- and organic-N [52].
Our results highlight interactions between stocking method and pasture hydrology in regulating surface runoff losses of N. Most studies addressing aqueous N loss focus on subsoil leaching [10], with few evaluating N runoff from pastures, making N runoff losses difficult to contextualize. Our N loss estimates were higher than those of Vadas et al. [23], who reported average annual TN loss rates of <2.9 kg ha−1 from southwest Wisconsin pastures. In our study, greater CS runoff amounts led to larger cumulative N losses, but impacts were less clear for the other treatments. Minor total N concentration changes between calibration and treatment phases indicated similar impacts on total N concentrations across all runoff events/seasons for grazing and hay systems. Total N losses for the control were similar to PPS, suggesting these two systems were comparable in terms of overall N transport and loss.
In contrast, AMPS had substantially lower N loss than other treatments, likely driven by lower runoff related to the field’s hydrology. Notwithstanding this lower intrinsic runoff potential (which was accounted for in the paired watershed analysis), AMPS itself may have indirectly contributed to lower N losses through less treading-related damage and maintaining infiltration capacity. Livestock were rotated more frequently for AMPS than PPS or CS and less cumulative soil compaction from treading was expected, as would less compaction-related reductions in hydraulic conductivity or loss of infiltrability. Several authors have noted less overall soil and plant damage from grazing under rotational compared to continuous stocking [3,14,15,16,17,18,21,22,24,28,30,53]. Pasture biomass data (Figure S1, Supplemental) also indicated AMPS maintained higher pasture forage mass, further suggesting this system caused less plant damage from overgrazing and maintained higher overall plant N demand. Maintaining adequate plant biomass is important for maintaining livestock nutritional needs, in addition to reducing erosion and SS loss potential [3,14,17,21,28,30].

3.5. Phosphorus Concentrations and Loads

Total P concentrations ranged from <0.1 mg L−1 to over 7 mg L−1, with dissolved reactive P (DRP) concentrations from <0.05 mg L−1 to nearly 6 mg L−1 (Figure 7). The PPS and CS systems had significantly lower event mean runoff total P concentrations for the treatment period (Table 3) but only PPS was significantly lower than the control for the treatment period. Beyond this difference, total P concentrations were similar, suggesting hay crop production and grazing generated comparable P concentrations. In contrast, event mean DRP concentrations decreased significantly from the calibration to treatment phases for PPS and CS, indicating grazing reduced concentrations compared to the control/hay crop. The three grazing systems also had significantly lower event mean DRP concentrations than the control, suggesting grazing posed no greater water quality risk than broadcasting manure after hay cuttings with respect to DRP concentrations. However, there were no differences in DRP loads among watersheds. The higher average runoff nutrient concentrations for the control compared to the grazing systems in our study may also be related to the higher annual N and P inputs from liquid dairy manure applied after cuttings compared to grazing (Figure 2). Additionally, the distribution of grazing livestock N and P excretion across the field is much more heterogenous in comparison to the relative uniformity of applying liquid dairy manure to the hay field/control.
Event mean total P concentrations in runoff from the paired watershed analysis were high for the calibration and treatment (from 0.85 to 1.7 mg L−1) and likely skewed by runoff events with very high TP/DRP concentrations. Because of this, flow-weighted mean total P/DRP concentrations were also computed to account for flow variation and episodic spikes in P concentrations across the monitoring period. Compared to the regression-based means, flow-weighted mean total P (0.185 to 0.213 mg L−1) and DRP (0.152 to 0.165 mg P L−1) concentrations were lower.
Flow-weighted mean concentrations were still relatively high when considered from a runoff nutrient water quality perspective. Moreover, most of this was bioavailable as DRP (80% on mass loss basis), likely related to the relatively high background soil P concentrations (on average 21 mg kg−1 Bray 1 P) in combination with P contributions from manure and plant litter during runoff events. An acceptability threshold of 0.1 mg total P L−1 is often used for runoff water contributing to surface and groundwaters. Despite the relatively high DRP concentrations in runoff, agronomic guidelines still recommend additional P for the pastures in our study, ranging from 11 to 39 kg P2O5 ha−1 based on projected forage mass [35], suggesting additional research is warranted to better determine site-specific pasture P needs in relation to yield goals and potential runoff water quality concerns.
Most runoff total P in our study (80% based on runoff-P mass loss) was in dissolved reactive form (i.e., orthophosphate) and immediately bioavailable, which contrasts with runoff from annual crops where particulate P (P bound to mineral soil particles/SS) is typically a larger fraction of total P [12,23,25,29,31,32]. Runoff from pastures generally has lower SS loss compared to annual crops; however, DRP losses from pastures can be high depending on available soil P, erosion/slope, hydrology, and grazing management techniques [12,13,17,18,23]. In southwest Wisconsin, a calibrated annual P loss model estimated that 45% of annual runoff P loss from pastures was from particulate P from eroded SS, 30% from livestock manure, 15% from labile soil P, and 10% from fertilizer phosphate [23]. Annual average total P loss was <1 kg P ha−1 and similar to annual losses for the AMPS system in our study, but lower than the total P loss rates for CS, PPS, and the control where losses exceeded >1 kg P ha year−1 (Figure 7). We hypothesize that both manure from livestock and inorganic P desorption from soil surfaces were important sources of dissolved P measured in runoff water.
Additionally, relative P and N use efficiency (nutrients applied/nutrients lost in runoff) for each watershed treatment were estimated for the treatment phase and showed low runoff loss as a percentage of total P applied from manure and fertilizer (Figure 8). These estimates are meant to provide context for relative nutrient use efficiency and do not compensate for measured runoff water quality results. However, it is also important to understand the magnitude of nutrient loss in runoff relative to crop nutrient needs. Both P and N use efficiency were highest for AMPS and lowest for CS, which support the runoff results in that greater cumulative N and P losses came from CS compared to other systems with the same nutrient inputs.
In summary, stocking method had more of an effect on DRP than TP, with significantly greater DRP losses from CS compared to the control. Other studies reported larger nutrient and P losses for continuous versus no grazing or rotational stocking, attributing greater losses to more manure inputs from livestock per unit pasture area/time in addition to soil and pasture forage degradation from treading damage [12,13,14,15,16,17,18,19,20,21,22]. Our results are supported by Schepers et al. [13], who reported that the density of grazing livestock was directly related to increases in runoff total P, ammonium-N, and total N in runoff from beef pastures in Nebraska, USA. While stocking method influenced DRP concentrations and losses in our study, other factors can also be important for runoff P loss risk.
Several studies note the importance of soil fertility and plant-available soil P levels on P losses from pastures. In some cases, soil P levels can have an overriding influence on runoff P losses from pastures in relation to other factors [25,26,27]. Once soil P exceeds optimum levels and further increases to high and excessive agronomic levels, there is a much greater chance of P transferring from soil to runoff water independent of grazing management practices [23,25,26,27,54]. It also takes decades for soil P levels to decrease, even in fields where crops are harvested without further P additions. Dougherty et al. [25] concluded that the most important practice for minimizing runoff P from pastures in New South Wales was maintaining soil P at or near optimal ranges by applying appropriate P fertilizer/manure application rates.

3.6. Importance of Snowmelt and Non-Growing Season Runoff

Snowmelt and non-growing season runoff events can contribute a substantial proportion of annual surface flows in cold climates [46,47,55,56,57,58,59,60]. To better understand runoff seasonality and determine the months contributing the most to cumulative runoff, the percentage of cumulative runoff flow over the study was plotted as a function of descending event size (Figure 9). It is clear from these curves that large runoff events were the major driver of cumulative runoff flows, with marked consistency among M1, M2, and M4 watersheds (Figure 9). M3 deviated somewhat in response, likely related to its lower runoff coefficient and overall flow, as discussed previously. Based on this analysis, the top 10 largest events accounted for an average of 25.5% of total cumulative runoff flows for the entire study. The top 20 largest runoff events accounted for 45.5% of cumulative runoff averaged across watersheds and after the 50th largest event, 75.4% of cumulative average runoff flows were accounted for, demonstrating the power of large events in regulating surface runoff, and associated nutrient loss risk.
Runoff flow contributions by month were also estimated for the top 20 largest runoff events. March and April flows combined accounted for 44.4% of the total flow and 20% of total runoff flows for the entire study, showing the importance of snowmelt and early spring/late winter runoff events to annual surface runoff. Danz et al. [56] monitored streamflow and P loads in eight agricultural Wisconsin watersheds for a 12-year period and found that the largest 10% of the loading events accounted for 73 to 97% of the SS load and 64 to 88% of the total P load. While we did not perform a similar analysis here, these and other studies support our findings on the importance of winter and non-growing season runoff losses for fields or pastures receiving livestock manure or fertilizers.
Depending on landscape position/soil drainage, runoff potential, manure management, proximity to surface water, and other factors, non-growing season P and N losses in cold climates can be a concern [55,56,57,58,59,60]. We identified few studies in general assessing edge-of-field N and P losses from pastures during the winter and the transition period from winter to spring. However, research from annual cropping and hay systems indicates much of the annual nutrient loading in surface runoff at the field and larger watershed scale is associated with spring snowmelt and the non-growing season when antecedent soil moisture is high (i.e., snowmelt events/early spring, fall) [46,47,55,56]. A Wisconsin study used a calibrated P loss model (accounting for snowmelt runoff, manure, and P transport) with 108 site-years of runoff data to show that winter-applied manure could increase P loss potential from 2.5 to 3.6 times compared to non-winter application on the same fields [57]; shifting winter applied manure to other fields less prone to runoff reduced P loss from 3.4- to 7.5-fold. While this was an annual cropping system, it demonstrates the need for agronomic and edge-of-field best management practices targeting a reduction in winter nutrient runoff losses during the non-growing season, such as cover crops, buffers, and P removal systems [46].
Our results confirmed much lower N and P losses in surface runoff from grazed pastures and hay compared to the same watershed under corn production. Stocking management influenced both nutrient loss and pasture productivity. While SS and particulate N and P losses were low compared to annual cropping systems, flow-weighted mean dissolved P concentrations were still above water quality thresholds for eutrophication. Future research should assess potential sediment and nutrient losses from perennial forage agroecosystems and evaluate the efficacy of nutrient and water quality models to predict N and P losses in surface runoff from pastures.

4. Conclusions

We evaluated runoff water quality and nutrient loss between a hayfield receiving manure after cuttings (control) and three pastures with similar forage species under three different grazing/stocking management systems (AMPS, CS, and PPS) varying in the degree of livestock rotation. Compared to the control, grazing treatments increased average event runoff volume by as much as 1.7-fold. Grazing tended to decrease event mean sediment total N and total P concentrations compared to the control field; however, differences depended on stocking method. Our results indicate that CS increased runoff significantly compared to the control, suggesting that giving livestock unrestricted access to pasture increased soil disturbance from greater treading damage, likely decreasing infiltration during runoff events leading to greater surface runoff compared to the control hay field condition. In addition to greater runoff, CS had larger mean sediment, total N and total P loads compared to the control. Importantly, CS also had the lowest average pasture forage mass of the systems, likely related to overgrazing. AMPS had lower N and P loss as a percentage of that applied from manure application/livestock excretion (1.3 and 1.6%, respectively) compared to the control (2.5 and 2.1%), PPS (2.5 and 2.6%), and CS (3.2 and 3.0%). Overall, the results indicate that the water quality impacts of grazing pastures differed from hay crop production and that the type of grazing system implemented influenced runoff-associated increases from grazing compared to hay crop production. Our results also highlight the need for water quality models to account for nutrient loss from pastures and pasture management.

Supplementary Materials

The following supporting information can be downloaded at: https://www.mdpi.com/article/10.3390/nitrogen4040025/s1, Figure S1. Average pasture forage yields for AMPS, PPS, and CS grazing systems for 2018 and 2019.

Author Contributions

Conceptualization, J.F.S., J.S.C., R.D.J., M.S.A. and E.O.Y.; methodology, R.D.J., J.S.C., J.F.S. and B.R.B.; software, J.F.S. and E.O.Y.; formal analysis, J.F.S. and E.Y; investigation, B.R.B., resources, M.S.A., J.S.C., E.O.Y. and R.D.J.; data curation, J.F.S. and B.R.B.; writing—original draft preparation, E.O.Y.; writing—review and editing, E.O.Y., J.F.S., M.S.A., R.D.J., J.S.C. and B.R.B.; visualization, J.F.S. and E.O.Y.; supervision, E.O.Y., R.D.J. and J.S.C.; project administration, E.O.Y., J.S.C. and R.D.J.; funding acquisition, R.D.J. All authors have read and agreed to the published version of the manuscript.

Funding

R.D.J. was supported by the Sustainable Agriculture Systems Coordinated Agricultural Program grant no. 2019-68012-29852 from the USDA National Institute of Food and Agriculture.; B.R.B. was supported by a Kickapoo Valley Reforestation grant.

Data Availability Statement

The data presented in this study are available on request from the corresponding author.

Acknowledgments

The authors would like to thank the staff of the Marshfield Agricultural Research Station in Stratford, Wisconsin, for their assistance with this project.

Conflicts of Interest

The authors declare no conflict of interest.

References

  1. Gerrish, J. Management-Intensive Grazing: The Grassroots of Grass Farming; Green Park Press: Purvis, MI, USA, 2004. [Google Scholar]
  2. Oates, L.G.; Jackson, R.D. Livestock management strategy affects net ecosystem carbon balance of subhumid pasture. Rangel. Ecol. Manag. 2014, 67, 19–29. [Google Scholar] [CrossRef]
  3. Oates, L.G.; Undersander, D.J.; Gratton, C.; Bell, M.M.; Jackson, R.D. Management-intensive rotational grazing enhances forage production and quality of subhumid cool-season pastures. Crop Sci. 2011, 51, 892. [Google Scholar] [CrossRef]
  4. Rudstrom, M.H.; Chester-Jones, P.; Imdieke, R.; Johnson, D.; Reese, M.; Singh, A. Comparison of economic and animal performance of dairy heifers in feedlot and pasture-based systems. Prof. Anim. Sci. 2005, 21, 38–44. [Google Scholar] [CrossRef]
  5. Franzluebbers, A.J.; Paine, L.K.; Winsten, J.R.; Krome, M.; Sanderson, M.A.; Ogles, K.; Thompson, D. Well-managed grazing systems: A forgotten hero of conservation. J. Soil Water Conserv. 2012, 67, 100A–104A. [Google Scholar] [CrossRef]
  6. Rui, Y.; Jackson, R.D.; Cotrufo, M.F.; Ruark, M.D. Persistent soil carbon enhanced in mollisols by well-managed grassland but not annual grain or dairy forage cropping systems. Proc. Natl. Acad. Sci. USA 2022, 119, e2118931119. [Google Scholar] [CrossRef] [PubMed]
  7. Zhang, X.; Lark, T.J.; Clark, C.M.; Yuan, Y.; LeDuc, S.D. Grassland-to-cropland conversion increased soil, nutrient, and carbon losses in the US Midwest between 2008 and 2016. Environ. Res. Lett. 2021, 16, 054018. [Google Scholar] [CrossRef] [PubMed]
  8. Campbell, T.A.; Booth, E.G.; Gratton, C.; Jackson, R.D.; Kucharik, C.J. Agricultural landscape transformation needed to meet water quality goals in the Yahara River Watershed of Southern Wisconsin. Ecosystems 2022, 25, 507–525. [Google Scholar] [CrossRef]
  9. Grandin, T. Grazing cattle, sheep, and goats are important parts of a sustainable agricultural future. Animals. 2022, 12, 2092. [Google Scholar] [CrossRef]
  10. Jackson, R.D. Soil nitrate leaching under grazed cool-season grass pastures of the North Central US. J. Sci. Food Agric. 2020, 200, 5307–5312. [Google Scholar] [CrossRef]
  11. Allen, V.G.; Batello, C.; Berretta, E.; Hodgson, J.; Kothmann, M.; Li, X.; McIvor, J.; Milne, J.; Morris, C.; Peeters, A.; et al. An international terminology for grazing lands and grazing animals. Grass Forage Sci. 2011, 66, 2–28. [Google Scholar] [CrossRef]
  12. Faust, D.R.; Kumar, S.; Archer, D.W.; Hendrickson, J.R.; Krongberg, S.L.; Liebig, M.A. Integrated crop-livestock systems and water quality in the Northern Great Plains: Review of current practices and future research needs. J. Environ. Qual. 2018, 47, 1–15. [Google Scholar] [CrossRef] [PubMed]
  13. Schepers, J.S.; Francis, D.D. Chemical water quality of runoff from grazing land in Nebraska: 1. Influence of grazing livestock. J. Environ. Qual. 1982, 11, 351–354. [Google Scholar] [CrossRef]
  14. Sanjari, G.; Yu, B.; Ghadiri, H.; Ciesiolka, C.A.; Ciesiolka, C.W. Effects of time-controlled grazing on runoff and sediment loss. Aust. J. Soil Res. 2009, 47, 796–808. [Google Scholar] [CrossRef]
  15. Lambert, M.G. Losses of nitrogen, phosphorus and sediment in runoff from hill country under different ertilizer and grazing management regimes. N. Z. J. Agric. Res. 1985, 28, 371–379. [Google Scholar] [CrossRef]
  16. Park, J.Y.; Ale, S.; Teague, W.R. Simulated water quality effects of alternate grazing management practices at the ranch and watershed scales. Ecol. Model. 2017, 360, 1–13. [Google Scholar] [CrossRef]
  17. Bilotta, G.S.; Brazier, R.E.; Haygarth, P.M. The impacts of grazing animals on the quality of soils, vegetation, and surface waters in intensively managed grasslands. Adv. Agron. 2007, 94, 237–280. [Google Scholar]
  18. Centeri, C. Effects of grazing on water erosion, compaction and infiltration on grasslands. Hydrology 2022, 9, 34. [Google Scholar] [CrossRef]
  19. Daniel, J.A.; Phillips, W.A.; Northup, B.K. Influence of summer management practices of grazed wheat pastures on runoff, sediment, and nutrient losses. Trans. ASABE. 2006, 49, 349–355. [Google Scholar] [CrossRef]
  20. Emmerich, W.; Heitschmidt, R. Drought and grazing: II. Effects on runoff and water quality. J. Range Manag. 2002, 55, 229–234. [Google Scholar] [CrossRef]
  21. Elliott, A.H.; Tian, Y.Q.; Rutherford, J.C.; Carlson, W.T. Effect of cattle treading on interrill erosion from hill pasture: Modelling concepts and analysis of rainfall simulator data. Aust. J. Soil Res. 2002, 40, 963–976. [Google Scholar] [CrossRef]
  22. Blanco-Canqui, H.; Stalker, A.L.; Rasby, R.; Shaver, T.M.; Drewnoski, M.E.; van Donk, S.; Kibet, L. Does cattle grazing and baling of corn residue increase water erosion? Soil Sci. Soc. Am. J. 2016, 80, 168–177. [Google Scholar] [CrossRef]
  23. Vadas, P.A.; Busch, D.L.; Powell, J.M.; Brink, G.E. Monitoring runoff from cattle-grazed pastures for a phosphorus loss quantification tool. Agric. Ecosyst. Environ. 2019, 199, 124–131. [Google Scholar] [CrossRef]
  24. Capece, J.C.; Campbell, K.L.; Bohlen, P.J.; Graetz, D.A.; Portier, K.M. Soil phosphorus, cattle stocking rates, and water quality in subtropical pastures in Florida, USA. Rangel. Ecol. Manag. 2007, 60, 19–30. [Google Scholar] [CrossRef]
  25. Dougherty, W.J.; Nicholls, P.J.; Milham, P.J.; Havilah, E.J.; and Lawrie, R.A. Phosphorus fertilizer and grazing management effects on phosphorus in runoff from dairy pastures. J. Environ. Qual. 2008, 37, 417–428. [Google Scholar] [CrossRef] [PubMed]
  26. Nash, D.M.; McDowell, R.W.; Condron, L.M.; McLaughlin, M.J. Direct Exports of Phosphorus from Fertilizers Applied to Grazed Pastures. J. Environ. Qual. 2019, 48, 1380–1396. [Google Scholar] [CrossRef] [PubMed]
  27. Owens, L.B.; Shipitalo, M.J. Surface and subsurface phosphorus losses from fertilized pasture systems in Ohio. J. Environ. Qual. 2006, 35, 1101–1109. [Google Scholar] [CrossRef] [PubMed]
  28. O’Reagain, P.J.; Brodie, J.; Fraser, G.; Bushell, J.J.; Holloway, C.H.; Faithful, J.W.; Haynes, D. Nutrient loss and water quality under extensive grazing in the upper Burdekin river catchment, North Queensland. Mar. Pollut. Bull. 2005, 51, 37–50. [Google Scholar] [CrossRef]
  29. Vadas, P.A.; Aarons, S.R.; Butler, D.M.; and Dougherty, W.J. A new model for dung decomposition and phosphorus transformations and loss in runoff. Soil Res. 2011, 49, 367–375. [Google Scholar] [CrossRef]
  30. Lyons, J.; Weasel, B.M.; Paine, L.K.; Undersander, D.J. Influence of intensive rotational grazing on bank erosion, fish habitat quality, and fish communities in Southwestern Wisconsin trout streams. J. Soil Water Conserv. 2000, 55, 271–276. [Google Scholar]
  31. Jokela, W.E.; Casler, M.D. Transport of phosphorus and nitrogen in surface runoff in a corn silage system: Paired watershed methodology and calibration period results. Can. J. Soil Sci. 2011, 91, 479–491. [Google Scholar] [CrossRef]
  32. Sherman, J.F.; Young, E.O.; Jokela, W.E.; Casler, M.D.; Coblentz, W.K.; Cavadini, J. Influence of soil and manure management practices on surface runoff phosphorus and nitrogen loss in a corn silage production system: A paired watershed approach. Soil Syst. 2021, 5, 1. [Google Scholar] [CrossRef]
  33. Peters, J. Recommended Methods of Manure Analysis; University of Wisconsin-Extension: Madison, WI, USA, 2003. [Google Scholar]
  34. Teague, R.; Barnes, M. Grazing management that regenerates ecosystem function and grazing land livelihoods. Afr. J. Range Forage Sci. 2017, 34, 77–86. [Google Scholar] [CrossRef]
  35. Laboski, C.A.; Peters, J.B.; Bundy, L.G. Nutrient Application Guidelines for Field, Vegetable, and Fruit Crops in Wisconsin; Division of Cooperative Extension of the University of Wisconsin-Extension: Madison, WI, USA, 2006. [Google Scholar]
  36. Stuntebeck, T.D.; Komiskey, M.J.; Owens, D.W.; Hall, D.W. Methods of Data Collection, Sample Processing, and Data Analysis for Edge-of-Field, Streamgaging, Subsurface-Tile, and Meteorological Stations at Discovery Farms and Pioneer Farm in Wisconsin, 2001–2007; US Geological Survey: Reston, VA, USA, 2008.
  37. APHA. Standard Methods for the Examination of Water and Wastewater, 19th ed.; American Public Health Association; American Water Works Association; Water Environment Federation: Washington, DC, USA, 1995. [Google Scholar]
  38. ASTM International (Ed.) Standard Test Method for Determining Sediment Concentration in Water Samples; ASTM International: West Conshohocken, PA, USA, 2000. [Google Scholar]
  39. Patton, C.J.; Kryskalla, J.R. Methods of Analysis by the US Geological Survey National Water Quality Laboratory: Evaluation of Alkaline Persulfate Digestion as an Alternative to Kjeldahl Digestion for the Determination of Total and Dissolved Nitrogen and Phosphorus in Water; Water Resources Investigations, Rep. 03-4174; USGS, Branch of Information Services, Federal Center: Denver, CO, USA, 2003.
  40. Laboski, C.A.M.; Peters, J.B. Nutrient Application Guidelines for Field, Vegetable, and Fruit Crops in Wisconsin; University of Wisconsin-Extension, Cooperative Extension: Madison, WI, USA, 2012. [Google Scholar]
  41. Schulte, E.E.; Hopkins, B.G. Estimation of soil organic matter by weight 3. Organic matter (LOI) loss-on-ignition. In Soil Organic Matter: Analysis and Interpretation; Magdoff, F.R., Tabatabai, M.A., Hanlon, E.A., Jr., Eds.; Soil Science Society of America: Madison, WI, USA, 1996; pp. 21–31. [Google Scholar]
  42. Thomas, G.W. Soil pH and soil acidity. In Methods of Soil Analysis Part 3: Chemical Methods; Sparks, D.L., Ed.; Soil Science Society of America: Madison, WI, USA, 1996; pp. 475–490. [Google Scholar]
  43. Bray, R.H.; Kurtz, L.T. Determination of total, organic, and available forms of phosphorus in soil. Soil Sci. 1945, 59, 39–45. [Google Scholar] [CrossRef]
  44. Clausen, J.C.; Spooner, J. Paired Watershed Study Design; USEPA Publ. 841-F-93–009; U.S. Environ. Protection Agency: Washington, DC, USA, 1993.
  45. SAS Institute Inc. SAS 9.4 Guide to Software Updates; SAS Institute Inc.: Cary, NC, USA, 2013. [Google Scholar]
  46. Good, L.W.; Carvin, R.; Lamba, J.; Fitzpatrick, F.A. Seasonal variation in sediment and phosphorus yields in four Wisconsin agricultural watersheds. J. Environ. Qual. 2019, 48, 950–958. [Google Scholar] [CrossRef] [PubMed]
  47. Good, L.W.; Vadas, P.; Panuska, J.C.; Bonilla, C.A.; Jokela, W.E. Testing the Wisconsin Phosphorus Index with Year-Round, Field-Scale Runoff Monitoring. J. Environ. Qual. 2012, 41, 1730–1740. [Google Scholar] [CrossRef] [PubMed]
  48. Vandegrift, T.R.; Stefan, H.G. Annual Stream Runoff and Climate in Minnesota’s River Basins; Project Report; University Minnesota St. Anthony Falls Lab: Minneapolis, MN, USA, 2010; Volume 543, pp. 1–31. [Google Scholar]
  49. Stock, M.N.; Arriaga, F.J.; Vadas, P.A.; Good, L.W.; Casler, M.D.; Karthikeyan, K.G.; Zopp, Z. Fall tillage reduced nutrient loads from liquid manure application during the freezing season. J. Environ. Qual. 2019, 48, 889–898. [Google Scholar] [CrossRef] [PubMed]
  50. Prasad, L.R.; Thompson, A.M.; Arriaga, F.J.; Vadas, P.A. Tillage and manure effects on runoff nitrogen and phosphorus losses from frozen soils. J. Environ. Qual. 2022, 51, 978–989. [Google Scholar] [CrossRef]
  51. Gary, H.L.; Jhonson, S.R.; Ponce, S.L. Cattle grazing impact on surface water quality in a Colorado Front Range stream. J. Soil Water Conserv. 1983, 38, 124–128. [Google Scholar]
  52. Griffith, K.E.; Young, E.O.; Klaiber, L.K.; Kramer, S.R. Winter rye cover crop impacts on runoff water quality in a northern New York (USA) tile-drained maize agroecosystem. Water Air Soil Pollut. 2020, 231, 84. [Google Scholar] [CrossRef]
  53. Wood, J.C.; Wood, M.K. Infiltration and water quality on range sites at Fort Stanton, New Mexico. Water Resour. Bull. 1988, 24, 317–323. [Google Scholar] [CrossRef]
  54. Laboski, C.A.M.; Lamb, J.A. Changes in soil test phosphorus concentration after application of manure or fertilizer. Soil Sci. Soc. Am. J. 2003, 67, 544–554. [Google Scholar] [CrossRef]
  55. Young, E.O.; Ross, D.S.; Jaisi, D.P.; Vidon, P.G. Phosphorus transport along the cropland–riparian–stream continuum in cold climate agroecosystems: A review. Soil Syst. 2012, 5, 15. [Google Scholar] [CrossRef]
  56. Danz, M.E.; Corsi, S.R.; Brooks, W.R.; Bannerman, R.T. Characterizing response of total suspended solids and total phosphorus loading to weather and watershed characteristics for rainfall and snowmelt events in agricultural watersheds. J. Hydrol. 2013, 507, 249–261. [Google Scholar] [CrossRef]
  57. Vadas, P.A.; Stock, M.N.; Arriaga, F.J.; Good, L.W.; Karthikeyan, K.G.; Zopp, Z.P. Dynamics of measured and simulated dissolved phosphorus in runoff from winter-applied dairy manure. J. Environ. Qual. 2019, 48, 899–906. [Google Scholar] [CrossRef] [PubMed]
  58. Hoffman, A.R.; Polebitski, A.S.; Penn, M.R.; Busch, D.L. Long-term variation in agricultural edge-of-field phosphorus transport during snowmelt, rain, and mixed runoff events. J. Environ. Qual. 2019, 48, 931–940. [Google Scholar] [CrossRef] [PubMed]
  59. Vadas, P.A.; Good, L.W.; Jokela, W.E.; Karthikeyan, K.G.; Arriaga, F.J.; Stock, M. Quantifying the impact of seasonal and short-term manure application decisions on phosphorus loss in surface runoff. J. Environ. Qual. 2017, 46, 1395–1402. [Google Scholar] [CrossRef] [PubMed]
  60. Costa, D.; Baulch, H.; Elliott, J.; Pomeroy, J.; Wheater, H. Modelling nutrient dynamics in cold agricultural catchments: A Review. Environ. Modell. Softw. 2020, 124, 104586. [Google Scholar] [CrossRef]
Figure 1. Annual net temperature and precipitation deviations from normal (30 year mean) for each year of the study. Cumulative precipitation and temperature deviations reflect net deviation from 30 year means over the study period.
Nitrogen 04 00025 g001
Figure 2. Average annual manure total N and P applied to hay fields during the control and treatment phases along with average annual total N and P returned in the grazing systems by heifers.
Nitrogen 04 00025 g002
Figure 3. Surface runoff events during calibration and treatment phases for primary paddock stocking (PPS/M1), control hay field (M2), adaptive multi-paddock stocking (AMPS/M3), and continuous stocking (CS/M4) grazing system treatments evaluated in this study.
Nitrogen 04 00025 g003
Figure 4. Annual surface runoff coefficients for primary paddock stocking (PPS/M1), control hay field (M2), adaptive multi-paddock stocking (AMPS/M3), and continuous stocking (CS/M4) grazing system treatments.
Nitrogen 04 00025 g004
Figure 5. Calibration and treatment phase surface runoff regressions for control vs. PPS (a), control vs. AMPS (b), and control vs. CS (c), and cumulative runoff for all watersheds over the study (d). Orange squares are treatment period values and blue diamonds are calibration values. All regressions were significant at p < 0.001 unless otherwise stated. See Table 1 for regression runoff slope/intercept statistics. PPS = primary paddock stocking; Control = hay field; AMPS = adaptive multi-paddock stocking; CS = continuous stocking.
Nitrogen 04 00025 g005
Figure 6. Event ammonium-N concentrations (a) and cumulative loads (b), event nitrate-N concentrations (c) and cumulative loads (d), and total N concentrations (e) and loads (f) for PPS, control, AMPS, and CS. PPS = primary paddock stocking; Control = hay field; AMPS = adaptive multi-paddock stocking; CS = continuous stocking.
Nitrogen 04 00025 g006
Figure 7. Event total P (a) and dissolved reactive P (DRP) concentrations (b) and cumulative loads (c,d) for PPS, control, AMPS, and CS watershed treatments. PPS = primary paddock stocking; Control = hay field; AMPS = adaptive multi-paddock stocking; CS = continuous stocking.
Nitrogen 04 00025 g007
Figure 8. Relative total phosphorus (P) and nitrogen (N) use efficiency of each watershed/treatment over the treatment phase of the study (2018 to 2020) based on total N and P inputs from manure and that lost in runoff. PPS = primary paddock stocking; Control = hay field; AMPS = adaptive multi-paddock stocking; CS = continuous stocking.
Nitrogen 04 00025 g008
Figure 9. Cumulative surface runoff plotted as a function of descending event size for all watersheds.
Nitrogen 04 00025 g009
Table 1. Paired watershed statistics for average event runoff, suspended sediment (SS), and SS load.
TreatmentCalibration MeanTreatment Meanp1p2p3p4
Runoff (mm)PPS66.710.6NS50.1NS0.006
Control7-7.4----
AMPS84.97.0NSNSNSNS
CS96.612.5NS0.02NS<0.001
Sediment (mg L−1)PPS16.910.2<0.0001NSNSNS
Control-9.2----
AMPS13.39.1<0.001NSNSNS
CS15.512.6NS0.04NSNS
Sediment load (kg ha−1)PPS1.21.2NSNSNSNS
Control-0.80----
AMPS0.500.44NS0.08NSNS
CS1.11.6NS0.03NSNS
p1-value tests if treatment and calibration period means differ (p ≤ 0.10); p2-value tests if stocking method differs from the control; p3- and p4-values test for different slopes and intercepts between the control and each stocking method, respectively. NS5 = not significant, i.e., p > 0.10. PPS6 = primary paddock stocking; Control7 = hay field; AMPS8 = adaptive multi-paddock stocking; CS9 = continuous stocking.
Table 2. Paired watershed statistics for event mean ammonium-N concentration/loads and nitrate-N concentrations/loads.
MeasureTreatmentCalibration MeanTreatment Meanp1p2p3p4
Ammonium-N (mg L−1)PPS0.730.60NS5NS<0.00010.03
Control-0.49----
AMPS0.550.47NSNS0.06NS
CS0.980.53NSNS<0.00010.004
Ammonium-N load (kg ha−1)PPS0.040.060.001NSNSNS
Control-0.05----
AMPS0.030.03NSNSNS0.08
CS0.060.10<0.00010.02NSNS
Nitrate-N (mg L−1)PPS0.120.26NS0.030.010.003
Control-0.08----
AMPS0.050.11NSNSNSNS
CS0.120.310.07<0.0001<0.0001NS
Nitrate-N load (kg ha−1)PPS0.010.04NSNSNSNS
Control-0.01----
AMPS0.0040.01NSNSNSNS
CS0.010.04NSNSNSNS
p1-value tests if treatment and calibration period means differ (p ≤ 0.10); p2-value tests if stocking method differs from the control; p3- and p4-values test for different slopes and intercepts between the control and each stocking method, respectively. NS = not significant, i.e., p > 0.10. PPS = primary paddock stocking; Control = hay field; AMPS = adaptive multi-paddock stocking; CS = continuous stocking.
Table 3. Paired watershed statistics for event mean total N, total P, and dissolved reactive P concentration/loads.
TreatmentCalibration MeanTreatment Meanp1p2p3p4
Total nitrogen (mg L−1)PPS3.43.0NS5NS0.00080.005
Control-2.6----
AMPS2.52.4NSNS0.0050.008
CS3.13.1NS0.06<0.0001<0.0001
TN load (kg ha−1)PPS0.170.30NS0.09NS0.07
Control-0.19 ---
AMPS0.110.14NSNSNSNS
CS0.200.36NS0.02NS0.0004
Total phosphorus (mg L−1)PPS1.70.85<0.00010.002<0.00010.01
Control-1.4----
AMPS1.11.1NSNS0.0070.01
CS1.41.10.04NS<0.0001<0.0001
TP load (kg ha−1)PPS0.080.07NSNSNSNS
Control-0.08----
AMPS0.040.05NSNSNSNS
CS0.070.09NSNSNSNS
Dissolved reactive phosphorus (mg L−1)PPS1.60.70<0.00010.0003<0.00010.02
Control-1.2----
AMPS0.890.86NS0.060.060.06
CS1.10.840.020.02<0.00010.002
DRP load (kg ha−1)PPS0.070.06NSNSNSNS
Control-0.07----
AMPS0.030.04NSNSNSNS
CS0.060.07NSNSNSNS
p1-value tests if treatment and calibration period means differ (p ≤ 0.10); p2-value tests if stocking method differs from the control; p3- and p4-values test for different slopes and intercepts between the control and each stocking method, respectively. NS = not significant, i.e., p > 0.10. PPS = primary paddock stocking; Control = hay field; AMPS = adaptive multi-paddock stocking; CS = continuous stocking.
Disclaimer/Publisher’s Note: The statements, opinions and data contained in all publications are solely those of the individual author(s) and contributor(s) and not of MDPI and/or the editor(s). MDPI and/or the editor(s) disclaim responsibility for any injury to people or property resulting from any ideas, methods, instructions or products referred to in the content.

