
The Evaluation of a Novel Denitrifying Woodchip Bioreactor: Fairmont, MN, USA

Department of Bioproducts and Biosystems Engineering, University of Minnesota, St. Paul, MN 55108, USA
*
Author to whom correspondence should be addressed.
Nitrogen 2024, 5(1), 152-162; https://doi.org/10.3390/nitrogen5010010
Submission received: 10 January 2024
/
Revised: 14 February 2024
/
Accepted: 18 February 2024
/
Published: 21 February 2024
Abstract
:The risk of nitrate contamination became a reality for Fairmont in Minnesota, when water rich in NO3-N exceeded the drinking water standard of 10 mg/L. This was unexpected because this city draws its municipal water from a chain of lakes that are fed primarily by shallow groundwater under row-crop land use. Spring soil thaw drives cold water into a subsurface pipe where almost no NO3-N reduction occurs. This paper focuses on NO3-N reduction before the water enters the lakes and no other nitrogen management practices in the watershed. A novel denitrifying bioreactor was constructed behind a sediment forebay, which then flowed into a chamber covered by a greenhouse before entering a woodchip bioreactor. In 2022 and 2023, water depth, dissolved oxygen, and temperature were measured at several locations in the bioreactor, and continuous NO3-N was measured at the entry and exit of the bioreactor. The results showed better performance at a low water depth with lower dissolved oxygen and higher water temperature. The greenhouse raised the inlet temperature in 2022 but did not in 2023. The forebay and the greenhouse may have impeded the denitrification process due to the high dissolved oxygen concentrations in the influent and the stratification of dissolved oxygen caused by algae in the bioreactor.
1. Introduction
In 2016, the City of Fairmont, a farming community in southwestern Minnesota (Midwestern USA), was forced to issue a public health notice that the city’s drinking water supply exceeded the Environmental Protection Agency’s (EPA) maximum NO3-N contaminant level of 10 mg/L [1]. High NO3-N in drinking water causes harmful effects, one of the most severe being methemoglobinemia, which can be toxic to infants [2]. Fairmont uses groundwater and surface water blending and mechanical treatment to mitigate high NO3-N spikes, but the capacity of these tools is considered limited because Fairmont’s primary source of drinking water comes from a chain of lakes fed by agricultural watersheds [1,3]. Dutch Creek is one of the largest tributaries to the Fairmont chain of lakes, with the watershed covering over 4091 Ha and contributing significantly to Fairmont’s NO3-N levels in its drinking water supply [1]. Data collected since 2000 show periodic high NO3-N events in Dutch Creek which peaked three times over the EPA maximum contaminant levels [3]. Warmer months of the year provide natural NO3-N removal processes in the lakes and help prevent NO3-N from reaching the city’s drinking water intake. However, in the spring months (March, April and May), when NO3-N is more readily flushed though the soil profile into tile-drains and though agricultural watersheds, the natural limnologic removal mechanisms are ineffective [1,4,5]. Soil water assessment tool (SWAT) modeling was performed and showed seasonal variation in NO3-N levels. SWAT model results provided more detail, suggesting that both spring flushing and summer removal mechanisms were underestimated for the Dutch Creek watershed. This knowledge reinforced the need to adapt NO3-N removal technologies to help the City of Fairmont achieve safe drinking water.
Funding from the Clean Water Act (CWA) Section 319 and the Minnesota Board of Water and Soil Resources (BWSR) was provided to the Martin County Soil and Water Conservation District (SWCD) to implement best management practices (BMPs) in the Dutch Creek watershed to lower the NO3-N load to Budd Lake (Figure 1a). A state BWSR grant of USD 86,000 was provided to the SWCD to implement agricultural BMPs along with USD 25,000 of Federal CWA Section 319 Funds. A portion of the funds was used to install two woodchip bioreactors and two saturated buffers in the Fairmont chain of lakes/Dutch Creek watershed to reduce the nitrogen load by 1375 kg/year [6]. The City of Fairmont was further encouraged to seek Environmental Natural Resources Trust Fund (ENRTF) money via the Legislative Citizens Committee on Minnesota Resources (LCCMR) [1]. The city was successful in obtaining a grant for USD 190,000. The funding was focused on building a novel woodchip bioreactor above the confluence of Budd Lake though other NO3-N BMPs were in the process of being installed in the Dutch Creek watershed like the addition of perennial crops to limit nitrate leaching [7]. The design, construction and performance of the novel greenhouse nitrogen treatment system are the focus of this paper because the City of Fairmont was required to immediately reduce spring NO3-N load.
Denitrifying woodchip bioreactors represent a solution for addressing nitrate-contaminated subsurface drainage, not only in the Midwestern United States, but also globally, with growing adoption over the past decade [2,8]. This approach has been integrated into nutrient reduction strategies across multiple states in the Midwestern region, aiming to mitigate nonpoint source nitrate pollution [9,10,11,12]. In a bioreactor system, solid carbon-rich media are placed in the path of contaminated water to allow facultative anaerobic bacteria to use an electron from carbon and reduce nitrate to nitrogen gas [13,14,15]. Woodchips are commonly used as a carbon source because they decay very slowly, lasting decades, and they provide ideal growth media for the bacteria [13,15]. Fairmont requires denitrification the most during the spring snowmelt when temperatures are near freezing. Denitrification has been shown to occur in bioreactors at temperatures as low as 1–5 °C, but decreased rates are a major concern [13] for typical woodchip bioreactor performance. Desired denitrification rates begin to occur above 6 °C [13,16]. To meet these temperature requirements, a novel denitrifying woodchip bioreactor was built to treat high NO3-N in Dutch Creek before other Dutch Creek BMPs were fully implemented. In this novel bioreactor system, a greenhouse pool system was added in front of the NO3-N removal system to passively warm water before the denitrifying woodchip chamber [17]. Additionally, a sediment forebay was constructed in front of the greenhouse to prevent sediment from entering the treatment system and clogging open pore spaces in the wood.
In this study, several water quality parameters were monitored and collected. The desired performance of this designed novel denitrifying woodchip bioreactor would include more biological activity in March and April compared to a standard in-field woodchip bioreactor, with typically very cold water from the spring soil thaw moving in tile-drains. Intensively managed row-crop land will leach NO3-N from the soil profile [2,3] into tile-drains. NO3-N management is required to obtain sustainable crop growth yet meet the ecosystem service demands of the public. This objective can be exceedingly difficult in a cold climate; therefore, novel ideas must be tested to determine whether cold-water NO3-N reduction can be improved in the upper Midwest of the USA.
2. Materials and Methods
In this bioreactor system (43°37′19″ N, 94°29′35″ W), the drainage water from a tributary of Dutch Creek first drains into a forebay to drop sediment and then drains into a greenhouse and ultimately flows into the bioreactor (Figure 1b,c).
The bioreactor system was monitored for temperature distribution (T), water depth, flow, nitrate (N), sulfate (S), dissolved organic carbon (TOC) and general water quality parameters (total suspended solids (TSS), dissolved oxygen (DO) and pH) starting in early March 2022 and continuing until 29 June 2023. Monitoring was stopped in August 2022 when there had been no flow for a month and then began in March 2023. The first two to three months were primarily dedicated to system (microbial) start-up and adjustment.
2.1. Temperature
Temperature probes (Hach MX Pendant, Loveland, CO, USA) were placed in 10 locations: Agridrain 2 (AD2 represents the inlet water control structure, which is challenging to display in Figure 1) before the greenhouse; greenhouse air and water; Agridrain 1 (AD1) in the influent control structure of the bioreactor; the bottom of each bioreactor port; 0.91 m off the bottom of each bioreactor port; Manhole 2 (MH2) in the effluent of the bioreactor; and one hung outside of AD1. Temperatures were logged at 30 min intervals and downloaded once a month. The AD2 temperature probe stopped recording data on 17 April 2023.
2.2. Water Depth
Pressure transducers (Hobo and Solinst brands, Hobo: Onset, Bourne, USA. Solinst: Georgetown, Canada) were placed at the bottom of 4 locations in the bioreactor system: the greenhouse, AD1 in the influent, the first bioreactor port (BP1) and MH2 in the effluent. A barologger was also placed outside of AD1. Water pressures were logged at 15 min intervals and downloaded once a month. The pressures were compensated with barologger pressures to obtain water depths. Water depths were also measured periodically and validated with a water level meter.
2.3. Flow Rates
Flow rates were measured approximately once a month by timing how quickly a container with a known volume filled with water at the effluent pipe. The flow rate was controlled in the range of 0.28 L/s to 1.42 L/s based on the instruction from the designer to ensure that water had enough time to complete the denitrification process in the bioreactor before leaving the system.
2.4. Water Quality
Water quality field parameters were directly measured by a YSI Sonde (Yellow Springs, OH, USA) and Hach Nitratax (Loveland, CO, USA) probe every 15 min and indirectly by grab samples sent to a lab. A YSI Sonde with temperature, dissolved oxygen and conductivity probes was deployed first in AD1 to catch the initial water quality of the spring flush and then at BP1 to look at the micro-climate inside the reactor. Due to financial and equipment constraints, periodically, manual measurements were taken at the second bioreactor port (BP2) and for profiles inside the bioreactor at 0.30 m intervals.
A Nitratax nitrate probe was installed in the influent, AD1, in March 2022, and a second probe was installed in the effluent, MH2, at the end of April 2022. Nitrate probes were installed in the influent and effluent in March 2023. Nitrate readings were recorded every 15 min. Two solar panels were installed to power the Nitratax controller and probes. The Nitratax controller, solar panel controller and marine batteries were stored inside a job box at the site. Grab samples were taken twice a week (March through May) and once a week in July 2022. In 2023, grab samples were taken twice a week from March through to mid-June. Grab samples were sent to the Minnesota Valley Testing Laboratory for N, S, TSS and TOC testing.
The measured water quality parameters that were used in this study are summarized in Table 1. In situ measurements of water depth, N, T, pH and DO in the bioreactor were recorded at certain intervals throughout a day. There were 24 measurements of water depth, 48 measurements of N and 96 measurements of T/pH/DO per day. The average values of these measurements per day were used in this study to investigate the relationship between N removal efficiency and its related indicators: water depth, T, pH and DO. In the following analysis, it is evident that data were missing on certain days due to various factors, such as equipment failures, but it has minimal impact on the overall analysis.
3. Results
Figure 2a shows the N measurements, with two dash lines representing the N measured at the influent and effluent using the N probe and two colors of dots representing the N measured at the influent and effluent from the lab.
Based on the results, we observed that the N levels increased as the weather became warmer, and the readings from the N probe accurately reflected the N removal in the bioreactor during these two years, except for in the first two months of adjustment. This was evident as the N difference between influent and effluent remained consistent when using both the probe and verification from the lab test (Figure 2a). Unfortunately, the bioreactor did not function properly in 2023. This can be seen from Table 2, where the p-value from a single-factor ANOVA test indicated no statistical difference in N levels between influent and effluent for the year 2023. During this time, we performed QA/QC to make sure the equipment was performing properly. The bioreactor only operated properly during the year 2022, as evidenced by a p-value of less than 0.05.
Figure 2b shows the water depth in the bioreactor, which was designed as a cylinder with a 1.52 m diameter. The water depth fluctuated in the year 2022 while it remained full for most of the year 2023. During the operational period in the year 2022, moments of high denitrification efficiency often corresponded to lower water depth, as shown by the red box in the figure (Figure 2c). Surprisingly, when the bioreactor exhibited excellent performance with N removal efficiency greater than 40% between May and August, especially from July to August when the system reached a stable state, the corresponding water depth decreased significantly to less than 0.6 m (Figure 2c).
To investigate the operating performance of the bioreactor, T, pH and DO, which are the three most important indicators to assess a bioreactor’s performance, were studied [15]. It is obvious that the T increased as the weather became warmer (Figure 2d). With the assistance of the greenhouse, the temperature of the inlet water was significantly increased, especially during cold days in 2022. However, in the year 2023, the greenhouse no longer functioned as expected, resulting in no improvement in the inlet temperature (Figure 2e). This is one of the reasons why N removal was not obvious in the year 2023. From a single-factor ANOVA test on T across the bioreactor, the p-value was greater than 0.05, suggesting there was no significant statistical difference in T across the entire system (Table 3), as also evidenced in Figure 2d. Typically, denitrification occurs optimally within the T range between 15 and 35 °C [18], and, given that the T increased from 15 °C to 35 °C between July and August 2022 (Figure 2d), it is one of the reasons why a higher N removal efficiency was observed during this period.
Regarding pH, it remained relatively constant throughout 2023, and there was a slight decrease observed from July to August 2022 (Figure 2f). It is essential to maintain a steady pH, not too high or low, as extremes in pH can negatively impact the bioreactor’s performance [19]. During bioreactor operation, pH tends to slightly decrease due to fermentation in TOC production [20]. The DO levels measured at the bottom of the bioreactor were around 0 mg/L from July to August 2022, and they were higher for most of 2023 (Figure 2f). DO levels above 0.2 mg/L are reported to inhibit the denitrification process, as denitrification requires an anaerobic environment [15]. From Table 4, we notice a considerable difference in DO levels between the two periods (the only available data we have) in 2022 and 2023. The extremely low DO levels are another significant factor contributing to the substantial improvement in NO3-N removal observed from July to August 2022.
Based on the above findings, the bioreactor showed a good performance between July and August 2022. During this period, when the water depth was significantly low, T fell within the optimum range for denitrification to occur, and DO levels were low enough to create the anaerobic environment suitable for denitrifying bacteria to thrive. To investigate whether DO exhibits the constant behavior across the bioreactor horizontally and vertically, as observed with T, several DO measurements were taken at different locations: BP1 top/bottom and BP2 top/bottom. Interestingly, the result shows that, unlike other woodchip bioreactors, where DO decreases along the length of the bioreactor [21], this bioreactor exhibited significant vertical stratification of DO, with high DO levels at the top and low DO levels at the bottom (Figure 3).
This stratification created an anaerobic zone at the bottom which favored denitrification [22]. As a result, denitrification did not occur in other parts of the bioreactor besides the bottom zone. Clearly something went wrong, and the bioreactor no longer worked as designed.
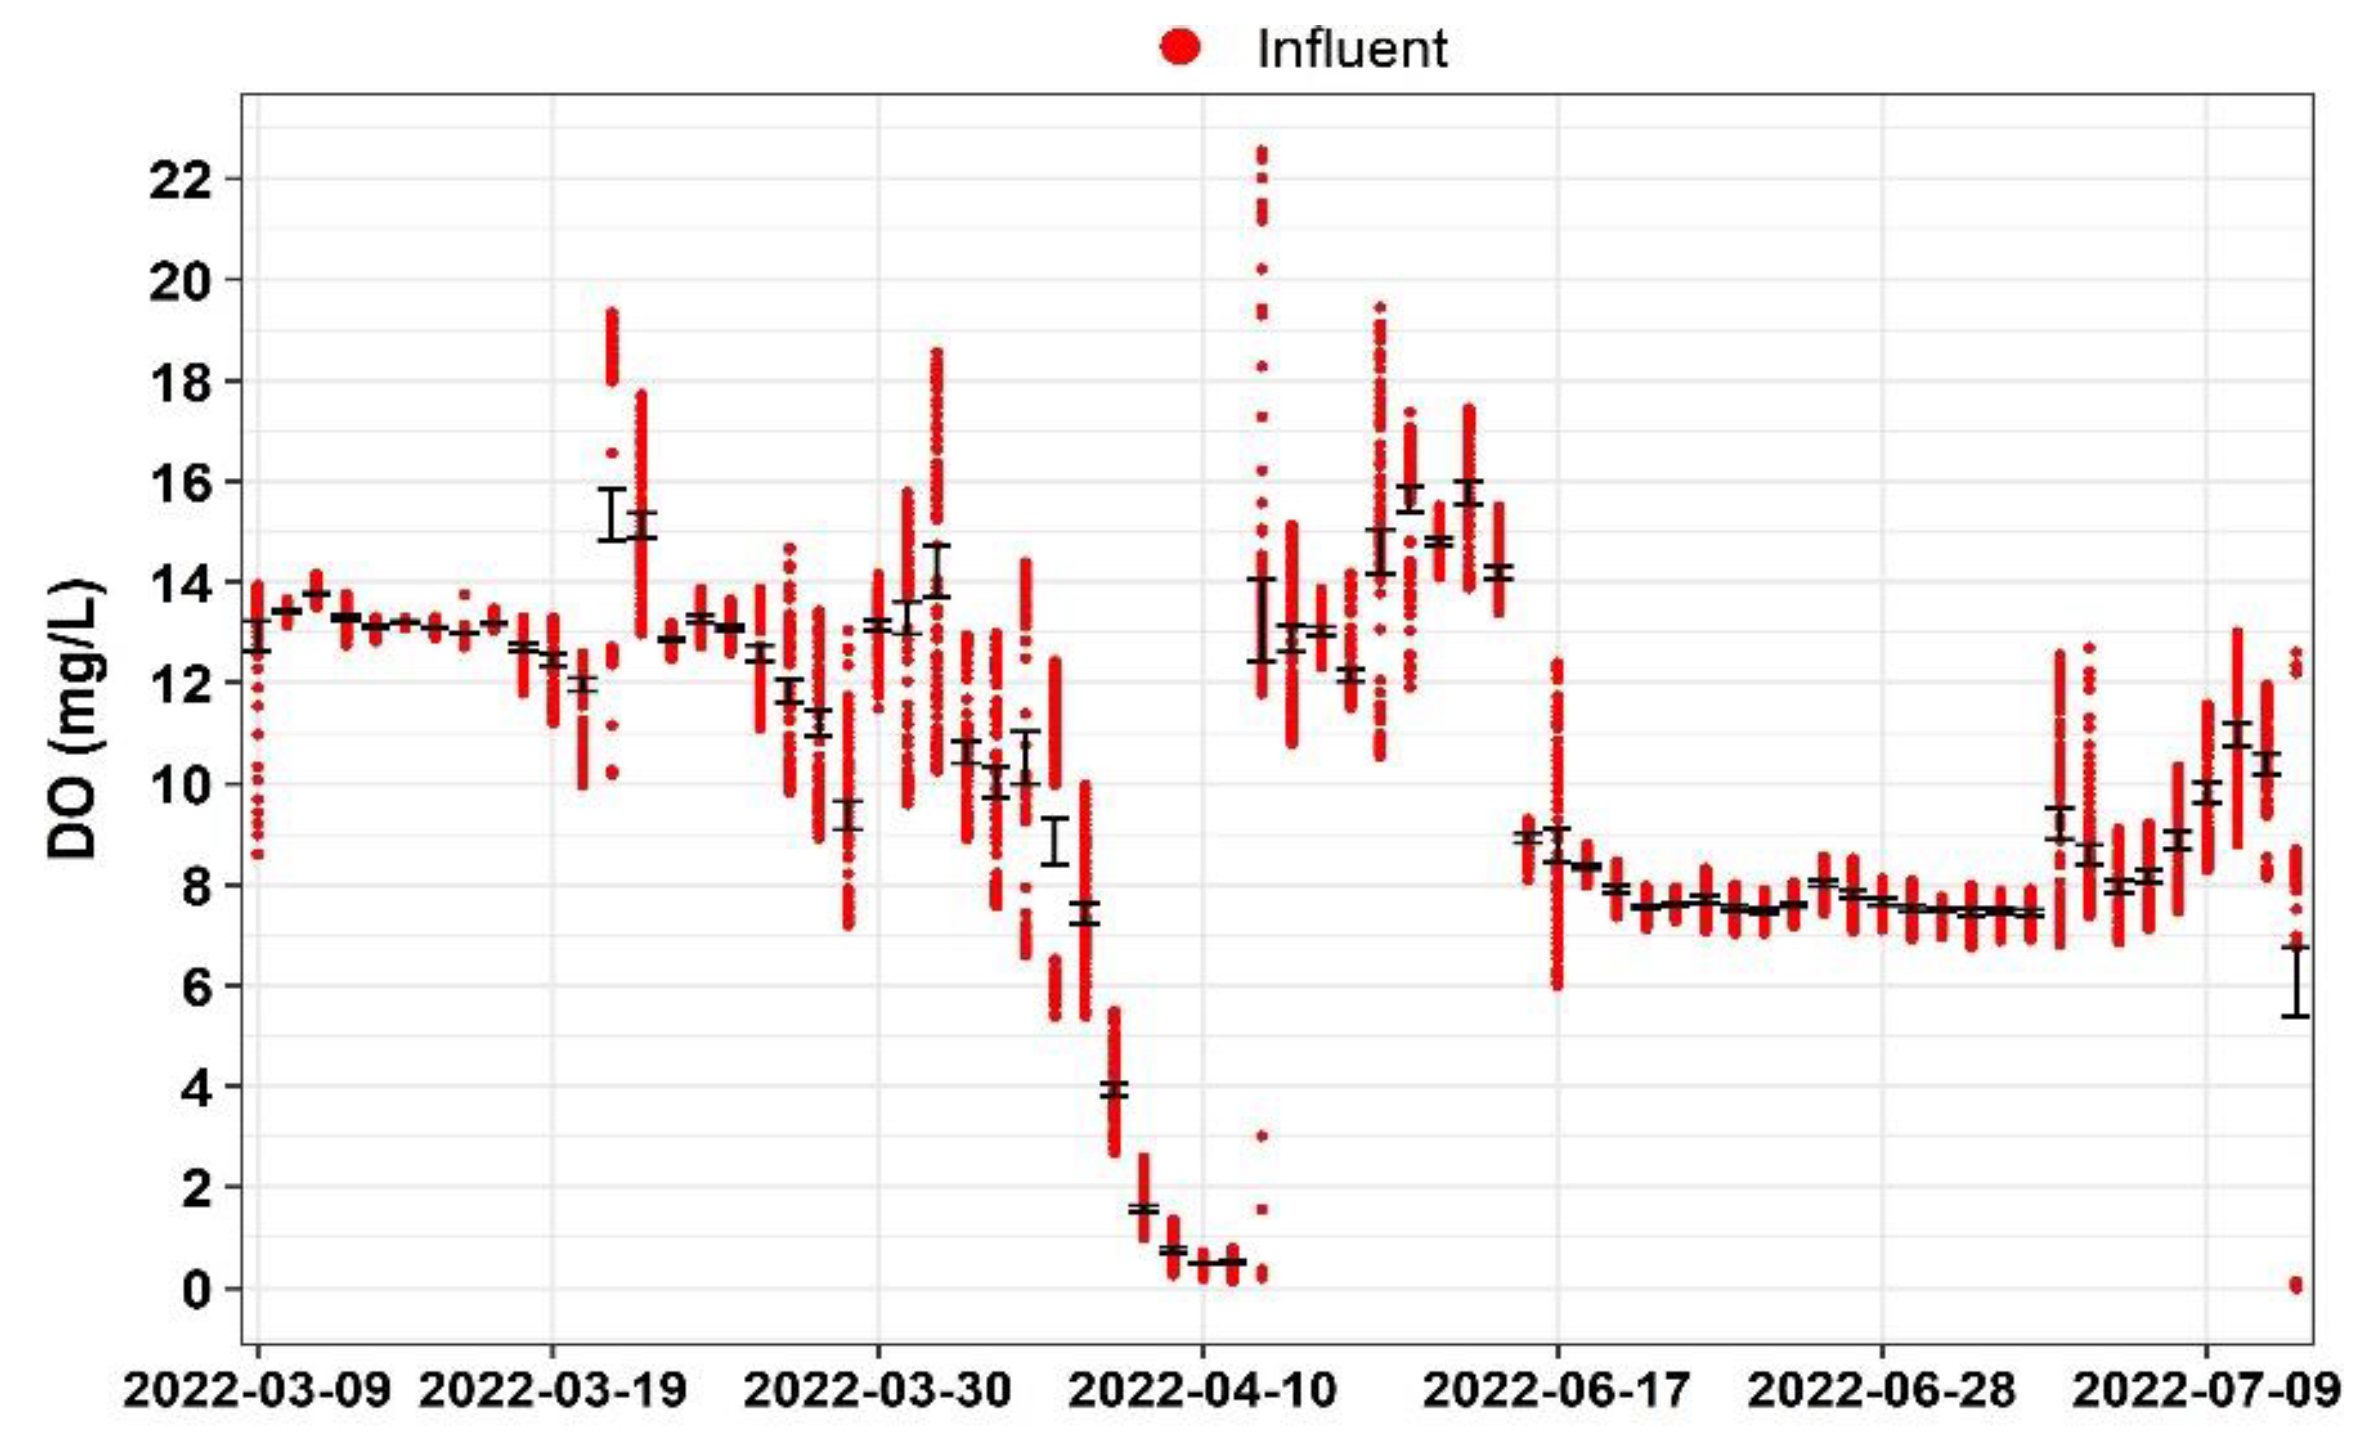
The reason for the stratification of DO might be the presence of algae observed in the bioreactor. With an extra forebay and greenhouse constructed in front of the bioreactor, the incoming water from the shallow groundwater mixed with surface rainfall runoff, introducing a substantial amount of algae into the influent. Typically, the saturated DO levels in a water body range between 7 and 10 mg/L. As depicted in Figure 4, oversaturated DO caused by algae photosynthesis was observed at the influent for most of the observation period. This suggests total system failure! There was no reason to continue the experiment throughout 2023 or into 2024 unless the system was torn apart and rebuilt.
With the influent entering 0.3 m from the bottom of the bioreactor, algae tended to concentrate at higher levels and physically inhibit oxygen penetration, therefore causing the variable DO distribution vertically. On the other hand, the settling of dead algae depleted DO, causing lower DO levels in the bottom zone [23]. During July and August 2022, when the water depth was extremely low, less surface water flowed into the bioreactor at a low velocity with low DO and reduced the flux of algae. Additionally, the lower water facilitated faster carbon mineralization of the woodchips by denitrifying bacteria [24]. Moreover, Figure 3 reveals variations in DO between BP1 and BP2, indicating that N removal varied along the length of the bioreactor [25].
In addition to measuring T, pH and DO, other chemical properties such as TOC, TSS and S were also evaluated in both the influent and the effluent to gain a better understanding of the bioreactor’s performance (Figure 5).
The results show that the removal efficiency of TSS was obvious, which aligned with findings from other studies, indicating that the bioreactor was efficient in filtering TSS [26]. However, unlike other bioreactors, which release a significant amount of TOC from the woodchip [27], the changes in TOC and S concentration between the influent and effluent were not substantial. Moreover, the dynamic behavior of the bioreactor led to fluctuation in these three parameters, which is challenging to explain as anything other than a system failure.
4. Conclusions and Recommendations
In summary, the Fairmont denitrifying woodchip bioreactor demonstrated a better performance with more than 40% NO3-N removal efficiency at low water depth, where DO levels were low enough and the T was high enough to facilitate anaerobic respiration. The greenhouse raised the temperature to the desired level suitable for denitrification to occur in the year 2022 but then failed to function properly in the year 2023. The construction of a forebay and greenhouse likely significantly hindered the bioreactor’s denitrification process due to the high DO levels in the influent and the stratification of DO caused by algae production in late 2022 into 2023 in the bioreactor chamber.
We hypothesize that the use of algaecide in the sediment forebay and greenhouse may [28] prevent algae from affecting the denitrification process. Typically, woodchip bioreactors have been reported to exhibit a wide range of nitrate removal rates, ranging from 13% to 100%, depending on conditions (such as influent concentration, carbon source, flow rate, temperature, reactor configuration, etc.) and geographic location [29,30,31,32]. However, despite these variations, enhancing denitrification systems to reduce NO3-N loadings from agricultural drainage remains a challenge for denitrifying woodchip bioreactors [29]. Our in-field features, which combine traditional bioreactors with sediment forebays and greenhouses, were designed to tackle the issue of low NO3-N removal efficiency during the spring thaw snowmelt. However, these features, which are uncommon in nitrogen removal bioreactors, did not deliver the expected significant improvements during its operation in 2022 and led to total system failure in 2023.
To address the above issue, most studies focus on optimizing bioreactor performance to enhance NO3-N removal efficiency from drainage water at low temperatures. For instance, ongoing research shows that improvement could be achieved by supplementing readily available carbon sources (such as acetate) and adding bacteria with metabolic activity capable of adapting to low temperatures to enhance NO3-N removal [33]. While these biological enhancement approaches can improve denitrification efficiency, overcoming the issue of bio-clogging remains necessary [34]. Given the intensive agricultural activities and climatic characteristics in Minnesota, the drainage entering the bioreactor experiences significant fluctuations throughout the year. Bio-clogging is influenced by flow rates [35], which undoubtedly adds to the challenges. In addition to traditional buried woodchip bioreactors, there are currently three existing sites in the Midwestern United States serving as unique case study locations using pumped bioreactors. These systems have great potential to enhance performance by providing more consistent reactor conditions compared to traditional gravity-fed subsurface denitrifying bioreactors. Although these pumped systems are still in the experimental phase and need to be tested through in-field studies [36], this approach may become an alternative solution in the future. Our bioreactor was located at the end of Dutch Creek where the drainage was relatively easy to pump. Employing a pumping system to ensure stable reaction conditions, such as consistent flow rates, increasing the supply of carbon sources, introducing bacteria strains adapted to low temperatures or adding algaecides, may have improved denitrification efficiency at low temperatures.
Controlling NO3-N in an intensively managed row-crop watershed requires multiple BMPs and not just a bioreactor at the mouth of the watershed. The State of Minnesota, along with the City of Fairmont, moved quickly to secure funding to improve the water quality feeding the Fairmont chain of lakes to provide safe drinking water. By seeking ENRTF funding, the City of Fairmont sought to invest in new technology and test previously untested NO3-N reduction methods. In recent years, new edge-of-field practices such as strategically placed treatment wetlands and saturated buffer zones have provided NO3-N attenuation. Further, channel re-construction with two-stage ditches (TSDs) can reduce NO3-N [37,38]. Research findings indicate that this alternative drainage system, featuring a two-stage ditch, a rock trench, a rock inlet and two in-ditch linear treatment systems, is more naturally stable and capable of absorbing NO3-N while providing a healthy ecosystem. Combined with a cost–benefit analysis, the TSD system could be a value-added BMP! This approach is highly worthy of consideration in the Fairmont area after a thorough analysis of factors in Dutch Creek, including channel slope, channel bottom and bank soils, as well as construction costs.
Therefore, although our study results were not encouraging, the adoption of two-stage ditch designs or pumped bioreactors holds promise for effectively reducing NO3-N and ensuring safe drinking water in the City of Fairmont in the future.
Author Contributions
Conceptualization, J.M.; methodology, J.M. and K.H.; software, L.X.; validation, J.M., K.H. and L.X.; formal analysis, L.X. and K.H.; investigation, J.M. and K.H.; resources, K.H.; data curation, K.M and L.X.; writing—original draft preparation, L.X. and K.H.; writing—review and editing, J.M.; visualization, L.X. and K.H.; supervision, J.M.; project administration, J.M.; funding acquisition, J.M. All authors have read and agreed to the published version of the manuscript.
Funding
This research was funded by ENRTF via LCCMR, M.L. 2019, First Special Session, Chp. 4, Art. 2, Sec. 2, Subd. 04r.
Data Availability Statement
The data used in this study are available upon request from the corresponding author.
Acknowledgments
We are grateful to Barr Engineering for their design of the bioreactor system. Special thanks to City of Fairmont employees and former employees for their assistance with field data monitoring, and to Karina Weelborg, who was in Bioproducts and Biosystems Engineering, for her contribution to providing project background. Additionally, we would like to express our gratitude to the anonymous reviewers for their valuable comments and instructive feedback.
Conflicts of Interest
The authors declare no conflicts of interest.
References
- Nemmers, T.; Spring Biological Nitrate Removal to Protect Drinking Water. City of Fairmont. 2019. Available online: https://www.lccmr.mn.gov/projects/2019/work_plans_june/2019_04r.pdf (accessed on 20 October 2023).
- Addy, K.; Gold, A.J.; Christianson, L.E.; David, M.B.; Schipper, L.A.; Ratigan, N.A. Denitrifying Bioreactors for Nitrate Removal: A Meta-Analysis. J. Environ. Qual. 2016, 45, 873–881. [Google Scholar] [CrossRef] [PubMed]
- Investigate Midwest. Fertilizer Runoff Disproportionately Harms Low-Income Communities’ Drinking Water. Treatment is Expensive—Investigate Midwest (26 August 2021). Available online: https://investigatemidwest.org/2021/08/26/fertilizer-runoff-disproportionately-harms-low-income-communities-drinking-water-treatment-is-expensive/ (accessed on 20 October 2023).
- White, S.A.; Conrad, S.R.; Woodrow, R.L.; Tucker, J.P.; Wong, W.W.; Cook, P.M.; Santos, I.R. Natural attenuation of large anthropogenic nitrate loads in a subtropical stream revealed by δ15N and δ18O. J. Hydrol. 2021, 598, 126077. [Google Scholar] [CrossRef]
- Schipper, L.A.; Cameron, S.C.; Warneke, S. Nitrate removal from three different effluents using large-scale denitrification beds. Ecol. Eng. 2010, 36, 1552–1557. [Google Scholar] [CrossRef]
- Martin County. Available online: https://martinswcd.net/wp-content/uploads/2022/03/2021-Grant-Update-Fairmont-Watershed.pdf (accessed on 23 October 2023).
- Minnesota Legislature 2019 Projects. Available online: https://www.lccmr.mn.gov/projects/2019-index.html#201904r (accessed on 23 October 2023).
- Christianson, L.E.; Cooke, R.A.; Hay, C.H.; Helmers, M.J.; Feyereisen, G.W.; Ranaivoson, A.Z.; Ian, A. Effectiveness of denitrifying bioreactors on water pollutant reduction from agricultural areas. Trans. ASABE 2021, 64, 641–658. [Google Scholar] [CrossRef]
- Illinois Nutrient Loss Reduction Strategy. Available online: https://epa.illinois.gov/content/dam/soi/en/web/epa/documents/water-quality/watershed-management/nlrs/nlrs-final-revised-083115.pdf (accessed on 23 October 2023).
- Iowa Nutrient Reduction Strategy: A Science and Technology Based Framework to Assess and Reduce Nutrients to Iowa Waters and the Gulf of Mexico. (December 2017). Available online: https://www.nutrientstrategy.iastate.edu/sites/default/files/documents/2017%20INRS%20Complete_Revised%202017_12_11.pdf (accessed on 25 October 2023).
- Anderson, W.P.; Wall, D.; Olson, J.L. Minnesota nutrient reduction strategy. In Proceedings of the 2016 10th International Drainage Symposium Conference, Minneapolis, MN, USA, 6–9 September 2016. [Google Scholar]
- Gulf Hypoxia Action Plan 2008y. US EPA (16 June 2008). Available online: https://www.epa.gov/sites/default/files/2015-03/documents/2008_8_28_msbasin_ghap2008_update082608.pdf (accessed on 25 October 2023).
- Schipper, L.A.; Robertson, W.D.; Gold, A.J.; Jaynes, D.B.; Cameron, S.C. Denitrifying bioreactors—An approach for re-ducing nitrate loads to receiving waters. Ecol. Eng. 2010, 36, 1532–1543. [Google Scholar] [CrossRef]
- Warneke, S.; Schipper, L.A.; Bruesewitz, D.A.; McDonald, I.; Cameron, S. Rates, controls and potential adverse effects of nitrate removal in a denitrification bed. Ecol. Eng. 2011, 37, 511–522. [Google Scholar] [CrossRef]
- Christianson, L.E. Design and Performance of Denitrification Bioreactors for Agricultural Drainage. Ph.D. Thesis, Iowa State University, Ames, IA, USA, 2011. [Google Scholar]
- Hoover, N.L.; Bhandari, A.; Soupir, M.L.; Moorman, T.B. Woodchip denitrification bioreactors: Impact of temperature and hydraulic retention time on nitrate removal. J. Environ. Qual. 2016, 45, 803–812. [Google Scholar] [CrossRef]
- Barr Engineering. Habitat Restoration and Nitrate Bioreactor. City of Fairmont. 2021. Available online: https://documentcloud.adobe.com/link/track?uri=urn:aaid:scds:US:46f795ba-5fe7-44ee-986d-8003cdd7645f#pageNum=1 (accessed on 30 October 2023).
- Fan, Y.; Essington, M.; Jagadamma, S.; Zhuang, J.; Schwartz, J.; Lee, J. The global significance of abiotic factors affecting nitrate removal in woodchip bioreactors. Sci. Total Environ. 2022, 848, 157739. [Google Scholar] [CrossRef]
- Rendall, T.J. Effect of Passive and Active Heating on the Performance of Denitrifying Bioreactors. Master’s Thesis, University of Illinois in Urbana-Champaign, Urbana, IL, USA, 2015. [Google Scholar]
- Nordström, A.; Herbert, R.B. Determination of major biogeochemical processes in a denitrifying woodchip bioreactor for treating mine drainage. Ecol. Eng. 2018, 110, 54–66. [Google Scholar] [CrossRef]
- Wrightwood, O.M.; Hattaway, M.E.; Young, T.M.; Bischel, H.N. Assessment of woodchip bioreactor characteristics and their influences on joint nitrate and pesticide removal. ACS ES&T Water 2021, 2, 106–116. [Google Scholar]
- Davis, M.P.; Martin, E.A.; Moorman, T.B.; Isenhart, T.M.; Soupir, M.L. Nitrous oxide and methane production from denitrifying woodchip bioreactors at three hydraulic residence times. J. Environ. Manag. 2019, 242, 290–297. [Google Scholar] [CrossRef]
- Zhu, L.; Shi, W.; Van Dam, B.; Kong, L.; Yu, J.; Qin, B. Algal accumulation decreases sediment nitrogen removal by uncoupling nitrification-denitrification in shallow eutrophic lakes. Environ. Sci. Technol. 2020, 54, 6194–6201. [Google Scholar] [CrossRef]
- Hathaway, S.K.; Bartolerio, N.A.; Rodríguez, L.F.; Kent, A.D.; Zilles, J.L. Denitrifying bioreactors resist disturbance from fluctuating water levels. Front. Environ. Sci. 2017, 5, 35. [Google Scholar] [CrossRef]
- Rivas, A.; Barkle, G.; Maxwell, B.; Moorhead, B.; Stenger, R.; Schipper, L.; Birgand, F.; Clague, J. Determining the spatial variability of nitrate removal in a woodchip bioreactor through high frequency monitoring at multiple locations. In Nutrient Management in Farmed Landscapes: 33rd Annual FLRC Workshop; Farmed Landscapes Research Centre, Massey University: Palmerston North, New Zealand, 2020; Volume 33, pp. 1–11. [Google Scholar]
- Christianson, L.E.; Lepine, C.; Sharrer, K.L.; Summerfelt, S.T. Denitrifying bioreactor clogging potential during wastewater treatment. Water Res. 2016, 105, 147–156. [Google Scholar] [CrossRef]
- Gosch, L.; Liu, H.; Lennartz, B. Performance of a woodchip bioreactor for the treatment of nitrate-laden agricultural drainage water in northeastern Germany. Environments 2020, 7, 71. [Google Scholar] [CrossRef]
- Pluer, W.T.; Hoffman, R.; and Walter, M.T. Reducing stormwater nitrogen with denitrifying bioreactors: Florida case study. J. Sustain. Water Built Environ. 2018, 4, 06018002. [Google Scholar] [CrossRef]
- Christianson, L.E.; Bhandari, A.; Helmers, M.J. A practice-oriented review of woodchip bioreactors for subsurface agricul-tural drainage. Appl. Eng. Agric. 2012, 28, 861–874. [Google Scholar] [CrossRef]
- Christianson, R.; Christianson, L.; Wong, C.; Helmers, M.; McIsaac, G.; Mulla, D.; McDonald, M. Beyond the nutrient strategies: Common ground to accelerate agricultural water quality improvement in the upper Midwest. J. Environ. Manag. Ment 2018, 206, 1072–1080. [Google Scholar] [CrossRef]
- Greenan, C.M.; Moorman, T.B.; Parkin, T.B.; Kaspar, T.C.; Jaynes, D.B. Denitrification in wood chip bioreactors at different water flows. J. Environ. Qual. 2009, 38, 1664–1671. [Google Scholar] [CrossRef] [PubMed]
- Hassanpour, B.; Giri, S.; Pluer, W.T.; Steenhuis, T.S.; Geohring, L.D. Seasonal performance of denitrifying bioreactors in the Northeastern United States: Field trials. J. Environ. Manag. 2017, 202, 242–253. [Google Scholar] [CrossRef] [PubMed]
- Ghane, E.; Feyereisen, G.W.; Rosen, C.J.; Sadowsky, M.J.; Christianson, L.E. Performance of denitrification beds for removing nitrate from drainage water at cold temperatures. In Proceedings of the 2016 10th International Drainage Symposium Conference, Minneapolis, MN, USA, 6–9 September 2016. [Google Scholar]
- Feyereisen, G.W.; Wang, H.; Wang, P.; Anderson, E.L.; Jang, J.; Ghane, E.; Coulter, J.A.; Rosen, C.J.; Sadowsky, M.J.; Ishii, S. Carbon supplementation and bioaugmentation to improve denitrifying woodchip bioreactor performance under cold conditions. Ecol. Eng. 2023, 191, 106920. [Google Scholar] [CrossRef]
- Moghaddam, R.; Barkle, G.; Rivas, A.; Schipper, L. Flow analysis and hydraulic performance of denitrifying bioreactors under different carbon dosing treatments. J. Environ. Manag. 2023, 328, 116926. [Google Scholar] [CrossRef] [PubMed]
- Hartfiel, L.M.; Díaz-García, C.; Christianson, L.E.; Soupir, M.L. Scenario-based techno-economic analysis of pumped denitrification bioreactors. Water Resour. Econ. 2024, 46, 100238. [Google Scholar] [CrossRef]
- Kramer, G.; Peterson, J.; Han, J.; Hansen, B.; Magner, J.; Wilson, B.; Nieber, J. Design and construction of an alternative drainage ditch system. Int. J. Hydrol. 2019, 3, 259–268. [Google Scholar]
- Krider, L.; Kramer, G.; Wilson, B.; Magner, J.; Lazarus, W.; Hansen, B.; Nieber, J. Alternative Agricultural Ditch Designs, NO3-N Treatment, Construction Costs, and Benefits—Mower County, Minnesota, USA. J. Environ. Sci. Eng. 2022, B11, 229–240. [Google Scholar] [CrossRef]
Figure 1.
The Dutch Creek bioreactor and surrounding area (lakes (red polygons), watershed (thick purple line), stream (green line) and bioreactor system (yellow polygon)), located in Martin County (shown in red on the Minnesota map), Fairmont (yellow star on the Minnesota map), Minnesota (a), the on-site bioreactor system (b) and the cross-section diagram of the bioreactor system (c).

Figure 2.
N levels measured on site and in the lab (a), bioreactor water depth (b), N removal rate, the red box indicates the period when the N removal efficiency is relatively high, corresponding to a lower water depth in the bioreactor (c) and temperature measured at several locations across the bioreactor system (d,e), as well as DO and pH levels (f) in the years 2022 and 2023.

Figure 3.
DO measurements at various locations in the bioreactor.

Figure 4.
DO measurements at the influent point with a 90% confidence interval.

Figure 5.
TOC, TSS and S removal efficiency in the bioreactor.


Table 1.
Measured parameters in the study.
| Parameters | Used Tool | Location of Measurements | ||||
|---|---|---|---|---|---|---|
| Water depth | Pressure transducers | AD1 | BP1 | MH2 | ||
| Total nitrogen (N) | N probe | AD1 | MH2 | |||
| Temperature (T) | Sonde | AD1 | BP1 | BP2 | AD2 | MH2 |
| Dissolved oxygen (DO) | Sonde | AD1 | BP1 | BP2 | ||
| pH | Sonde | AD1 | BP1 | BP2 | ||
| Sulfate (S) | Lab equipment | AD1 | MH2 | |||
| Total organic carbon (TOC) | Lab equipment | AD1 | MH2 | |||
| Total suspended solids (TSS) | Lab equipment | AD1 | MH2 | |||
| Total nitrogen (N) | Lab equipment | AD1 | MH2 | |||
Table 2.
N measurements in the years 2022 and 2023.
| Mean of N (mg/L) | p-Value | ||
|---|---|---|---|
| Influent | Effluent | ||
| 2022 (April–August) | 12.4 (1.34) | 10.4 (2.47) | 0 |
| 2023 (March–June) | 12.6 (3.63) | 12.4 (3.44) | 0.68 |
Table 3.
T measurements at different locations across the bioreactor system.
| T (°C) | |||||
|---|---|---|---|---|---|
| Influent–Effluent | BP1top–BP1bottom | BP2top–BP2bottom | BP1top–BP2top | BP1bottom–BP2bottom | |
| Difference in mean | 0.53 (1.95) | 0.13 (1.46) | 0.70 (1.07) | −0.39 (1.30) | 0.17 (1.08) |
| p-value | 0.47 | 0.86 | 0.35 | 0.61 | 0.81 |
Table 4.
DO measurements in the years 2022 and 2023.
| Bioreactor DO (mg/L) | |||
|---|---|---|---|
| 25 Percentiles | Average | 75 Percentiles | |
| 2022 (July–August) | −0.026 | 0.048 (0.14) | 0.049 |
| 2023 (April–May) | 0.027 | 1.85 (3.29) | 1.84 |
Disclaimer/Publisher’s Note: The statements, opinions and data contained in all publications are solely those of the individual author(s) and contributor(s) and not of MDPI and/or the editor(s). MDPI and/or the editor(s) disclaim responsibility for any injury to people or property resulting from any ideas, methods, instructions or products referred to in the content. |
© 2024 by the authors. Licensee MDPI, Basel, Switzerland. This article is an open access article distributed under the terms and conditions of the Creative Commons Attribution (CC BY) license (https://creativecommons.org/licenses/by/4.0/).
Share and Cite
MDPI and ACS Style
Xu, L.; Holmberg, K.; Magner, J. The Evaluation of a Novel Denitrifying Woodchip Bioreactor: Fairmont, MN, USA. Nitrogen 2024, 5, 152-162. https://doi.org/10.3390/nitrogen5010010
AMA Style
Xu L, Holmberg K, Magner J. The Evaluation of a Novel Denitrifying Woodchip Bioreactor: Fairmont, MN, USA. Nitrogen. 2024; 5(1):152-162. https://doi.org/10.3390/nitrogen5010010
Chicago/Turabian StyleXu, Limeimei, Kerry Holmberg, and Joe Magner. 2024. "The Evaluation of a Novel Denitrifying Woodchip Bioreactor: Fairmont, MN, USA" Nitrogen 5, no. 1: 152-162. https://doi.org/10.3390/nitrogen5010010