
Crop Rotation and Nitrogen Fertilizer on Nitrate Leaching: Insights from a Low Rainfall Study
by
 , ,
, ,
Isabeli P. Bruno
1,*,
Augusto G. Araújo
2,
Gustavo H. Merten
3,
Audilei S. Ladeira
4 and
Victor M. Pinto
5 1
Area of Agrometeorology, Ecophysiology and Food Technology, Paraná Rural Development Institute (IAPAR-EMATER), Londrina 86047-902, Brazil
2
Independent Researcher, Londrina 86047-902, Brazil
3
Department of Civil Engineering, Swenson College of Science and Engineering, University of Minnesota Duluth, Duluth, MN 55812, USA
4
Area of Agricultural Engineering, Paraná Rural Development Institute (IAPAR-EMATER), Londrina 86047-902, Brazil
5
Laboratory of Soil Physics, Center for Nuclear Energy in Agriculture, University of São Paulo, Piracicaba 13416-000, Brazil
*
Author to whom correspondence should be addressed.
Nitrogen 2024, 5(2), 329-348; https://doi.org/10.3390/nitrogen5020022
Submission received: 8 March 2024
/
Revised: 9 April 2024
/
Accepted: 17 April 2024
/
Published: 19 April 2024
(This article belongs to the Special Issue Nitrogen Management and Water-Nitrogen Interactions in Agriculture)
Abstract
:The intensive use of agricultural fertilizers containing nitrogen (N) can increase the risk of nitrate (NO3−) leaching. However, little information exists regarding its interaction with other factors that influence NO3− leaching, such as no-tillage, which is associated with different crop rotation schemes. The objective of this study was to quantify the leachate NO3− concentration and load below the root zone in two different crop rotations under no-tillage, with and without mineral N fertilizer. The experiment was conducted in a no-tillage area in Brazil between 2018 and 2020. The factors were two crop rotations (diversified and simplified) and two N fertilization managements (with and without N fertilizer). The soil solution was collected with suction lysimeters (1 m depth), the NO3− concentration (mg L−1) was spectrophotometrically determined, and the NO3− load (kg ha−1) was calculated from the volume of water drained and the NO3− concentration. The results were categorized into 24 evaluation periods. NO3− leaching was extremely low due to low rainfall throughout the experiment, with no significant differences between the factors and treatments. In the presence of N fertilization, leaching was substantially greater when rainfall increased, and vice versa. No significant difference was observed between the crop rotation schemes, except for one period in which the simplified soybean rotation exhibited high leaching. The evaluated treatments showed less NO3− leaching during the four periods when grass species were cultivated, indicating the importance of grasses in rotation systems.
1. Introduction
Nitrogen (N) is an essential element for any plant; therefore, N fertilizer (organic or mineral) is the main input in agricultural production. Excessive N fertilizer use can negatively impact the environment, resulting in decreased drinking water quality and surface water deterioration, eutrophication, and the subsequent occurrence of harmful cyanobacterial blooms, leading to the formation of “dead zones” in rivers, lakes, and oceans, as well as harm to fisheries and tourism [1,2,3,4]. These effects are gaining increasing attention as fertilizer consumption increases annually. Global agriculture consumed more than 108 million metric tons in 2021, when the top consumers were China, India, the USA, and Brazil [5]. Another relevant N input in agroecosystems is the symbiotic association between plants and N-fixing microorganisms [6], which can also result in the loss of this nutrient. In 2021, global agriculture received around 40 million metric tons of N through biological fixation [7], which is still relevant, despite being lower than the amount from fertilizer.
Estimates indicate that up to 70% of the total N available to plants is lost to the environment [8], with NO3− leaching being the major contributor [9]. NO3− is the predominant mineral form of N in most soils and remains free in soil solutions owing to its reduced electrostatic adsorption, leading to easy leaching and quick passage to subsurface and surface waters [2,10,11], which ultimately impacts the environment. NO3− leaching in the soil is a complex process, and its extent depends on several factors, such as soil characteristics (e.g., anion exchange capacity, texture, and hydraulic conductivity), plant characteristics (e.g., species and growth stage), and N fertilizer application rates in agriculture [12]. This complexity increases in no-tillage areas owing to different management schemes and cultivated species. Two major, simultaneous effects influence NO3− leaching in long-term no-tillage: the accumulation of organic matter over time and the increased number and continuity of macropores [13].
Brazilian no-tillage agriculture has developed substantially, reaching the equivalent of 61% of the total annual crop area in the country in 2017 [14,15]. Especially in the southern, southeastern, and central-western regions, no-tillage is based on the sequential cultivation of soybeans in spring/summer and corn in autumn/winter [15]. This management offers two commodities that are advantageous from a commercial perspective. In addition, corn provides a large amount of plant residues for soil cover, and soybean fixes atmospheric N. Regardless of these positive aspects, the continuous implementation of soybean–corn rotation subverts one of the fundamental principles of the no-tillage system, which is the diversification of plant species through crop rotation [16,17]. Despite controversies and only a few conclusive studies on the subject, long-term no-tillage with diversified crop rotation (cover crops and commercial species) is considered a soil management system with lower NO3− loss through leaching than conventional management [18,19,20,21]. However, studies on NO3− leaching in long-term no-tillage systems that compare diversified and simplified cropping rotations under subtropical agricultural conditions are scarce. Unlike other countries, Brazil, one of the major players in world agriculture [22], has conducted relatively few studies on NO3− leaching [23]. The objective of this study was to investigate NO3− leaching in no-tillage systems with simplified (soybean–corn) and diversified (corn, soybean, wheat, and cover crops) crop rotations, with and without N fertilization. The specific aims of this study were: (1) to determine the effect of two crop rotations (simplified and diversified) on NO3− leaching, (2) to determine the effect of N fertilization on NO3− leaching, and (3) to investigate the possible interaction of crop rotation and N fertilization on NO3− leaching in a long-term no-tillage system. The study was based on the hypothesis that crop rotation and N fertilization influence NO3− leaching. It was expected that simplified crop rotation would lead to less leached nitrate, whereas under nitrogen fertilization, there would be greater leaching.
2. Materials and Methods
2.1. Experimental Area
The experiment was conducted between 2018 and 2020 at the Experimental Farm of the Institute of Rural Development of Paraná (Instituto de Desenvolvimento Rural do Paraná—IDR-Paraná), Londrina, Paraná, Brazil, located at a latitude of −23.37°, a longitude of −51.17°, and an altitude of 585 m. According to the Köppen–Geiger classification, the climate of Londrina is Cfa (humid subtropical with hot summers) [24]. The city is located on the third plateau of Paraná and has soils formed from basic eruptive rocks [25]. The soil is classified as oxisol [26,27], with an extremely clayey texture.
Soil samples for physical analysis were randomly collected from the experimental area before beginning the experiment, at depths of 0–40 cm (60 samples) and 40–80 cm (30 samples). The average grain size fraction (pipette method) in the 0–80 cm layer was 8% sand, 15% silt, and 77% clay. In the 0–40 cm and 40–80 cm layers, the densities (volumetric cylinder) were 1.3 g cm−3 and 1.1 g cm−3, respectively; the total pores (Richard’s chamber) were 52% and 56%, with macropores accounting for 6% and 10%, respectively. Micropores accounted for 46% of both layers. The hydraulic conductivity of the soil (Darcy’s equation) was 27 mm h−1 and 39 mm h−1 at 0–40 cm and 40–80 cm, respectively [28].
Soil chemical analyses were performed on composite samples (one sample per plot) collected at 0–20 cm depth before planting each crop. The following soil fertility characteristics were determined using the respective methods: active acidity (pH) using CaCl2 (0.01 mol∙L−1); carbon (C) using Walkley–Black; phosphorus (P) and potassium (K) using Mehlich I; calcium (Ca), magnesium (Mg), and aluminum (Al) using KCl M as extracting solution; potential acidity as H + Al; sum of bases (SB) = Ca + Mg + K; cation exchange capacity at pH 7.0 (CEC); and base saturation (V) = 100 × SB/CEC. The soil fertility analysis for each crop season is presented in Table 1.
The average slope of the experimental area was 6%, which corresponds to the gently undulating relief [26]. Surface runoff was not observed during the study because of the low slope, permanent vegetation cover, and soil type, which favor water infiltration.
The area has been cultivated in a no-tillage system with diversified crop rotation for 14 years. One year before the experiment, an intercrop of cover species (black oats + palisade grass + field peas) was established throughout the experimental area, which was chemically (glyphosate) and mechanically (knife roller) managed during spring. Approximately a month after soil management, soybean sowing was performed in the entire area. The evaluations were conducted after the soybean harvest in the fall of 2018, which concluded in the fall of 2020.
2.2. Experimental Design and Management
The experimental area was 4500 m2 (150 m × 30 m), with 16 plots of 125 m2 each (5 m × 25 m), and the remaining area was used as a border. The experiment was conducted using a factorial scheme with two factors and four treatments (combinations of factor levels) in a randomized complete block design with four replicates. These factors were the rotation system (simplified, with alternating corn and soybeans in autumn/winter and spring/summer, respectively; diversified, with soybean, corn, and different cover crop species in spring/summer and autumn/winter) and N fertilization management (with and without mineral fertilization). Factor combinations included the following treatments: simplified rotation with N fertilization, simplified rotation without N fertilization, diversified rotation with N fertilization, and diversified rotation without N fertilization.
The cultivated species were millet (Pennisetum glaucum ‘BRS 1501′—Embrapa), black oats (Avena strigosa ‘IAPAR 61’—IDR-Paraná), and field peas (Pisum sativum subsp. arvense ‘IAPAR 83′—IDR-Paraná); field radishes (Raphanus sativus ‘IPR 116’—IDR-Paraná) and corn (Zea mays ‘IAPAR 164’—IDR-Paraná); and palisade grass (Urochloa brizantha ‘Marandu’—Embrapa), soybean (Glycine max ‘BMX Potência RR’ in the spring/summer of 2018/2019 and ‘BRS 467RR’ in the spring/summer of 2019/2020—Embrapa), buckwheat (Fagopyrum esculentum ‘IPR 92 Altar’—IDR-Paraná), and wheat (Triticum aestivum ‘IPR Potyporã’—IDR-Paraná). The cultivation schemes for the production cycles of each planted species are presented in Table 2.
Urea [CO(NH2)2] was used as a fertilizer in the N-fertilized plots at a rate established according to the cultivated species, the expected yield for a given crop, and, in the case of corn, whether it was the first or second crop season. Therefore, the N application rate varied among different species, harvests, and installment plans. Although N fertilization is not recommended for soybeans in Brazil, some farmers use it during sowing. Thus, the rate used for the fertilized soybean plots in this study was the mean rate used by farmers in the region. Information on sowing, fertilization, and harvesting is presented in Table 2.
During sowing, the plots were fertilized with P and K according to the chemical analyses of the soil and recommendations for each species [29]. Phytosanitary control was maintained throughout the experimental period according to the technical recommendations for each species.
The plots were managed with no-tillage, mechanized sowing, 50 cm row spacing for soybean and corn, and 17–19 cm spacing for the other species. The central 10 m2 of each plot was manually harvested when the grains of the commercial species attained 13% moisture. To estimate the grain yield, we extrapolated the quantity produced from 10 m2 to 1 ha. The cover crops were managed with herbicides upon flowering. After desiccation, we collected 1 m2 of plant mass per plot to estimate the dry biomass yield of the cover crops using the same extrapolation method. Knife roller management was then performed to lodge the cover crop residues in the soil.
Salvage irrigation with a cannon-type sprinkler was performed for all treatments to prevent plant death during periods of low rainfall. Irrigation was provided for only five months in 2018: April (76 mm), May (35 mm), June (36 mm), July (21 mm), and December (127 mm). In the other months, no irrigation was provided due to equipment failure, even during water deficits, which was a limitation of the study.
2.3. Soil Solution Collection
The soil solution was sampled using a suction lysimeter. Six months before the start of the experiment, two lysimeters were installed per plot, 9 m equidistant from each other and 8 m from the plot borders, for a total of 32 lysimeters. The center of the porous capsule of each lysimeter was positioned at a 1 m depth and, therefore, below the root zone of the cultivated species. A manual piston pump was used to generate a vacuum of −60 kPa in the lysimeter to collect soil solution samples. The lysimeter construction and operation were adopted from Bajracharya and Homagain [30].
A vacuum was generated in the lysimeters at the end of each day after a rain event of at least 20 mm, which resulted in some or no collection, depending on the dry period and the volume of rain during the previous days. Soil solution samples were collected in duly-identified 100 mL plastic containers the next morning. Each sample consisted of soil solutions collected from the two lysimeters in each plot. Samples were placed in a thermal box with ice and stored in a refrigerator (5 °C); NO3− concentrations could be determined either on the same day or up to a week later when stored in the freezer (−14 °C).
Soil solution samples were collected during the 2018/2019 and 2019/2020 evaluation seasons. Each evaluation season was a two-crop season: autumn/winter 2018 and spring/summer 2018/2019 crops in 2018/2019, with a fallow period between them; and autumn/winter 2019 and spring/summer 2019/2020 crops in 2019/2020 (Table 3). The results are presented considering the mean NO3− concentrations between two successive collection dates. This time interval was designated as the period, totaling 24 periods throughout the experiment. In the 2018/19 evaluation season, 13 soil solution samples were collected between 3/22/2018 and 1/10/2019, which correspond to periods 1–12, and in the 2019/20 evaluation season, 13 different soil solution samples were collected between 5/9/2019 and 1/15/2020, corresponding to periods 13–24 (Table 3). Although the experiment ended in March 2020, after the soybean harvest, the last soil solution extraction occurred in January 2020 because of low rainfall following that month (Figure 1a). Collections were also performed during the fallow period between August and October 2018, but not during buckwheat cultivation, nor at the beginning of the off-season corn cultivation in autumn/winter 2019 (March–April 2019) because of low soil moisture.
2.4. Meteorological Data
Monthly accumulated rainfall (Figure 1a) and average temperature (Figure 1b) values were calculated from daily data provided by the Automatic Meteorological Station of the Technology and Environmental Monitoring System of Paraná (Sistema de Tecnologia e Monitoramento Ambiental do Paraná), located in the IDR-PARANÁ experimental station. The same data were used to calculate the accumulated rainfall and average temperature for each of the 24 periods. Historical accumulated precipitation and average temperature values for 1976–2016 (Figure 1) were obtained from records of the IDR-Paraná agrometeorology sector of Londrina [31]. The same source provided data to calculate actual evapotranspiration (ETR) (Figure 1a) using the Soil–Water–Atmosphere–Plant (SWAP) model [32]. The ETR was calculated until 12 March 2020, when the final experimental sample was collected.
2.5. Drainage
The volume of drained water was estimated to calculate the NO3− load lost below the root zone. The SWAP model [32] was used for this estimation at a depth of 1 m. The SWAP model uses Richard’s equation and includes root water extraction to simulate the movement of water, solutes, and heat in the unsaturated soil zone during plant growth stages. In this model, the transport processes are predominantly vertical (one-dimensional), and the vertical domain varies from a plane just above the canopy to a plane in shallow groundwater [33]. The model considers environmental (e.g., maximum and minimum temperatures, solar radiation, relative humidity, and wind speed) and plant information (e.g., sowing and harvesting date, beginning of the vegetative and reproductive phases, effective depth of the root system, and leaf area). For calculations, this study considered only data related to the species used in simplified rotation (corn or soybean), and drainage was kept constant among all treatments, owing to difficulties in measuring the leaf area of plants cultivated in intercropped or mixed schemes. Hence, the drainage estimates were the same for the two rotation systems analyzed, which is a limitation of our study. The leaf area of soybean was calculated according to Richter et al. [34], and that of corn was calculated according to Guimarães et al. [35]. More information about the model can be obtained from SWAP [32] and studies by Kroes et al. [33] and Pinto [36].
2.6. Calculation
2.6.1. NO3− Concentration and Load
The NO3− concentration in the soil solution was analyzed in duplicate using the spectrophotometric method in the ultraviolet region at 220 and 275 nm, as described in the Standard Methods for the Examination of Water and Wastewater [37].
The leachate NO3−, expressed in kg ha−1 of NO3−, was also calculated for each period (Table 3). The load calculation considered the mean concentration and the sum of the volume of water drained below a 1 m depth between two collection dates using the following equation, according to the procedure adapted from Rosolem et al. [38]:
where D (mm) is the sum of the drained water volumes between two consecutive soil solution collections; C (mg L−1) is the mean NO3− concentration between two consecutive collections; and 0.01 is the unit conversion factor.
The concentration results are expressed in mg L−1 of NO3−, not in mg L−1 of N-NO3− because the identified values were extremely low. To discuss the results, literature data were transformed from N-NO3− to NO3− by multiplying them by a conversion factor of 4.43.
2.6.2. Statistical Analysis
Statistical analyses were performed using Statistica® software (version 14.0.015). Mean comparisons of nitrate leaching concentration and load for all 12 periods in each evaluation season and for each period separately in each evaluation season were performed using a two-way analysis of variance (ANOVA) using a randomized complete block design with two crop rotation levels and two N fertilization levels as independent variables and four blocks as a random factor. ANOVA was used to evaluate significant differences in crop yield between treatments and the interaction of crop rotation and N fertilization on NO3− leaching. Repeated measures ANOVA for means comparison between nitrate leaching concentration and load between periods in each evaluation season was performed with crop rotation (two levels), N fertilization (two levels), and period (12 levels) as independent variables and four blocks as a random factor. Tukey’s test was used to compare the mean values of significant differences. The significance level was set at <5% probability. Before any statistical analyses, the Shapiro–Wilk test was used to check whether the residuals followed a normal distribution.
The SWAP model used for drainage estimation was calibrated from 2017 to 2019 using 13 samples of volumetric soil water content data (θ) at two depths (10 and 60 cm) and validated using new data. Leaf area indices for maize and soybeans were calculated during the two evaluation seasons [34,35]. The SWAP crop file parameters were acquired from the online WOFOST dataset [39]. The model effectively predicted soil water content in the validation phase with the following performing statistical indices: root mean square error (RMSE) of 0.017 cm3 cm−3 and 0.014 cm3 cm−3 for 10 cm and 60 cm depths, respectively; index of agreement (d) [40] of 0.86 for both depths; and the Nash-Sutcliffe efficiency (NSE) model [41] of 0.72 and 0.67 for 10 cm and 60 cm depths, respectively. The cited statistical metrics and their use in field-scale crop models, validation, and the calibration of soil water dynamics can be found in Groenendijk et al. [42].
3. Results
Table 4 presents the grain yield for commercial species and the dry mass for cover crops across crop seasons. Only the autumn/winter 2019 simplified rotation with corn showed a significant difference in yield between treatments with and without N fertilization (Table 4). In this case, the unfertilized plots produced almost 600 kg ha−1 more harvest than the fertilized plots, but both had lower yields than the national average of just over 5600 kg ha−1. All plots presented lower yields owing to severe water deficits, which occurred from germination to harvest (periods 13–19; Figure 2).
Analyzing the rainfall and irrigation data, ETR, accumulated drainage, and average atmospheric temperature for each of the 24 periods (Figure 2) indicated period 3 as having the highest accumulated rainfall and irrigation, as well as ETR, despite the mild average atmospheric temperature (19 °C). Period 3 spanned from 20 April to 28 August 2018, covering most of the irrigation events during the experiment, which explains the higher ETR.
The total drainage in autumn/winter 2018, fallow 2018, spring/summer 2018/2019, autumn/winter 2019, and spring/summer 2019/2020 was 205, 164, 366, 70, and 235 mm, respectively.
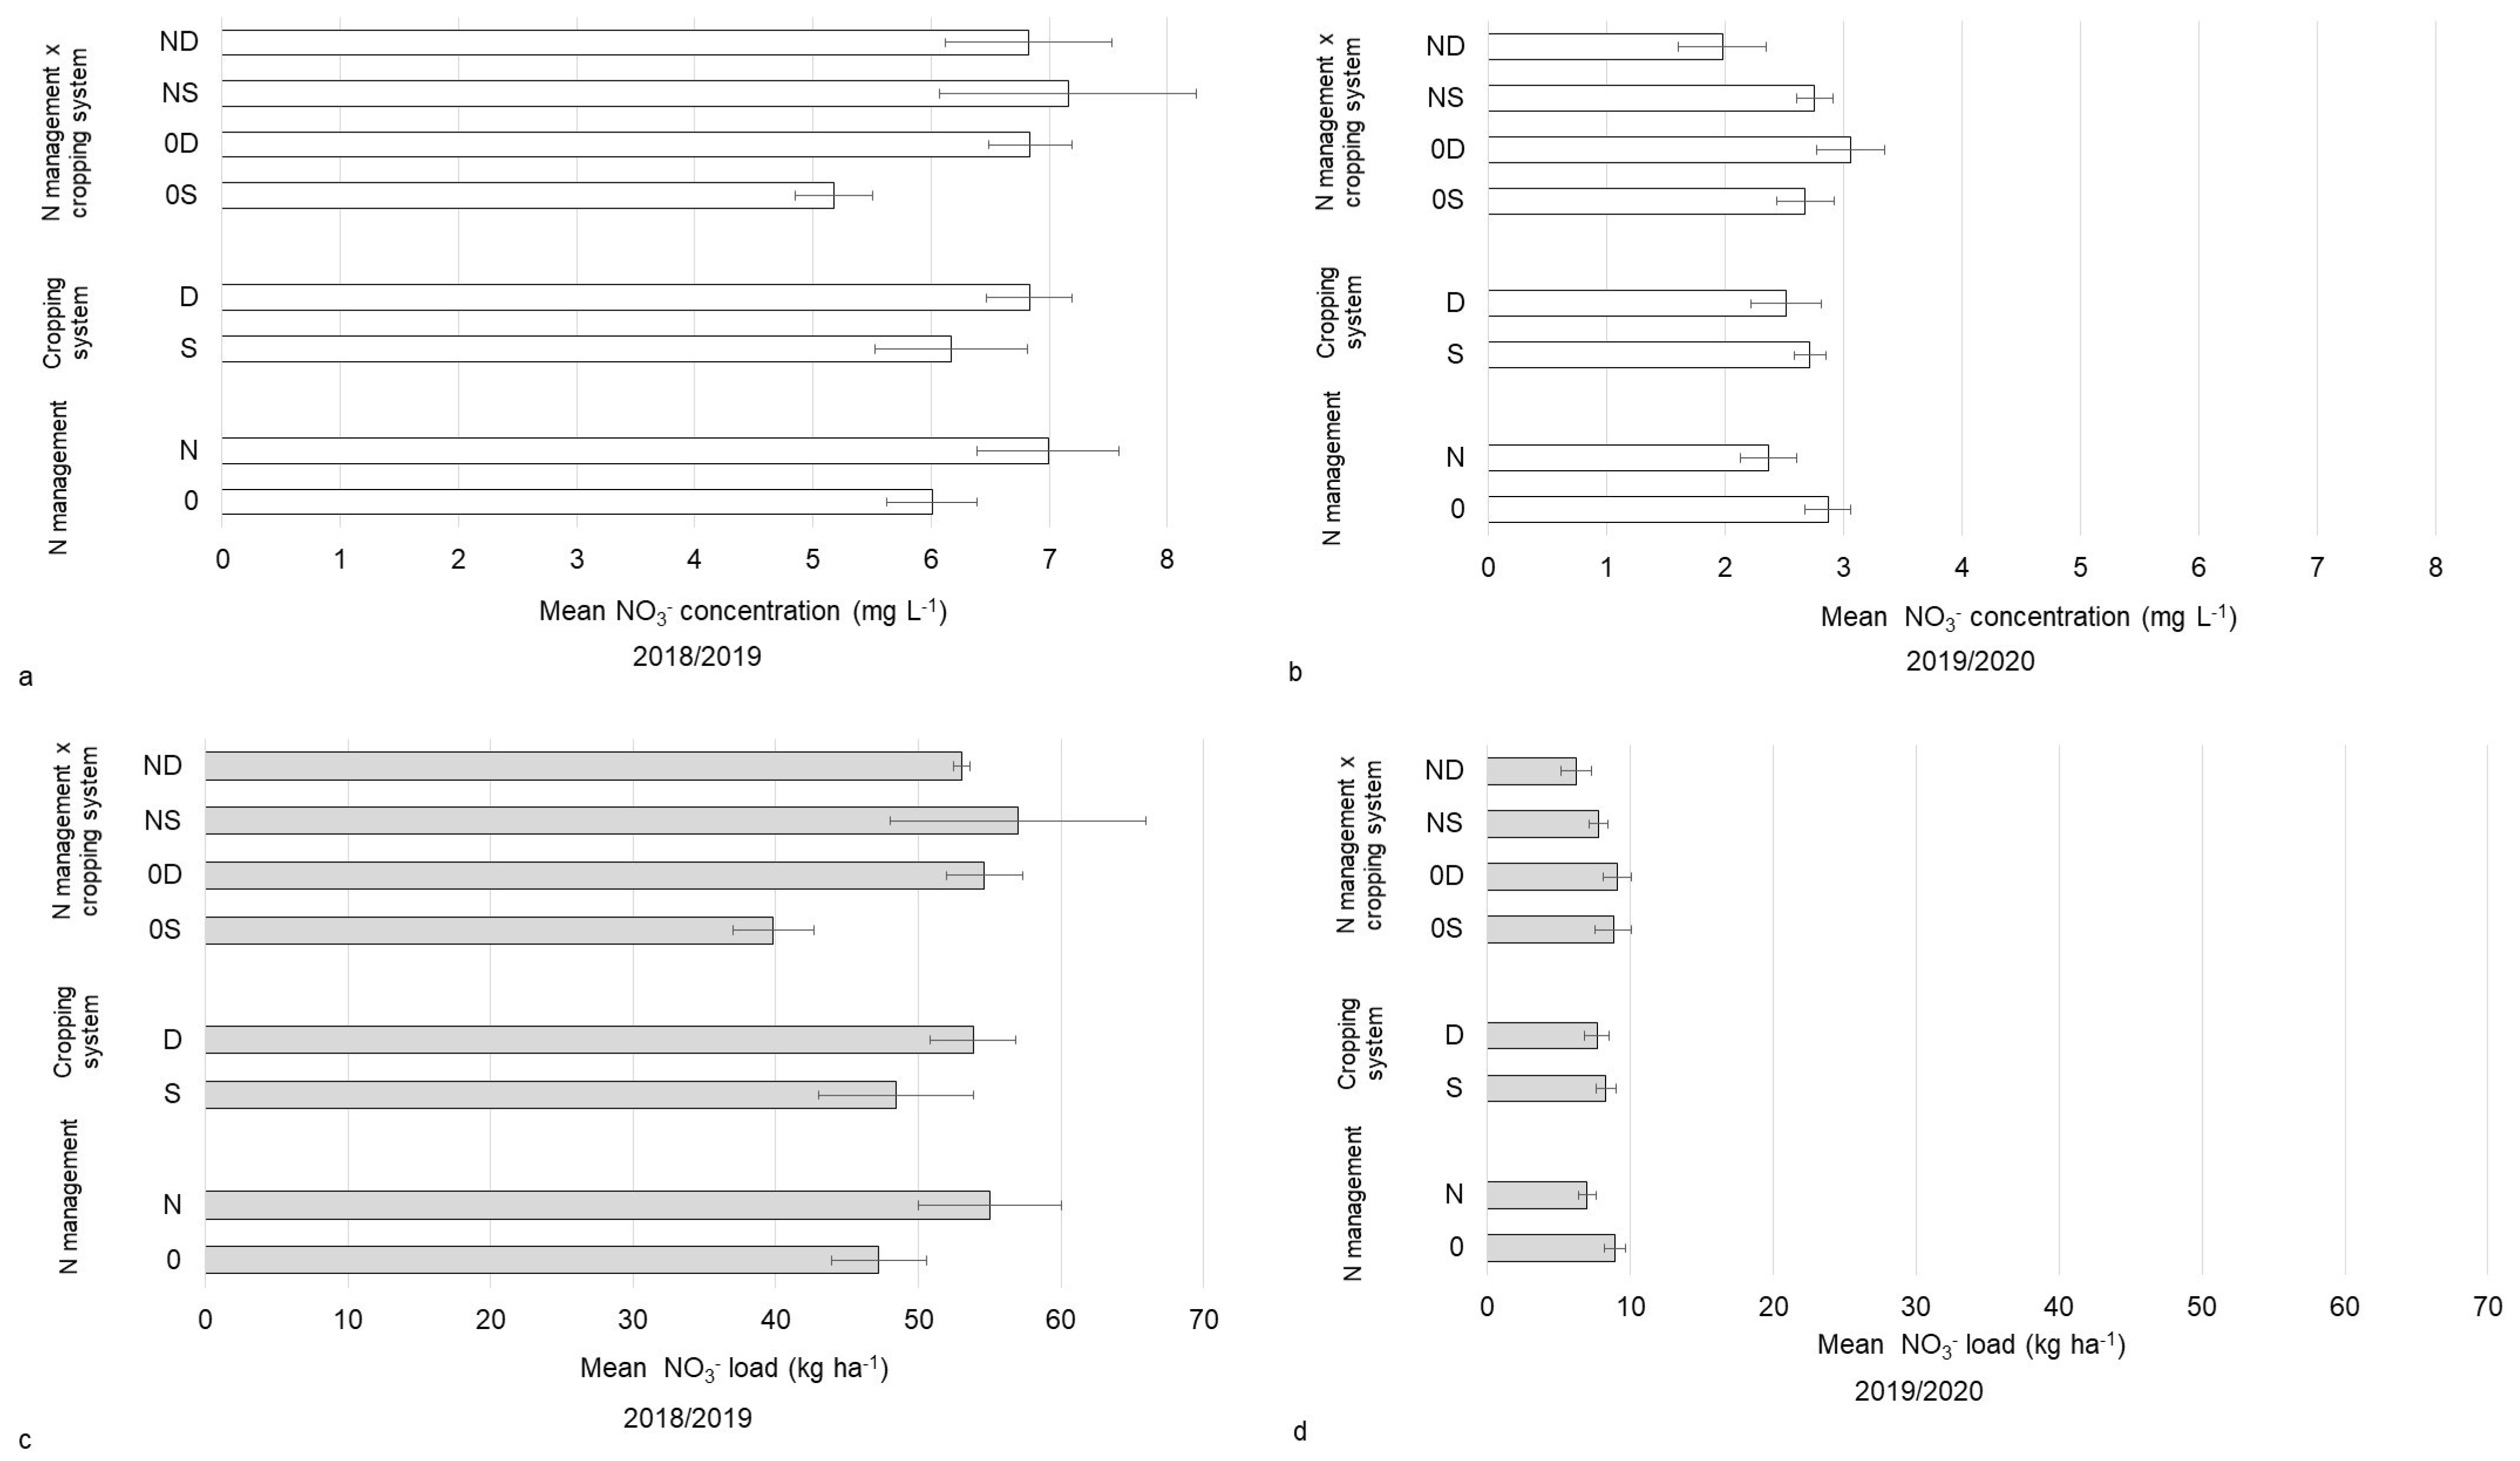
Figure 3 shows the NO3− concentrations and load results for the entire experimental period. No significant differences were observed between the factors or treatments in terms of NO3− concentration and load during the two evaluation seasons. In the 2018/2019 evaluation season, the NO3− concentration among all treatments ranged between 5.2 and 7.2 mg L−1 for the simplified rotation, without and with N fertilizer, with a mean of 6.5 mg L−1. In 2019/2020, the mean concentration was lower, 2.6 mg L−1 of NO3−, ranging from 2.0 to 3.1 mg L−1 for diversified rotation, with and without N fertilizer. The leachate NO3− load followed a concentration trend with means of 51 (range: 40–57 kg ha−1) and 8 kg ha−1 (range: 6–9 kg ha−1) for the 2018/2019 and 2019/2020 evaluation seasons, respectively.
Comparisons of the mean NO3− concentration and load in the leached soil solution of all treatments over the 24 periods are presented in Figure 4. In 2018/2019, the highest NO3− concentrations occurred in period 2 (March–April 2018), followed by periods 1 (March 2018) and 3 (April–August 2018), with similar load trends. Both the NO3− concentration and load were extremely low during the 2019/2020 evaluation season.
Table 5 and Table 6 present the mean leachate NO3− concentrations and loads for each period, for each level of the two factors, and their interactions, respectively. The mean leachate NO3− concentration and load indicated that plots with N fertilization had greater NO3− leaching during periods 4, 5, and 6, whereas the opposite occurred during periods 10, 11, 20, and 21 (Table 5 and Table 6). These results indicated a tendency for greater NO3− leaching in plots that received previous fertilization after periods of high rainfall/irrigation (period 3, Figure 2) and under fallow conditions (periods 4, 5, and 6, Table 3). Under low rainfall conditions (periods 10, 11, 20, and 21, Figure 2), the plots without fertilization leached more than the fertilized plots.
A significant difference between cropping systems was only observed in period 12 (Table 5 and Table 6), when leachate NO3− concentrations and loads were higher in plots with simplified soybean rotation.
A significant leaching difference was present among interaction factors in treatments only during the four periods (4, 10, 17, and 19) that shared a common characteristic of grass crops in lower NO3− leaching areas (Table 5 and Table 6). Although period 4 corresponded to fallow, corn was previously grown in simplified rotation plots, and covered crops were grown in diversified rotation (Table 3). In period 4, the simplified rotation without N fertilizer showed the lowest leaching, and the simplified rotation with fertilizer showed the highest leaching (Table 5 and Table 6). The diversified rotation treatment with N fertilization resulted in less leaching during periods 10, 17, and 19 (Table 5 and Table 6). During period 10, the cultivated species in this treatment were corn intercropped with palisade grass and wheat during periods 17 and 19 (Table 3).
4. Discussion
The corn, wheat, and soybean grain yields (Table 4) were consistent with the national average [43,44,45]. Only the yield of intercropped corn and palisade grass in the spring/summer rotation of 2018/2019 (periods 8 to 12) was higher than the Brazilian average (6250 kg ha−1), even with a water deficit from the second month after sowing (Figure 1 and Figure 2). For these crops, the corn yield was approximately 1000–1700 kg ha−1 above the national average yield for non-fertilized and fertilized plants, which did not differ significantly from each other.
In autumn/winter 2019, unfertilized plots in simplified rotation with corn produced significantly more than the fertilized plots (Table 4). However, both were below the national average, probably due to a water deficit in critical phases (Figure 1). Water deficit during the flowering stage leads to negative effects on phenological and yield traits, as it damages several corn production characteristics, such as the number and weight of grains [46], which was aggravated by the presence of fertilizer. However, this finding does not corroborate the results of some studies that specifically used N fertilizer to increase tolerance to water stress [47,48] but concurs with the results of Mansouri-Far et al. [49], who showed that a higher N dose under water deficit conditions imposed at the reproductive stage did not improve yield. Furthermore, the second corn crop was raised when the average air temperature was above the local historical average for all months (Figure 1 and Figure 2). The combination of heat and water stress increases the negative effects of these factors on the yield compared to the results of each factor separately [50].
Period 3 had the highest rainfall and irrigation sum, decreasing soon after mainly as a result of reduced rainfall (Figure 2). In non-irrigated areas, NO3− leaching from layers below the root zone depends directly on rainfall because its formation via nitrification depends on soil moisture, in addition to ion transportation to deeper layers [51,52]. Additionally, rainfall determines the NO3− concentration and load in the soil solution [53]. The experimental period (January 2018 to March 2020) presented an atypical volume of accumulated monthly rainfall. Although rainfall in some months was higher than expected, the amount of rain in most months was below the historical average from 1976 to 2016 (Figure 1a). The annual historical average of accumulated rainfall was 1635 mm, whereas the expected accumulated rainfall for the first three months was 548 mm. The accumulated rainfall deficits were 117 and 398 mm in 2018 and 2019, respectively. In the first three months of 2020, this accumulated deficit was 272 mm, resulting in a total of 787 mm over the experiment (Figure 1a).
Atmospheric temperature also plays an important role in the nitrification process, and its optimal levels vary according to the type of environment [51]. High temperatures are common in the tropics but rarely limit the nitrification process [12]. The average atmospheric temperature in most months of the experimental period was above the historical average; it was approximately 1.8 °C higher in 2019 (Figure 1b). The temperature rise could have increased nitrification and, consequently, the concentration and load of NO3− in the leachate, which did not occur, however, due to the rainfall deficit (Figure 1a) [53,54,55].
Drainage was higher in period 8 owing to several rainfall events that accumulated to 176 mm. In addition, other factors contributed to the increased drainage during this period, such as low ETR and mild temperatures (Figure 2). The ETR directly affects the volume of water drained; thus, a higher value indicates lower availability for drainage. The drainage values were much lower than those found by Rosolem et al. [38], who obtained drainage sums between 533 and 595 mm per crop season in soil with a similar texture in Brazil. Drainage depends not only on the amount of rain but also on other factors, such as the type of soil [56]; however, we could not observe oxisol behavior similar to that of sandy soils in terms of drainage [12], probably due to the abnormal rainfall pattern and lack of irrigation (Figure 1 and Figure 2).
The NO3− concentrations and load values were low during the experimental period (Figure 3) because of the water deficit resulting from scarce rainfall (Figure 1 and Figure 2). This was also observed by Ghiberto et al. [57] in an oxisol area with conventional sugarcane planting in Brazil. They reported low N loss via leaching, with more than half in the form of NH4+ and only 37% in the form of NO3− (2 kg ha−1). The greater amount of NH4+ in that study indicated that the lack of soil moisture was responsible for the lower NO3− formation via nitrification. The authors attributed the low amount of leached N to a water deficit because the precipitation was 141 mm lower than the normal amount. In contrast, several studies have reported much higher NO3− concentrations and loads than those reported in this study. In a field study in Brazil, Rosolem et al. [38] observed leaching losses with NO3− concentrations in the range of 89–111 mg L−1 and NO3− loads of 68–144 kg ha−1 in no-tillage soybeans with cover crop rotation in clayey soil. Bortolotto et al. [58] found annual NO3− losses of 65 and 463 kg ha−1 for N rates of 400 and 800 kg ha−1 applied as fertilizer, respectively, in sandy soil cultivated with fertigated coffee trees in Brazil. Hussain et al. [10] found an NO3− concentration of 42 mg L−1 and leaching losses of up to 156 kg ha−1 of NO3− in a field experiment with corn in the US.
Considering all treatments, the initial periods presented higher values of leachate NO3− concentration and load (Figure 4a,c), reflecting the presence of N compounds in the soil and the previous water regime. In period 2, for example, all N fertilization had already been performed in plots receiving fertilizer, which influenced the mean concentration and load. A study in China conducted by Xin-Qiang et al. [54] achieved a similar result, which showed high NO3− leaching in the presence of N fertilizer, with the load increasing at an increasing rate. In addition, a meta-analysis by Wang et al. [59] concluded that soil NO3− leaching emission factors increased with increasing N application rates.
Regarding the water regime, the rainfall deficit in February was compensated for in January, which had 176 mm more rain than the normal amount (Figure 1a and Figure 2). Thus, in period 2, the water available in the soil was sufficient to promote nitrification, and excess NO3− leaching occurred (Figure 4a,c). Despite the excessive rainfall in August and October 2018, the rainfall deficit in the previous months (Figure 1a) did not allow the same process to be repeated in the evaluations from period 4, which showed even lower concentrations and loads (Figure 4). Another reason for the low NO3− concentrations and load values is that the no-tillage system provided less NO3− leaching than conventional management [60]. This, associated with the lack of rainfall, likely caused the low NO3− concentrations and loads observed from period 4 onwards (Figure 4).
Table 5 and Table 6 results suggest a propensity for increased leaching of NO3− in plots that had received prior fertilization following periods of heavy rainfall/irrigation (period 3, Figure 2) and during fallow conditions (periods 4, 5, and 6, Table 3). This direct relationship between N fertilization and increased NO3− leaching was also observed by Xin-Qiang et al. [54] in wheat crops and by Pasley et al. [61] in a modeling study of corn and soybeans. This finding also corroborates that of Meisinger et al. [62], who stated that the intensity of NO3− loss via leaching depends on the interaction of factors such as rainfall amount, timing, and N fertilization. Xiao et al. [63] similarly observed peak nitrate concentrations in surface waters (rivers, ponds, and reservoirs) in China, coinciding with the crop planting season. Some studies found that fallow is a factor that can increase NO3− leaching [64,65,66]. It occurs because the NO3− not absorbed by cultivated plants is available for leaching, as well as that produced by the degradation of crop residues [66].
During periods with lower rainfall (10, 11, 20, and 21, Figure 2), the unfertilized plots exhibited significantly higher NO3− leaching than those fertilized (Table 5 and Table 6). NO3− leaching in no-tillage areas without fertilization has already been reported by Rosolem et al. [38], who evaluated the phenomenon in these situations over a year without rainfall restrictions and found NO3− concentrations of up to 111 mg L−1. However, in the present study, NO3− leaching was significantly higher in plots without fertilization (periods 20 and 21, Table 5 and Table 6) with soybean crops in both the diversified and simplified rotation areas. This observation was unpredictable because adding N via fertilization to clayey soil could negatively affect soybean root growth, theoretically resulting in a higher proportion of available N for leaching [67], which was not the case in this study.
The significant difference between cropping systems in period 12 (Table 5 and Table 6) indicates that a punctual event may have momentarily favored leaching in simplified rotation, such as the combination of irrigation events in previous periods (Figure 2) and the characteristics of the cultivated species itself, in this case, soybean. Legumes, such as soybeans, release large amounts of N compounds through rhizodeposition [68], which can be transformed into NO3− and thereby become susceptible to leaching. Similar results were reported by Rosolem et al. [38], who compared NO3− leaching in grasses and legumes; however, the authors attributed this result to the fact that most of the N absorbed by grasses originates from the soil, resulting in less NO3− available for leaching, whereas legumes obtain most of their N through biological fixation, which barely changes the soil solution NO3− concentrations.
Significantly distinct NO3− leaching was observed among the interaction factors during periods 4, 10, 17, and 19 (Table 5 and Table 6), which had in common the cultivation of grasses (Poaceae). The Poaceae family is one of the most efficient in reducing NO3− leaching [66]. In period 4, for instance, the diversified rotation treatments consisted of a mixture of species from the Poaceae and Fabaceae families. Fabacea species (legumes) fix N from the atmosphere, which can be leached upon conversion to NO3−, whereas Poacea species reduce NO3− leaching directly. Thapa et al. [69] reported that non-legume cover crops could reduce leaching by up to 56%.
Regardless of the presence of fertilizer, treatments with diversified rotation (previously with cover crops) did not differ significantly from treatments with simplified rotation (previously with corn crops) (Table 5 and Table 6). Therefore, cover crops had no influence on leaching, which is inconsistent with the meta-analyses by Nouri et al. [66] and Meyer et al. [70]. The small influence of cover crops on NO3− leaching was due to the type of soil and management, since in sandier soils and conventional planting, they are more effective in reducing leaching. Furthermore, the use of legumes as cover crops does not reduce leaching.
The results from periods 10, 17, and 19, with less NO3− leaching in diversified rotation with N fertilization (Table 5 and Table 6), corroborate those of Rosolem et al. [38], Pasley et al. [61], Thapa et al. [69], Zhou et al. [71], and Zhou and Butterbach-Bahl [72]. These studies also showed that grass species tend to decrease N leaching because of their robust root systems and high N demand for growth. Corn has a more vigorous root system than other species, with higher biomass than soybean [73], providing higher N uptake. This characteristic of the corn root system resulted in a lower amount of available N for leaching into the soil solution, explaining the lower leaching in the plots with this crop. Comparing leaching in wheat and corn, Daryanto et al. [13] observed a higher concentration of NO3− in fields cultivated with wheat than with corn, despite higher corn fertilization. They attributed the result to a gap between fertilizer application and the wheat growing period. However, wheat can outperform corn NO3− efficiency because its roots can go deeper into the soil profile and may even recover NO3− leached in an area previously cultivated with corn [71]. The size of the wheat root system, which varies according to genotype, affects the NO3− leaching potential. Genotypes that produce more roots absorb more N, resulting in less available NO3− for leaching [74]. Thus, grasses can potentially support NO3− leaching reduction in no-tillage systems, at least in the context of the low rainfall in the present study.
While these findings may not directly apply to periods characterized by normal rainfall patterns, they hold significance within the framework of climate change. Projections for the upcoming years indicate an increase in extreme weather events, including enhanced occurrences of intense rainfall and prolonged droughts [75]. Several studies link escalated NO3− leaching with periods of greater precipitation [76,77]. Nevertheless, during drought phases, nitrification inhibition occurs, leading to N accumulation in the soil. The limited NO3− leaching, even in the fertilized plots of this study, suggests its accumulation. The N accumulated can be released with rainfall, as a result of the nitrification pulse that generates NO3−, which is susceptible to leaching during heavy rainfall [78]. These extreme climate events are already occurring, as evidenced even by the climate data in our study (Figure 1), with consequences for NO3− leaching, as proved by our results. These findings highlight the need for a reconsideration of N fertilization guidelines to mitigate the potential for NO3− leaching in the predicted climate change scenarios.
5. Conclusions
This study did not confirm the working hypotheses, as the statistical analysis of nitrate leaching did not show marked differences between the treatments and their interactions. No significant differences existed between the treatments during most periods, but some grass treatments (corn, corn with palisade grass, and wheat) resulted in lower leaching rates. However, owing to atypical rainfall patterns, further studies are required to assess NO3− leaching in plots with corn or wheat vs. other cultivated species, primarily under normal or excess rainfall conditions. This study holds substantial value in guiding future research and expanding the understanding of the overall process of nitrate leaching in no-tillage, whereas weather extremes such as low rainfall conditions will become more frequent in the near future.
Author Contributions
Conceptualization, I.P.B., A.G.A. and A.S.L.; methodology, I.P.B., A.G.A. and A.S.L.; software, V.M.P.; validation V.M.P.; formal analysis, A.G.A. and V.M.P.; investigation, I.P.B., A.G.A., G.H.M. and V.M.P.; resources, I.P.B., A.S.L. and V.M.P.; data curation, I.P.B.; writing—original draft preparation, I.P.B., A.G.A. and V.M.P.; writing—review and editing, A.G.A. and G.H.M.; visualization, I.P.B. and A.G.A.; supervision, I.P.B. and G.H.M.; project administration, I.P.B. All authors have read and agreed to the published version of the manuscript.
Funding
This research received no external funding.
Data Availability Statement
The raw data supporting the conclusions of this article will be made available by the authors on request.
Acknowledgments
The authors would like to thank the Institute of Rural Development of Paraná for field and laboratory support and Embrapa Soybeans for supplying soybean seeds.
Conflicts of Interest
The authors declare no conflicts of interest.
References
- Singh, B.; Craswell, E. Fertilizers and nitrate pollution of surface and ground water: An increasingly pervasive global problem. SN Appl. Sci. 2021, 3, 518. [Google Scholar] [CrossRef]
- Cameron, K.C.; Di, H.J.; Moir, J.L. Nitrogen losses from the soil/plant system: A review. Ann. Appl. Biol. 2013, 162, 145–173. [Google Scholar] [CrossRef]
- Good, A.G.; Beatty, P.H. Fertilizing nature: A tragedy of excess in the commons. PLoS Biol. 2011, 9, e1001124. [Google Scholar] [CrossRef] [PubMed]
- Paerl, H.W.; Xu, H.; McCarthy, M.J.; Zhu, G.; Qin, B.; Li, Y. Gardner WS. Controlling harmful cyanobacterial blooms in a hyper-eutrophic lake (Lake Taihu, China): The need for a dual nutrient (N & P) management strategy. Water Res. 2011, 45, 1973–1983. [Google Scholar] [CrossRef] [PubMed]
- Food and Agriculture Organization of the United Nations. FAOSTAT: Data—Fertilizers by Nutrients. Available online: https://www.fao.org/faostat/en/#data/RFN/ (accessed on 8 March 2024).
- Soumare, A.; Diedhiou, A.G.; Thuita, M.; Hafidi, M.; Ouhdouch, Y.; Gopalakrishnan, S.; Kouisni, L. Exploiting biological nitrogen fixation: A route towards sustainable agriculture. Plants 2020, 9, 1011. [Google Scholar] [CrossRef] [PubMed]
- Food and Agriculture Organization of the United Nations. FAOSTAT: Cropland Nutrient Budget. Available online: https://www.fao.org/faostat/en/#data/ESB (accessed on 7 March 2024).
- Battye, W.; Aneja, V.P.; Schlesinger, W.H. Is nitrogen the next carbon? Earth’s Future 2017, 5, 894–904. [Google Scholar] [CrossRef]
- Rütting, T.; Aronsson, H.; Delin, S. Efficient use of nitrogen in agriculture. Nutr. Cycl. Agroecosyst. 2018, 110, 1–5. [Google Scholar] [CrossRef]
- Hussain, M.Z.; Robertson, G.P.; Basso, B.; Hamilton, S.K. Leaching losses of dissolved organic carbon and nitrogen from agricultural soils in the upper US Midwest. Sci. Total Environ. 2020, 734, 139379. [Google Scholar] [CrossRef]
- Wang, Z.H.; Li, S.X. Nitrate N loss by leaching and surface runoff in agricultural land: A global issue (a review). Adv. Agron. 2019, 56, 159–217. [Google Scholar] [CrossRef]
- Sanchez, P.A. Properties and Management of Soils in the Tropics, 2nd ed.; Cambridge University Press: Cambridge, UK, 2019. [Google Scholar]
- Daryanto, S.; Wang, L.; Jacinthe, P.A. Impacts of no-tillage management on nitrate loss from corn, soybean and wheat cultivation: A meta-analysis. Sci. Rep. 2017, 7, 12117. [Google Scholar] [CrossRef]
- Federação Brasileira do Sistema Plantio Direto. Área Sob Plantio Direto. Available online: https://plantiodireto.org.br/area-de-pd (accessed on 13 December 2023).
- Fuentes-Llanillo, R.; Telles, T.S.; Soares, D., Jr.; Melo, T.R.; Friedrich, T.; Kassam, A. Expansion of no-tillage practices in conservation agriculture in Brazil. Soil Tillage Res. 2021, 208, 104877. [Google Scholar] [CrossRef]
- Food and Agriculture Organization of the United Nations. Save and Grow in Practice: Maize, Rice and Wheat, 1st ed.; FAO: Rome, Italy, 2016; Available online: https://www.fao.org/publications/card/en/c/b22331a7-442b-4454-a951-46cda21055e3 (accessed on 3 March 2024).
- Possamai, E.J.; Conceição, P.C.; Amadori, C.; Bartz, M.L.C.; Ralisch, R.; Vicensi, M.; Marx, E.F. Adoption of the no-tillage system in Paraná State: A (re)view. Rev. Bras. Ciência Solo 2022, 46, e0210104. [Google Scholar] [CrossRef]
- Komainda, M.; Taube, F.; Kluß, C.; Herrmann, A. Effects of catch crops on silage maize (Zea mays L.): Yield, nitrogen uptake efficiency and losses. Nutr. Cycl. Agroecosyst. 2018, 110, 51–69. [Google Scholar] [CrossRef]
- Koropeckyj-Cox, L.; Christianson, R.D.; Yuan, Y. Effectiveness of conservation crop rotation for water pollutant reduction from agricultural areas. ASABE 2021, 64, 691–704. [Google Scholar] [CrossRef] [PubMed]
- Li, J.; Hu, W.; Chau, H.W.; Beare, M.; Cichota, R.; Teixeira, E.; Moore, T.; Di, H.; Cameron, K.; Guo, J.; et al. Response of nitrate leaching to no-tillage is dependent on soil, climate, and management factors: A global meta-analysis. Glob. Chang. Biol. 2023, 29, 2172–2187. [Google Scholar] [CrossRef] [PubMed]
- Spiess, E.; Humphrys, C.; Richner, W.; Schneider, M.K.; Piepho, H.; Chervet, A.; Prasuhn, V. Does no-tillage decrease nitrate leaching compared to ploughing under a long-term crop rotation in Switzerland? Soil Tillage Res. 2020, 199, 104590. [Google Scholar] [CrossRef]
- Food and Agriculture Organization of the United Nations. FAOSTAT: Crops and Livestock Products. Available online: https://www.fao.org/faostat/en/#data/QCL (accessed on 13 December 2023).
- Padilla, F.M.; Gallardo, M.; Manzano-Agugliaro, F. Global trends in nitrate leaching research in the 1960–2017 period. Sci. Total Environ. 2018, 643, 400–413. [Google Scholar] [CrossRef] [PubMed]
- Nitsche, P.R.; Caramori, P.H.; Ricce, W.S.; Pinto, L.F.D. Atlas Climático do Estado do Paraná, 1st ed.; IAPAR: Londrina, Brazil, 2019. [Google Scholar]
- Bognola, I.A.; Curcio, G.R.; Gomes, J.B.V.; Caviglione, J.H.; Uhlmann, A.; Cardoso, A.; Carvalho, A.P. Levantamento Semidetalhado de Solos do Município de Londrina—PR, 1st ed.; IAPAR: Londrina, Brazil, 2011. [Google Scholar]
- Santos, H.G.; Jacomine, P.K.T.; Anjos, L.H.C.; Oliveira, V.A.; Lumbreras, J.F.; Coelho, M.R.; de Almeida, J.A.; de Araújo Filho, J.C.; de Oliveira, J.B.; Cunha, T.J.F. Sistema Brasileiro de Classificação de Solos, 5th ed.; Embrapa: Brasília, Brazil, 2018. [Google Scholar]
- Soil Survey Staff. Soil Taxonomy: A Basic System of Soil Classification for Making and Interpreting Soil Surveys, 2nd ed.; USDA: Washington, DC, USA; NRCS: Washington, DC, USA, 1999. [Google Scholar]
- Teixeira, P.C.; Donagemma, G.K.; Fontana, A.; Teixeira, W.G. Manual de Métodos de Análise de Solo, 3rd ed.; Embrapa: Brasília, Brazil, 2017. [Google Scholar]
- Pauletti, V.; Motta, A.C.V. Manual de Adubação e Calagem para o Estado do Paraná, 2nd ed.; SBCS: Curitiba, Brazil, 2019. [Google Scholar]
- Bajracharya, R.M.; Homagain, A. Fabrication and testing of a low-cost ceramic-cup soil solution sampler. Agric. Water Manag. 2006, 84, 207–211. [Google Scholar] [CrossRef]
- Instituto de Desenvolvimento Rural do Paraná. Dados Meteorológicos Históricos e Atuais: Médias Históricas em Estações do IDR-Paraná: Londrina. Available online: https://www.idrparana.pr.gov.br/Pagina/Dados-Meteorologicos-Historicos-e-Atuais/ (accessed on 13 December 2023).
- Soil Water Atmosphere Plant. Soil, Water, Atmosphere and Plant. Available online: https://www.swap.alterra.nl/ (accessed on 10 December 2023).
- Kroes, J.; Van Dam, J.; Bartholomeus, R.; Groenendijk, P.; Heinen, M.; Hendriks, R.; Mulder, H.M.; Supit, I.; van Walsum, P.E.V. SWAP Version 4: Theory Description and User Manual, 1st ed.; Wageningen Environmental Research: Wageningen, The Netherlands, 2017. [Google Scholar]
- Richter, G.L.; Zanon Júnior, A.; Streck, N.A.; Guedes, J.V.C.; Kräulich, B.; Rocha, T.S.M.; Winck, J.E.M.; Cera, J.C. Estimativa da área de folhas de cultivares antigas e modernas de soja por método não destrutivo. Bragantia 2014, 73, 416–425. [Google Scholar] [CrossRef]
- Guimarães, D.P.; Sans, L.M.A.; Moraes, A.V.C. Estimativa da área foliar de cultivares de milho. In Proceedings of the 24th Congresso Nacional de Milho e Sorgo, Florianópolis, Brazil, 5 September 2002; Available online: https://ainfo.cnptia.embrapa.br/digital/bitstream/item/34888/1/Estimativa-area.pdf (accessed on 28 February 2024).
- Pinto, V.M. Simulation of Water and Nitrogen Dynamics in a Cerrado Soil under Coffee Cultivation Using SWAP and ANIMO Models. Ph.D. Thesis, CENA/USP, Piracicaba, Brazil, 2016. Available online: https://teses.usp.br/teses/disponiveis/64/64134/tde-02022016-105753/en.php (accessed on 28 February 2024).
- Rice, E.W.; Baird, R.B.; Eaton, A.D. 4500-NO3− B. Ultraviolet spectrophotometric screening method. In Standard Methods for the Examination of Water and Wastewater, 23rd ed.; Rice, E.W., Baird, R.B., Eaton, A.D., Eds.; American Public Health Association (APHA): Washington, DC, USA, 2017; pp. 4–127. [Google Scholar]
- Rosolem, C.A.; Castoldi, G.; Pivetta, L.A.; Ochsner, T.E. Nitrate leaching in soybean rotations without nitrogen fertilizer. Plant Soil 2018, 423, 27–40. [Google Scholar] [CrossRef]
- De Wit, A. Parameter Sets for the WOFOST Crop Simulation Model. Available online: https://github.com/ajwdewit/WOFOST_crop_parameters (accessed on 13 December 2023).
- Willmott, C.J. On the validation of models. Phys. Geogr. 1981, 2, 184–194. [Google Scholar] [CrossRef]
- Nash, J.E.; Sutcliffe, J.V. River flow forecasting through conceptual models part 1—A discussion of principles. J. Hydrol. 1970, 10, 282–290. [Google Scholar] [CrossRef]
- Groenendijk, P.; Heinen, M.; Klammler, G.; Fankb, J.; Kupfersberger, H.; Pisinaras, V.; Gemitzi, A.; Peña-Haro, S.; García-Prats, A.; Pulido-Velazquez, M.; et al. Performance assessment of nitrate leaching models for highly vulnerable soils used in low-input farming based on lysimeter data. Sci. Total Environ. 2014, 499, 463–480. [Google Scholar] [CrossRef] [PubMed]
- Companhia Brasileira de Abastecimento. Série Histórica: Soja. Available online: https://www.conab.gov.br/info-agro/safras/serie-historica-das-safras/itemlist/category/911-soja/ (accessed on 13 December 2023).
- Companhia Brasileira de Abastecimento. Série Histórica: Milho. Available online: https://www.conab.gov.br/info-agro/safras/serie-historica-das-safras/itemlist/category/910-Milho/ (accessed on 13 December 2023).
- Companhia Brasileira de Abastecimento. Série Histórica: Trigo. Available online: https://www.conab.gov.br/info-agro/safras/serie-historica-das-safras/itemlist/category/913-trigo (accessed on 13 December 2023).
- Sah, R.O.; Chakraborty, M.; Prasad, K.; Pandit, M.; Tudu, V.K.; Chakravarty, M.K.; Narayan, S.C.; Rana, M.; Moharana, D. Impact of water deficit stress in maize: Phenology and yield components. Sci. Rep. 2020, 10, 2944. [Google Scholar] [CrossRef] [PubMed]
- Iqbal, A.; Dong, Q.; Wang, X.; Gui, H.; Zhang, H.; Zhang, X.; Song, M. High nitrogen enhance drought tolerance in cotton through antioxidant enzymatic activities, nitrogen metabolism and osmotic adjustment. Plants 2020, 9, 178. [Google Scholar] [CrossRef] [PubMed]
- Song, Y.; Li, J.; Liu, M.; Meng, Z.; Liu, K.; Sui, N. Nitrogen increases drought tolerance in maize seedlings. Funct. Plant Biol. 2019, 46, 350–359. [Google Scholar] [CrossRef] [PubMed]
- Mansouri-Far, C.; Sanavy, S.A.M.M.; Saberali, S.F. Maize yield response to deficit irrigation during low-sensitive growth stages and nitrogen rate under semi-arid climatic conditions. Agric. Water Manag. 2010, 97, 12–22. [Google Scholar] [CrossRef]
- Jin, Z.; Zhuang, Q.; Wang, J.; Archontoulis, S.V.; Zobel, Z.; Kotamarthi, V.R. The combined and separate impacts of climate extremes on the current and future US rainfed maize and soybean production under elevated CO2. Glob. Chang. Biol. 2017, 23, 2687–2704. [Google Scholar] [CrossRef]
- Grzyb, A.; Wolna-Maruwka, A.; Niewiadomska, A. Environmental factors affecting the mineralization of crop residues. Agronomy 2020, 10, 1951. [Google Scholar] [CrossRef]
- Norton, J.; Ouyang, Y. Controls and adaptive management of nitrification in agricultural soils. Front. Microbiol. 2019, 10, 1931. [Google Scholar] [CrossRef]
- Jabloun, M.; Schelde, K.; Tao, F.; Olesen, J.E. Effect of temperature and precipitation on nitrate leaching from organic cereal cropping systems in Denmark. Eur. J. Agron. 2015, 62, 55–64. [Google Scholar] [CrossRef]
- Liang, X.-Q.; Xu, L.; Li, H.; He, M.-M.; Qian, Y.-C.; Liu, J.; Nie, Z.-Y.; Ye, Y.-S.; Chen, Y. Influence of N fertilization rates, rainfall, and temperature on nitrate leaching from a rainfed winter wheat field in Taihu watershed. Phys. Chem. Earth 2011, 36, 395–400. [Google Scholar] [CrossRef]
- Bowles, T.M.; Atallah, S.S.; Campbell, E.E.; Gaudin, A.C.M.; Wieder, W.R.; Grandy, A.S. Addressing agricultural nitrogen losses in a changing climate. Nat. Sustain. 2018, 1, 399–408. [Google Scholar] [CrossRef]
- Brady, N.C.; Weil, R.R. Elementos da Natureza e Propriedades do Solo, 3rd ed.; Bookman: Porto Alegre, Brazil, 2013. [Google Scholar]
- Ghiberto, P.J.; Libardi, P.L.; Brito, A.S.; Trivelin, P.C.O. Nitrogen fertilizer leaching in an Oxisol cultivated with sugarcane. Sci. Agric. 2011, 68, 86–93. [Google Scholar] [CrossRef]
- Bortolotto, R.P.; Bruno, I.P.; Reichardt, K.; Timm, L.C.; Amado, T.J.C.; Ferreira, A.O. Nitrogen fertilizer (15N) leaching in a central pivot fertigated coffee crop. Rev. Ceres 2012, 59, 466–475. [Google Scholar] [CrossRef]
- Wang, Y.; Ying, H.; Yin, Y.; Zheng, H.; Cui, Z. Estimating soil nitrate leaching of nitrogen fertilizer from global meta-analysis. Sci. Total Environ. 2019, 657, 96–102. [Google Scholar] [CrossRef]
- Hess, L.J.T.; Hinckley, E.S.; Robertson, G.P.; Matson, P.A. Rainfall intensification increases nitrate leaching from tilled but not no-till cropping systems in the U.S. Midwest. Agric. Ecosyst. Environ. 2020, 290, 106747. [Google Scholar] [CrossRef]
- Pasley, H.; Nichols, V.; Castellano, M.; Baum, M.; Kladivko, E.; Helmers, M.; Archontoulis, S. Rotating maize reduces the risk and rate of nitrate leaching. Environ. Res. Lett. 2021, 16, 064063. [Google Scholar] [CrossRef]
- Meisinger, J.J.; Palmer, R.E.; Timlin, D.J. Effects of tillage practices on drainage and nitrate leaching from winter wheat in the Northern Atlantic Coastal-Plain USA. Soil Tillage Res. 2015, 151, 18–27. [Google Scholar] [CrossRef]
- Xiao, Q.; Hu, Z.; Fu, C.; Bian, H.; Lee, X.; Chen, S.; Shang, D. Surface nitrous oxide concentrations and fluxes from water bodies of the agricultural watershed in Eastern China. Environ. Pollut. 2019, 251, 185e192. [Google Scholar] [CrossRef]
- John, A.A.; Jones, C.A.; Ewing, S.A.; Sigler, W.A.; Bekkerman, A.; Miller, P.R. Fallow replacement and alternative nitrogen management for reducing nitrate leaching in a semiarid region. Nutr. Cycl. Agroecosyst. 2017, 108, 279–296. [Google Scholar] [CrossRef]
- Plaza-Bonilla, D.; Nolot, J.; Raffaillac, D.; Justes, E. Cover crops mitigate nitrate leaching in cropping systems including grain legumes: Field evidence and model simulations. Agric. Ecosyst. Environ. 2015, 212, 1–12. [Google Scholar] [CrossRef]
- Nouri, A.; Lukas, S.; Singh, S.; Singh, S.; Machado, S. When do cover crops reduce nitrate leaching? A global meta-analysis. Glob. Chang. Biol. 2022, 28, 4736–4749. [Google Scholar] [CrossRef] [PubMed]
- McCoy, J.M.; Kaur, G.; Golden, B.R.; Orlowski, J.M.; Cook, D.R.; Bond, J.A.; Cox, M.S. Nitrogen fertilization of soybean affects root growth and nodulation on two soil types in Mississippi. Commun. Soil Sci. Plant Anal. 2018, 49, 181–187. [Google Scholar] [CrossRef]
- Fustec, J.; Lesuffleur, F.; Mahieu, S.; Cliquet, J. Nitrogen rhizodeposition of legumes. A review. Agron. Sustain. Dev. 2010, 30, 57–66. [Google Scholar] [CrossRef]
- Thapa, R.; Mirsky, S.B.; Tully, K.L. Cover crops reduce nitrate leaching in agroecosystems: A global meta-analysis. J. Environ. Qual. 2018, 47, 1400–1411. [Google Scholar] [CrossRef]
- Meyer, N.; Bergez, J.E.; Constantin, J.; Justes, E. Cover crops reduce water drainage in temperate climates: A meta-analysis. Agron. Sustain. Dev. 2019, 39, 3. [Google Scholar] [CrossRef]
- Zhou, S.L.; Wu, Y.C.; Wang, Z.M.; Lu, L.Q.; Wang, R.Z. The nitrate leached below maize root zone is available for deep-rooted wheat in winter wheat-summer maize rotation in the North China Plain. Environ. Pollut. 2008, 152, 723–730. [Google Scholar] [CrossRef] [PubMed]
- Zhou, M.; Butterbach-Bahl, K. Assessment of nitrate leaching loss on a yield-scaled basis from maize and wheat cropping systems. Plant Soil 2014, 374, 977–991. [Google Scholar] [CrossRef]
- Ordóñez, R.A.; Archontoulis, S.V.; Martinez-Feria, R.; Hatfield, J.L.; Wright, E.E.; Castellano, M.J. Root to shoot and carbon to nitrogen ratios of maize and soybean crops in the US Midwest. Eur. J. Agron. 2020, 120, 126130. [Google Scholar] [CrossRef]
- Ehdaie, B.; Merhaut, D.J.; Ahmadian, S.; Hoops, A.C.; Khuong, T.; Layne, A.P.; Waines, J.G. Root system size influences water-nutrient uptake and nitrate leaching potential in wheat. J. Agron. Crop. Sci. 2010, 196, 455–466. [Google Scholar] [CrossRef]
- Qiu, J.; Shen, Z.; Leng, G.; Wei, G. Synergistic effect of drought and rainfall events of different patterns on watershed systems. Sci. Rep. 2021, 11, 18957. [Google Scholar] [CrossRef] [PubMed]
- Bauwe, A.; Tiemeyer, B.; Kahle, P.; Lennartz, B. Classifying hydrological events to quantify their impact on nitrate leaching across three spatial scales. J. Hydrol. 2015, 531, 589–601. [Google Scholar] [CrossRef]
- Sarkar, S.; Mukherjee, A.; Senapati, B.; Duttagupta, S. Predicting potential climate change impacts on groundwater nitrate pollution and risk in an intensely cultivated area of South Asia. ACS Environ. Au 2022, 2, 556–576. [Google Scholar] [CrossRef]
- Greaver, T.L.; Clark, C.M.; Compton, J.E.; Vallano, D.; Talhelm, A.F.; Weaver, C.P.; Band, L.E.; Baron, J.S.; Davidson, E.A.; Tague, C.L.; et al. Key ecological responses to nitrogen are altered by climate change. Nat. Clim. Chang. 2016, 6, 836–843. [Google Scholar] [CrossRef]
Figure 1.
Average monthly accumulated precipitation from 1976–2016 (mm), monthly accumulated precipitation (rainfall—positive values, mm), and real evapotranspiration (ETR—negative values, mm) from January 2018–March 2020 (a); monthly average air temperature from 1976–2016 (°C) and from January 2018–March 2020 (b) (Londrina, PR, Brazil).

Figure 2.
Sum of accumulated precipitation and irrigation (rain + irrig, mm), accumulated real evapotranspiration (ETR, mm), accumulated drained volume at 1 m depth (drain, mm), and average temperature (temp, °C) in the 24 periods (Londrina, PR, Brazil, 2018–2020). Note: * indicates periods with irrigation.

Figure 3.
Means of twelve periods of nitrate (NO3−) concentrations (mg L−1) and loads (kg ha−1) in leached soil solutions between cropping systems and nitrogen fertilization managements and their interactions in the 2018/2019 (a,c) and 2019/2020 (b,d) evaluation seasons (Londrina, PR, Brazil). Note: NR: diversified crop rotation with N fertilization; NS: simplified crop rotation with N fertilization; OR: diversified crop rotation without N fertilization; OS: simplified crop rotation without N fertilization; R: diversified crop rotation; S: simplified crop rotation; N: management with N fertilization; O: management without N fertilization. Tukey’s test was used with a significance level of p < 0.05. Bars represent standard errors.

Figure 4.
Means of sixteen replicates (four treatments and four blocks) of leachate NO3− concentrations (mg L−1) (a,b) and loads (kg ha−1) (c,d) in each period of the 2018/2019 and 2019/2020 evaluation seasons (Londrina, PR, Brazil). Note: different letters indicate significant differences between periods during each evaluation season. Tukey’s test was used with a significance level of p < 0.05. Bars represent standard errors.


Table 1.
Chemical characteristics of the soil at a 0–20 cm depth before the start of the experiment.
Table 1.
Chemical characteristics of the soil at a 0–20 cm depth before the start of the experiment.
| pH * | C | P | K | Ca | Mg | Al | H + Al | SB | CEC | V | |
|---|---|---|---|---|---|---|---|---|---|---|---|
| g dm−3 | mg dm−3 | cmolc dm−3 | % | ||||||||
| Fall/winter 2018 | 5.1 | 15.8 | 8.6 | 0.3 | 4.4 | 2.4 | 0.0 | 5.4 | 7.0 | 12.4 | 56.7 |
| Spring/summer 2018/2019 | 4.9 | 17.3 | 12.5 | 0.4 | 4.5 | 2.3 | 0.1 | 5.9 | 7.1 | 13.0 | 54.1 |
| Fall/winter 2019 | 5.1 | 15.7 | 8.8 | 0.3 | 4.2 | 2.1 | 0.0 | 5.1 | 6.6 | 11.6 | 56.4 |
| Spring/summer 2019/2020 | 4.9 | 15.9 | 10.0 | 0.3 | 4.2 | 2.2 | 0.2 | 5.7 | 6.6 | 12.3 | 53.8 |
* pH = active acidity; C = carbon; P = phosphorus; K = potassium; Ca = calcium; Mg = magnesium; Al = aluminum; H + Al = potential acidity; SB = sum of bases; CEC = cation exchange capacity; V = base saturation.
Table 2.
Crop season, rotation, cultivated species, sowing and harvesting or management dates, nitrogen (N) rates (kg ha−1 N), and fertilization date.
Table 2.
Crop season, rotation, cultivated species, sowing and harvesting or management dates, nitrogen (N) rates (kg ha−1 N), and fertilization date.
| Crop Season | Rotation | Cultivated Species | Sowing–Harvesting | N rates 4 | Fertilization 5 |
|---|---|---|---|---|---|
| Fall/winter 2018 | Diversified | millet | Mar 13, 2018–Apr 24, 2018 | 30 30 40 | Mar 13, 2018 Apr 3, 2018 Apr 18, 2018 |
| crop mix 1 | Apr 26, 2018–Aug 21, 2018 | 20 | Jun 28, 2018 | ||
| Simplified | corn | Mar 8, 2018–Aug 14, 2018 | 30 40 60 | Mar 8, 2018 Apr 3, 2018 Apr 18, 2018 | |
| Spring/summer 2018/2019 | Diversified | Intercropping 2 | Oct 29 3, 2018–Mar 25, 2019 | 50 75 75 | Oct 29, 2018 Nov 29, 2018 Dec 12, 2018 |
| Simplified | soybean | Oct 30, 2018–Mar 25, 2019 | 12 | Oct 30, 2018 | |
| Fall/winter 2019 | Diversified | buckwheat | Mar 26, 2019–Apr 30, 2019 | 0 | --- |
| wheat | May 9, 2019–Sep 5, 2019 | 20 41 | May 9, 2019 May 29, 2019 | ||
| Simplified | corn | Mar 26, 2019–Aug 8, 2019 | 10 61 | Mar 26, 2019 Apr 29, 2019 | |
| Spring/summer 2019/2020 | Diversified | Soybean | Oct 25, 2019–Mar 12, 2020 | 12 | Oct 25, 2019 |
| Simplified | Soybean | Oct 25, 2019–Mar 12, 2020 | 12 | Oct 25, 2019 |
1 Black oats, field peas, and field radishes. 2 Corn with palisade grass between rows. 3 Sowing was performed on 9/12/2018, but a hailstorm on 10/4/2018 destroyed the seedlings. Sowing was repeated on 10/29/2018. 4 Plots corresponding to the management factor without N fertilization did not receive any source of N; each value corresponded to part of the total fertilizer applied in the fertilized plots, and the sum for each species was the total N application rate. 5 Dates of N fertilization performed at sowing, first, and second coverage, successively. --- No N fertilization.
Table 3.
Evaluation seasons, crop seasons, type of rotation and species, periods, and intervals between the collection of soil solution samples leached below the root system.
Table 3.
Evaluation seasons, crop seasons, type of rotation and species, periods, and intervals between the collection of soil solution samples leached below the root system.
| Evaluation Season | Crop Season | Species | Period | Dates |
|---|---|---|---|---|
| 2018/ 2019 | Fall/winter 2018 | D 1—millet D—crop mix 3 S 2—corn | 1 | 3/22/2018–3/28/2018 |
| 2 | 3/28/2018–4/20/2018 | |||
| 3 | 4/20/2018–8/28/2018 | |||
| Fallow | --- | 4 | 8/28/2018–9/19/2018 | |
| 5 | 9/19/2018–9/25/2018 | |||
| 6 | 9/25/2018–10/2/2018 | |||
| 7 | 10/2/2018–10/10/2018 | |||
| Spring/summer 2018/2019 | D—intercrop 4 S—soybean | 8 | 10/10/2018–11/21/2018 | |
| 9 | 11/21/2018–11/27/2018 | |||
| 10 | 11/27/2018–12/18/2018 | |||
| 11 | 12/18/2018–12/27/2018 | |||
| 12 | 12/27/2018–1/10/2019 | |||
| 2019/ 2020 | Fall/winter 2019 | D—buckwheat D—wheat S—corn | 13 | 5/9/2019–5/14/2019 |
| 14 | 5/14/2019–5/28/2019 | |||
| 15 | 5/28/2019–5/30/2019 | |||
| 16 | 5/30/2019–6/4/2019 | |||
| 17 | 6/4/2019–6/12/2019 | |||
| 18 | 6/12/2019–7/10/2019 | |||
| 19 | 7/10/2019–11/12/2019 | |||
| Spring/summer 2019/2020 | D—soybean S—soybean | 20 | 11/12/2019–11/19/2019 | |
| 21 | 11/19/2019–11/29/2019 | |||
| 22 | 11/29/2019–12/19/2019 | |||
| 23 | 12/19/2019–12/27/2019 | |||
| 24 | 12/27/2019–1/15/2020 |
1 D = diversified rotation. 2 S = simplified rotation. 3 Black oats, field peas, and field radishes. 4 Corn with palisade grass between rows. --- = not planted.
Table 4.
Grain yield for commercial species or dry mass for cover crops (kg ha−1).
| Crop Season | Rotation | Species | N Fertilization Management 1 | Yield (kg ha−1) |
|---|---|---|---|---|
| Fall/winter 2018 | Diversified | millet | 0 | 5411 |
| N | 6024 | |||
| crop mix 2 | 0 | 7144 | ||
| N | 8290 | |||
| Simplified | corn | 0 | 4763 | |
| N | 5182 | |||
| Spring/summer 2018/2019 | Diversified | Intercropping 3 | 0 | 7301 |
| N | 7930 | |||
| Simplified | soybean | 0 | 3545 | |
| N | 3147 | |||
| Fall/winter 2019 | Diversified | buckwheat | --- | 1894 |
| wheat | 0 | 2622 | ||
| N | 2858 | |||
| Simplified | corn | 0 | 2614 a | |
| N | 2039 b | |||
| Spring/summer 2019/2020 | Diversified | soybean | 0 | 3351 |
| N | 3519 | |||
| Simplified | soybean | 0 | 3849 | |
| N | 3662 |
Note: Values represent the means of four replicates; 1 0 = plots without N fertilization; N = plots with N fertilization; 2 Black oats, field peas, and field radish. 3 Corn intercropped with palisade grass showing corn yield. --- = no treatment was applied. Tukey’s test was used with a significance level of p < 0.05.
Table 5.
Leachate nitrate (NO3−) concentration in each period, according to nitrogen fertilization management, with (N) or without (0) fertilizer, and diversified (D) or simplified (S) cropping systems, and their interactions (S0, D0, SN, DN), in the 2018/2019 and 2019/2020 evaluation seasons.
Table 5.
Leachate nitrate (NO3−) concentration in each period, according to nitrogen fertilization management, with (N) or without (0) fertilizer, and diversified (D) or simplified (S) cropping systems, and their interactions (S0, D0, SN, DN), in the 2018/2019 and 2019/2020 evaluation seasons.
| Mean Leachate NO3− Concentration (mg L−1) | ||||||||||||||||||||||||
|---|---|---|---|---|---|---|---|---|---|---|---|---|---|---|---|---|---|---|---|---|---|---|---|---|
| 2018/2019 | 2019/2020 | |||||||||||||||||||||||
| 1 | 2 | 3 | 4 | 5 | 6 | 7 | 8 | 9 | 10 | 11 | 12 | 13 | 14 | 15 | 16 | 17 | 18 | 19 | 20 | 21 | 22 | 23 | 24 | |
| 0 | 15.6 (1.36) | 21.6 (2.13) | 13.3 (1.61) | 1.7 b (0.19) | 1.7 b (0.24) | 1.7 b (0.23) | 2.1 (0.24) | 2.8 (0.15) | 2.8 (0.27) | 2.9 a (0.24) | 3.2 a (0.27) | 2.8 ns (0.32) | 2.7 (0.29) | 2.6 (0.27) | 2.8 (0.20) | 2.7 (0.20) | 2.6 ns (0.29) | 3.3 (0.40) | 3.6 ns (0.27) | 3.0 a (0.22) | 2.6 a (0.22) | 2.7 (0.13) | 3.1 (0.43) | 2.7 (0.41) |
| N | 17.6 (1.83) | 27.4 (3.52) | 17.2 (2.47) | 2.4 a (0.28) | 2.7 a (0.30) | 2.5 a (0.31) | 2.7 (0.26) | 2.6 (0.24) | 2.5 (0.31) | 2.0 b (0.20) | 2.0 b (0.17) | 2.5 ns (0.23) | 2.4 (0.36) | 2.5 (0.37) | 2.8 (0.51) | 2.5 (0.44) | 2.4 ns (0.35) | 3.1 (0.43) | 2.6 ns (0.45) | 1.7 b (0.16) | 1.7 b (0.12) | 2.2 (0.18) | 2.4 (0.38) | 2.0 (0.20) |
| S | 15.3 (1.70) | 22.4 (3.71) | 14.3 (2.65) | 2.0 ns (0.34) | 2.0 ns (0.37) | 1.9 ns (0.31) | 2.1 (0.30) | 2.7 (0.19) | 2.9 (0.24) | 2.6 ns (0.34) | 2.9 ns (0.28) | 3.0 a (0.28) | 2.4 (0.23) | 2.5 (0.19) | 3.0 (0.23) | 2.8 (0.26) | 2.8 ns (0.28) | 3.5 (0.41) | 3.1 ns (0.30) | 2.3 ns (0.17) | 2.2 ns (0.18) | 2.4 (0.13) | 2.9 (0.40) | 2.6 (0.32) |
| D | 17.8 (1.47) | 26.5 (2.08) | 16.3 (1.57) | 2.1 ns (0.20) | 2.4 ns (0.26) | 2.4 ns (0.30) | 2.6 (0.21) | 2.6 (0.21) | 2.4 (0.31) | 2.2 ns (0.18) | 2.3 ns (0.32) | 2.2 b (0.19) | 2.7 (0.40) | 2.6 (0.41) | 2.6 (0.48) | 2.4 (0.40) | 2.2 ns (0.32) | 2.9 (0.40) | 3.1 ns (0.49) | 2.3 ns (0.40) | 2.1 ns (0.29) | 2.5 (0.22) | 2.6 (0.44) | 2.2 (0.36) |
| S0 | 14.1 (0.94) | 17.2 (1.85) | 9.6 (1.22) | 1.2 B (0.12) | 1.1 ns (0.15) | 1.2 ns (0.12) | 1.6 (0.24) | 2.6 (0.06) | 3.3 (0.17) | 3.5 A (0.20) | 3.5 ns (0.23) | 3.2 ns (0.49) | 2.3 (0.36) | 2.3 (0.27) | 2.5 (0.15) | 2.4 (0.15) | 2.4 AB (0.42) | 3.1 (0.79) | 3.0 AB (0.26) | 2.7 ns (0.11) | 2.6 ns (0.22) | 2.5 (0.18) | 3.3 (0.69) | 2.9 (0.62) |
| D0 | 17.0 (2.53) | 25.9 (2.25) | 17.1 (1.06) | 2.1 AB (0.10) | 2.3 ns (0.16) | 2.2 ns (0.31) | 2.6 (0.27) | 3.0 (0.27) | 2.3 (0.34) | 2.3 B (0.13) | 2.9 ns (0.47) | 2.4 ns (0.33) | 3.0 (0.44) | 2.9 (0.44) | 3.2 (0.27) | 3.0 (0.36) | 2.7 AB (0.45) | 3.6 (0.29) | 4.2 A (0.19) | 3.2 ns (0.43) | 2.6 ns (0.41) | 2.9 (0.16) | 2.9 (0.60) | 2.5 (0.61) |
| SN | 16.4 (3.42) | 27.5 (6.55) | 18.9 (4.07) | 2.9 A (0.28) | 2.8 ns (0.36) | 2.5 ns (0.39) | 2.6 (0.44) | 2.8 (0.40) | 2.4 (0.33) | 1.8 B (0.21) | 2.2 ns (0.26) | 2.8 ns (0.32) | 2.5 (0.33) | 2.8 (0.23) | 3.6 (0.16) | 3.2 (0.42) | 3.2 A (0.31) | 3.9 (0.27) | 3.1 AB (0.60) | 1.9 ns (0.13) | 1.8 ns (0.12) | 2.3 (0.20) | 2.5 (0.40) | 2.3 (0.15) |
| DN | 18.7 (1.78) | 27.2 (3.87) | 15.5 (3.17) | 2.0 AB (0.42) | 2.5 ns (0.53) | 2.5 ns (0.56) | 2.7 (0.36) | 2.3 (0.25) | 2.5 (0.58) | 2.1 B (0.35) | 1.7 ns (0.15) | 2.1 ns (0.21) | 2.3 (0.72) | 2.3 (0.74) | 2.0 (0.88) | 1.9 (0.66) | 1.6 B (0.22) | 2.2 (0.61) | 2.1 B (0.64) | 1.4 ns (0.24) | 1.6 ns (0.22) | 2.1 (0.34) | 2.3 (0.72) | 1.8 (0.38) |
The values represent the means of four replicates, followed by standard errors in parentheses. Different vertical lowercase letters indicate significant differences between N fertilization management factors (0 and N) or between cropping system factors (S and R), Tukey’s test, significance level p < 0.05. Vertical capital letters indicate a significant difference between interacting N fertilization and cropping system factors (S0, R0, SN, and RN; Tukey’s test, significance level p < 0.05); ns indicates non-significant.
Table 6.
Leachate nitrate (NO3−) load in each period, according to nitrogen fertilization management, with (N) or without (0) fertilizer, and diversified (D) or simplified (S) cropping systems, and their interactions (S0, D0, SN, DN), in the 2018/2019 and 2019/2020 evaluation seasons.
Table 6.
Leachate nitrate (NO3−) load in each period, according to nitrogen fertilization management, with (N) or without (0) fertilizer, and diversified (D) or simplified (S) cropping systems, and their interactions (S0, D0, SN, DN), in the 2018/2019 and 2019/2020 evaluation seasons.
| Mean Leachate NO3− Load (kg ha −1) | ||||||||||||||||||||||||
|---|---|---|---|---|---|---|---|---|---|---|---|---|---|---|---|---|---|---|---|---|---|---|---|---|
| 2018/2019 | 2019/2020 | |||||||||||||||||||||||
| 1 | 2 | 3 | 4 | 5 | 6 | 7 | 8 | 9 | 10 | 11 | 12 | 13 | 14 | 15 | 16 | 17 | 18 | 19 | 20 | 21 | 22 | 23 | 24 | |
| 0 | 8.0 (0.70) | 14.2 (1.40) | 11.6 (1.40) | 0.6 b (0.06) | 0.7 b (0.10) | 0.3 b (0.04) | 1.4 (0.16) | 5.4 (0.29) | 0.4 (0.04) | 1.1 a (0.09) | 1.7 a (0.14) | 1.8 ns (0.20) | 0.0 (0.0) | 0.1 (0.01) | 0.0 (0.0) | 0.0 (0.0) | 0.5 ns (0.05) | 0.8 (0.09) | 0.7 ns (0.05) | 0.7 a (0.05) | 0.4 a (0.03) | 1.8 (0.09) | 2.8 (0.40) | 1.0 (0.14) |
| N | 9.1 (0.94) | 18.0 (2.32) | 15.0 (2.14) | 0.8 a (0.09) | 1.1 a (0.12) | 0.5 a (0.06) | 1.8 (0.18) | 5.0 (0.47) | 0.4 (0.04) | 0.8 b (0.07) | 1.1 b (0.09) | 1.5 ns (0.14) | 0.0 (0.0) | 0.1 (0.01) | 0.0 (0.0) | 0.0 (0.0) | 0.5 ns (0.06) | 0.7 (0.10) | 0.5 ns (0.08) | 0.4 b (0.03) | 0.3 b (0.01) | 1.5 (0.12) | 2.2 (0.35) | 0.7 (0.07) |
| S | 7.9 (0.87) | 14.7 (2.44) | 12.4 (2.30) | 0.7 ns (0.11) | 0.8 ns (0.15) | 0.4 ns (0.06) | 1.4 (0.20) | 5.2 (0.38) | 0.4 (0.03) | 1.0 ns (0.13) | 1.5 ns (0.15) | 1.9 a (0.17) | 0.0 (0.0) | 0.1 (0.0) | 0.0 (0.0) | 0.0 (0.0) | 0.5 ns (0.05) | 0.8 (0.09) | 0.6 ns (0.06) | 0.6 ns (0.04) | 0.3 ns (0.03) | 1.6 (0.08) | 2.7 (0.37) | 0.9 (0.11) |
| D | 9.2 (0.75) | 17.5 (1.37) | 14.2 (1.36) | 0.7 ns (0.06) | 1.0 ns (0.11) | 0.5 ns (0.06) | 1.8 (0.14) | 5.2 (1,16) | 0.4 (0.04) | 0.9 ns (0.07) | 1.2 ns (0.17) | 1.4 b (0.12) | 0.0 (0.0) | 0.1 (0.01) | 0.0 (0.0) | 0.0 (0.0) | 0.4 ns (0.06) | 0.7 (0.09) | 0.6 ns (0.09) | 0.6 ns (0.09) | 0.3 ns (0.04) | 1.7 (0.15) | 2.4 (0.41) | 0.8 (0.13) |
| S0 | 7.3 (0.48) | 11.3 (1.22) | 8.3 (1.06) | 0.4 B (0.04) | 0.5 ns (0.06) | 0.2 ns (0.02) | 1.1 (0.16) | 5.0 (0.23) | 0.5 (0.02) | 1.3 A (0.08) | 1.9 ns (0.12) | 2.0 ns (0.31) | 0.0 (0.0) | 0.1 (0.01) | 0.0 (0.0) | 0.0 (0.0) | 0.5 AB (0.08) | 0.7 (0.18) | 0.6 AB (0.05) | 0.7 ns (0.02) | 0.4 ns (0.03) | 1.7 (0.12) | 3.0 (0.64) | 1.1 (0.22) |
| D0 | 8.8 (1.30) | 17.1 (1.48) | 14.9 (0.92) | 0.7 AB (0.03) | 1.0 ns (0.07) | 0.4 ns (0.06) | 1.7 (0.18) | 5.8 (1.08) | 0.3 (0.05) | 0.9 B (0.05) | 1.6 ns (0.25) | 1.5 ns (0.20) | 0.1 (0.0) | 0.1 (0.01) | 0.0 (0.0) | 0.0 (0.0) | 0.5 AB (0.08) | 0.8 (0.06) | 0.8 A (0.03) | 0.8 ns (0.10) | 0.4 ns (0.06) | 1.9 (0.10) | 2.6 (0.55) | 0.9 (0.22) |
| SN | 8.5 (1.76) | 18.1 (4.31) | 16.4 (3.53) | 1.0 A (0.09) | 1.2 ns (0.15) | 0.5 ns (0.07) | 1.8 (0.30) | 5.5 (1.59) | 0.4 (0.05) | 0.7 B (0.08) | 1.2 ns (0.14) | 1.8 ns (0.20) | 0.0 (0.0) | 0.1 (0.0) | 0.0 (0.0) | 0.0 (0.0) | 0.6 A (0.05) | 0.9 (0.06) | 0.6 AB (0.11) | 0.5 ns (0.03) | 0.3 ns (0.01) | 1.5 (0.14) | 2.3 (0.37) | 0.8 (0.05) |
| DN | 9.6 (0.92) | 17.9 (2.54) | 13.5 (2.75) | 0.7 AB (0.14) | 1.1 ns (0.22) | 0.5 ns (0.11) | 1.8 (0.24) | 4.6 (1.01) | 0.4 (0.08) | 0.8 B (0.13) | 0.9 ns (0.08) | 1.3 ns (0.13) | 0.0 (0.0) | 0.1 (0.03) | 0.0 (0.0) | 0.0 (0.0) | 0.3 B (0.04) | 0.5 (0.14) | 0.4 B (0.12) | 0.3 ns (0.05) | 0.3 ns (0.03) | 1.4 (0.22) | 2.1 (0.66) | 0.7 (0.13) |
The values represent the means of four replicates, followed by standard errors in parentheses. Different vertical lowercase letters indicate significant differences between N fertilization management factors (0 and N) or between cropping system factors (S and R), Tukey’s test, significance level p < 0.05. Vertical capital letters indicate a significant difference between interacting N fertilization and cropping system factors (S0, R0, SN, and RN; Tukey’s test, significance level p < 0.05); ns indicates non-significant.
Disclaimer/Publisher’s Note: The statements, opinions and data contained in all publications are solely those of the individual author(s) and contributor(s) and not of MDPI and/or the editor(s). MDPI and/or the editor(s) disclaim responsibility for any injury to people or property resulting from any ideas, methods, instructions or products referred to in the content. |
© 2024 by the authors. Licensee MDPI, Basel, Switzerland. This article is an open access article distributed under the terms and conditions of the Creative Commons Attribution (CC BY) license (https://creativecommons.org/licenses/by/4.0/).
Share and Cite
MDPI and ACS Style
Bruno, I.P.; Araújo, A.G.; Merten, G.H.; Ladeira, A.S.; Pinto, V.M. Crop Rotation and Nitrogen Fertilizer on Nitrate Leaching: Insights from a Low Rainfall Study. Nitrogen 2024, 5, 329-348. https://doi.org/10.3390/nitrogen5020022
AMA Style
Bruno IP, Araújo AG, Merten GH, Ladeira AS, Pinto VM. Crop Rotation and Nitrogen Fertilizer on Nitrate Leaching: Insights from a Low Rainfall Study. Nitrogen. 2024; 5(2):329-348. https://doi.org/10.3390/nitrogen5020022
Chicago/Turabian StyleBruno, Isabeli P., Augusto G. Araújo, Gustavo H. Merten, Audilei S. Ladeira, and Victor M. Pinto. 2024. "Crop Rotation and Nitrogen Fertilizer on Nitrate Leaching: Insights from a Low Rainfall Study" Nitrogen 5, no. 2: 329-348. https://doi.org/10.3390/nitrogen5020022