Tactile Profile Classification Using a Multimodal MEMs-Based Sensing Module †
by
Thiago Eustaquio Alves De Oliveira
1,*, 
Bruno Monteiro Rocha Lima
2,
Ana-Maria Cretu
3 and
Emil M. Petriu
1 3
Department of Computer Science and Engineering, Université du Québec en Outaouais, Gatineau, QC J8X 3X7, Canada
2
The Military Institute of Engineering, Rio de Janeiro, RJ 22291-270, Brazil
1
School of Electrical Engineering and Computer Science, University of Ottawa, Ottawa, ON K1N 6N5,Canada
*
Author to whom correspondence should be addressed.
†
Presented at the 3rd International Electronic Conference on Sensors and Applications, 15–30 November 2016; Available online: https://sciforum.net/conference/ecsa-3.
Proceedings 2017, 1(2), 27; https://doi.org/10.3390/ecsa-3-E007
Published: 14 November 2016
(This article belongs to the Proceedings of Proceedings of the 3rd International Electronic Conference on Sensors and Applications, 15–30 November 2016; Available online: https://sciforum.net/conference/ecsa-3.)
Abstract
:Robots are expected to perform complex dexterous operations in a variety of applications such as health and elder care, manufacturing, or high-risk environments. In this context, the most important task is to handle objects, the first step being the ability to recognize objects and their properties by touch. This paper concentrates on the issue of surface recognition by monitoring the interaction between a tactile probe in contact with a surface. A sliding motion is performed by a robot finger (i.e., kinematic chain composed of 3 motors) carrying the tactile probe on its end. The probe comprises a 9-DOF MEMs MARG (Magnetic, Angular Rate, and Gravity) sensor and a deep MEMs pressure (barometer) sensor, both embedded in a flexible compliant structure. The sensors are placed such that, when the tip is rubbed over a surface, the MARG unit vibrates and the deep pressure sensor captures the overall normal force exerted. The tactile probe collects data over seven synthetic shapes (profiles). The proposed method to distinguish them, in frequency and time domain, consists of applying multiscale principal components analysis prior to the classification with a multilayer neural network. The achieved classification accuracies of 85.1% to 98.9% for the various sensor types demonstrate the usefulness of traditional MEMs as tactile sensors embedded into flexible substrates.
1. Introduction
Recognition of objects by touch is one of the first steps to enable robots to help humans in everyday activities. Many applications such as health and elder care, manufacturing, and high-risk environments involve tasks that require robots to handle objects that are out of their field of view or partially obstructed. To manipulate objects efficiently, robots have first to identify the objects based on their properties. Object recognition by touch can be divided in recognition through static or dynamic touch. In static touch recognition, the tactile sensing apparatus establishes contact with an object and collects tactile data while the object is in touch with the probe. In the recognition through dynamic touch, the tactile apparatus gathers data while the sensors slide over the object’s surface.
This paper focuses on the issue of tactile profile recognition through a sliding motion performed by a robot finger composed of 3 motors and equipped with a tactile probe. The tactile probe comprises a 9-DOF MEMs MARG (Magnetic, Angular Rate, and Gravity) system and a deep MEMs pressure (barometer) sensor, both embedded in a compliant structure. This setup collects data over seven 3D printed profiles. The data collected is then subject to a wavelet decomposition stage, principal component analysis and classification using a multilayer perceptron neural network.
The following section discusses relevant work in the literature. The material and methods employed in the experimental setup are detailed in Section 3. This is followed by a presentation of our approach for the problem of shape discrimination from multi-sensory data collected during a sliding motion of a robot finger in Section 4. The experimental results are presented in Section 5. Finally, insights on future work and final considerations are described in Section 6.
2. Literature Review
Artificial tactile systems require strategies to interpret information collected while interacting with real-world objects, and should choose which type of movements to execute such that the chances of success in a given task are increased. Such systems also need to select or prioritize the information coming from various sensors.
The design of tactile sensors and the interpretation of the data gathered by such sensors is the subject of vast literature [1]. Several researchers have built artificial sensing fingers in order to investigate their performance during probing and exploration tasks. A biomimetic fingertip that can detect force and vibration is developed by Chathuranga et al. [2,3]. The tip, comprised of commercial accelerometers and force sensors, is attached to the end of a robotic finger and performs sliding exploratory movements while touching six fabrics and one metal in one experiment, and seven wood samples in another experiment. The goal is to evaluate the ability of the system to discriminate fabrics and wood based on surface textures. The signals recuperated from the accelerometers are recorded and employed to calculate three features, based on which an artificial neural network classifies the samples. The discrimination success rate were increased by the use of vectors from the Fourier coefficients of the signals and the convolution of these signals.
Another example of application of inertial information in a tactile context is found in [4]. A tactile probe in form of a small metallic rod with a single-axis accelerometer attached to its tip is employed to classify surfaces based on their mean, variance, and higher order moments using a neural network. A training data set is collected over ten different indoor and outdoor surfaces, and the neural network achieves an average classification rate of 89.9–94.6%.
This paper presents the use of conventional MEMs sensors embedded in a flexible compliant substrate in the context of surface recognition. A 9-DOF MEMs MARG (Magnetic, Angular Rate, and Gravity) module and a MEMs pressure (barometer) sensor are positioned so that when the tip is rubbed over a surface, the MARG unit vibrates and the deep pressure sensor captures the overall normal force exerted. A solution is then proposed to classify surface profiles based on the data collected by these sensors.
3. Experimental Setup
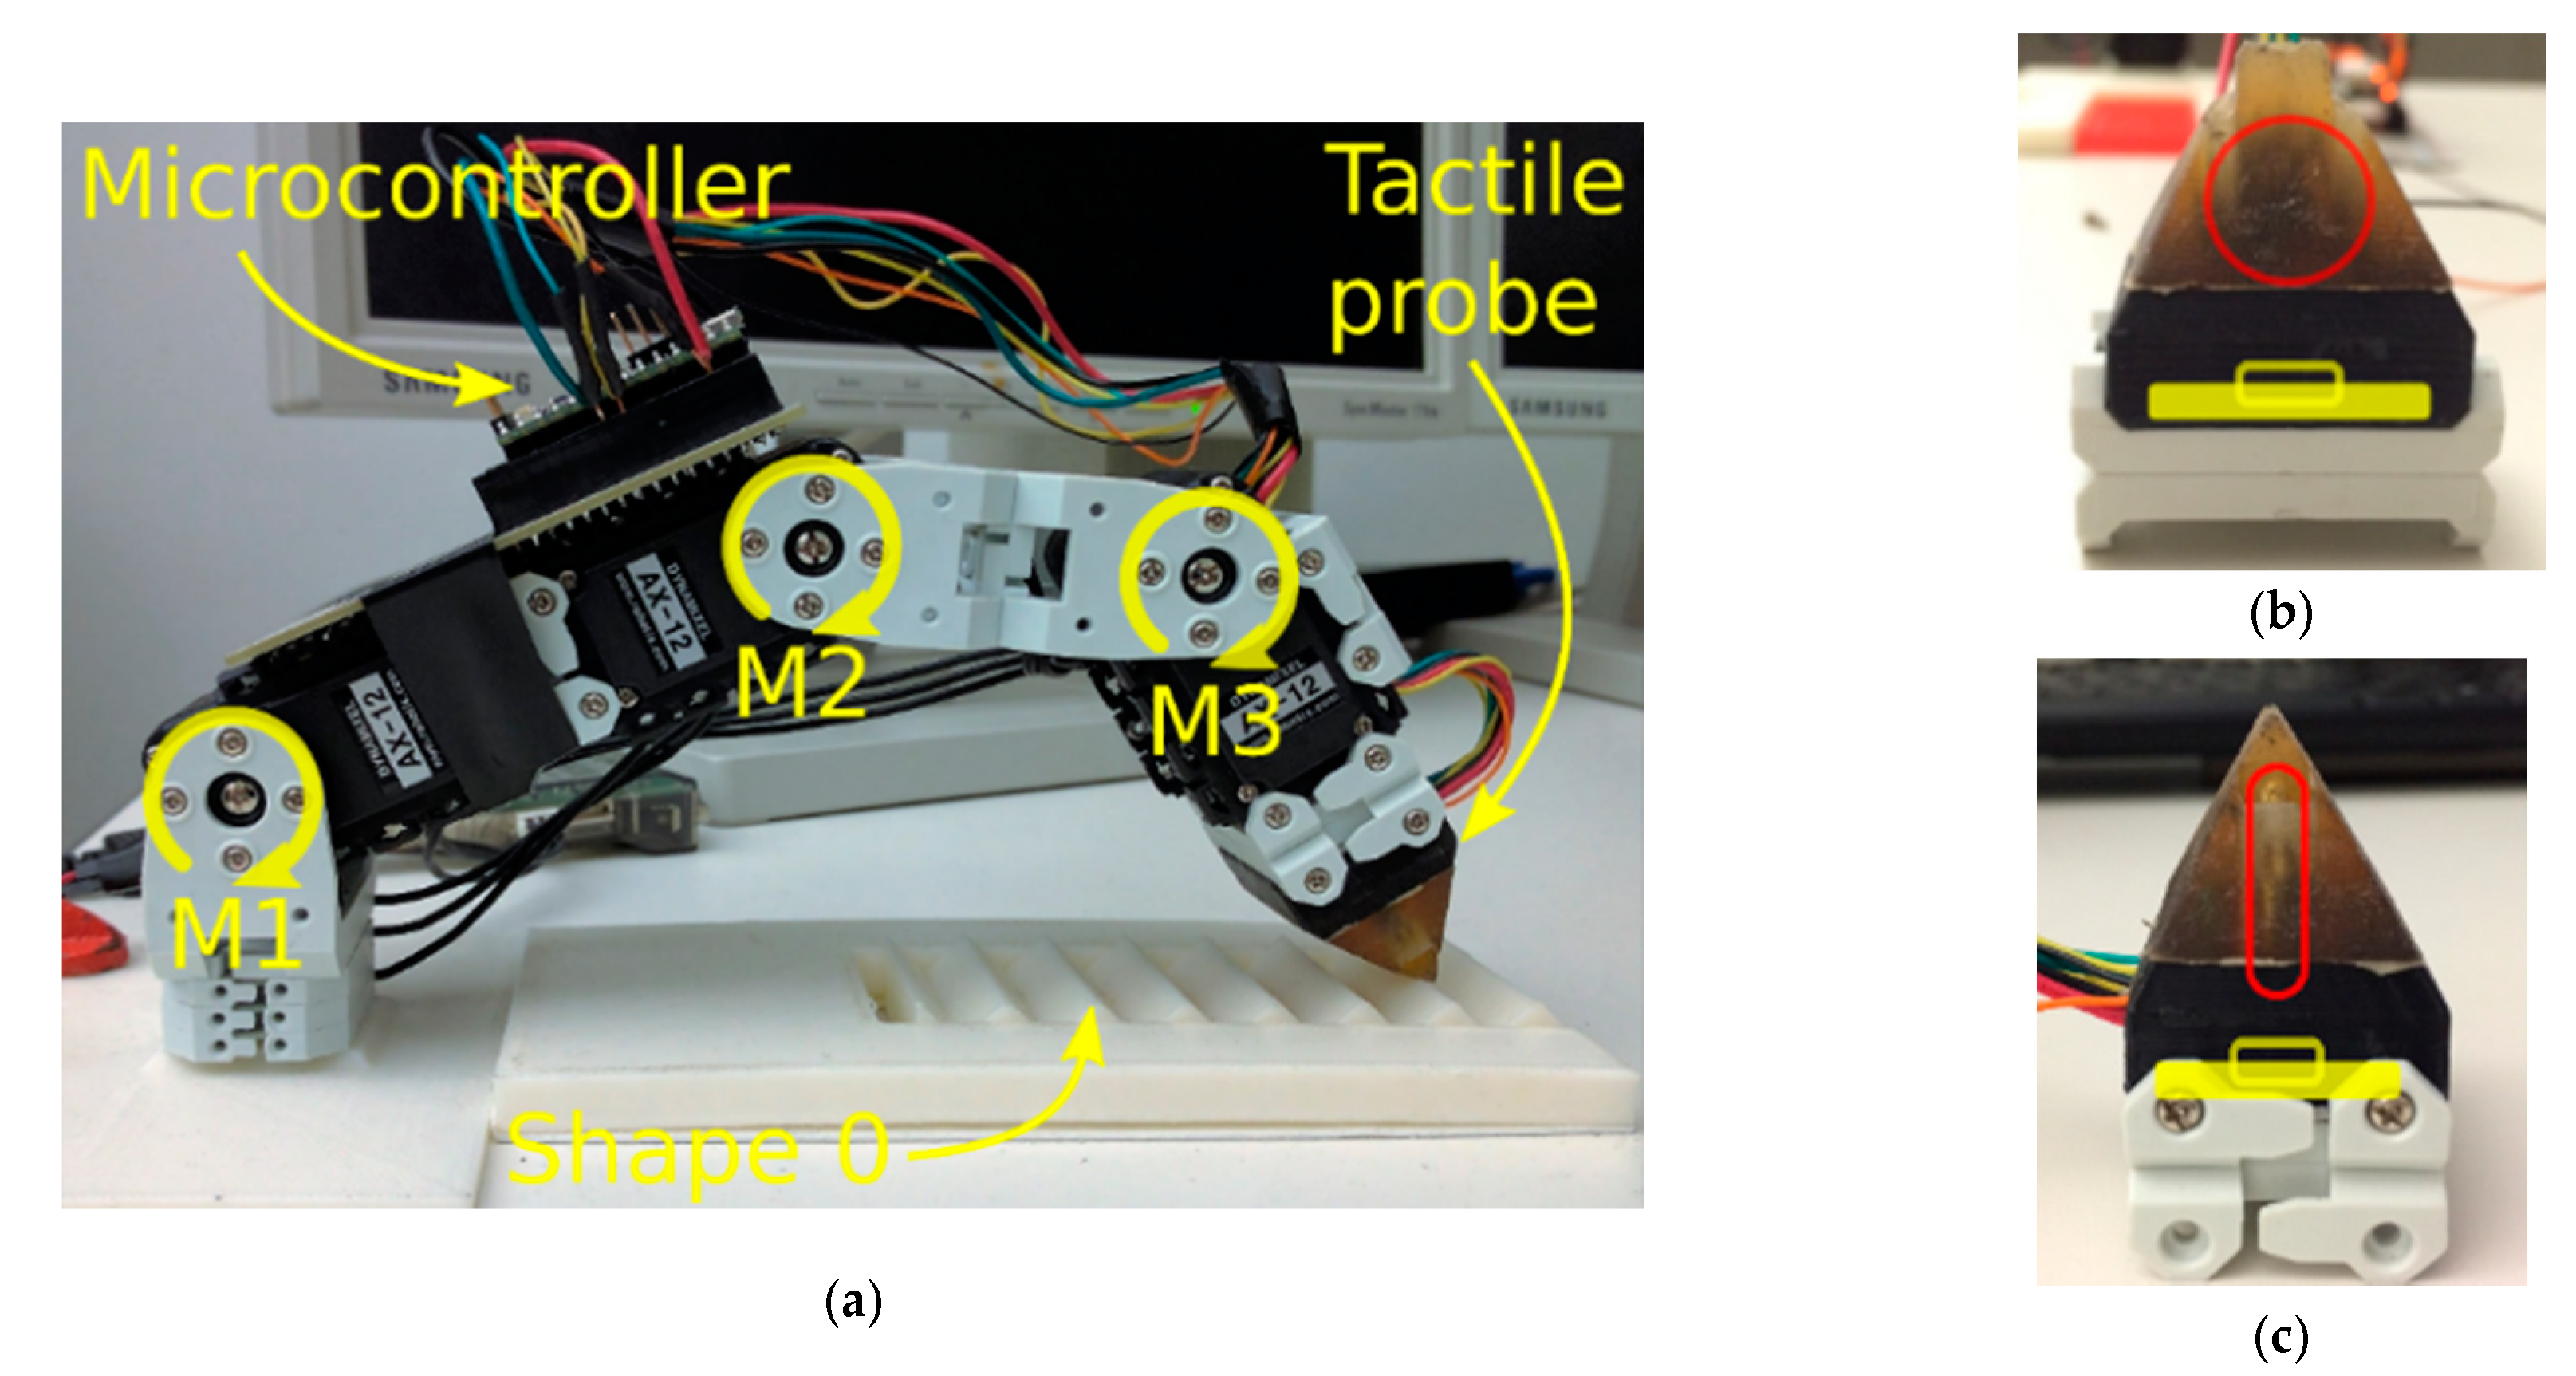
The experimental setup used for experimentation is illustrated in Figure 1. The finger prototype used to perform the sliding motions is shown in Figure 1a. It contains 3 Dynamixel AX-12A robot actuators labeled M1 (bottom), M2 (middle) and M3 (top). The MARG system, embedded in the flexible substrate, is illustrated in Figure 1b. The 9-DOF MARG system used in the experimentation is the LSM9DS0 from STMicroelectronics©, composed of a triple-axis accelerometer, a triple-axis gyroscope, and a triple-axis magnetometer. The pressure sensor (MPL115A2 from Freescale Semiconductor©) seats on the bottom of the black 3D printed collar that holds the compliant structure. The flexible rubber from the compliant structure is made of VytaFlex© Shore 20A. The microcontroller serving as an interface between the computer that collects and analyzes data and the sensors is an MK20DX256VLH7 Cortex-M4 at 72 MHz. It is connected to the sensors through a two-wire interface (TWI) at 400 KHz. The microcontroller connects to the computer through an USB Serial interface.
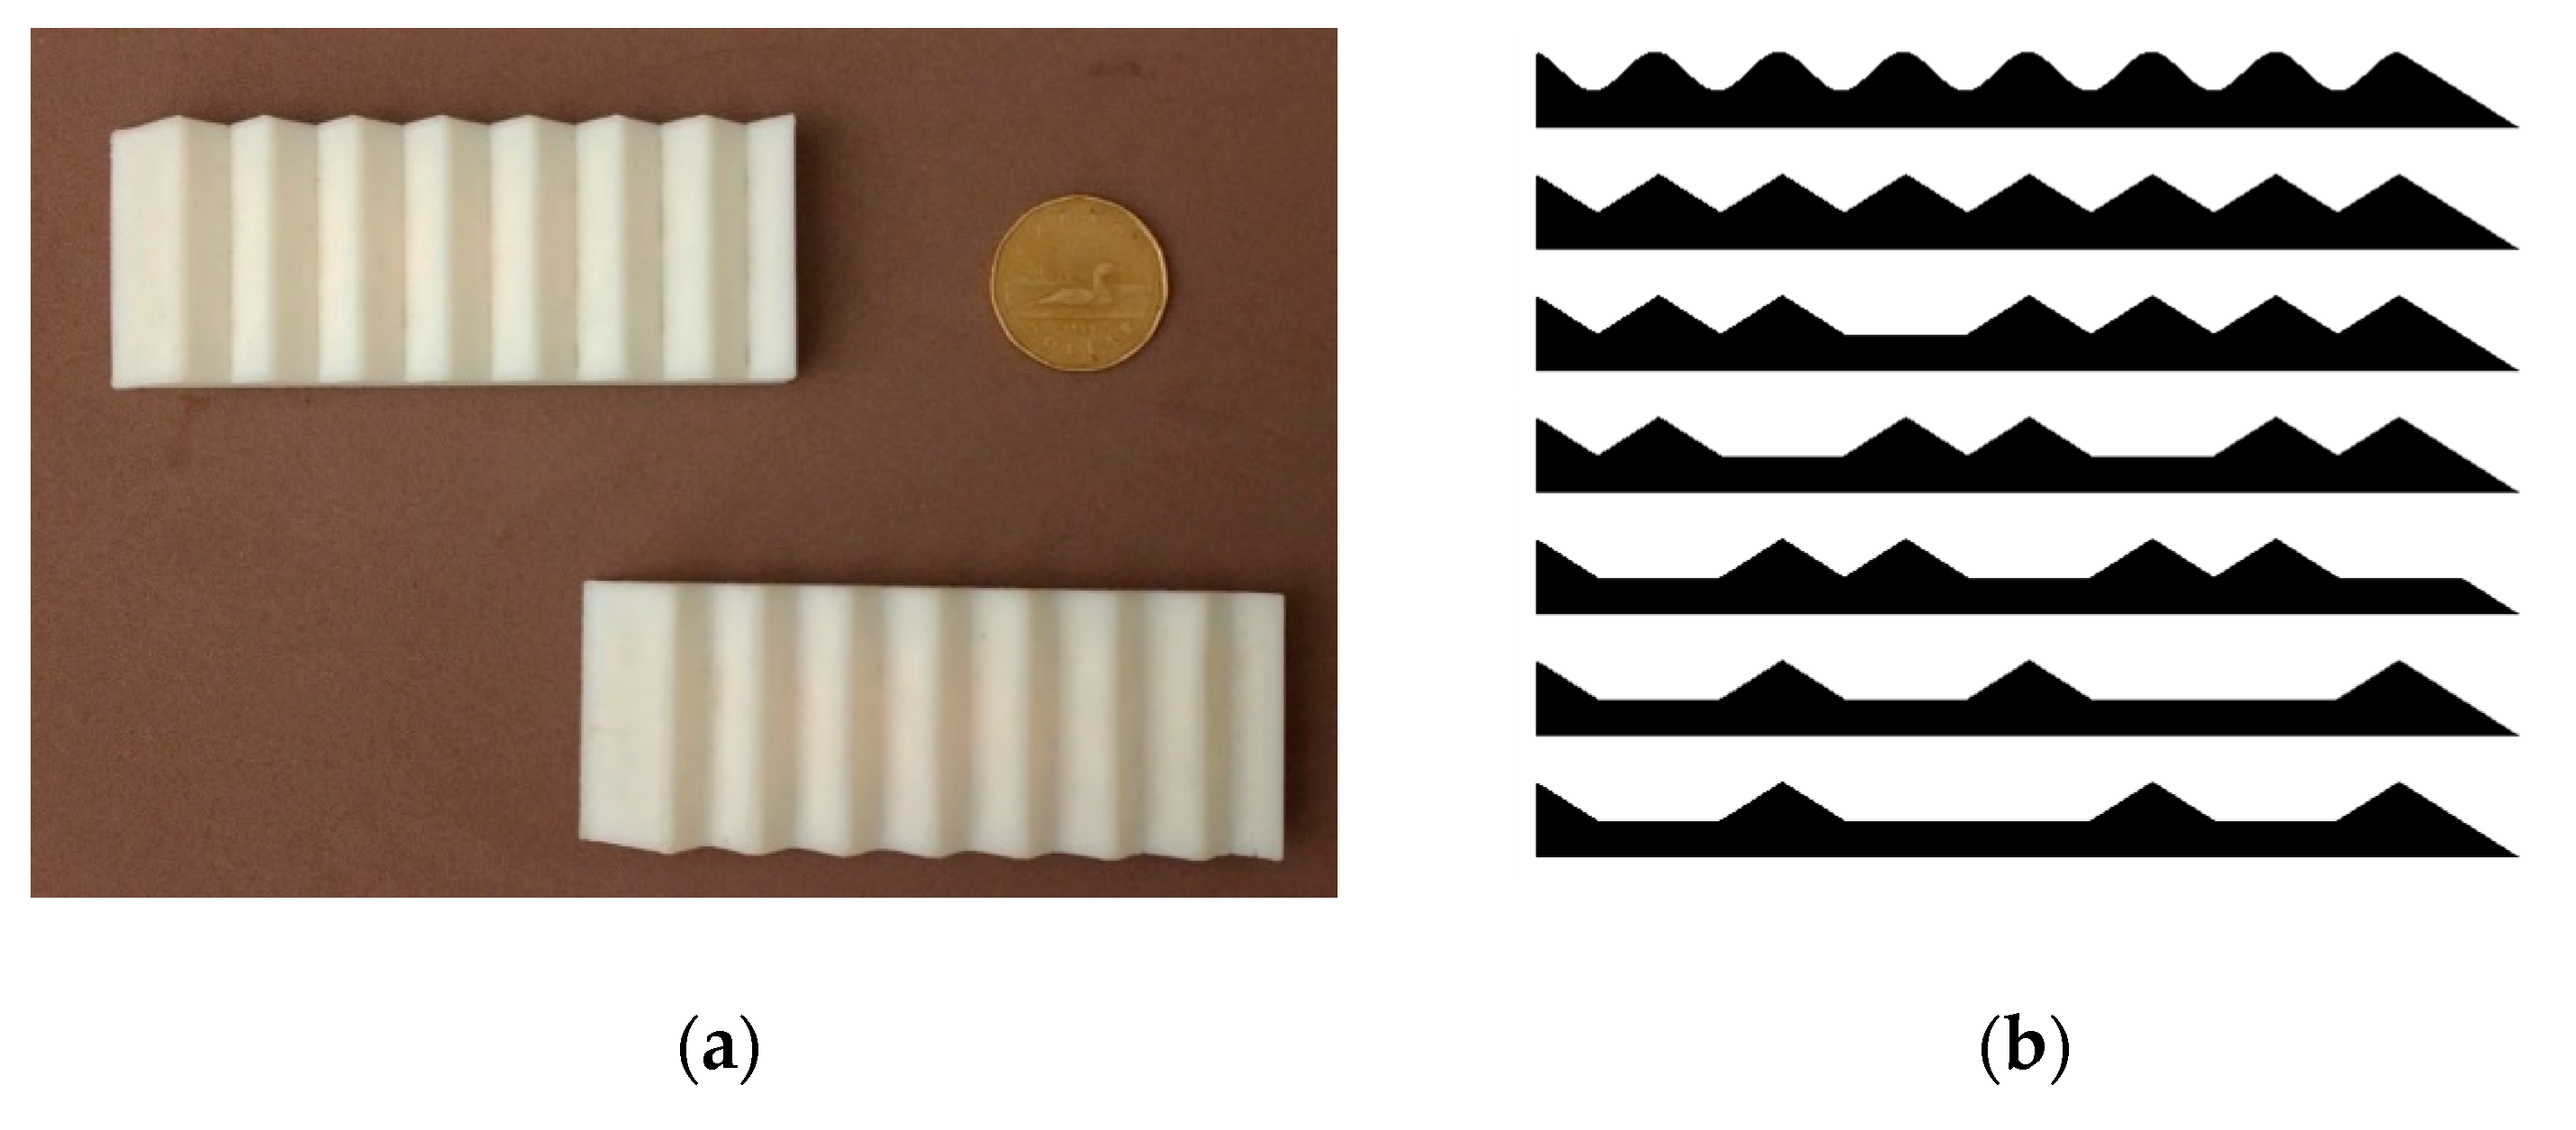
The ABS 3D-printed shapes are fixed in front of the robotic finger that establishes contact and slides the tactile tip over them. Shapes 1 and 2 can be seen in Figure 2a, while the seven profiles used for testing are shown in Figure 2b.
The data acquisition software is developed using the Robotic Operating System (ROS). A standard recorded movement is executed over each of the shapes and the data representing acceleration, angular velocity, magnetic field direction, and intensities is saved in a database. The latter contains 100 samples for each shape, 700 samples in total. From these, 175 samples (or 25 for each class) were randomly chosen for training, in order to accommodate tip abrasion, temperature variance, and other possible outliers. Over the time, the tip could become worn and the temperature due to friction could affect the collected data.
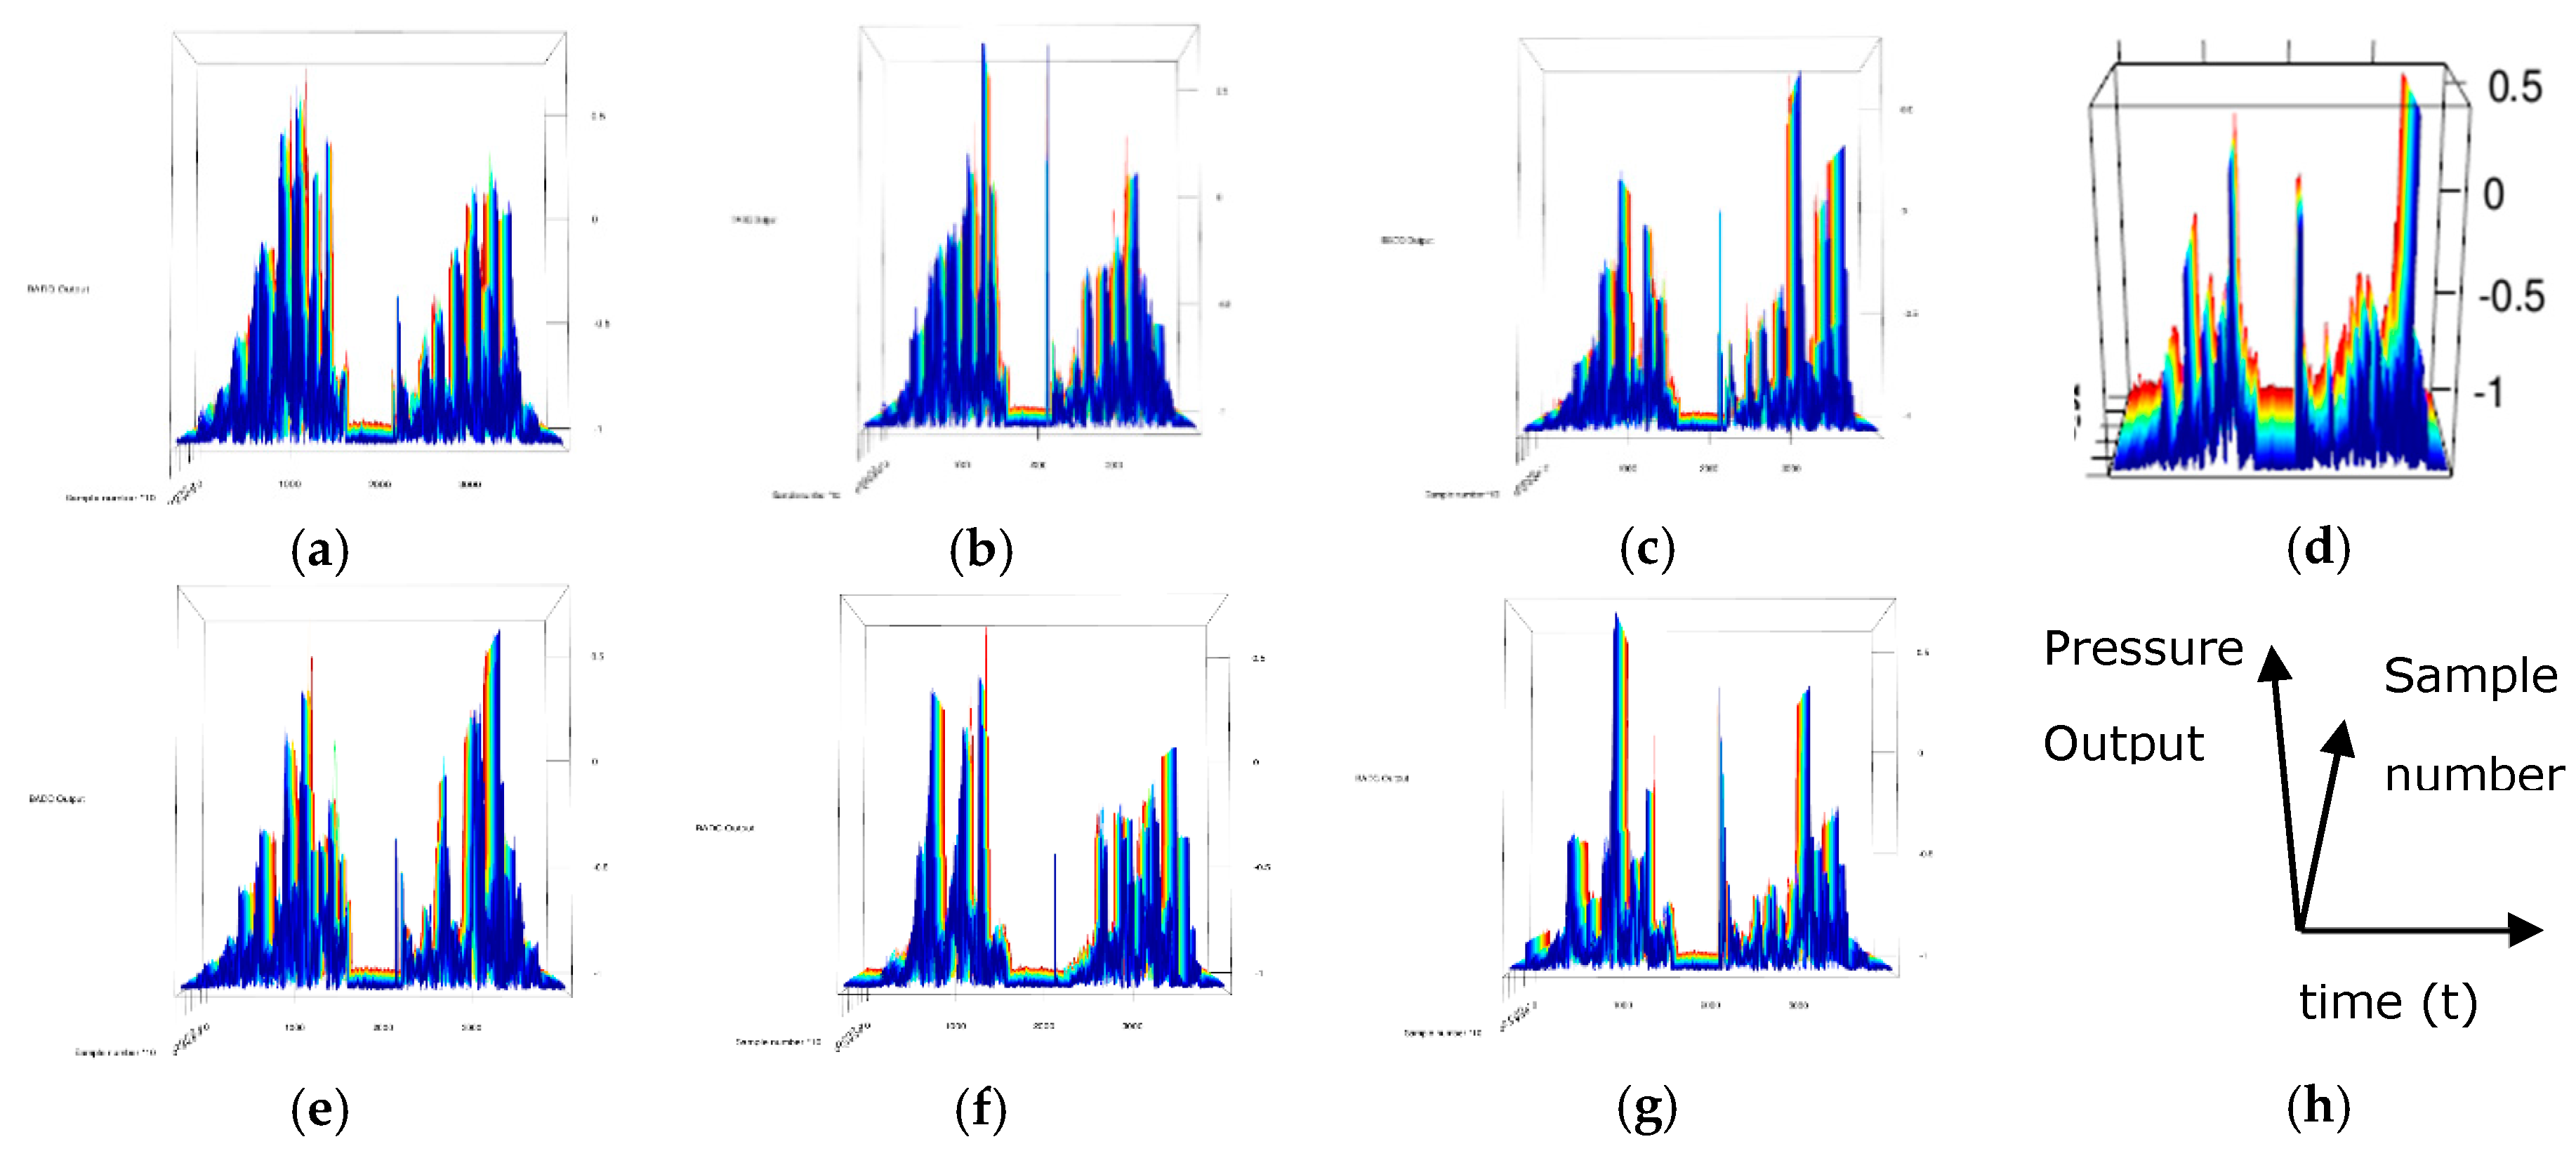
The graphs in Figure 3 show for example the normalized pressure data for each shape. The vertical axes represents the pressure level (Figure 3h), the horizontal axis the discrete time, varying for 0 to 3800 and the number of sample varying from 0 to 100 is shown over the depth dimension. Figure 3d is presented under a slightly different viewpoint to emphasize the number of samples collected.
4. Proposed Approach for Surface Profile Classification
The tactile tip is slid against seven synthetic profiles and the data collected passes by three stages to discriminate the surfaces: (a) wavelet decomposition; (b) principal component analysis and; (c) classification by a multilayer perceptron (MLP) neural network.
Initially, the signals of each axis collected by the MARG system and barometer are subjected to a Discrete Wavelet Transform (DWT) decomposition [5] in order to reduce the noise. The DWT decomposition consists on the simultaneous filtering of the signals by a low-pass filter, to generate the approximation coefficients, cA1, and by a high-pass to produce the detail coefficients, cD1. The same operation is iteratively applied to the previous approximation signal producing new levels of approximation cAi and detail cDi. In this paper the low- and high-pass filters applied to the sensors signals are based on the fifth order of Symlets wavelet (sym5) and the decomposition level is set to 5.
The data resulting from the wavelet decomposition is then subject to principal component analysis (PCA). PCA [6] is a multivariate method of analysis widely applied on multidimensional data sets for dimensionality reduction. This approach reduces the number of variables in a dataset retaining as much as possible of its variances. PCA achieves the retention of variance by projecting the original correlated variables into a new set of uncorrelated variables. This reduction is carried out by taking a dataset consisting of p variables X1...Xp and finding the combinations of these to produce uncorrelated orthogonal principal components (PCs) PC1...PCp. There are many ways to find PCs; according to the eigenvalue decomposition, PCs are eigenvectors basis for transformation from data space to feature space. The eigenvalues related to these eigenvectors are a measure of each PC representativeness. Organizing the eigenvalues and eigenvectors enables the selection of the most important principal components. The projection of the original data onto a subset of PCs reduces the dataset dimensionality maintaining the variance proportional to the eigenvalues of the number of PCs used. In this paper, original data of each sensor is reduced to the number of components corresponding to 90% of the total variance.
After PCA is performed on the wavelet decomposition data, we apply a multilayer perceptron neural network to classify the signals into their corresponding profiles. The feature vectors resulting from the PCA are the input to a two layer feed forward neural network with ten nodes in the hidden layer, and seven neurons in the output layer, the latter corresponding to the number of shapes. The activation functions of all neurons are hyperbolic tangents. The MLP is trained using the scaled conjugate gradient backpropagation method [7].
5. Experimental Results
The results of the classification for the data of the 5th wavelet approximation level of each sensor axis are shown in Table 1. Each DOF of the MARG sensor is classified individually. The accelerometer group obtains a classification accuracy between 85.1 and 92.6%. The accuracy when considering the gyroscope group is between 93.3 and 98.9%. When considering the magnetic field variations along the trajectory, the results range is 86.9–91.4%. The pressure profile measured by the barometer yields an accuracy of 98.9%.
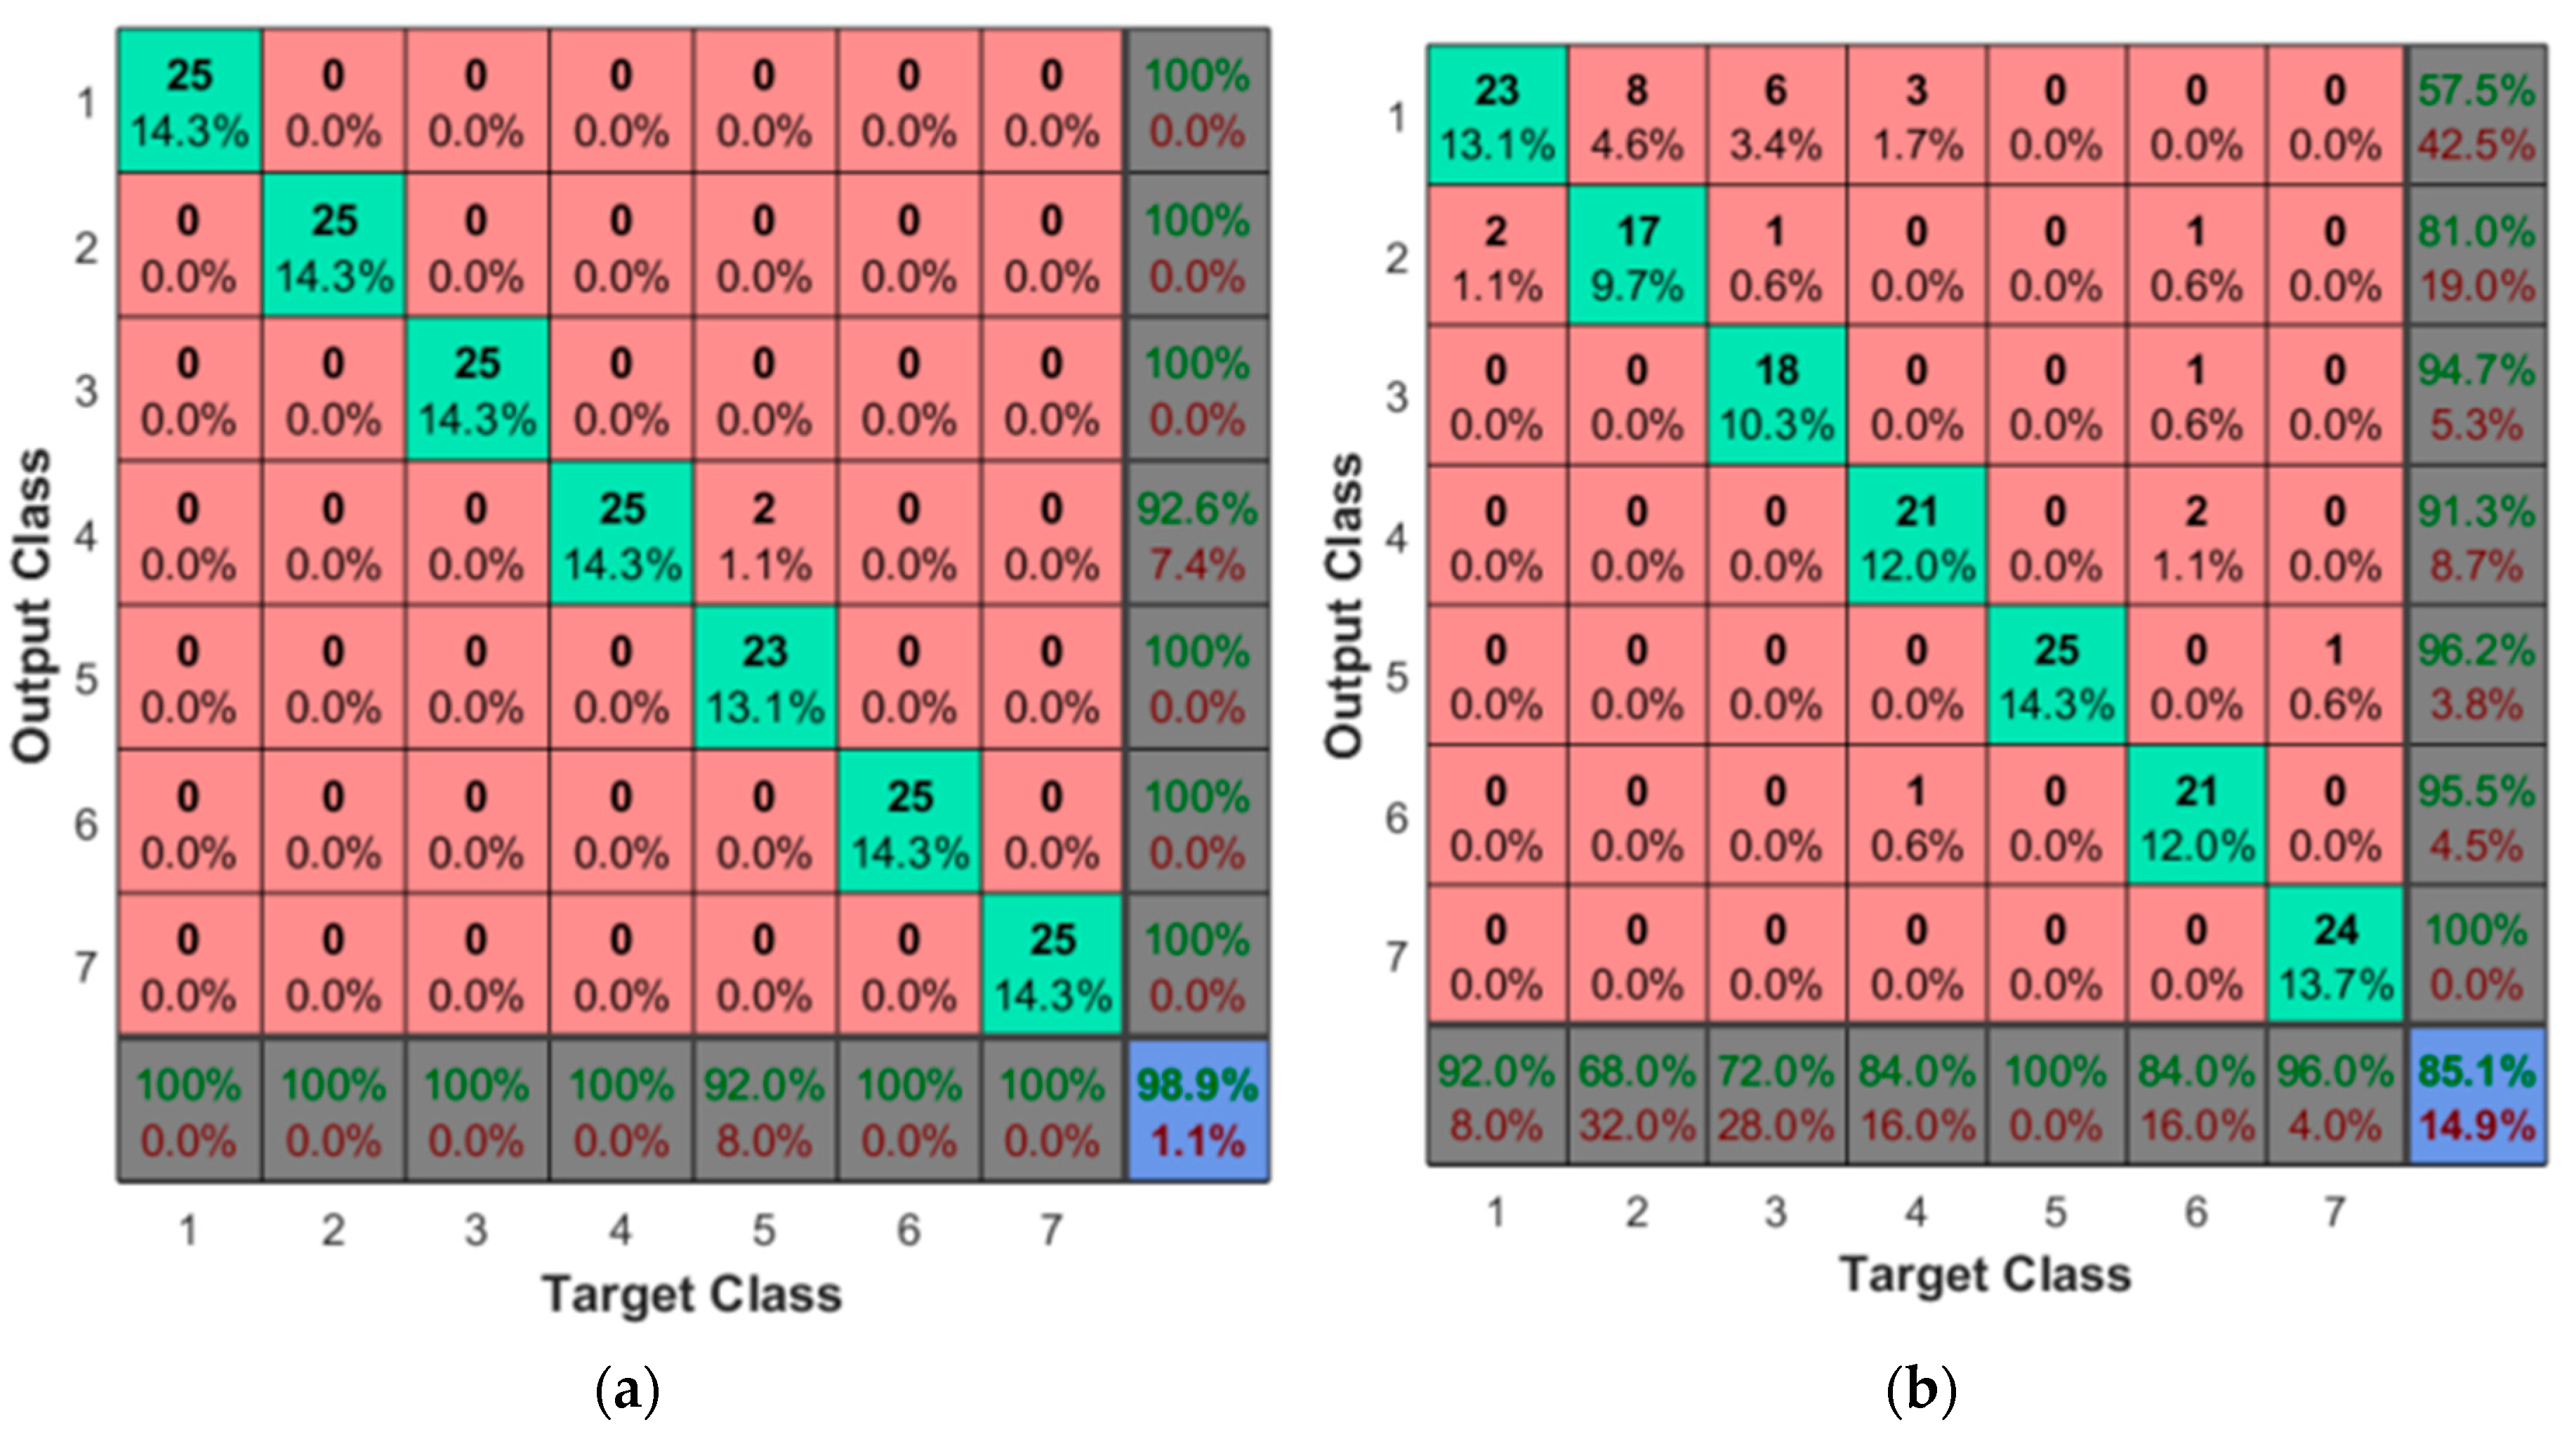
The results from the acceleration suggest that the z-axis is the least aligned of the three. Because the angular velocity sensor is sensitive to shock/vibration even when the direction of the event is not aligned with its axis, it obtains high accuracy rates in all axis. The low variations of the magnetic field lead to classification rates not as high as those obtained by the inertial sensors. The classification using the data measured by the barometer achieved one of the highest accuracy rates due to the variation of pressure over time and discontinuity of the contact between tactile tip and shapes while the movement was performed. Most of the classification errors for the inertial sensors happened between shapes 1 and 2 due to their similarity, as shown in Figure 2b and in the confusion table in Figure 4b. This is not the case when the sensor considered is the barometer, as shown in Figure 4a where the misclassification affects mainly shape 5.
6. Conclusions
This paper presents the classification of 7 synthetic shapes based on tactile data from a barometer and a MARG system embedded in a flexible robotic fingertip. The classification task consisted on a 3-DOF robotic finger sliding its tactile-enabled tip over a set of 7 synthetic shapes and collecting data of accelerations, angular velocities, magnetic field variations and pressure measures inside the flexible material. The measurements were subject to wavelet decomposition and the 5th level approximation had its dimensionality reduced to 10% before the classification by an MLP neural network. The future work will concentrate on the evaluation of the proposed approach over a larger dataset, including fabrics and plastics for texture classification and on the means by which different wavelet decomposition levels can be employed to discriminate fine textures and shapes.
Author Contributions
Thiago Eustaquio Alves de Oliveira and Emil M. Petriu conceived and designed the experiments; Bruno Monteiro Rocha Lima performed the experiments; Thiago Eustaquio Alves de Oliveira analyzed the data; Thiago Eustaquio Alves de Oliveira and Ana-Maria Cretu wrote the paper.
Acknowledgments
This work was supported in part by the Discovery Grants program of the Natural Sciences and Engineering Research Council of Canada (NSERC).
Conflicts of Interest
The authors declare no conflict of interest. The founding sponsors had no role in the design of the study; in the collection, analyses, or interpretation of data; in the writing of the manuscript, and in the decision to publish the results.
Abbreviations
| DWT | Discrete Wavelet Transform |
| PCA | Principal Component Analysis |
| MLP | Multilayer Perceptron |
| DOF | Degree of Freedom |
References
- Dahiya, R.S.; Mittendorfer, P.; Valle, M.; Cheng, G.; Lumelsky, V.J. Directions toward effective utilization of tactile skin: A review. IEEE Sens. J. 2013, 13, 4121–4138. [Google Scholar] [CrossRef]
- Chathuranga, D.S.; Ho, V.A.; Hirai, S. Investigation of a biomimetic fingertip’s ability to discriminate fabrics based on surface textures. In Proceedings of the 2013 IEEE/ASME International Conference on Advanced Intelligent Mechatronics (AIM), Wollongong, Australia, 9–12 July 2013; pp. 1667–1674. [Google Scholar]
- Chathuranga, D.S.; Wang, Z.; Ho, V.A.; Mitani, A.; Hirai, S. A biomimetic soft fingertip applicable to haptic feedback systems for texture identification. In Proceedings of the 2013 IEEE International Symposium on Haptic Audio Visual Environments and Games (HAVE), Istanbul, Turkey, 26–27 October 2013; pp. 29–33. [Google Scholar]
- Dallaire, P.; Emond, D.; Giguere, P.; Chaib-Draa, B. Artificial tactile perception for surface identification using a triple axis accelerometer probe. In Proceedings of the 2011 IEEE International Symposium on Robotic and Sensors Environments (ROSE), Montreal, Canada, 17–18 September 2011; pp. 101–106. [Google Scholar]
- Mallat, S.G. A Theory for Multiresolution Signal Decomposition: The Wavelet Representation. IEEE Transactions on Pattern Analysis and Machine Intelligence 1989, 11(7), 674–693. [Google Scholar] [CrossRef]
- Bro, R.; Smilde, A.K. Principal component analysis. Anal. Methods 2014, 6, 2812. [Google Scholar] [CrossRef]
- Møller, M.F. A scaled conjugate gradient algorithm for fast supervised learning. Neural Netw. 1993, 6, 525–533. [Google Scholar] [CrossRef]
Figure 1.
Experimental setup: (a) Robot finger composed of 3 motors: M1 is the “bottom” motor; M2 is the “middle” motor; and M3 is the “top” motor. The microcontroller is attached on top of Motors M1 and M2. (b) Front view of the tactile probe: the MARG system is embedded under the red circle; the pressure sensor is under the yellow overlay in the black 3D printed collar. (c) Side view of the tactile probe.

Figure 2.
3D printed shapes: (a) Shape 2 on the top and shape 1 on the bottom; (b) List of shapes from shape 1 on the top to shape 7 on the bottom.
Figure 2.
3D printed shapes: (a) Shape 2 on the top and shape 1 on the bottom; (b) List of shapes from shape 1 on the top to shape 7 on the bottom.

Figure 3.
(a–g) Normalized pressure samples collected over the shapes 1 to 7; and (h) meaning of axes for the preceding plots.
Figure 3.
(a–g) Normalized pressure samples collected over the shapes 1 to 7; and (h) meaning of axes for the preceding plots.

Figure 4.
Confusion tables for: (a) barometer, showing the misclassification of shape 5 as shape 4; (b) accelerometer on x-axis, showing the misclassification between shapes 1 and 2.
Figure 4.
Confusion tables for: (a) barometer, showing the misclassification of shape 5 as shape 4; (b) accelerometer on x-axis, showing the misclassification between shapes 1 and 2.


Table 1.
Classification results.
| Sensor | Accuracy (%) |
|---|---|
| Accelerometer X | 92 |
| Accelerometer Y | 92.6 |
| Accelerometer Z | 85.1 |
| Gyroscope X | 98.3 |
| Gyroscope Y | 93.3 |
| Gyroscope Z | 98.9 |
| Magnetometer X | 88 |
| Magnetometer Y | 86.9 |
| Magnetometer Z | 91.4 |
| Barometer | 98.9 |
Publisher’s Note: MDPI stays neutral with regard to jurisdictional claims in published maps and institutional affiliations. |
© 2016 by the authors. Licensee MDPI, Basel, Switzerland. This article is an open access article distributed under the terms and conditions of the Creative Commons Attribution (CC BY) license (https://creativecommons.org/licenses/by/4.0/).
Share and Cite
MDPI and ACS Style
Alves De Oliveira, T.E.; Lima, B.M.R.; Cretu, A.-M.; Petriu, E.M. Tactile Profile Classification Using a Multimodal MEMs-Based Sensing Module. Proceedings 2017, 1, 27. https://doi.org/10.3390/ecsa-3-E007
AMA Style
Alves De Oliveira TE, Lima BMR, Cretu A-M, Petriu EM. Tactile Profile Classification Using a Multimodal MEMs-Based Sensing Module. Proceedings. 2017; 1(2):27. https://doi.org/10.3390/ecsa-3-E007
Chicago/Turabian StyleAlves De Oliveira, Thiago Eustaquio, Bruno Monteiro Rocha Lima, Ana-Maria Cretu, and Emil M. Petriu. 2017. "Tactile Profile Classification Using a Multimodal MEMs-Based Sensing Module" Proceedings 1, no. 2: 27. https://doi.org/10.3390/ecsa-3-E007