Proceeding Paper

Characterization of Acoustic Sources by Optical Feedback Interferometry †

1
Laboratory for Analysis and Architecture of Systems(LAAS-CNRS), Université de Toulouse, CNRS, INP, Toulouse, France
2
Universidad Politécnica Salesiana, Cuenca, Ecuador
*
Author to whom correspondence should be addressed.
Presented atthe Eurosensors 2017 Conference, Paris, France, 3–6 September 2017.
Proceedings 2017, 1(4), 348; https://doi.org/10.3390/proceedings1040348
Published: 23 August 2017
(This article belongs to the Proceedings of Proceedings of Eurosensors 2017, Paris, France, 3–6 September 2017)

Abstract

:
Sound can be described as the propagation of pressure variations in compressible media that involves compression and expansion and induces a change in the density of the medium. This change in acoustic pressure as it induces a change of the refractive index can be measured by optical methods, the most recent being the optical feedback interferometry. With this technique, a laser diode is beaming on a reflective surface thus creating a cavity where the acoustic wave propagates. This paper presents anovel experimental technique to measure radiation pattern of acoustic sources based on optical feedback interferometry in a laser diode.

1. Introduction

In the present research, we have elaborated a novel system to measure the sound pressure level emitted by an acoustic source. The measurement principle stands on the impact of the acoustic pressure on the transparent medium refractive index [1,2,3,4,5]. The experimental arrangement is as follows: the laser and the reflective surface are set in a fixed position while the acoustic wave crosses the laser beam and the change in refractive index induces changes of the optical path of the cavity (Figure 1). The variation of the laser emitted power PF is given by [2]:
P F = P 0 [ 1 + m cos ( ω F τ ) ]
where P 0 is the laser emitted power without optical feedback, m is the modulation index that depends mostly on the reflectivity of the cavity and ω F is the angular frequency of the laser electric field. Eventually, τ is the round-trip time of flight in the external cavity. In the present situation τ = τ 0 + δ τ , where τ 0 is the round-trip time in absence of pressure variations that is equal to 2 n 0 L / c with L the length of the laser-target cavity, c is the velocity of light in vacuum and n 0 is the refractive index of the external cavity medium. The variation induced by the medium compression δ τ can be defined by
δ τ = 0 L 2 δ n ( z ) c d z
where δ n ( z ) is the change of the refractive index along the Z axis where the laser propagates.

2. Experimental Setup

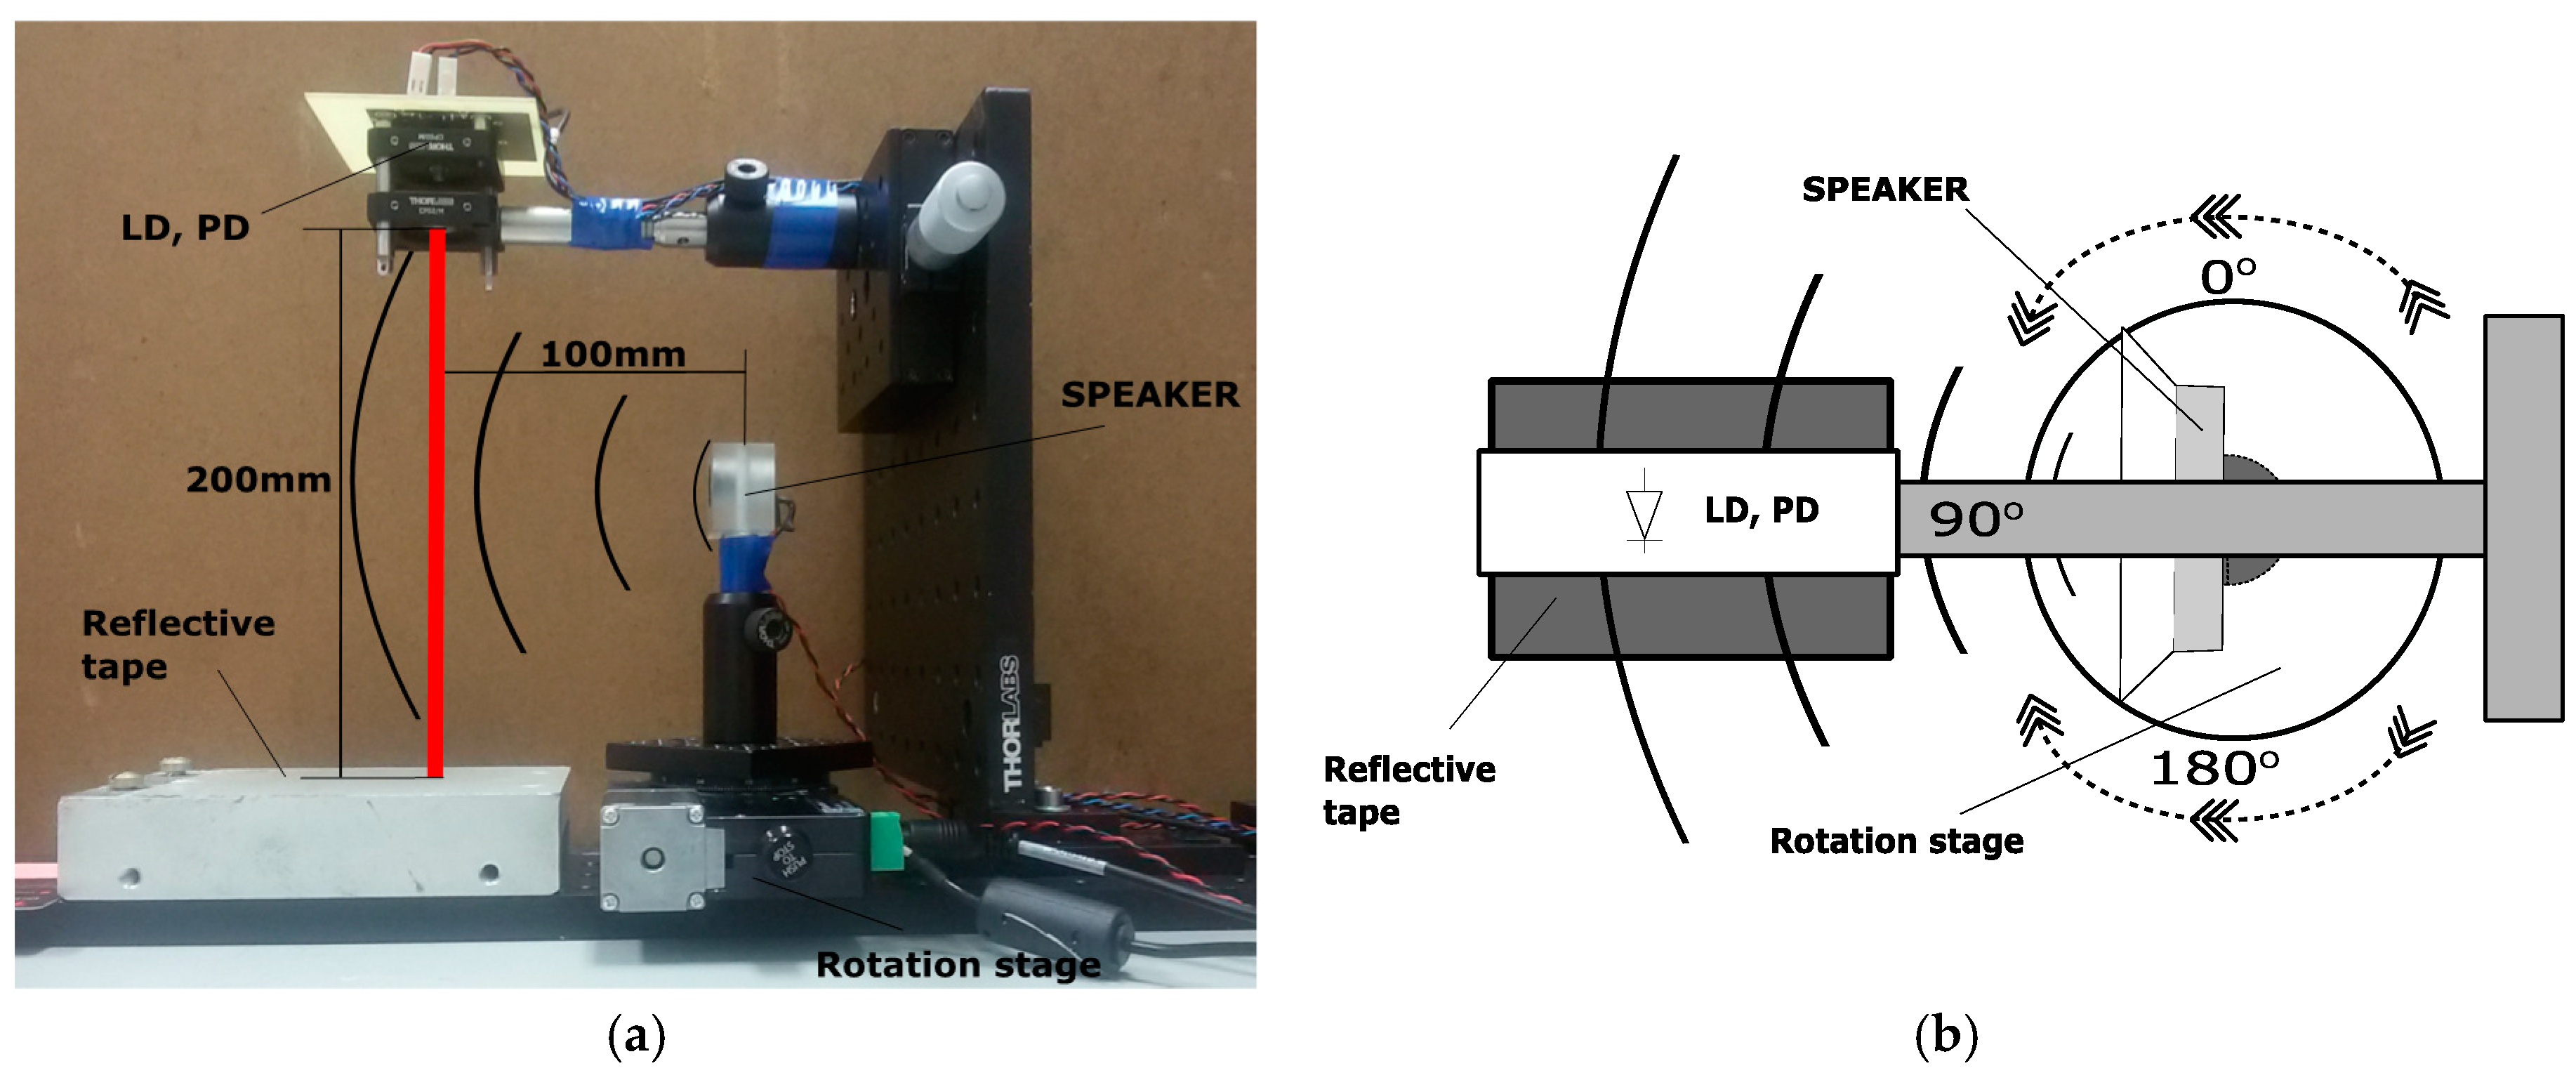
The acoustic source is an ultrasonic piezoelectric transmitter (MA40B8S) driven by a sinusoidal voltage at 40 kHz. It is mounted on a rotating stage controlled by a step motor. The optical feedback interferometer consists in a laser diode ML725B11F emitting at 1310 nm and a microspheres reflective tape glued on the target. The distance between the laser and the target is 200 mm and the sound wave propagates in a perpendicular plane to the laser propagation axis (Figure 2a). The distance between the laser beam and the acoustic source is set to 100mm.
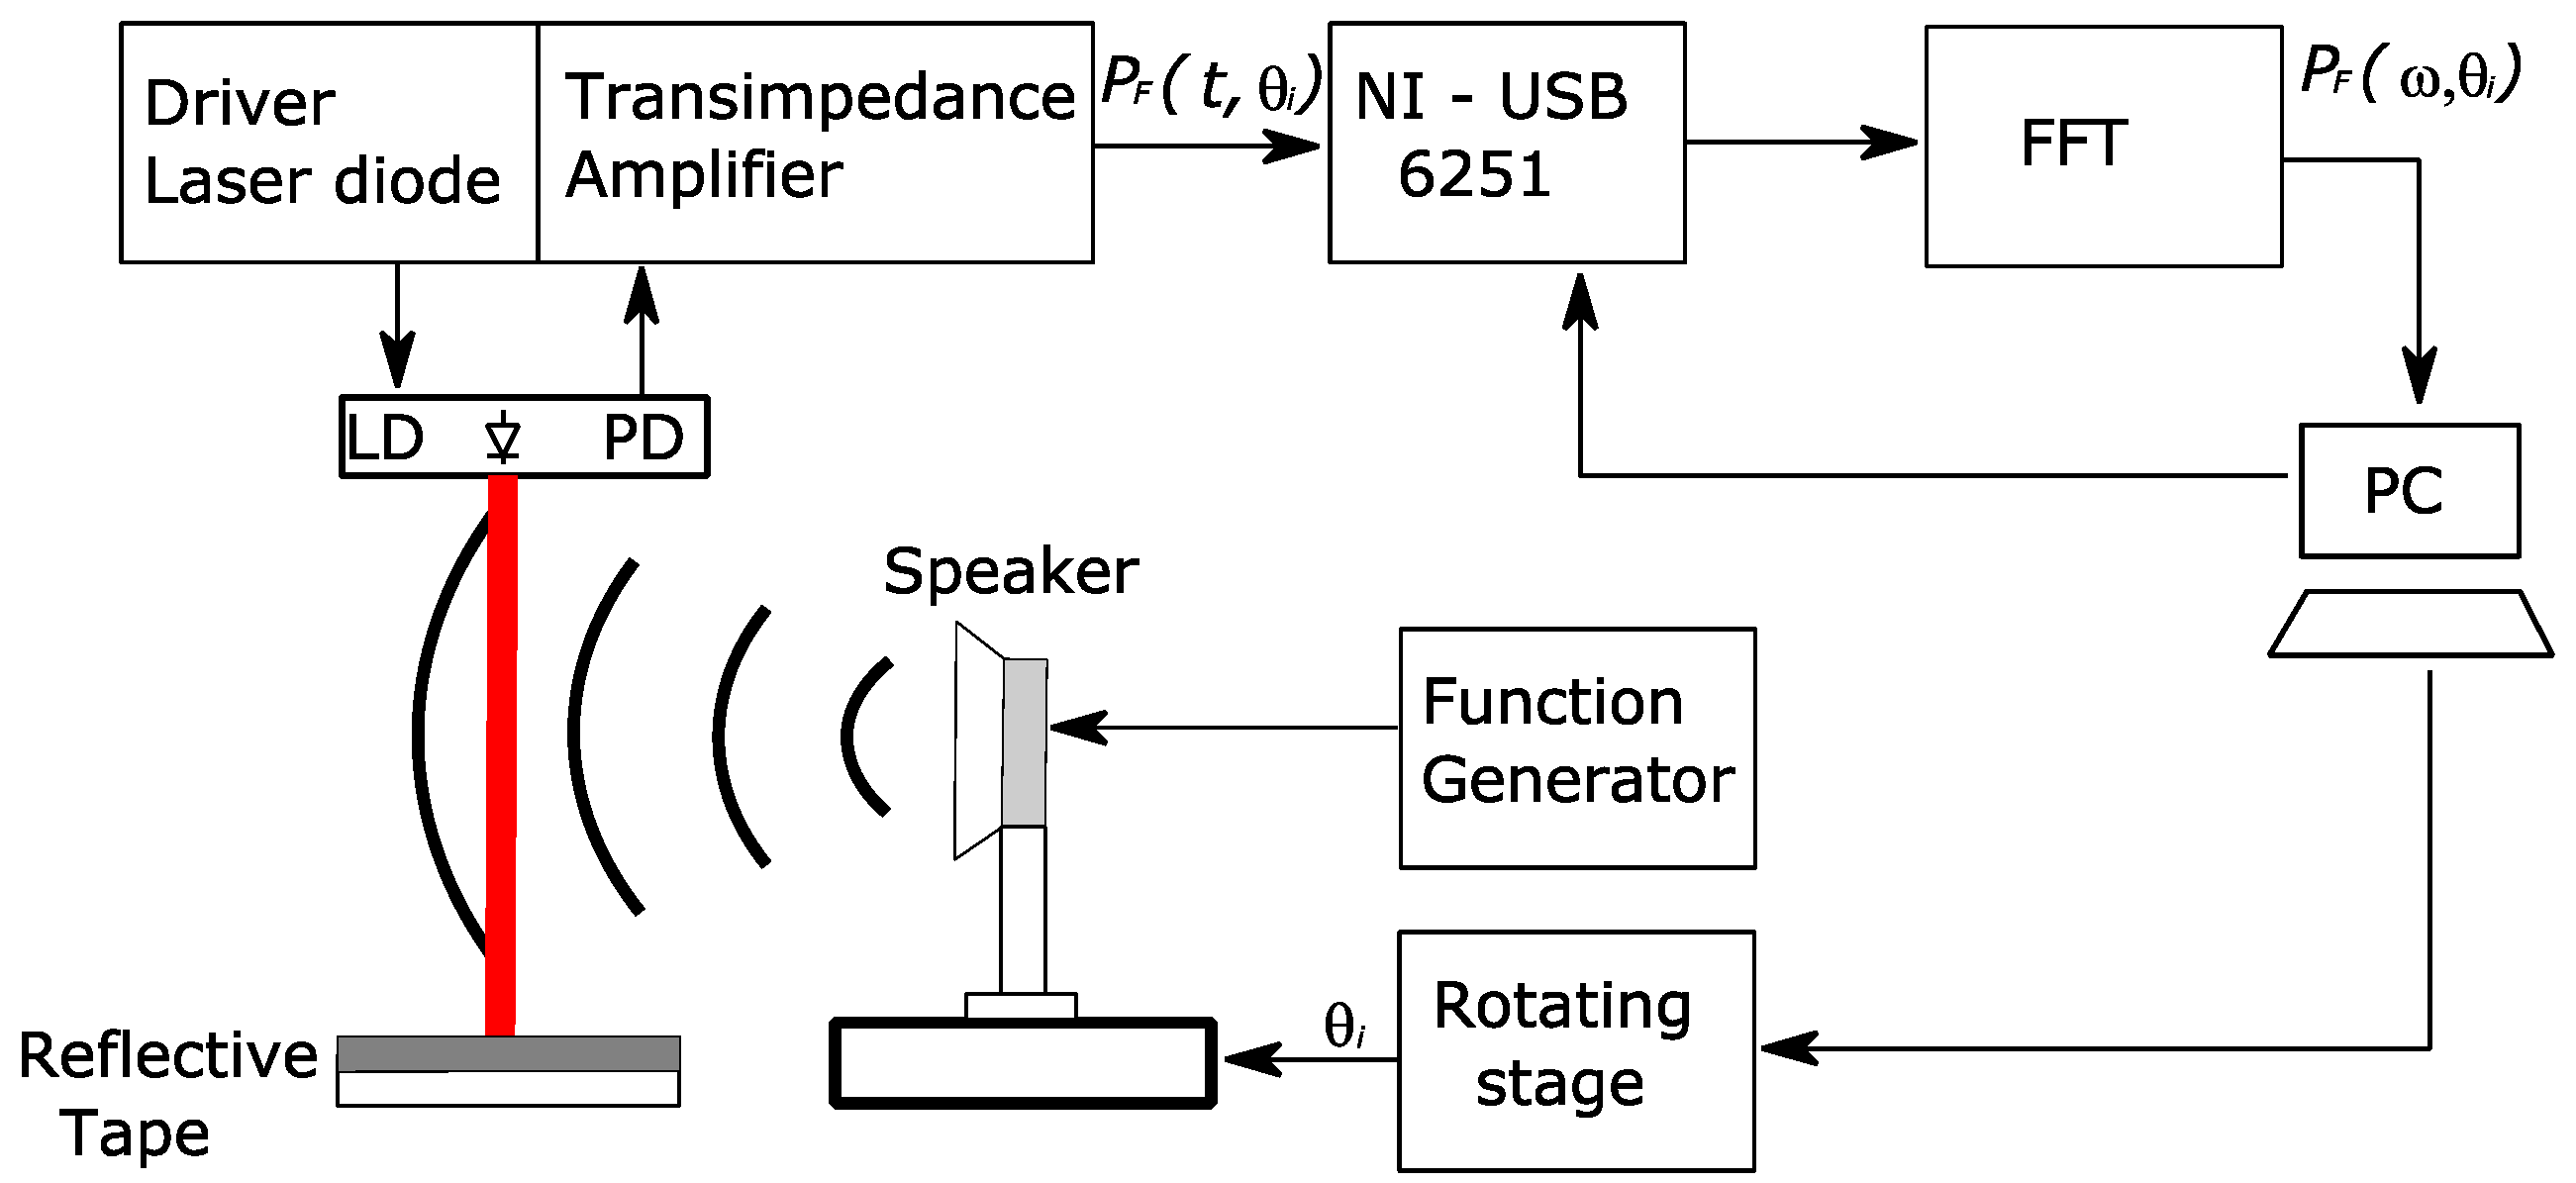
Laser power variations are acquired through the monitoring photodiode included in the laser package, then using an acquisition card (NI-USB-6251) with a 1MHz sampling frequency. A Labview program controls the acquisition as well as the rotating stage position from 0° to +180° with a step of 1 degree. At each angular position 4096 samples of theamplified photodiode current are acquired then Fast Fourier Transform is performed (Figure 3).

3. Results

Figure 4a presents the OFI sensor signal for 0°, 90° and 180° and it can be seen that as expected the acoustic pressure is much stronger in the normal direction of propagation (90°) than on the lateral directions. Figure 4b is the FFT of the sensor signal when the speaker emits towards the laser and a peak at the speaker excitation frequency can clearly be observed that rises by 30 dB from the noise floor. The amplitude of the 40 kHz peak in the FFT is stored and a polar plot is computed that represents the radiation pattern of the source. Figure 4c shows the normalized radiation pattern that was measured for the MA40B8S ultrasonic source.

4. Conclusions

In this work, we have proposed and demonstrated a simple and reliable instrument that can be used for characterization of acoustic sources such as loudspeakers. The measurement principle based on the optical feedback in a laser diode allows for a nonintrusive measurement of acoustic radiation patterns with a very simple arrangement. In particular, no vibration controlled is required and all measurements have been performed on standard boards. Experimental results have been obtained with a piezoelectric transducer but the system can easily be extended to any type of acoustic source over a large frequency range only constrained by the electronic bandwidth.

Acknowledgments

This work was supported by the Instituto de Fomento al TalentoHumano of the Ecuadorian Government.

Conflicts of Interest

The authors declare no conflict of interest.

References

  1. Bertling, K.; Perchoux, J.; Taimre, T.; Malkin, R.; Robert, D.; Rakić, A.D.; Bosch, T. Imaging of acoustic fields using optical feedback interferometry. Opt. Express 2014, 22, 30346–30356. [Google Scholar] [CrossRef] [PubMed]
  2. Taimre, T.; Nikolić, M.; Bertling, K.; Lim, Y.L.; Bosch, T.; Rakić, A.D. Laser feedback interferometry: A tutorial on the self-mixing effect for coherent sensing. Adv. Opt. Photonics 2015, 7, 570–631. [Google Scholar] [CrossRef]
  3. Malkin, R.; Todd, T.; Robert, D. A simple method for quantitative imaging of 2D acoustic fields using refracto-vibrometry. J. Sound Vib. 2014, 333, 4473–4482. [Google Scholar] [CrossRef]
  4. Nakamura, K.; Hirayama, M.; Ueha, S. Measurements of air-borne ultrasound by detecting the modulation in optical refractive index of air. In Proceedings of the 2002 IEEE Ultrasonics Symposium, Munich, Germany, 8–11 October 2002; Volume 1, pp. 609–612. [Google Scholar]
  5. Hargather, M.J.; Settles, G.S.; Madalis, M.J. Schlieren imaging of loud sounds and weak shock waves in air near the limit of visibility. Shock Waves 2010, 20, 9–17. [Google Scholar] [CrossRef]
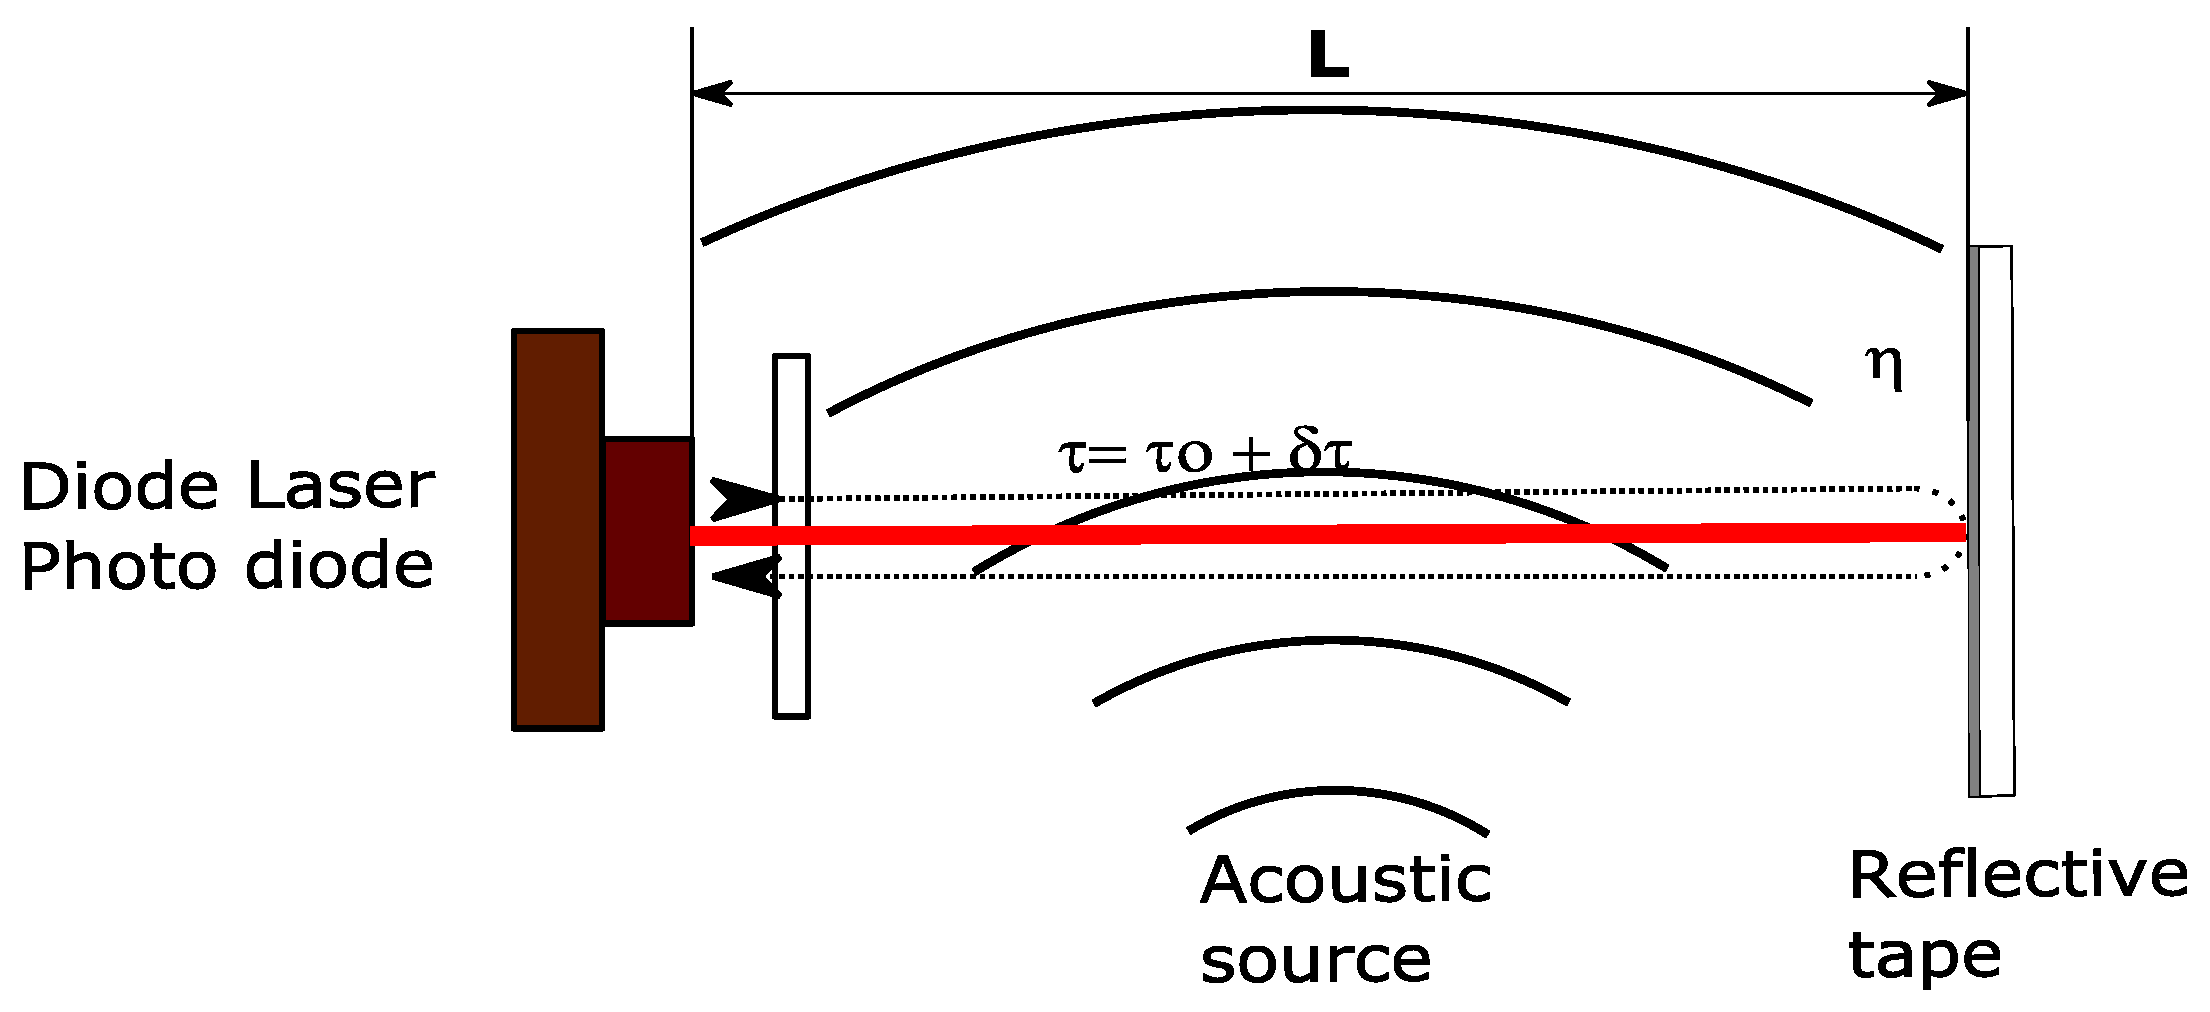
Figure 1. Principle of acoustic pressure sensing using optical feedback interferometry. The distance between the laser and the mirror is fixed; the laser diode and the monitoring photodiode are in the same package.
Proceedings 01 00348 g001
Figure 2. (a) Side view of the setup that includes an ultrasonic piezoelectric transmitter (MA40B8S) driven by a sinusoidal voltage at 40kHz, 10 V and the optical feedback interferometer consisting in a laser diode ML725B11F emitting at 1310 nm associated to a microspheres reflective tape; (b) Top view of the setup, showing the rotating stage position from 0° to +180° with clockwise and counter clockwise movement.
Proceedings 01 00348 g002
Figure 3. System of measure the sound pressure level of the sound emitted by an acoustic source.
Proceedings 01 00348 g003
Figure 4. Measurement results. (a)Time domain signals at 0° (blue dashedline), 90° (black line) and 180° (red line); (b) Frequency domain signal when the sound propagation is done towards the laser beam (corresponding to 90°); (c)Normalized acoustic pressure radiation pattern of the MA40B8S ultrasonic piezoelectric transmitter.
Proceedings 01 00348 g004
Publisher’s Note: MDPI stays neutral with regard to jurisdictional claims in published maps and institutional affiliations.