Impact of High Coupling Factor in Absolute Distance Measurement with Self-Mixing Interferometry †


LAAS-CNRS, Université de Toulouse, CNRS, INP, 31071 Toulouse, France
*
Author to whom correspondence should be addressed.
†
Presented at the Eurosensors 2017 Conference, Paris, France, 3–6 September 2017.
Proceedings 2017, 1(4), 373; https://doi.org/10.3390/proceedings1040373
Published: 16 August 2017
(This article belongs to the Proceedings of Proceedings of Eurosensors 2017, Paris, France, 3–6 September 2017)
Abstract
:Absolute distance measurement by means of a self-mixing interferometer (SMI) can be obtained by modulating the laser frequency. This modulation is typically achieved through the modulation of the laser injection current with a triangle waveform. Various strategies have been proposed to increase the performances and recent researches have shown real-time performance of SMI with resolution reaching 100 μm for distances up to 2 m. In the present paper, we demonstrate for the first time, both experimentally and by modeling, that with high coupling factors between the laser and the target, disappearance of interferometric fringes occurs that can strongly affect the measurement reliability.
1. Introduction
Self-mixing interferometry has been studied by many research groups in recent years because of its expected lower cost and higher compactness as compared to traditional interferometers, with comparable performances. Sensors under the self-mixing technique use the laser itself as both the light source and the detector. This phenomenon occurs when the light of the laser propagates towards a distant target where it is partially reflected or back-scattered and re-injected into the laser cavity. The back-scattered light interferes with the laser cavity light which creates variations of the threshold gain, the emitted power, and the lasing frequency of the laser. The variation of the laser power is measured with either the monitoring photodiode included in the laser package or through the amplification of the diode voltage itself. Various applications of this phenomenon have already been published such as vibration, absolute distance and velocity measurement [1], and more recently for imaging of acoustic waves [2], micro-scale flow measurement and several biomedical purposes [3].
When the frequency of the laser is modulated in triangle waveform by means of an injection current modulation with a fixed amplitude and frequency, the inner cavity and the back-scattered wave show a phase-shift that is proportional to the target to laser distance. Thus, the interferometric variations of the laser power exhibit periodic fringes which periodicity is proportional to this distance. The most usual method for evaluation of the target distance is by counting the number of peaks that appear on each ramp of the triangle modulation. In this configuration, a simple thresholding on the signal amplitude and a counter is sufficient to perform the distance measurement [3,4]. In this paper, we demonstrate that some fringes disappear when the value of the coupling factor reaches high values. The number of disappeared fringes is proportional to the coupling factor and induces major errors in the measurement.
2. Theory
2.1. Self-Mixing Interferometry Basics
Most of the theoretical modelling on self-mixing is based on the three mirrors model which was initially developed by Petermann [5]. The three mirror cavity is reduced to a two mirrors equivalent cavity where the lasing conditions are established. Thus the laser emission frequency is recalculated and compared to the one of the free-running laser ,
where is the round-trip propagation time in the external cavity , and c is the speed of light in vacuum. α is the linewidth enhancement factor of the laser diode and C is the feedback level which describes the strength of the optical feedback changes to the laser behavior. It can be expressed as [6],
where is the round-trip delay in the cavity of the solitary laser diode, ε is the fraction of the reflected light coupled back coherently into the lasing mode (normally 0.1 <ε< 0.6), and is the coupling strength between the target and the laser cavity which is expressed as,
where is the ratio of the back-scattered field amplitude and the emitted field amplitude, and is the reflection coefficient of the laser facet. Then the variation of optical power can be expressed as [7],
where , defines the phase response with optical feedback and is the observable signal amplitude that depends on the amount of back-scattered power.
Numerical methods need to be used to solve the laser emission frequency, , in (1) . A unique solution can be found when the system operates in weak optical feedback (C ≤ 1), and multiple solutions when the laser is operated in moderate and strong optical feedback (C > 1) [8]. In this paper, we are interested in moderate and strong optical feedback where we observe the losses of interferometric fringes [9].
2.2. Absolute Distance Measurement
Absolute distance measurement with the self-mixing technique can be obtained when the laser frequency is modulated with a triangle waveform which is typically achieved by modulating the laser injection current. To model the laser frequency linear dependence on injection current, a characteristic parameter is introduced so that [4],
where is the bias current and is variation of the injection current. However, the linear trend between laser frequency and current is not entirely correct because of several factors such as thermal inertia. With a fixed amplitude and frequency modulation, the output power waveform is a triangle wave with small ripples on the ramps which after filtering of the low frequencies result in a series of sharp peaks. The target distance can be calculated by simply counting the number of these peaks [3,4],
where is the peak-to-peak amplitude of the triangle current modulation waveform is the number of.
3. Experimental Setup
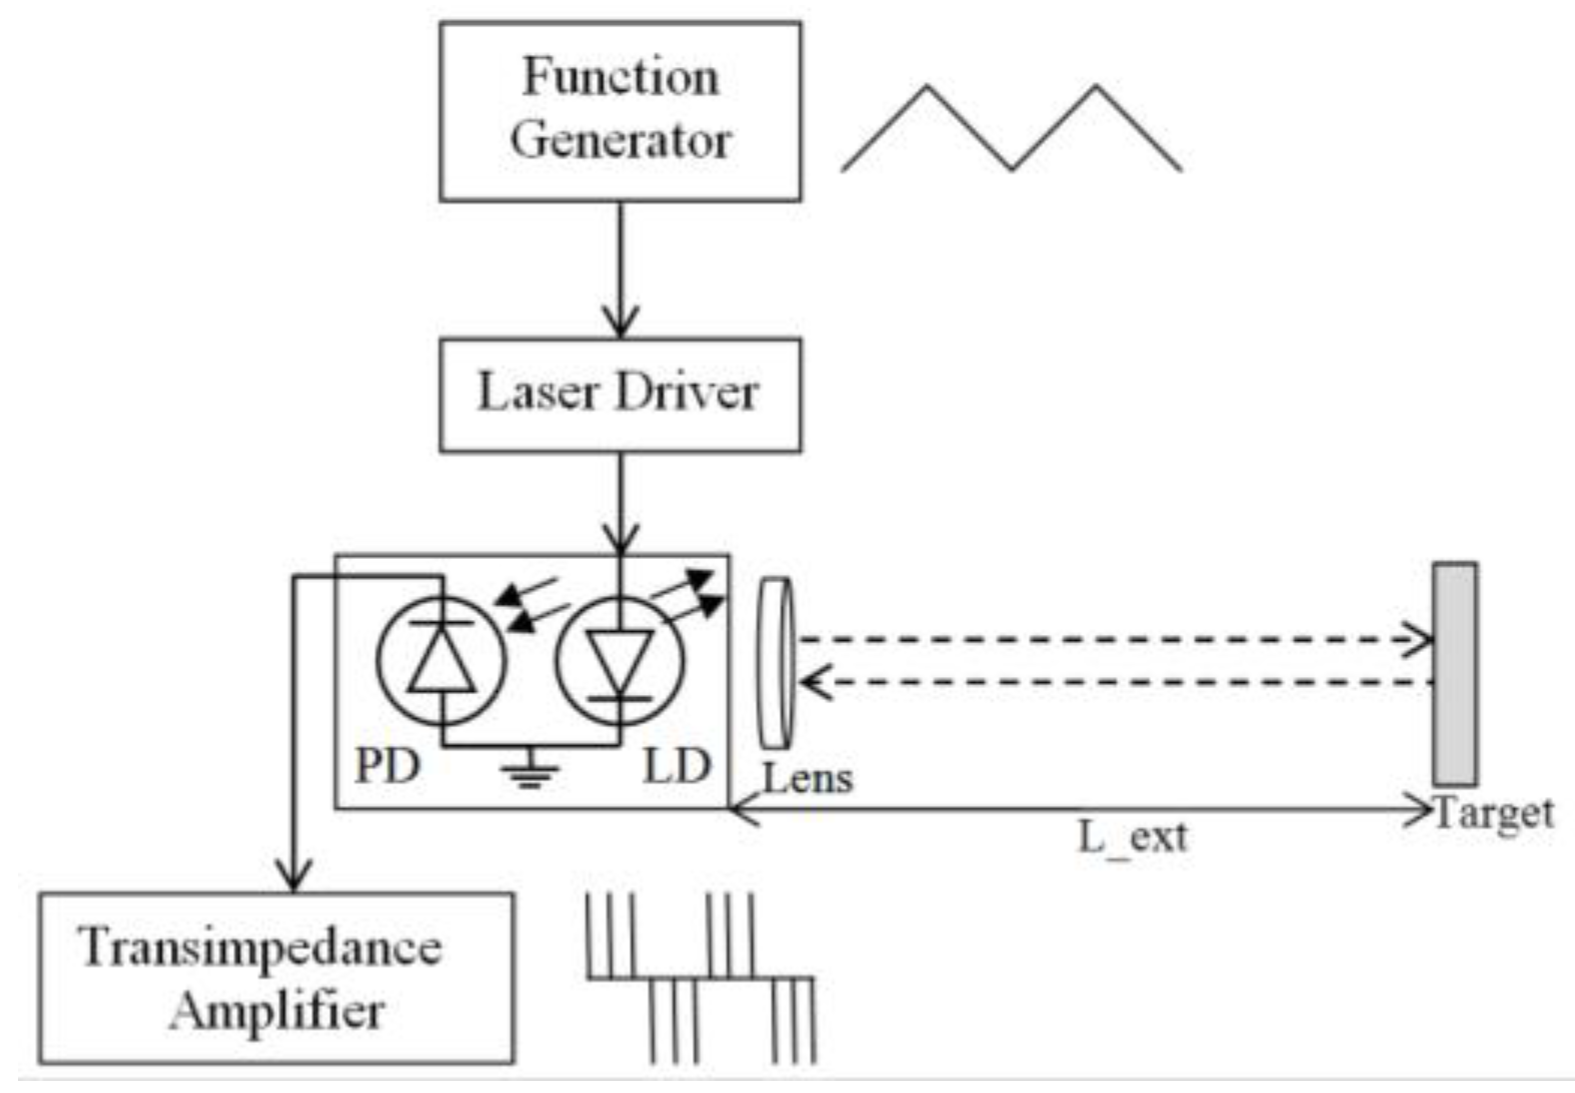
A block diagram of the experimental setup for absolute distance measurement with SMI is shown in Figure 1. The DFB laser diode (L1550P5DFB, a DFB emitting at 1550 nm) with a package included monitoring photodiode was associated to a lens which focuses the laser beam onto the target surface. The target is a flat metallic surface partially covered by a microspheres reflective tape. The laser was operated with a bias current of 20 mA and modulated with a 10 mA peak-to-peak amplitude triangular waveform. The photodetected signal is converted to voltage by a transimpedance amplifier.
4. Results
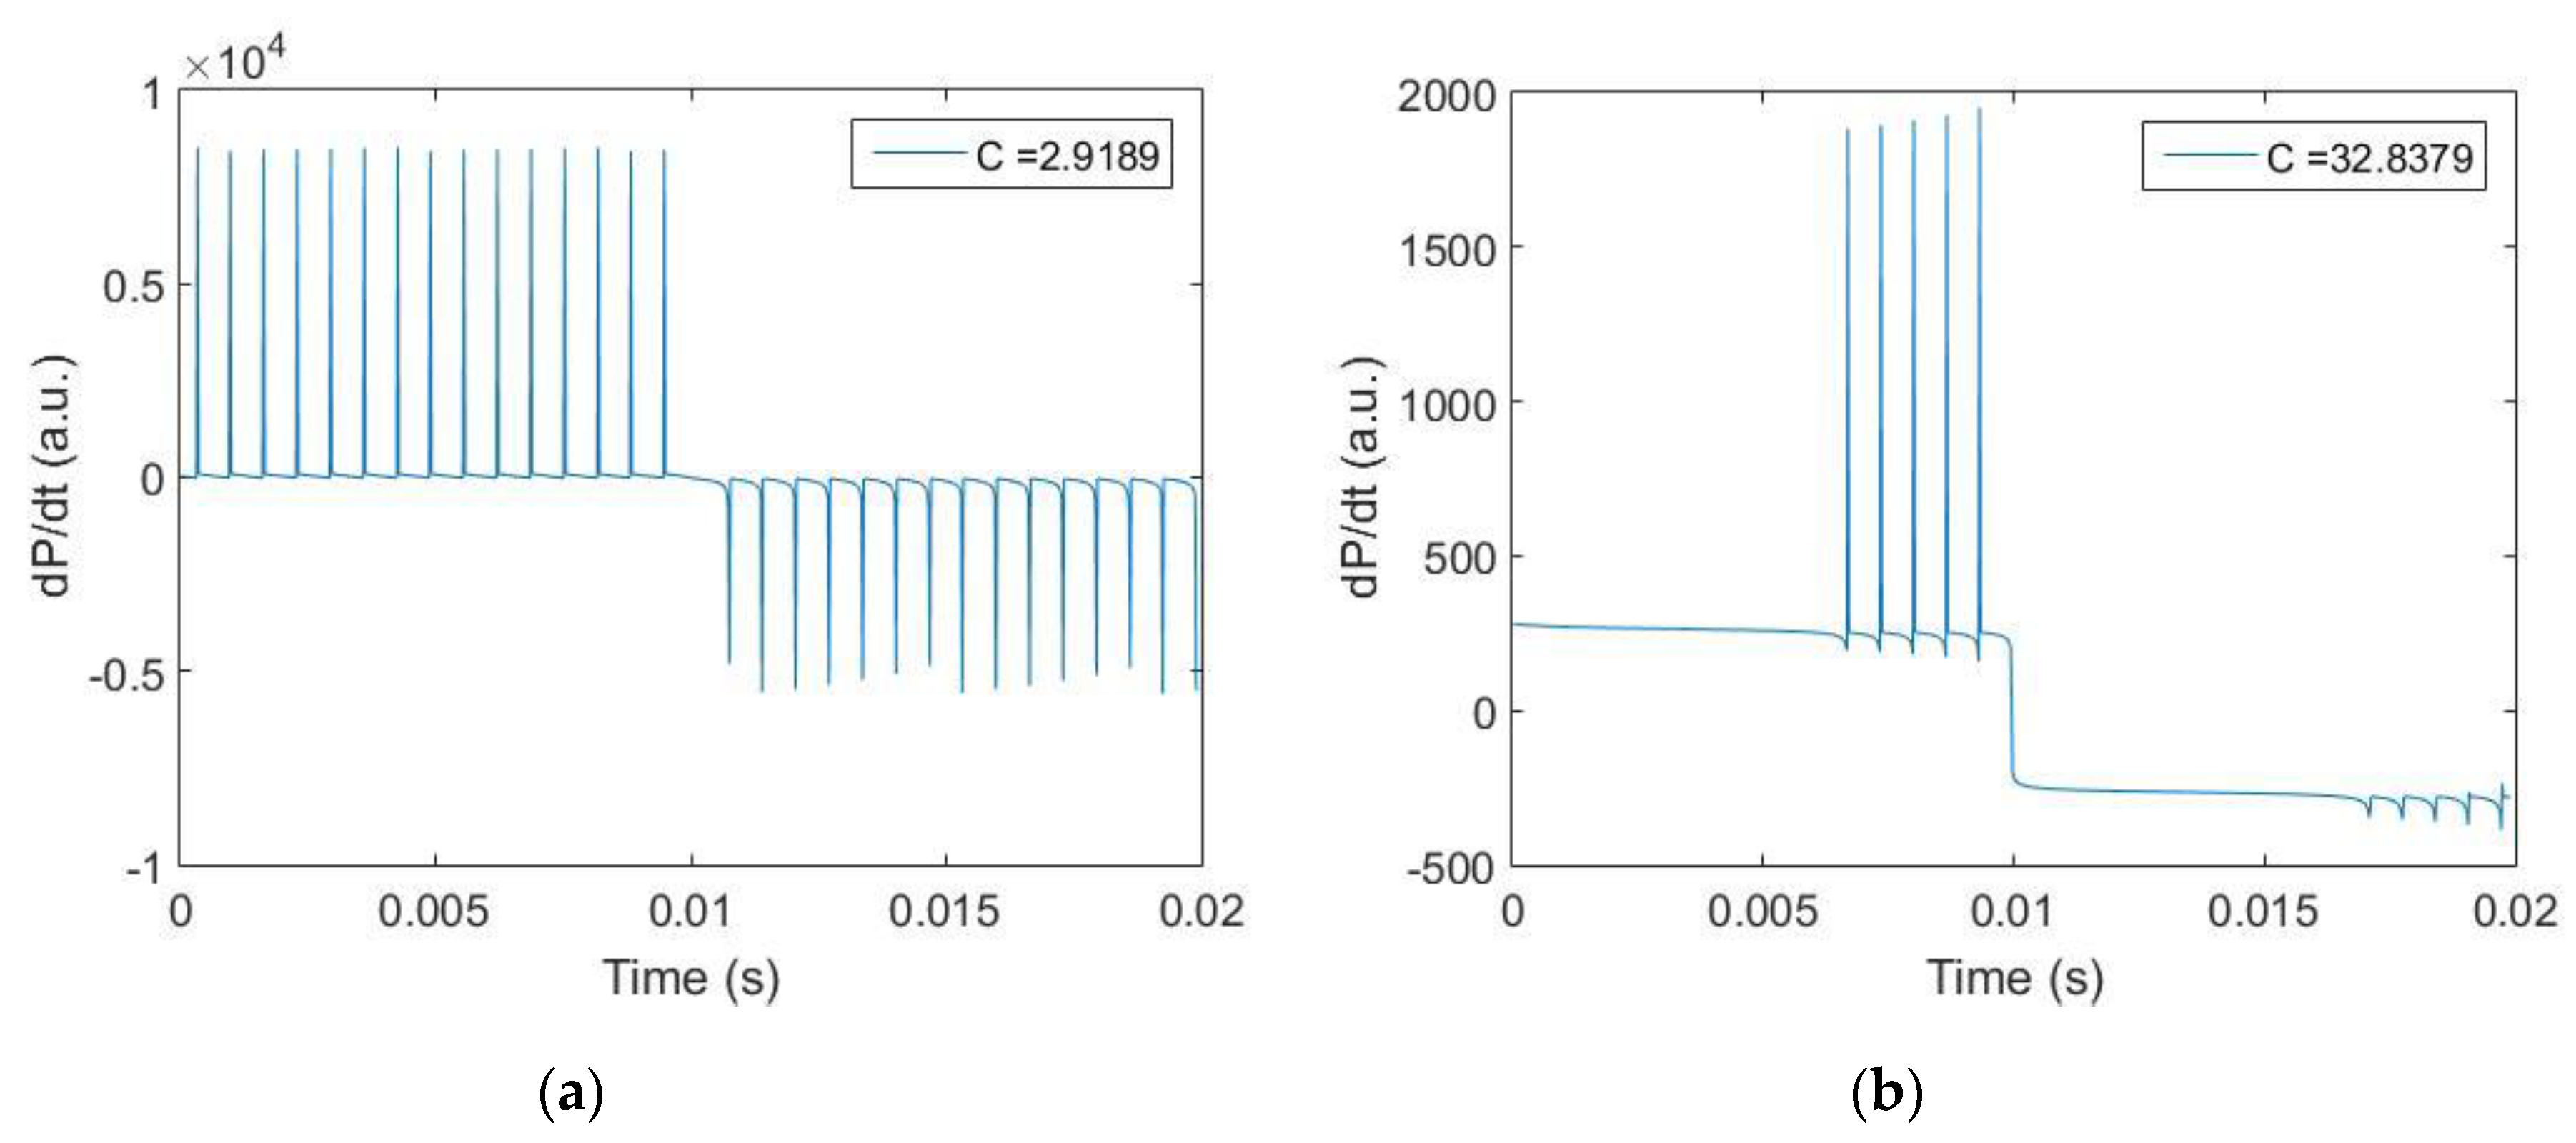
Two parameters were measured experimentally: the frequency modulation coefficient and the reflectivity coefficient . The coefficient is function of many parameters (frequency modulation, feedback level, temperature, modulation frequency, etc). For this experiment, we chose a set of conditions which resulted to a FM coefficient of −380 MHz/mA. The reflectivity coefficient of the target is one of the most important parameter to the feedback strength C. For a distance of 60 cm, we measured it at 5.2 × 10⁻³ with the metallic surface and 58.5 × 10⁻³ with the microspheres reflective tape. Figure 2 shows the signals obtained for one period of modulation by a triangle signal. While the metallic surface produces a signal with regular periodic fringes, with the microspheres reflective tape, number of fringes have disappeared even if the frequency of the remaining fringes is similar to the one observed with metal. Figure 3 shows the result of the simulation by applying the measured parameters which matched to the experimental results. As can be seen on Figure 3, the simulation of the sensor signal using the set of Equations (1)–(4) provides with a very resembling pattern to the measured one. Moreover, the values of coupling coefficient C that fits the best to obtain this resemblance is multiplied by exactly the same amount as the measured reflectivity , thus validating the modeling approach.
5. Conclusions
The paper proposes a model based and experimental study of high coupling factors impact in absolute distance measurement using the self-mixing interferometry scheme. It is demonstrated for the first time in such measurement that interferometric fringes may disappear. Missing fringes can strongly affect the distance measurement resolution. Further analysis of this phenomenon shall target a clearer understanding of the fringes disappearance process and quantification, in order to propose a better suited absolute distance calculation method.
Acknowledgments
This research has been funded by the BGF funding scheme of the French Embassy of Cambodia.
Conflicts of Interest
The authors declare no conflict of interest.
References
- Donati, S. Developing self-mixing interferometry for instrumentation and measurement. LaserPhotonics Rev. 2012, 6, 393–417. [Google Scholar] [CrossRef]
- Bertling, K.; Perchoux, J.; Taimre, T.; Malkin, R.; Robert, D.; Rakić, A.D.; Bosch, T. Imaging of acoustic fields using optial feedback interferometry. Opt. Express 2014, 22, 30346–30356. [Google Scholar] [CrossRef] [PubMed]
- Bosch, T.; Bes, C.; Scalise, L.; Plantier, G. Optical Feedback Interferometry. In Encyclopedia of Sensors Vol 6; American Scientific Publishers: Valencia, CA, USA, 2006; pp. 1–20. ISBN 1-58883-056-X. [Google Scholar]
- Gagnon, E.; Rivest, J.F. Laser range imaging using the self-mixing effect in a laser diode. IEEE Trans. Instrum. Meas. 1999, 48, 693–699. [Google Scholar] [CrossRef]
- Petermann, K. Laser Diode Modulation and Noise; Kluwer Academic: Tokyo, Japan, 1988. [Google Scholar]
- Donati, S.; Guiliani, G.; Merlo, S. Laser diode feedback interferometer for measurement of displacements without ambiguity. IEEE J. Quantum Electron. 1995, 31, 113–119. [Google Scholar] [CrossRef]
- Kliese, R.; Taimre, T.; Bakar, A.A.A.; Lim, Y.L.; Bertling, K.; Nikolić, M.; Perchoux, J.; Bosch, T.; Rakić, A.D. Solving self-mixing equation for arbitrary feedback levels: A concise algorithm. Appl. Opt. 2014, 53, 3723–3736. [Google Scholar] [CrossRef] [PubMed]
- Taimre, T.; Nikolić, M.; Bertling, K.; Lim, Y.L.; Bosch, T.; Rakić, A.D. Laser feedback interferometry: A tutorial on the self-mixing effect for coherent sensing. Adv. Opt. Photonics 2015, 7, 570–631. [Google Scholar] [CrossRef]
- Yu, Y.; Xi, J.; Chicharo, J.F.; Bosch, T.M. Optical feedback self-mixing interferometry with a large feedback factor C: behavior studies. IEEE J. Quantum Electron. 2009, 45, 840–848. [Google Scholar] [CrossRef]
Figure 1.
Block Diagram of experimental setup. Laser and photodetector are in the same package.

Figure 2.
Experimental self-mixing signal acquisition for a distance of 60 cm, and modulation amplitude = 10 mA: (a) Metallic surface target; (b) Reflective tape target.
Figure 2.
Experimental self-mixing signal acquisition for a distance of 60 cm, and modulation amplitude = 10 mA: (a) Metallic surface target; (b) Reflective tape target.

Figure 3.
Simulated self-mixing laser power derivated in time for a distance of 60 cm, and modulation amplitude = 10 mA: (a) low coupling coefficient; (b) high coupling coefficient.
Figure 3.
Simulated self-mixing laser power derivated in time for a distance of 60 cm, and modulation amplitude = 10 mA: (a) low coupling coefficient; (b) high coupling coefficient.

Publisher’s Note: MDPI stays neutral with regard to jurisdictional claims in published maps and institutional affiliations. |
© 2017 by the authors. Licensee MDPI, Basel, Switzerland. This article is an open access article distributed under the terms and conditions of the Creative Commons Attribution (CC BY) license (https://creativecommons.org/licenses/by/4.0/).
Share and Cite
MDPI and ACS Style
Veng, M.; Perchoux, J.; Bony, F. Impact of High Coupling Factor in Absolute Distance Measurement with Self-Mixing Interferometry. Proceedings 2017, 1, 373. https://doi.org/10.3390/proceedings1040373
AMA Style
Veng M, Perchoux J, Bony F. Impact of High Coupling Factor in Absolute Distance Measurement with Self-Mixing Interferometry. Proceedings. 2017; 1(4):373. https://doi.org/10.3390/proceedings1040373
Chicago/Turabian StyleVeng, Mengkoung, Julien Perchoux, and Francis Bony. 2017. "Impact of High Coupling Factor in Absolute Distance Measurement with Self-Mixing Interferometry" Proceedings 1, no. 4: 373. https://doi.org/10.3390/proceedings1040373