Proceeding Paper

Tin Dioxide-Graphene Based Chemi-Device for NO2 Detection in the Sub ppm Range †

by
José Pedro Santos
1,*,
Tiziana Polichetti
2,
Manuel Aleixandre
1,
Esther Hontañón
1,
Isabel Sayago
1,
Brigida Alfano
2,
Maria Lucia Miglietta
2 and
Girolamo Di Francia
2
1
Nanosensors and Intelligent System group (NoySI), Instituto de Tecnologías Físicas y de la Información ITEFI-CSIC, 28006 Madrid, Spain
2
Agenzia nazionale per le nuove tecnologie, l'energia e lo sviluppo economico sostenibile (ENEA), P.le E. Fermi 1, Portici, I-80055 Naples, Italy
*
Author to whom correspondence should be addressed.
Presented at the Eurosensors 2017 Conference, Paris, France, 3–6 September 2017.
Proceedings 2017, 1(4), 442; https://doi.org/10.3390/proceedings1040442
Published: 8 August 2017
(This article belongs to the Proceedings of Proceedings of Eurosensors 2017, Paris, France, 3–6 September 2017)

Abstract

:
Chemical nanodevices based on tin dioxide, graphene and a mixture of both materials were developed and characterized for NO2 detection at low concentrations. The chemiresistors were prepared by both electrospinning and drop casting. The films morphologies were investigated by scanning electron microscopy (SEM). The devices response to sub-ppm NO2 concentrations was measured from room temperature up to 300 °C. An improvement in the performance in terms of sensitivity and response time, as well as higher responses at room temperature, was obtained when a mixture of these materials is used.

1. Introduction

Nitrogen dioxide is one of the major urban pollutants with a great impact on human health. The 2016 report of the European Environment Agency shows that NO2 concentrations above limit values were widely distributed across Europe [1], amplifying the need for sensors with improved characteristics in terms of sensitivity, selectivity, stability, power consumption and cost. Nanotechnology has driven the research toward new advanced materials such as nanostructured metal oxides and graphene, which meet well these requests. In this context we present a study on chemi-devices based on nanostructured SnO2 materials (mainly in the form of nanofibers), on graphene and on a mixture of both materials for NO2 detection, in concentrations of interest for urban pollution monitoring. Comparison with commercially available microsensors is performed.

2. Materials and Methods

The precursor of the SnO2 nanofibers was a polymeric composite of Tin(IV) chloride pentahydrate (SnCl4·5H2O) and polyvinyl alcohol (PVA). Graphene, in form of hydro alcoholic solution, was made by Liquid Phase Exfoliation method [2]. As reported in [3], the suspension was prepared by dispersing 1 mg of graphite flakes (Sigma–Aldrich, Milan, Italy, product code 332461) into a 1 mL of mixture of IPA-H2O (1:7 v/v); the solution was treated in an ultrasonic bath at low power output (~30 W) for about 48 h, at an average temperature of 50 °C. Afterwards, in order to remove unexfoliated graphite crystallites, the dispersion was centrifuged for 45 min at 500 rpm. In order to realize a graphene-SnO2 hybrid material, the graphene-based dispersions in two different concentrations, i.e., 0.01 mg/mL (Gr1) and 0.1 mg/mL (Gr2) were added to the polymeric solution. The chemiresistors were fabricated by two simple methods: drop casting and electrospinning. The former was used to deposit pristine graphene dispersion onto different substrates, while the second method allowed to deposit SnO2 and graphene doped SnO2 nanofibers onto micromachined silicon substrates. Main electrospinning parameters are shown in Table 1. Details of the deposition setup can be found in [4]. The devices were morphologically characterized by SEM.
Device resistance was measured by an electrometer with a scanner card (6517 and 6522, Keithley, Cleveland, OH, USA) at a constant bias voltage of 1 V. Voltage for the device heaters was provided by a programmable power supply (V4CH, Ray IE, Mirabel, Spain). Measurements were made at a constant flow of 200 mL/min. Adsorption time was 30 min and desorption time 60 min. Nitrogen dioxide concentrations from 100 to 1000 ppbV were generated through a gas mixing unit (GMU-06, Ray IE, Mirabel, Spain) from calibrated cylinders (Praxair, Madrid, Spain). Two parameters of the devices were studied: the response and the response time. Response is defined as follows:
R = R/Ra,
where R is the maximum resistance of the device when exposed to NO2 and Ra is the baseline resistance in air. In the case of pristine graphene the response is the inverse due to the p-type nature of the material. The response time is defined as the time to reach the 90% of the final resistance value. Usually at least five measurement cycles were performed for each device and the mean is presented as the result for both parameters.

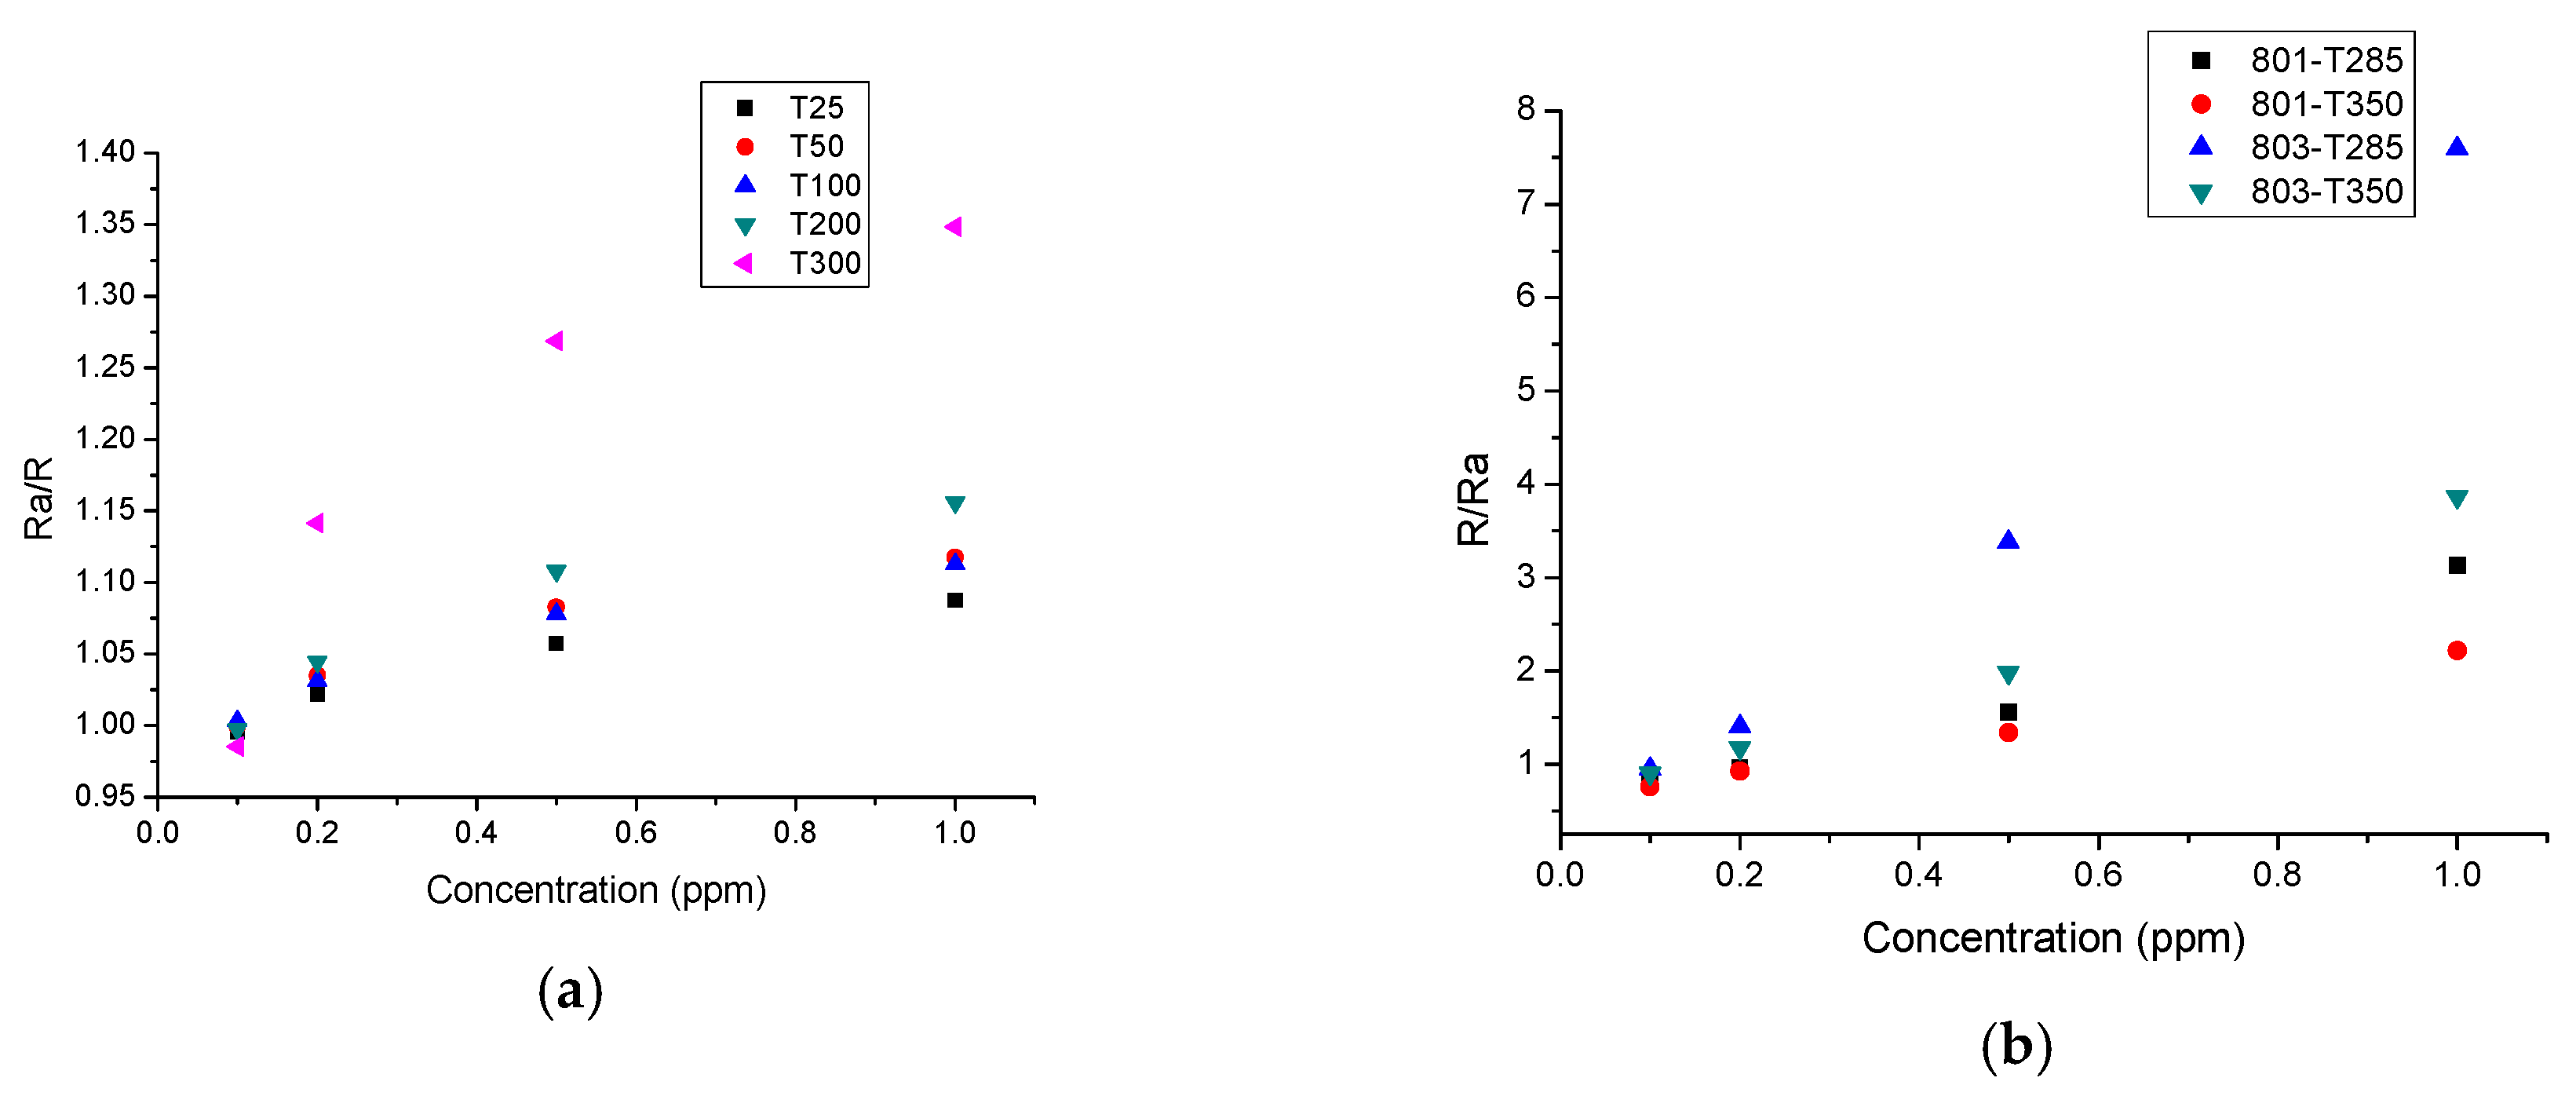
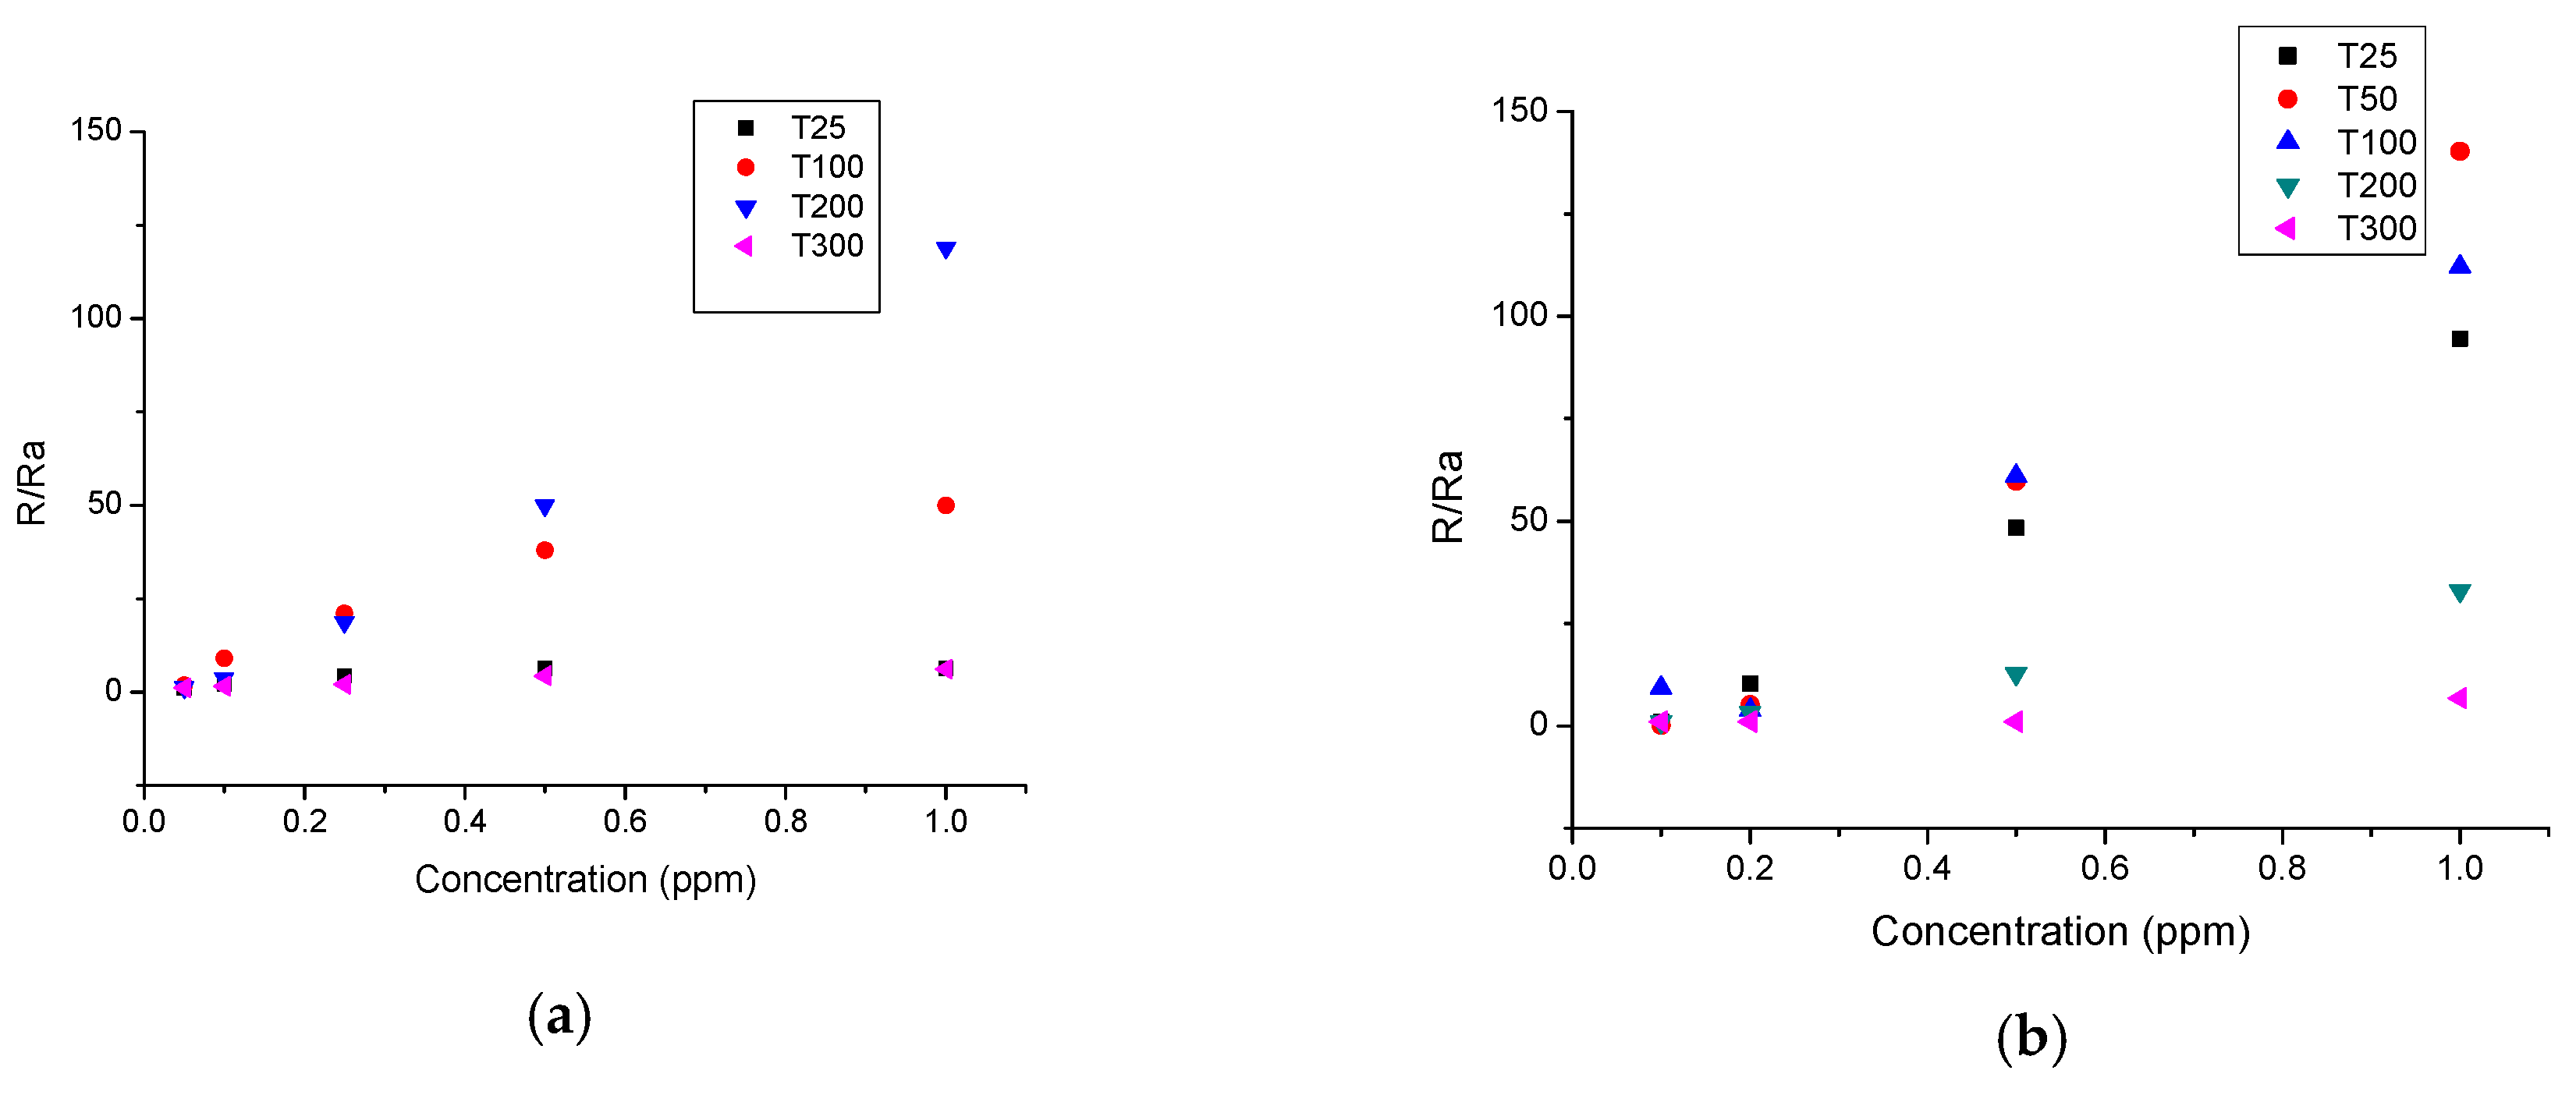
3. Results and Discussion

In Figure 1 two images of undoped and graphene (Gr1) doped SnO2 devices are shown. In particular undoped SnO2 device shows a predominant nanofiber composition with diameters around 100 nm, whereas doped chemiresistors exhibit nanobelts morphology with a broader width with respect to the nanofibers diameter.
Figure 2 shows a SEM image of pristine graphene. The particle size distributions peaked at around 400 nm (performed at T = 25 °C with a Zetasizer Nano Malvern Instruments). Raman spectroscopy performed on a solid film, obtained by drop casting a small amount of the graphene based suspension onto Si/SiO2 (300 nm) substrate, highlights the absence of defects in the basal plane of the flakes.
The relative resistance change for SnO2 nanofiber-based device, for the whole temperature range, is presented in Figure 3a; Figure 3b shows the response for the graphene (Gr2) doped SnO2 device. Main difference between Gr2 device and Gr1 device is the better response at room temperature of the former although for the rest of the temperature range its response is lower. An overall improvement in response for the entire temperature range for the doped devices is clearly observed, with a more remarkable difference at lower temperatures, thus proving the possibility of improving the device performances for NO2 detection in the sub-ppm range at RT. Maximum responses were obtained at different temperatures for both devices: 200 °C for the undoped and 100 °C for the doped one. Response times are concentration and temperature dependent ranging from 8 to 12 min being lower for the graphene doped device.
For comparison purposes we measured pristine graphene devices and state of the art ultralow power commercial microsensors (CCS 801 and 803, AMS AG Austria) [5]. Figure 4a shows the response of the graphene device in the whole temperature range. Figure 4b shows the responses of the two commercial sensors at 285 °C (heating voltage 1.2 V) and 350 °C (heating voltage 1.4 V).
Responses of the pristine graphene and commercial sensors are well below the other devices. For pristine graphene device there is an increase of the response with temperature. The commercial sensors do not response to NO2 at room temperature (heater voltage off) and their performance is better at intermediate temperature. On the other hand response times decrease with temperature and varies between 12 and 25 min for the pristine device and between 9 and 17 min for the commercial sensors.
In conclusion doping tin dioxide nanofibers chemi-devices with pristine graphene improved its sensing performance to nitrogen oxide. Also both tin dioxide nanofiber chemi-devices are better than the state of the art commercial sensors and can be used at room temperature.

Acknowledgments

Authors want to thank Spanish Ministry of Economy and Competitiveness for supporting the project TEC2013-48147-C6.

Conflicts of Interest

The authors declare no conflict of interest.

References

  1. Air Quality in Europe 2016; EEA Report No 28/2016. Publications Office of the European Union: Luxembourg, Luxemburg, 2016; ISSN 1977-8449. [CrossRef]
  2. Miglietta, M.L.; Massera, E.; Romano, S.; Polichetti, T.; Nasti, I.; Ricciardella, F.; Fattoruso, G. Chemically exfoliated graphene detects NO2 at the ppb level. Procedia Eng. 2011, 25, 1145–1148. [Google Scholar] [CrossRef]
  3. Fedi, F.; Miglietta, M.L.; Polichetti, T.; Ricciardella, F.; Massera, E.; Ninno, D.; di Francia, G. A study on the physicochemical properties of hydro-alcoholic solutions to improve the direct exfoliation of natural graphite down to few-layers graphene. Mater. Res. Express 2015, 2, 35601–35608. [Google Scholar] [CrossRef]
  4. Santos, J.P.; Fernández, M.J.; Fontecha, J.L.; Matatagui, D.; Sayago, I.; Horrillo, M.C.; Gracia, I. Nanocrystalline tin oxide nanofibers deposited by a novel focused electrospinning method. Application to the detection of TATP precursors. Sensors 2014, 14, 24231–24243. [Google Scholar] [CrossRef] [PubMed]
  5. AMS.com. Available online: http://ams.com/eng/Products/Environmental-Sensors/Gas-Sensors/CCS801 (accessed on 5 March 2017).
Figure 1. (a) SEM image of the pure SnO2 device; (b) SEM image of the graphene (0.01 mg/mL) doped SnO2.
Proceedings 01 00442 g001
Figure 2. SEM image of the pristine grapheme.
Proceedings 01 00442 g002
Figure 3. (a) Rresponse of the pure SnO2 device at different temperatures; (b) response of the graphene (0.1 mg/mL) doped SnO2 device at different temperatures.
Proceedings 01 00442 g003
Figure 4. (a) Response of the pure pristine graphene device at different temperatures; (b) response of the commercial microsensors at different temperatures.
Proceedings 01 00442 g004
Table 1. Summary of the electrospinning conditions.
SolutionNeedle Tip 1-Substrate Distance (cm)Inter-Electrode Voltage (kV)Flow Rate (μL/min)Deposition Time (min)
SnCl4-PVA 819425
Gr1-SnCl4-PVA519120
Gr2-SnCl4-PVA519120
1 Needle G25: фo (0,5144 mm), фi (0,260 mm).
Publisher’s Note: MDPI stays neutral with regard to jurisdictional claims in published maps and institutional affiliations.

