Proceeding Paper

In-Situ Electrophoretic Mobility Determination by Particle Image Velocimetry for Efficient Microfluidic Enrichment of Bacteria †

1
IMTEK—Department of Microsystems Engineering, University of Freiburg, 79085 Freiburg, Germany
2
Institute for Microbiology and Virology, Brandenburg Medical School, 16816 Neuruppin, Germany
*
Author to whom correspondence should be addressed.
Presented at the Eurosensors 2017 Conference, Paris, France, 3–6 September 2017.
Proceedings 2017, 1(4), 535; https://doi.org/10.3390/proceedings1040535
Published: 30 August 2017
(This article belongs to the Proceedings of Proceedings of Eurosensors 2017, Paris, France, 3–6 September 2017)

Abstract

:
We present a novel approach for the efficiency enhancement of microfluidic bacteria enrichment systems based on free-flow electrophoresis (FFE). FFE efficiency is highly dependent on the electrophoretic mobility μ of the bacteria. As μ varies strongly with the suspension medium, fast and accurate determination of μ is needed to achieve optimal enrichment performance from different suspension media. For the first time, μ is determined in-situ for multiple media during on-chip FFE by Particle Image Velocimetry (PIV) of fluorescent bacteria, obviating the need for separate measurement equipment or chemical staining of the bacteria.

1. Introduction

The fast and reliable detection of pathogenic bacteria is important in a wide range of applications such as healthcare or water supply monitoring. A commonly used technique is the quantitative polymerase chain reaction (qPCR). Environmental samples often contain low amounts of bacteria as well as substances that inhibit PCR, necessitating preprocessing of the raw sample. In former work, both the enrichment of bacteria from suspension as well as size-selective purification of target nucleic acids on microfluidic platforms have been demonstrated [1,2].
To optimize the enrichment process in regards to sample flow rate and voltage, bacteria expressing superfolder green fluorescent protein (sfGFP) are employed as they allow easy visualization of the processes inside the chip [3]. Up until now, optimization has been purely empirical as the electrophoretic mobility μ of the bacteria was largely unknown. It is strongly dependent on the properties of the suspension medium (pH, ionic strength) and is difficult to determine analytically [4]. Therefore a contact free method to measure the bacterial electrophoretic mobility is needed.
In this study, Particle Image Velocimetry is utilized to determine bacterial velocities. It is a widely established method for the visualization of flow patterns in liquids [5]. The liquid is seeded with tracer particles. The fluid is subsequently illuminated and images are captured by a camera. The spatial particle velocities are then calculated from consecutive images.

2. Materials and Methods

A microfluidic glass chip with platinum electrodes is manufactured using a dry-film photoresist based process [6]. Chambers in the chip are separated by polyacrylamide gel barriers (5% Acrylamide/Bisacrylamide (29:1), 0.2% TEMED, 0.5% APS (10% w/v)). The electrode chambers are continuously flushed with fresh buffer to remove electrolytic reaction products. The chip holder with electric and fluidic contacts (Figure 1) is placed on an inverted microscope. A bacterial suspension is pumped through the sample chamber at a constant flow rate of 1 μL/min using a syringe pump.
The chip is illuminated with blue light (485 nm wavelength), which induces sfGFP fluorescence at 507 nm (green light). This allows imaging of the bacteria with high contrast against the dark background. A series of 20 images is taken with a Nikon DS-Qi1Mc-U2 camera with 40 ms recording time, 46× analog gain and 400 ms intervals. After preprocessing the images with the Fiji software suite [7] they are analyzed using the MATLAB plugin PIVlab [8] to derive a vector field of the particle velocities. PIVlab is calibrated using the width of the electrode structures and analysis is run using interrogation areas of 128 px and steps and 64 px in a region of interest (ROI) defined in the flow chamber. The average vector field is exported and condensed to the mean vector (u, v) with u in the hydrodynamic flow direction and v parallel to the electric field E.
The electrophoretic mobility μ of the bacteria is then calculated as the quotient of the electrophoretic velocity v and the applied electric field E: μ = v/E.
Measurements are taken using E. coli expressing sfGFP suspended in lysogeny broth (LB) Luria (10 g/L tryptone, 5 g/L yeast extract, 0.5 g/L sodium chloride), TBE buffer (45 mM Tris-Base, 45 mM boric acid, 1 mM EDTA) and local tap water as sample media. First, an overnight culture of E. coli XL-1 Blue is diluted in LB medium containing 100 μg/mL Ampicillin to an optical density at 600 nm wavelength (OD600) of 0.1. Then it is grown shaking with 200 rpm at 37 °C to an OD600 of 0.7. After Arabinose is added to a final concentration of 0.2% (w/v), the bacteria are cultivated for another hour. This culture is then diluted in the suspension medium up for investigation to about 106 colony forming units (CFU) of bacteria per milliliter and immediately used in chip experiments.

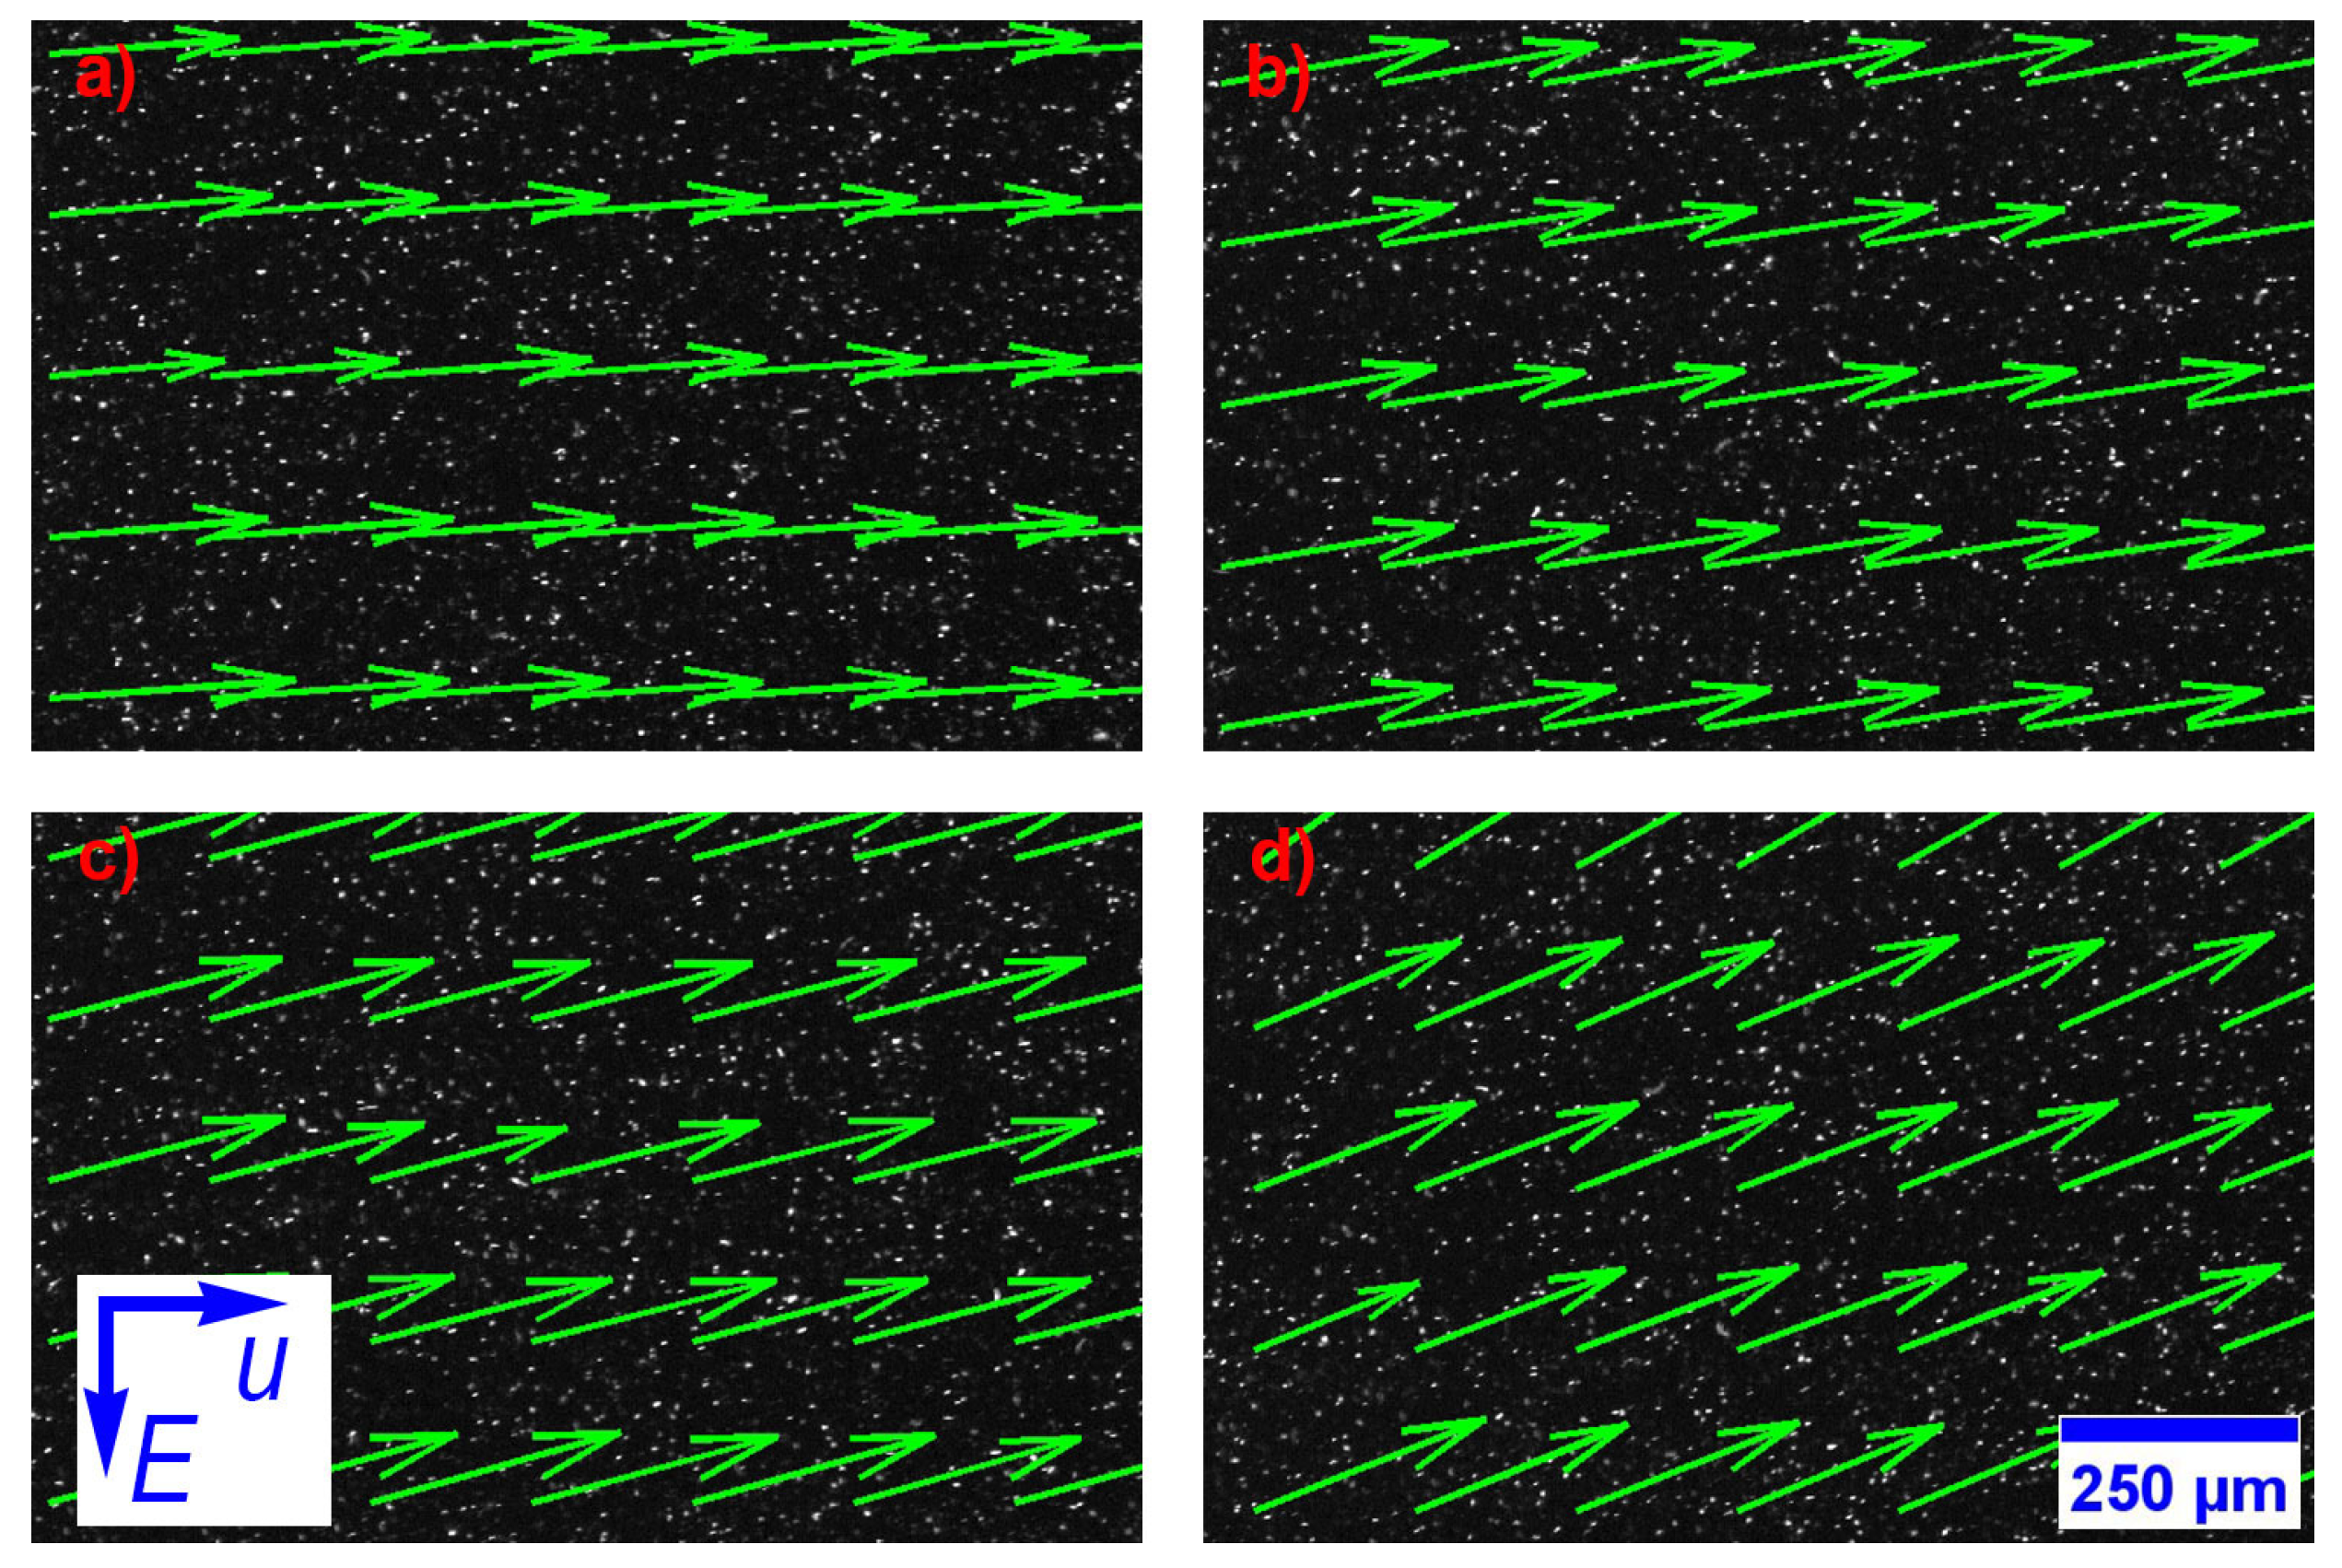
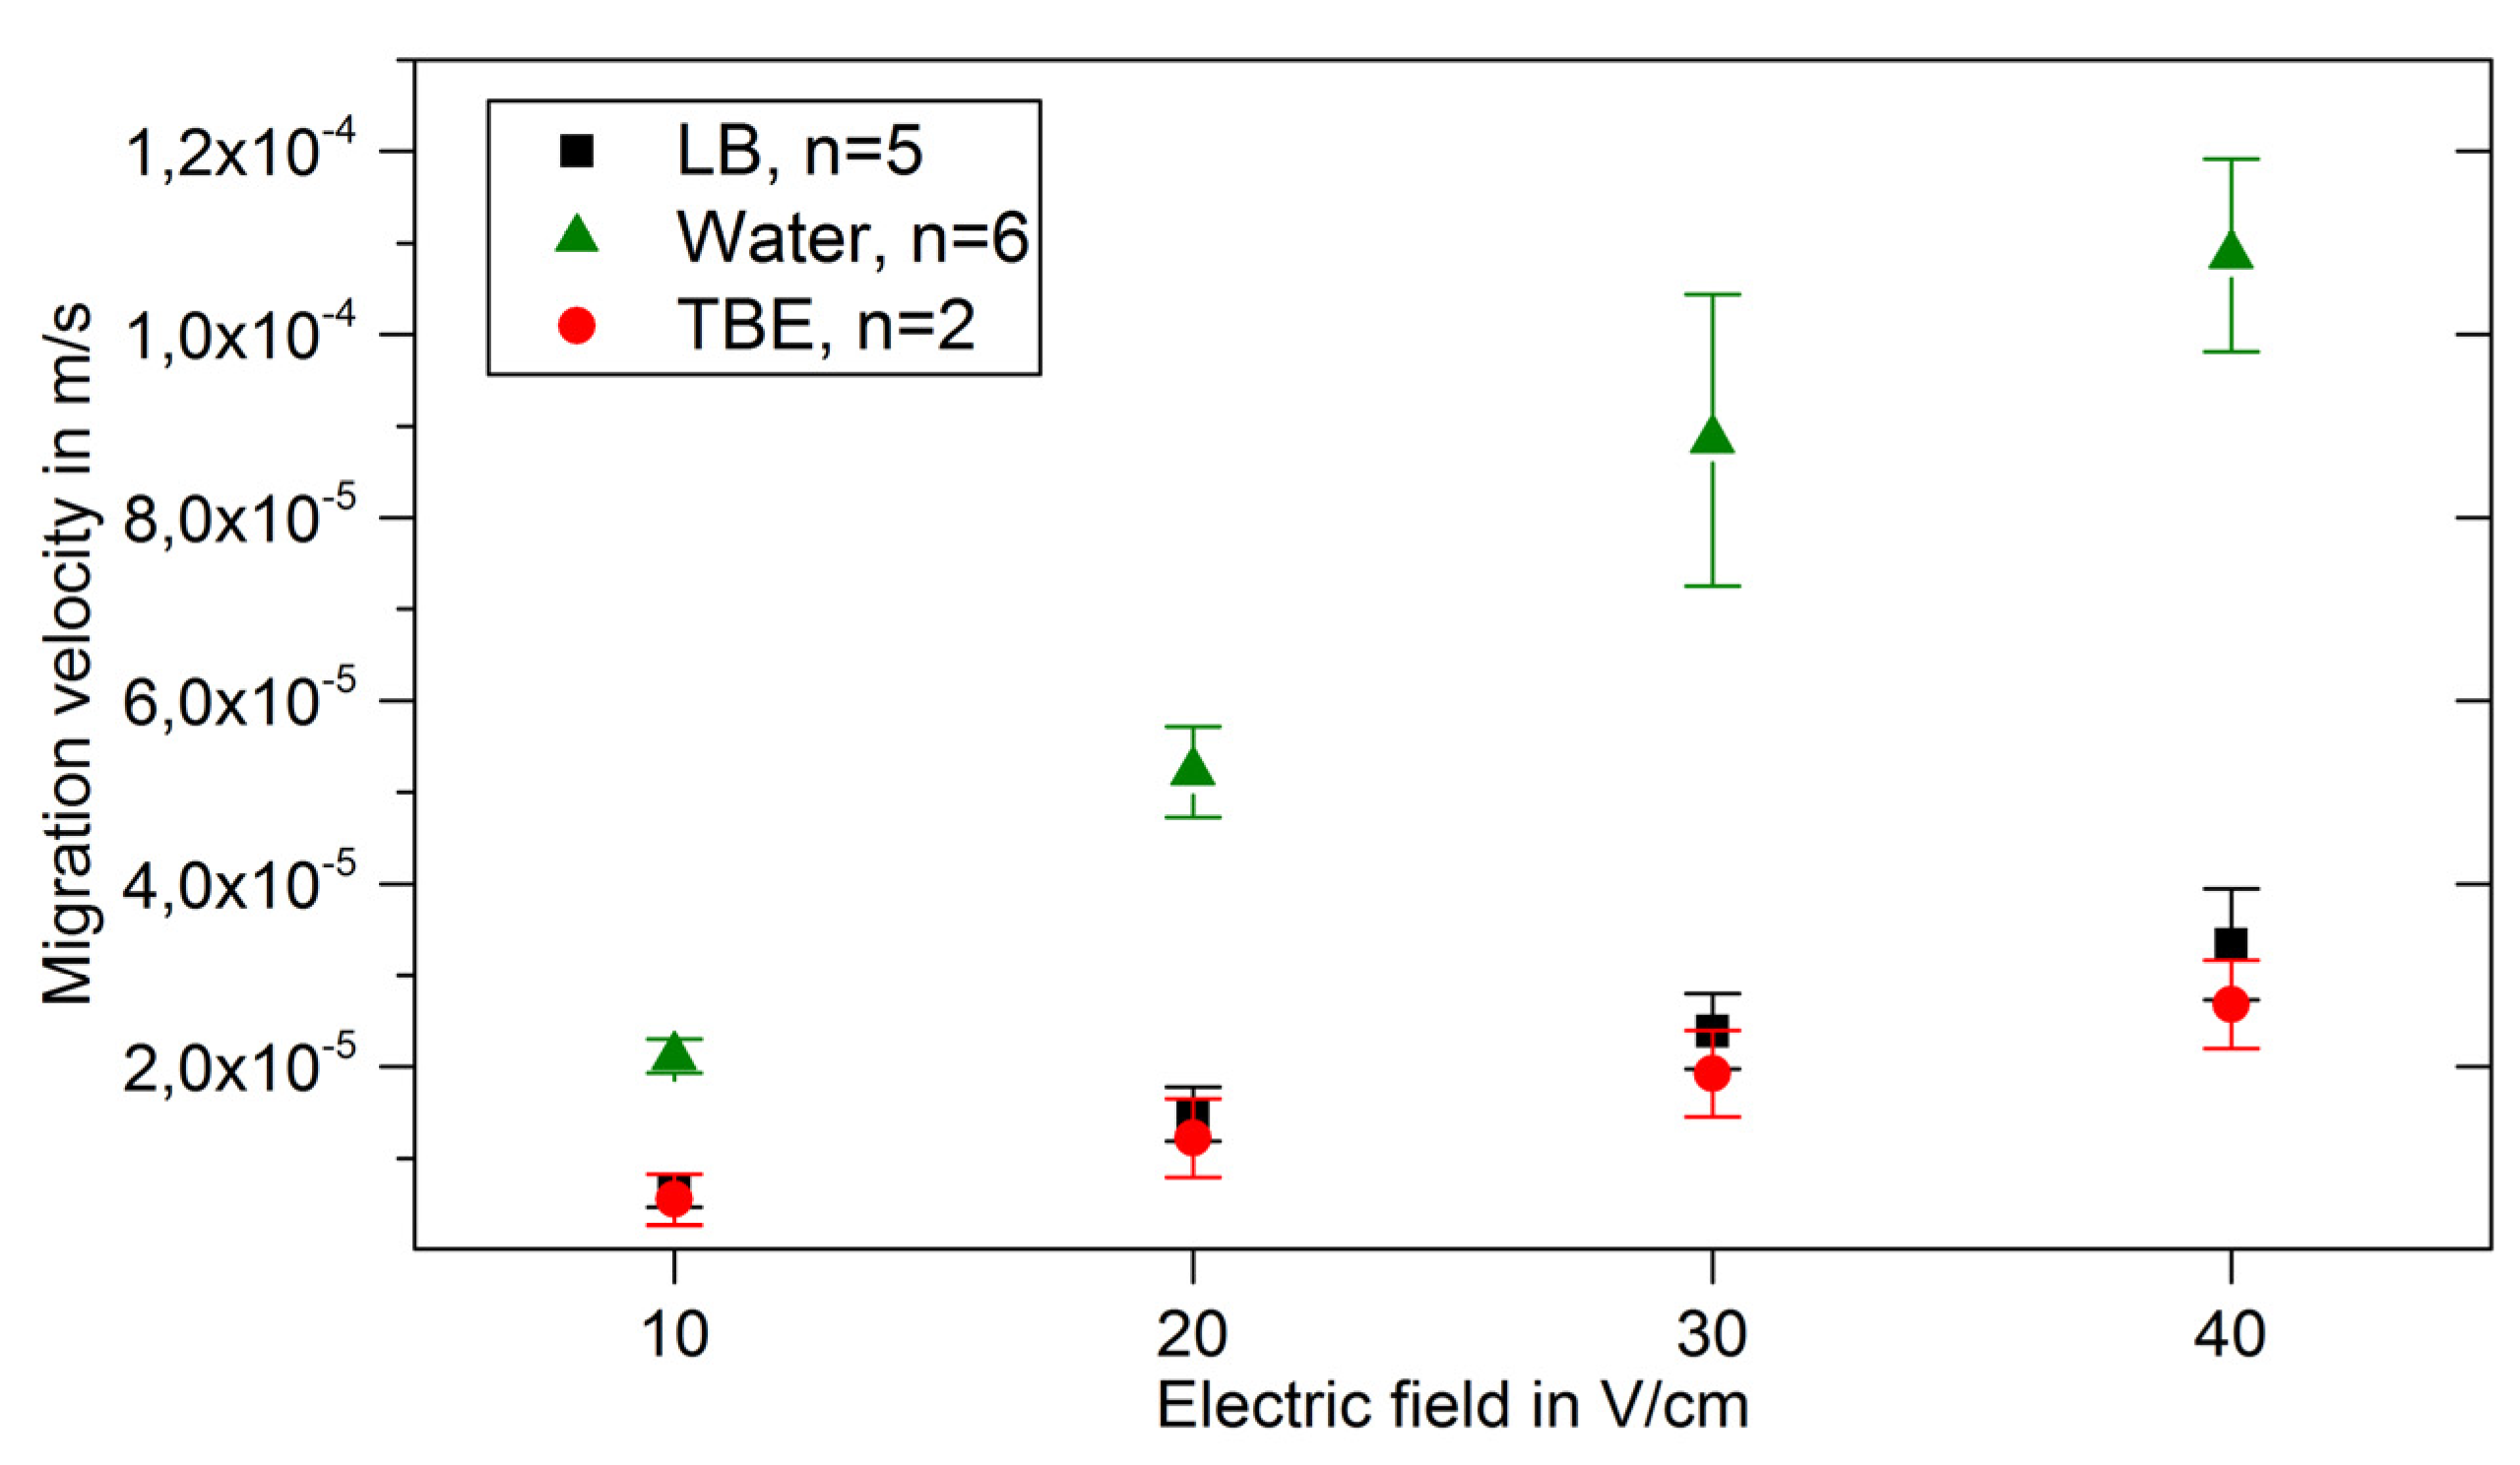
3. Results and Discussion

Figure 2 shows the calculated velocity vector fields for E. coli suspended in LB for increasing field strengths at a constant flow rate of 1 μL/min. As expected, the magnitude of the electrophoretic velocity vector component v increases, while the magnitude of the hydrodynamic velocity vector component u remains constant.
The pressure driven flow velocity u matches the volume flow parameters applied externally, validating the velocity measurement method.
Figure 3 displays the measured values for v at increasing field strengths for TBE, LB and tap water. Similar values of μ are observed for TBE and LB, while tap water shows a difference (Table 1).
It is apparent that no direct correlation between the medium conductivity and pH value and the migration speed can be deduced from the suspension media used in this study. This supports the necessity for measuring μ in situ. All measured electrophoretic mobilities lie within the range noted in literature [4,9,10]. The results demonstrate the functionality of the proposed method.

4. Conclusion and Outlook

The results demonstrate the functionality of the proposed method as well as highlight the importance of µ for optimal FFE efficiency across various suspension media. The system will help enable the detection of pathogens even from very dilute samples by nucleic acid amplification methods. Following this work, a quantitative study of the enrichment efficiency of different pathogens with optimized flow rate and field strength is currently done in our lab.

Acknowledgments

The Authors gratefully acknowledge funding by the German Federal Ministry of Education and Research (BMBF) within the EDIT project (Förderkennzeichen: 033W010A-C, E-J).

Conflicts of Interest

The Authors declare no conflict of interest.

References

  1. Podszun, S.; Vulto, P.; Heinz, H.; Hakenberg, S.; Hermann, C.; Hankemeier, T.; Urban, G.A. Enrichment of viable bacteria in a micro-volume by free-flow electrophoresis. Lab Chip 2012, 12, 451–457. [Google Scholar] [CrossRef] [PubMed]
  2. Vulto, P.; Dame, G.; Maier, U.; Makohliso, S.; Podszun, S.; Zahn, P.; Urban, G.A. A microfluidic approach for high efficiency extraction of low molecular weight RNA. Lab Chip 2010, 10, 610–616. [Google Scholar] [CrossRef] [PubMed]
  3. Pedelacq, J.-D.; Cabantous, S.; Tran, T.; Terwilliger, T.C.; Waldo, G.S. Engineering and characterization of a superfolder green fluorescent protein. Nat. Biotechnol. 2006, 24, 79–88. [Google Scholar] [CrossRef] [PubMed]
  4. Pfetsch, A.; Welsch, T. Determination of the electrophoretic mobility of bacteria and their separation by capillary zone electrophoresis. Fresenius J. Anal. Chem. 1997, 359, 198–201. [Google Scholar] [CrossRef]
  5. Adrian, R.J. Twenty years of particle image velocimetry. Exp. Fluids 2005, 39, 159–169. [Google Scholar] [CrossRef]
  6. Vulto, P.; Huesgen, T.; Albrecht, B.; Urban, G.A. A full-wafer fabrication process for glass microfluidic chips with integrated electroplated electrodes by direct bonding of dry film resist. J. Micromech. Microeng. 2009, 19, 77001. [Google Scholar] [CrossRef]
  7. Schindelin, J.; Arganda-Carreras, I.; Frise, E.; Kaynig, V.; Longair, M.; Pietzsch, T.; Preibisch, S.; Rueden, C.; Saalfeld, S.; Schmid, B.; et al. Fiji: An open-source platform for biological-image analysis. Nat. Methods 2012, 9, 676–682. [Google Scholar] [CrossRef]
  8. Thielicke, W.; Stamhuis, E.J. PIVlab—Towards User-friendly, Affordable and Accurate Digital Particle Image Velocimetry in MATLAB. J. Open Res. Softw. 2014, 2, 1202. [Google Scholar] [CrossRef]
  9. Bayer, M.E.; Sloyer, J.L., Jr. The electrophoretic mobility of gram-negative and gram-positive bacteria: An electrokinetic analysis. J. Gen. Microbiol. 1990, 136, 867–874. [Google Scholar] [CrossRef] [PubMed]
  10. Buszewski, B.; Szumski, M.; Kłodzińska, E.; Dahm, H. Separation of bacteria by capillary electrophoresis. J. Sep. Sci. 2003, 26, 1045–1049. [Google Scholar] [CrossRef]
Figure 1. Left: Explosion view rendering of the chip holder used for the experiments. It can be placed on an inverted microscope, with the focus (observation plane) in the center of the sample chamber of the microfluidic glass chip. Right: Photograph of a Chip with hydrogel barriers (blue) and electrode structures (black).
Proceedings 01 00535 g001
Figure 2. Graphical representation of the PIVlab results. All with 106 bacteria per milliliter in LB media at a hydrodynamic flow u of 1 μL/min. The applied electric field E is increased from 10 V/cm (a) over 20 V/cm (b) and 30 V/cm (c) to 40 V/cm (d). The white dots are bacteria in contrast to the black background.
Proceedings 01 00535 g002
Figure 3. Comparison of the measured migration speed in different media. All are averages of measurements with fresh cultures on different days.
Proceedings 01 00535 g003
Table 1. Electrophoretic mobility of E. coli in different media and pure media properties.
MediumElectrophoretic Mobility μ in m²/VsElectric Conductivity σ at 23 °C in μS/cmpH
LB Luria −0.75 × 10⁻⁸ ± 0.0835007.0
Tap water −2.6 × 10⁻⁸ ± 0.355108.5
1× TBE −0.76 × 10⁻⁸ ± 0.1611007.4
Publisher’s Note: MDPI stays neutral with regard to jurisdictional claims in published maps and institutional affiliations.

