Reference-Incorporating Microwave Resonator-Based Sensors for Biological Sensing Applications †


1
Department of Electrical and Electronics Engineering, Bogazici University, 34342 Istanbul, Turkey
2
Center for Life Sciences and Technologies, Bogazici University, 34342 Istanbul, Turkey
*
Author to whom correspondence should be addressed.
†
Presented at the Eurosensors 2017 Conference, Paris, France, 3–6 September 2017.
Proceedings 2017, 1(4), 542; https://doi.org/10.3390/proceedings1040542
Published: 7 August 2017
(This article belongs to the Proceedings of Proceedings of Eurosensors 2017, Paris, France, 3–6 September 2017)
Abstract
:Use of microwave resonator-based sensors is a relatively new approach for the detection of biological reagents. Sensing mechanism is based on the tracking of the resonant frequency on electromagnetic resonator. Resonant frequency depends on structure geometry and material but is also affected by secondary changes in environment. Addition of a reference resonator to suppress these effects is proposed in this work. Identical sensor structures designed at 2 GHz, fabricated using low-cost processes are used in experiments to demonstrate the use of a resonator pair for sensing of glucose in solutions, yielding a sensitivity of 34.72 MHz/ (mg/mL).
1. Introduction
There has been a recent interest in microwave resonators and their applications in sensing. These frequency selective structures are usually realized as dielectric and metallic loop geometries. Geometry of the structure, as well as its material give rise to an equivalent electrical network of resistances, capacitances, and inductances [1,2]. This network exhibits a resonant characteristic at a certain resonant frequency determined by the resistances, capacitances, and inductances associated with the geometry and the materials.
Sensing is done by the observation of the said resonant frequency of the resonator. Any change in the physical shape, material composition, or environmental factors such as temperature fluctuations foreign reagent inclusion alter the components of the frequency selective network and in turn affects the resonant frequency itself. Physical sensors rely on the change of geometry, whereas the chemical sensing and interface detection is possible thanks to the change of electrical permittivity of the medium [3,4]. For a biosensor application, biospecificity is possible with the functionalization of the resonator surface with a biospecific agent. In this scenario, any biochemical binding or reaction changes the electrical permittivity of the medium to enable sensing [5].
Microwave resonator biosensing technology is still at its premature stage with certain advantages deeming it promising. Fabrication has significant cost effect advantages since it can be done using low-cost printed circuit board fabrication methods on a planar surface. The structure concept is compatible with photolithography driven microfabrication and therefore is potentially scalable and easy to integrate with standard CMOS technologies.
A prominent challenge that the application of microwave resonators in biosensing currently face is the need to increase measurement precision. Since the resonant frequency depends on the physical characteristics of the medium, it is affected by the random changes in the environment such as temperature fluctuations and physical invasion. Random shifts caused by these effects constitute a background noise and drift, decreasing measurement precision. In this work, we proposed a method to suppress these effects by incorporating a second resonator as a reference and compare the resonant characteristic of the measuring resonator with respect that reference. The idea is that external effects described above would cause similar shifts in both of the resonators and thus can be rejected by comparison.
2. Materials and Methods
Resonance of a pair of resonators can be tracked in a variety of ways, each having their own advantages and disadvantages. As a reference geometry, it is possible to use one identical to or different from the measuring one. Resonant characteristics of the pair can be measured simultaneously or in multiplexed fashion. The highest improvement in precision will be obtained with the simultaneous measurement of identical structure geometries since only identical structures would be affected by external effects in the exact same fashion. Thus, simultaneous measurement approach is implemented here to ensure a better cancellation of background noise despite the fact that it increases complexity.
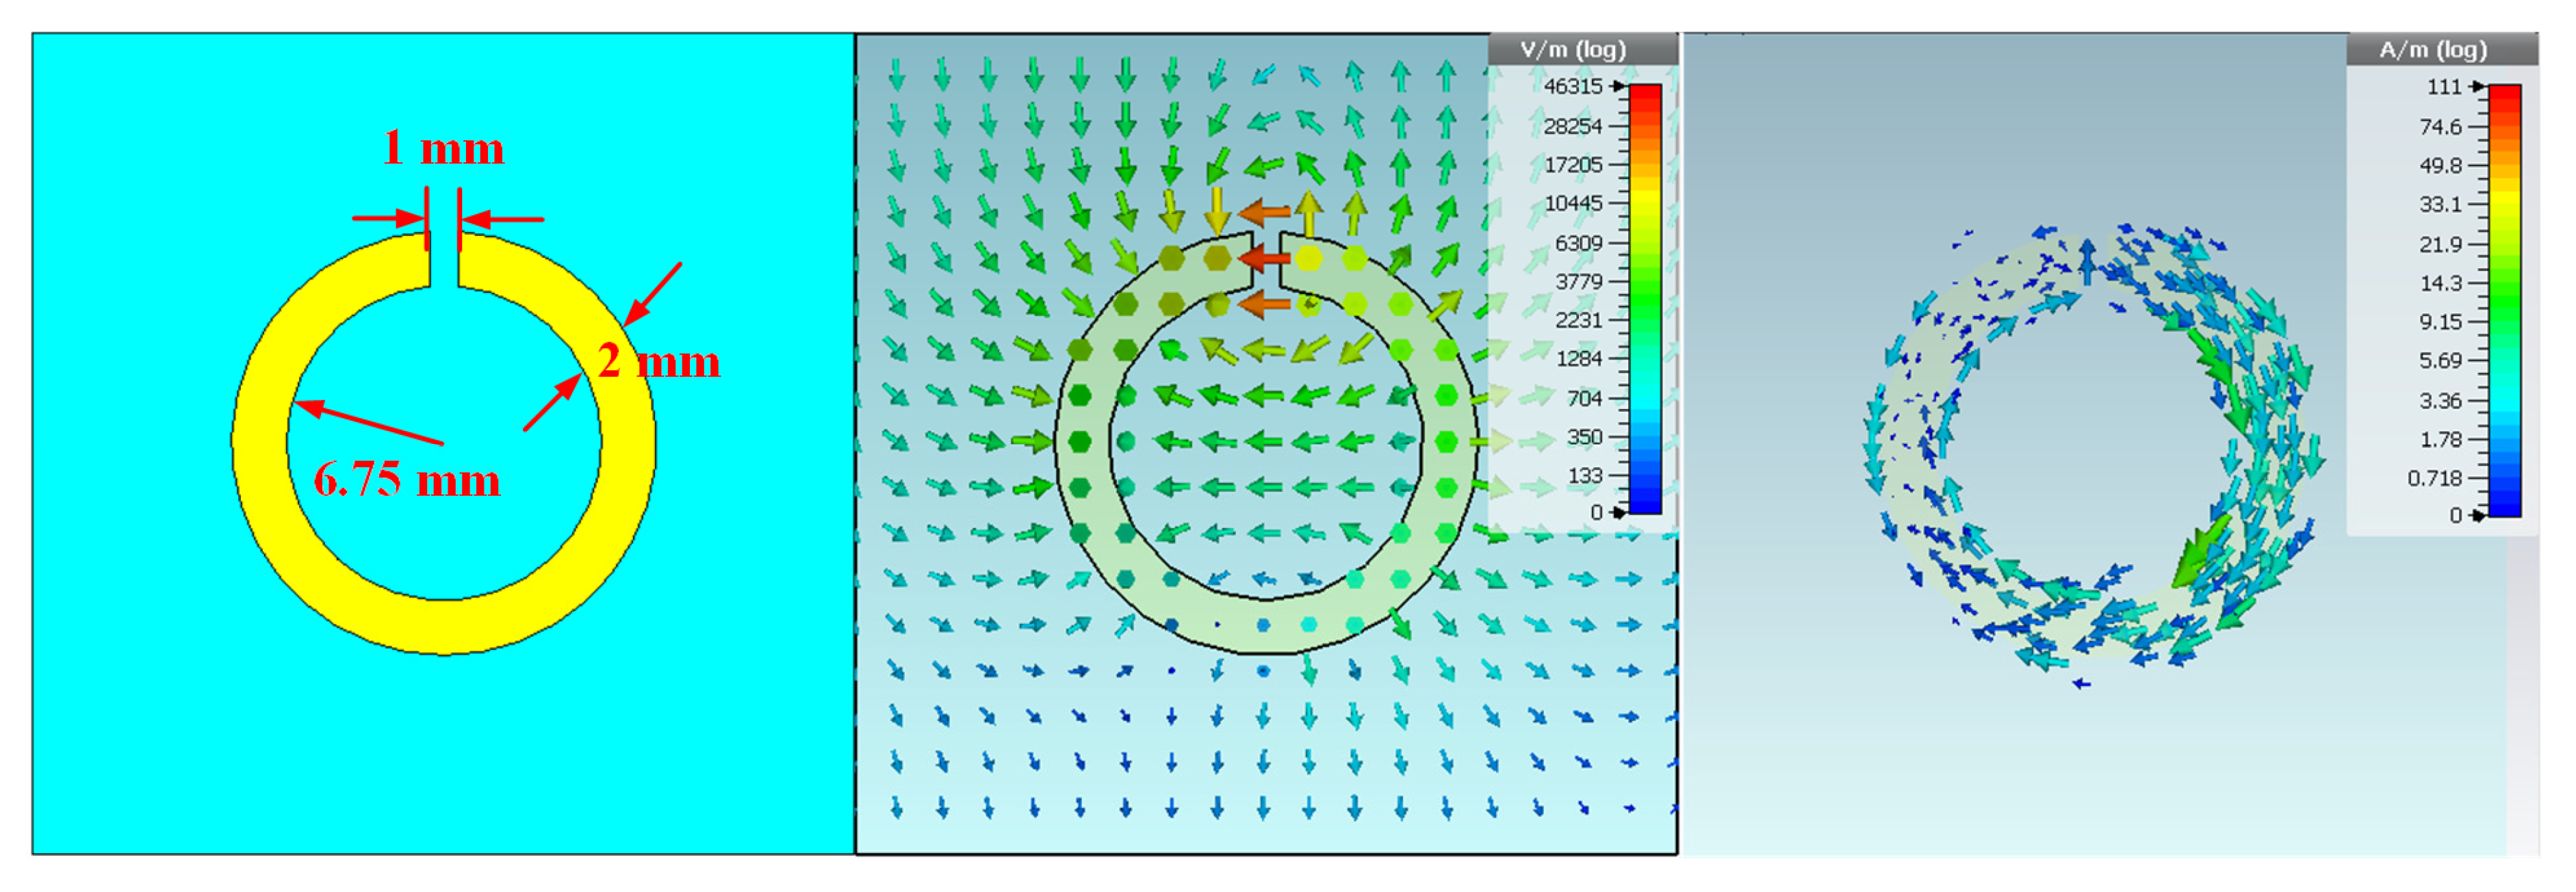
Single split ring resonators (SRR) are used in the course of the measurements. Structures are designed in CST Microwave Studio environment at a resonant frequency of 2 GHz. Device structure and dimensions are shown in Figure 1 along with simulated behavior. Two identical structures are fabricated on a 30 mm × 30 mm × 1.6 mm FR4 substrate using a low-cost printed circuit board fabrication process. To contain the measurand samples, plexiglass rectangular channels were laser-cut and fixed on the structures.
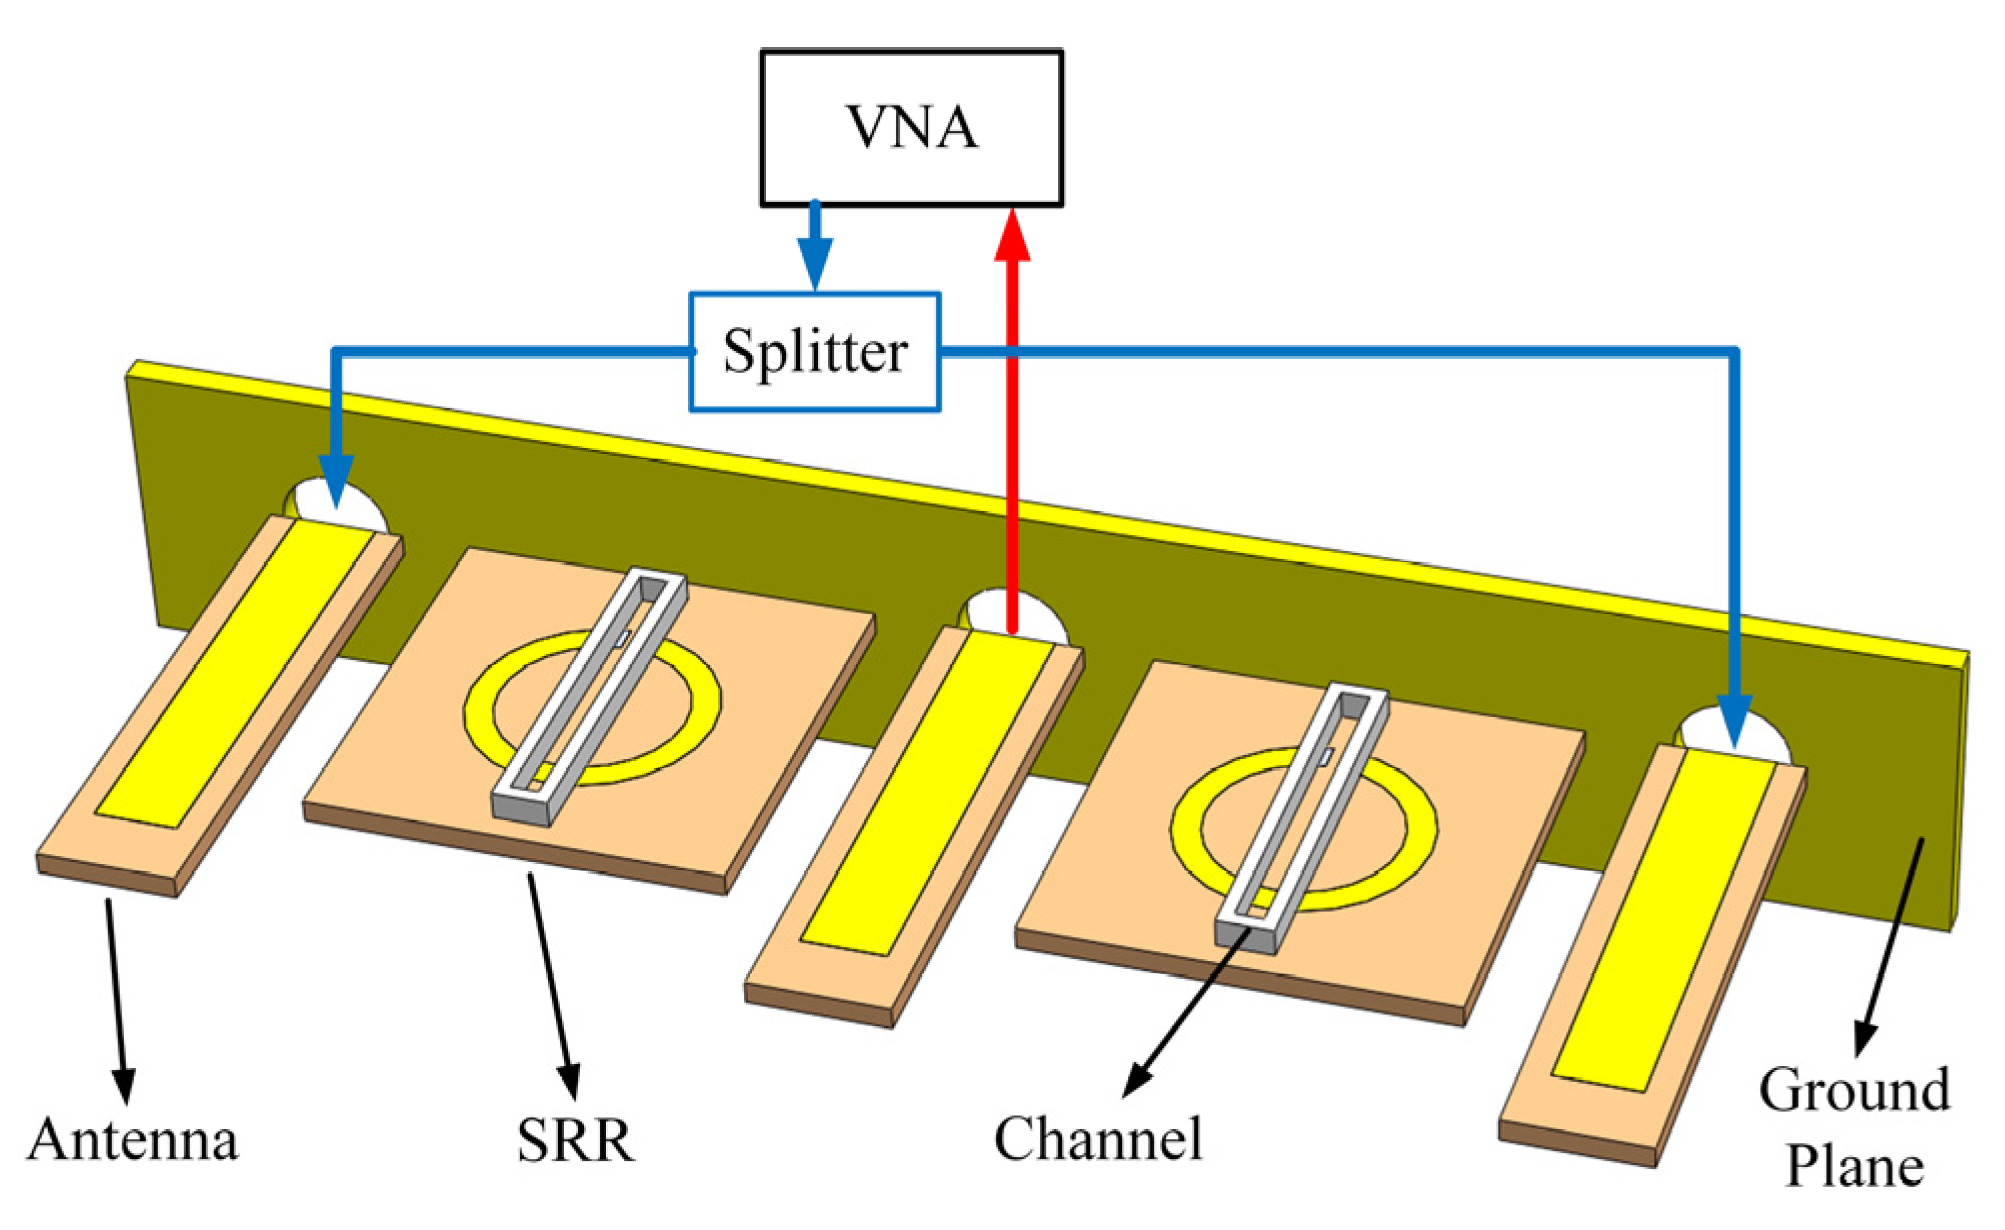
It can be challenging to perform simultaneous measurements of a pair or SRRs while not doubling the entire measurement setup, which increases cost and complexity significantly. One way to overcome the challenge is to excite the SRRs using a trio of microstrip monopole antennas as shown in Figure 2. In this approach, the transmitted power, fed by the port 1 of the vector network analyzer (VNA-Rohde & Schwarz ZVB4), is split in two via a splitter (Mini Circuits ZFSC-2-372-S+). The split signal components of transmission port have the same amplitudes and phases in accordance with the splitter operation. The split transmission is fed to two antenna strips placed on the two sides of the setup and collected by the one in the middle, which is connected to the port 2 of the VNA. Resonant frequency characteristics can be tracked with the observation of transmission spectra in VNA in term of s21 parameters. In this way, the SRR pair can symmetrically and simultaneously load the overall transmission process. A ground plane of conducting material is also present for correct operation of monopole antennas. Disadvantages of this approach are the insertion loss contribution of the splitter and the quality factor reduction of SRRs due to split transmission operation.
3. Results
Transmission spectra of the fabricated SRR pair were measured before and after the addition of channel structures. Measured and simulated s21 parameters for this structure are shown in Figure 3. Minima in the transmission spectra correspond to the resonant frequency. In simulation environment that includes monopole antennas, the design yields a resonant frequency at 1.982 GHz, which is close to the measured resonant frequencies of the SRRs are at 1.99 GHz and 1.97 GHz. Inclusion of the channel reduces the resonant frequencies to 1.93 GHz and 1.92 GHz due to an increased electrical permittivity above the SRRs, which increases capacitive components.
Double measurements were first done with DI water samples were used as a dielectric load. Here, the reference SRR was not loaded while the measuring SRR was loaded in different volumes. The results shown in Figure 3 indicate that it is possible to successfully resolve two different resonant frequencies with this approach, the lower one associated with the measuring SRR, while the higher one associated with the reference SRR. Increasing the volume of the load dielectric increases the amount of shift as expected since the effective permittivity is increasing. Data also show the disadvantage associated with this approach in terms of a reduction in quality factors due to parallel operation when resonant frequencies of SRRs are separated as a result of the dielectric loading.
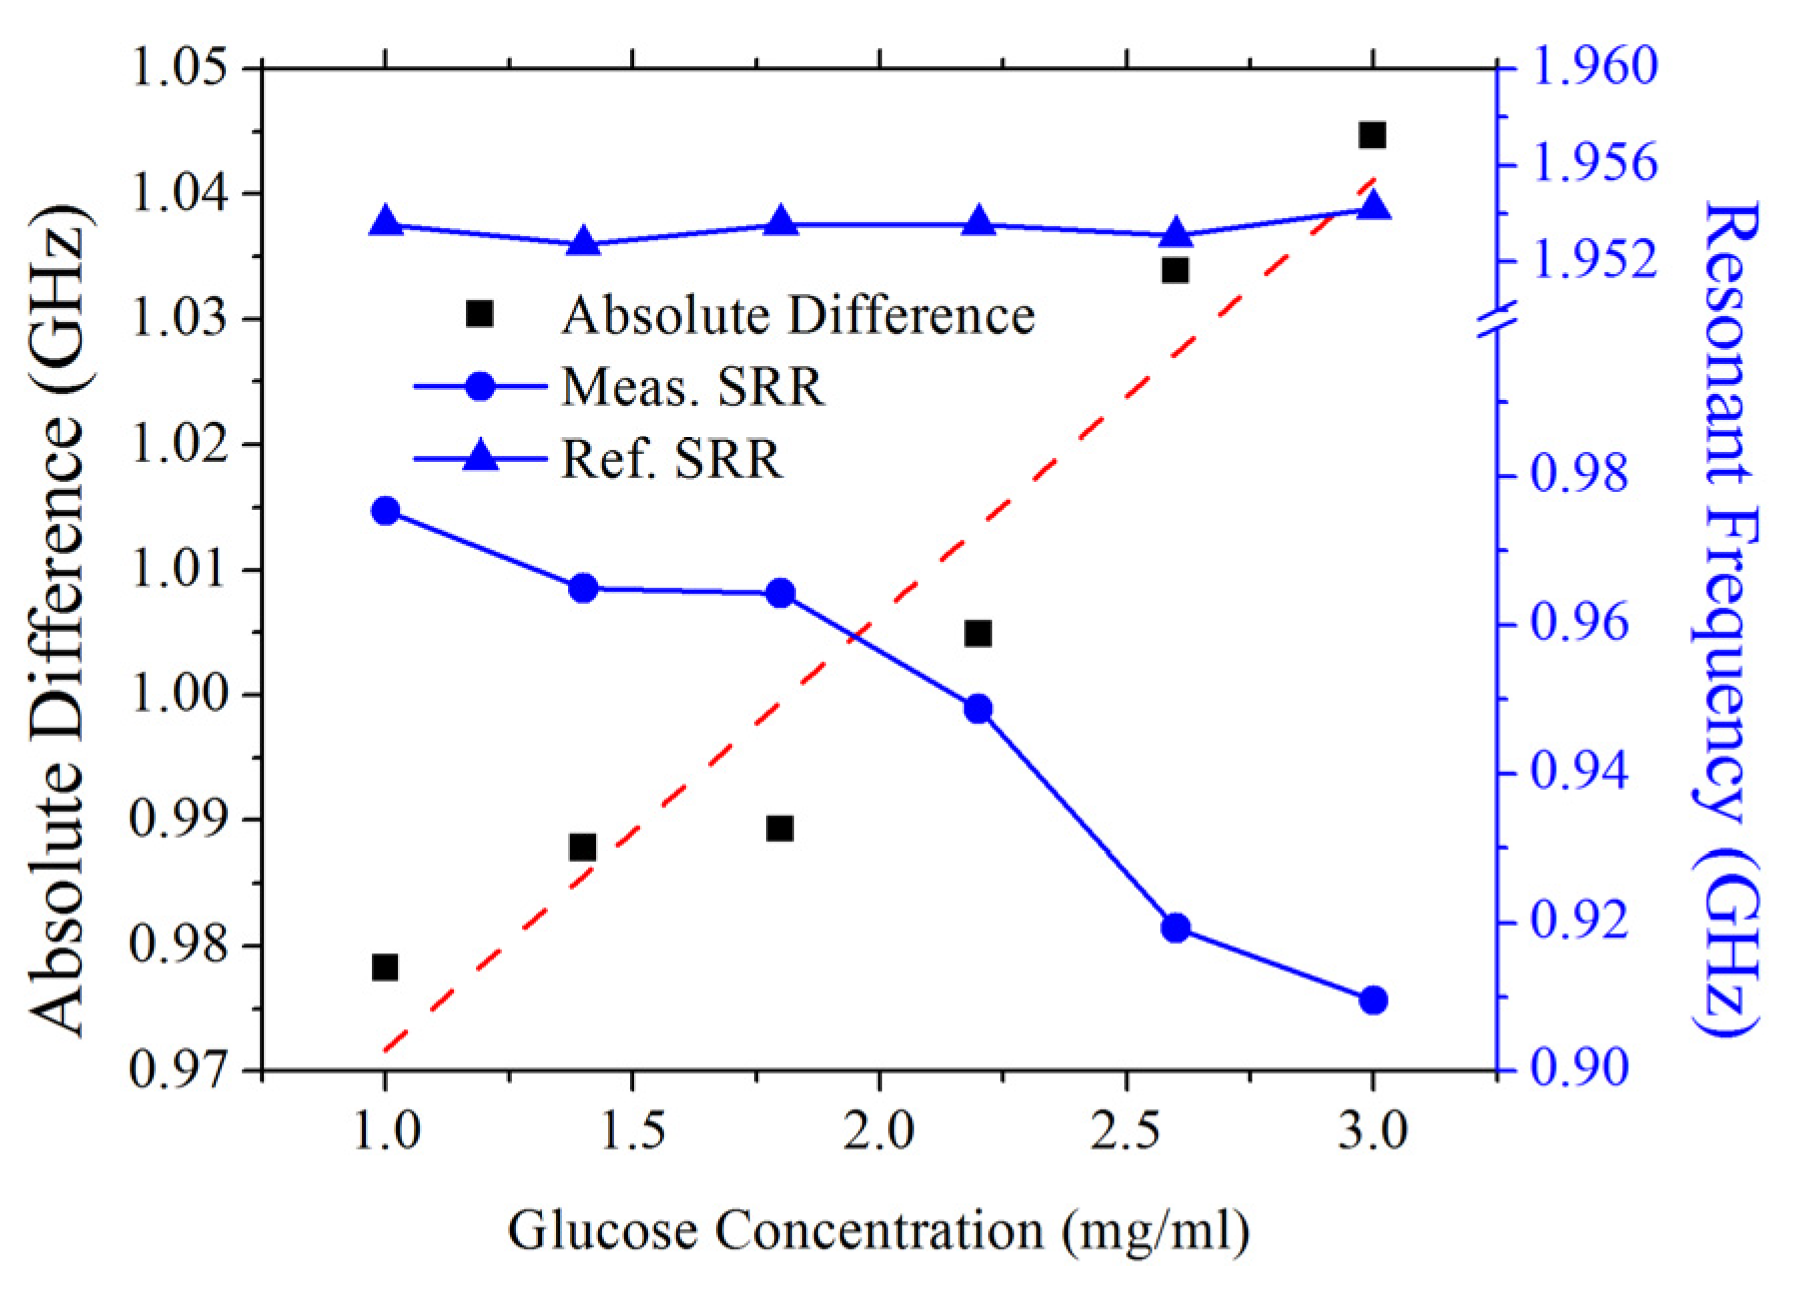
Lastly, glucose solutions within a concentration range of 1.0–3.0 mg/mL were applied to measuring SRR, while the reference resonator was kept empty. Changes in resonant frequencies of the reference and measuring SRR and their difference are shown in Figure 4. Data confirm that the shift in measuring SRR is proportional to the glucose concentration levels, whereas the shift in the reference SRR is random and less sensitive to glucose concentration shifts. A linear fit (R2 = 0.905) to absolute difference between the resonant frequencies at each concentration level implies a sensitivity to glucose concentration of 34.72 MHz/(mg/mL).
4. Discussion
Microwave resonator based sensing is promising thanks to its many advantages, but is yet to mature fully before it overcomes certain challenges. Prominent among these is the measurement noise caused by the interference of external effects. In this work, a method to suppress background noise ocurring in microwave resonator based sensing operations is proposed. The main idea is to compare the resonant frequency of the measuring resonator to that of a reference resonator.
It is possible to handle the approach in multiple methods. The suggested approach provides thorough noise suppression since it is a perfectly symmetrical setup offering simultaneous read out for both of the resonators. Successful operation was demonstrated in the work with random fluctuation observed in reference resonator and the absolute difference between two resonant frequencies follow a linear trend with respect to the applied glucose concentration. Other read out methods can be devised for reduction of complexity traded for a higher measurement precision and sensor reliability.
Acknowledgments
This work was supported by the Turkish Academy of Sciences (TUBA), the Scientific and Technological Research Council of Turkey (TUBITAK) under project code 112E250, and the Department of Scientific Research of Bogazici University (BAP) under project 16A02TUG4.
Conflicts of Interest
The authors declare no conflict of interest.
References
- Sydoruk, O.E.; Tatartschuk, E.; Shamonina, A.; Solymar, L. Analytical formulation for the resonant frequency of split rings. J. Appl. Phys. 2009, 105, 014913.1–014913.4. [Google Scholar] [CrossRef]
- Wellenzohn, M.; Brandl, M. A theoretical design of a biosensor device based on split ring resonators for operation in the microwave regime. Procedia Eng. 2015, 120, 865–869. [Google Scholar] [CrossRef]
- Lee, H.J.; Yook, J.G. Biosensing using split-ring resonators at the microwave regime. Appl. Phys. Lett. 2008, 92. [Google Scholar] [CrossRef]
- Kim, N.-Y.; Adhikari, K.K.; Dhakal, R.; Chuluunbaatar, Z.; Wang, C.; Kim, E. Rapid sensitive and reusable detection of glucose by a robust radiofrequency integrated passive device biosensor chip. Sci. Rep. 2015, 5. [Google Scholar] [CrossRef] [PubMed]
- Camli, B.; Kusakci, E.; Lafci, B.; Salman, S.; Torun, H.; Yalcinkaya, A.D. Cost-effective, microstrip antenna driven ring resonator microwave biosensor for biospecific detection of glucose. IEEE J. Sel. Top. Quantum Electron. 2017, 23, 404–409. [Google Scholar] [CrossRef]
Figure 1.
Structure of the device used in the measurements (left), E filed orientations at resonance (middle) and surface current densities at resonance (right).
Figure 1.
Structure of the device used in the measurements (left), E filed orientations at resonance (middle) and surface current densities at resonance (right).

Figure 2.
A schematic description of the measurement setup.

Figure 3.
Resonant frequency of the SRR structure pair with and without channels fixed on them. (left) and shift in resonant frequency under dielectric loading in terms of DI water in different volumes (right).
Figure 3.
Resonant frequency of the SRR structure pair with and without channels fixed on them. (left) and shift in resonant frequency under dielectric loading in terms of DI water in different volumes (right).

Figure 4.
Change in resonant frequency of the reference and measuring resonator with respect to glucose concentration (right axis) and the absolute value of their difference (left axis). A linear fit to difference behavior (R2 = 0.905) determines the sensitivity as 34.72 MHz/ (mg/mL).
Figure 4.
Change in resonant frequency of the reference and measuring resonator with respect to glucose concentration (right axis) and the absolute value of their difference (left axis). A linear fit to difference behavior (R2 = 0.905) determines the sensitivity as 34.72 MHz/ (mg/mL).

Publisher’s Note: MDPI stays neutral with regard to jurisdictional claims in published maps and institutional affiliations. |
© 2017 by the authors. Licensee MDPI, Basel, Switzerland. This article is an open access article distributed under the terms and conditions of the Creative Commons Attribution (CC BY) license (https://creativecommons.org/licenses/by/4.0/).
Share and Cite
MDPI and ACS Style
Camli, B.; Torun, H.; Dundar, G.; Yalcinkaya, A.D. Reference-Incorporating Microwave Resonator-Based Sensors for Biological Sensing Applications. Proceedings 2017, 1, 542. https://doi.org/10.3390/proceedings1040542
AMA Style
Camli B, Torun H, Dundar G, Yalcinkaya AD. Reference-Incorporating Microwave Resonator-Based Sensors for Biological Sensing Applications. Proceedings. 2017; 1(4):542. https://doi.org/10.3390/proceedings1040542
Chicago/Turabian StyleCamli, Berk, Hamdi Torun, Gunhan Dundar, and Arda D. Yalcinkaya. 2017. "Reference-Incorporating Microwave Resonator-Based Sensors for Biological Sensing Applications" Proceedings 1, no. 4: 542. https://doi.org/10.3390/proceedings1040542