A Portable, Optical Scanning System for Large Field of View, High Resolution Imaging of Biological Specimens †


1
Institute of Nanotechnology and Nanoscience, N.C.S.R. Demokritos, Athens, Greece
2
Department of Materials Science and Technology, University of Crete, Irakleion, Greece
*
Author to whom correspondence should be addressed.
†
Presented at the Eurosensors 2017 Conference, Paris, France, 3–6 September 2017.
Proceedings 2017, 1(4), 548; https://doi.org/10.3390/proceedings1040548
Published: 29 August 2017
(This article belongs to the Proceedings of Proceedings of Eurosensors 2017, Paris, France, 3–6 September 2017)
Abstract
:Large field-of-view (FOV), high resolution imaging of biological specimens is a challenging task, requiring sophisticated and bulky optical systems. Such systems cannot be used for diagnosing or monitoring a disease at the point-of-care. To address this need, we developed a portable, optical system that can image—with a 2.88 μm resolution—large areas (6 mm × 40 mm) from various biological samples by performing scanning in one direction. This is achieved through the use of a microfabricated, mini-lens array. We demonstrated that our system can detect single cells from a smear blood test and thus validating our vision for its use at the point-of-care.
1. Introduction
Examination of biological specimens is a crucial step for diagnosing and monitoring a broad range of diseases, extending from AIDS, tuberculosis and to sickle cell disease. Optical microscopy is widely used but it typically requires bulky, sophisticated and expensive imaging setups operated by trained personnel. In limited-resource settings in particular, a portable, easy to use system, that can automate the imaging process and obtain large field of view (FOV), high resolution images of the specimen, is needed [1]. Despite the numerous methodologies that have been proposed, implementing optical microscopy at the point-of-care still remains a challenge. In this work, we describe an imaging system that produces a 2 dimensional (2D) high resolution, large FOV image of a biological sample by performing scanning in only 1 direction.
2. Materials and Methods
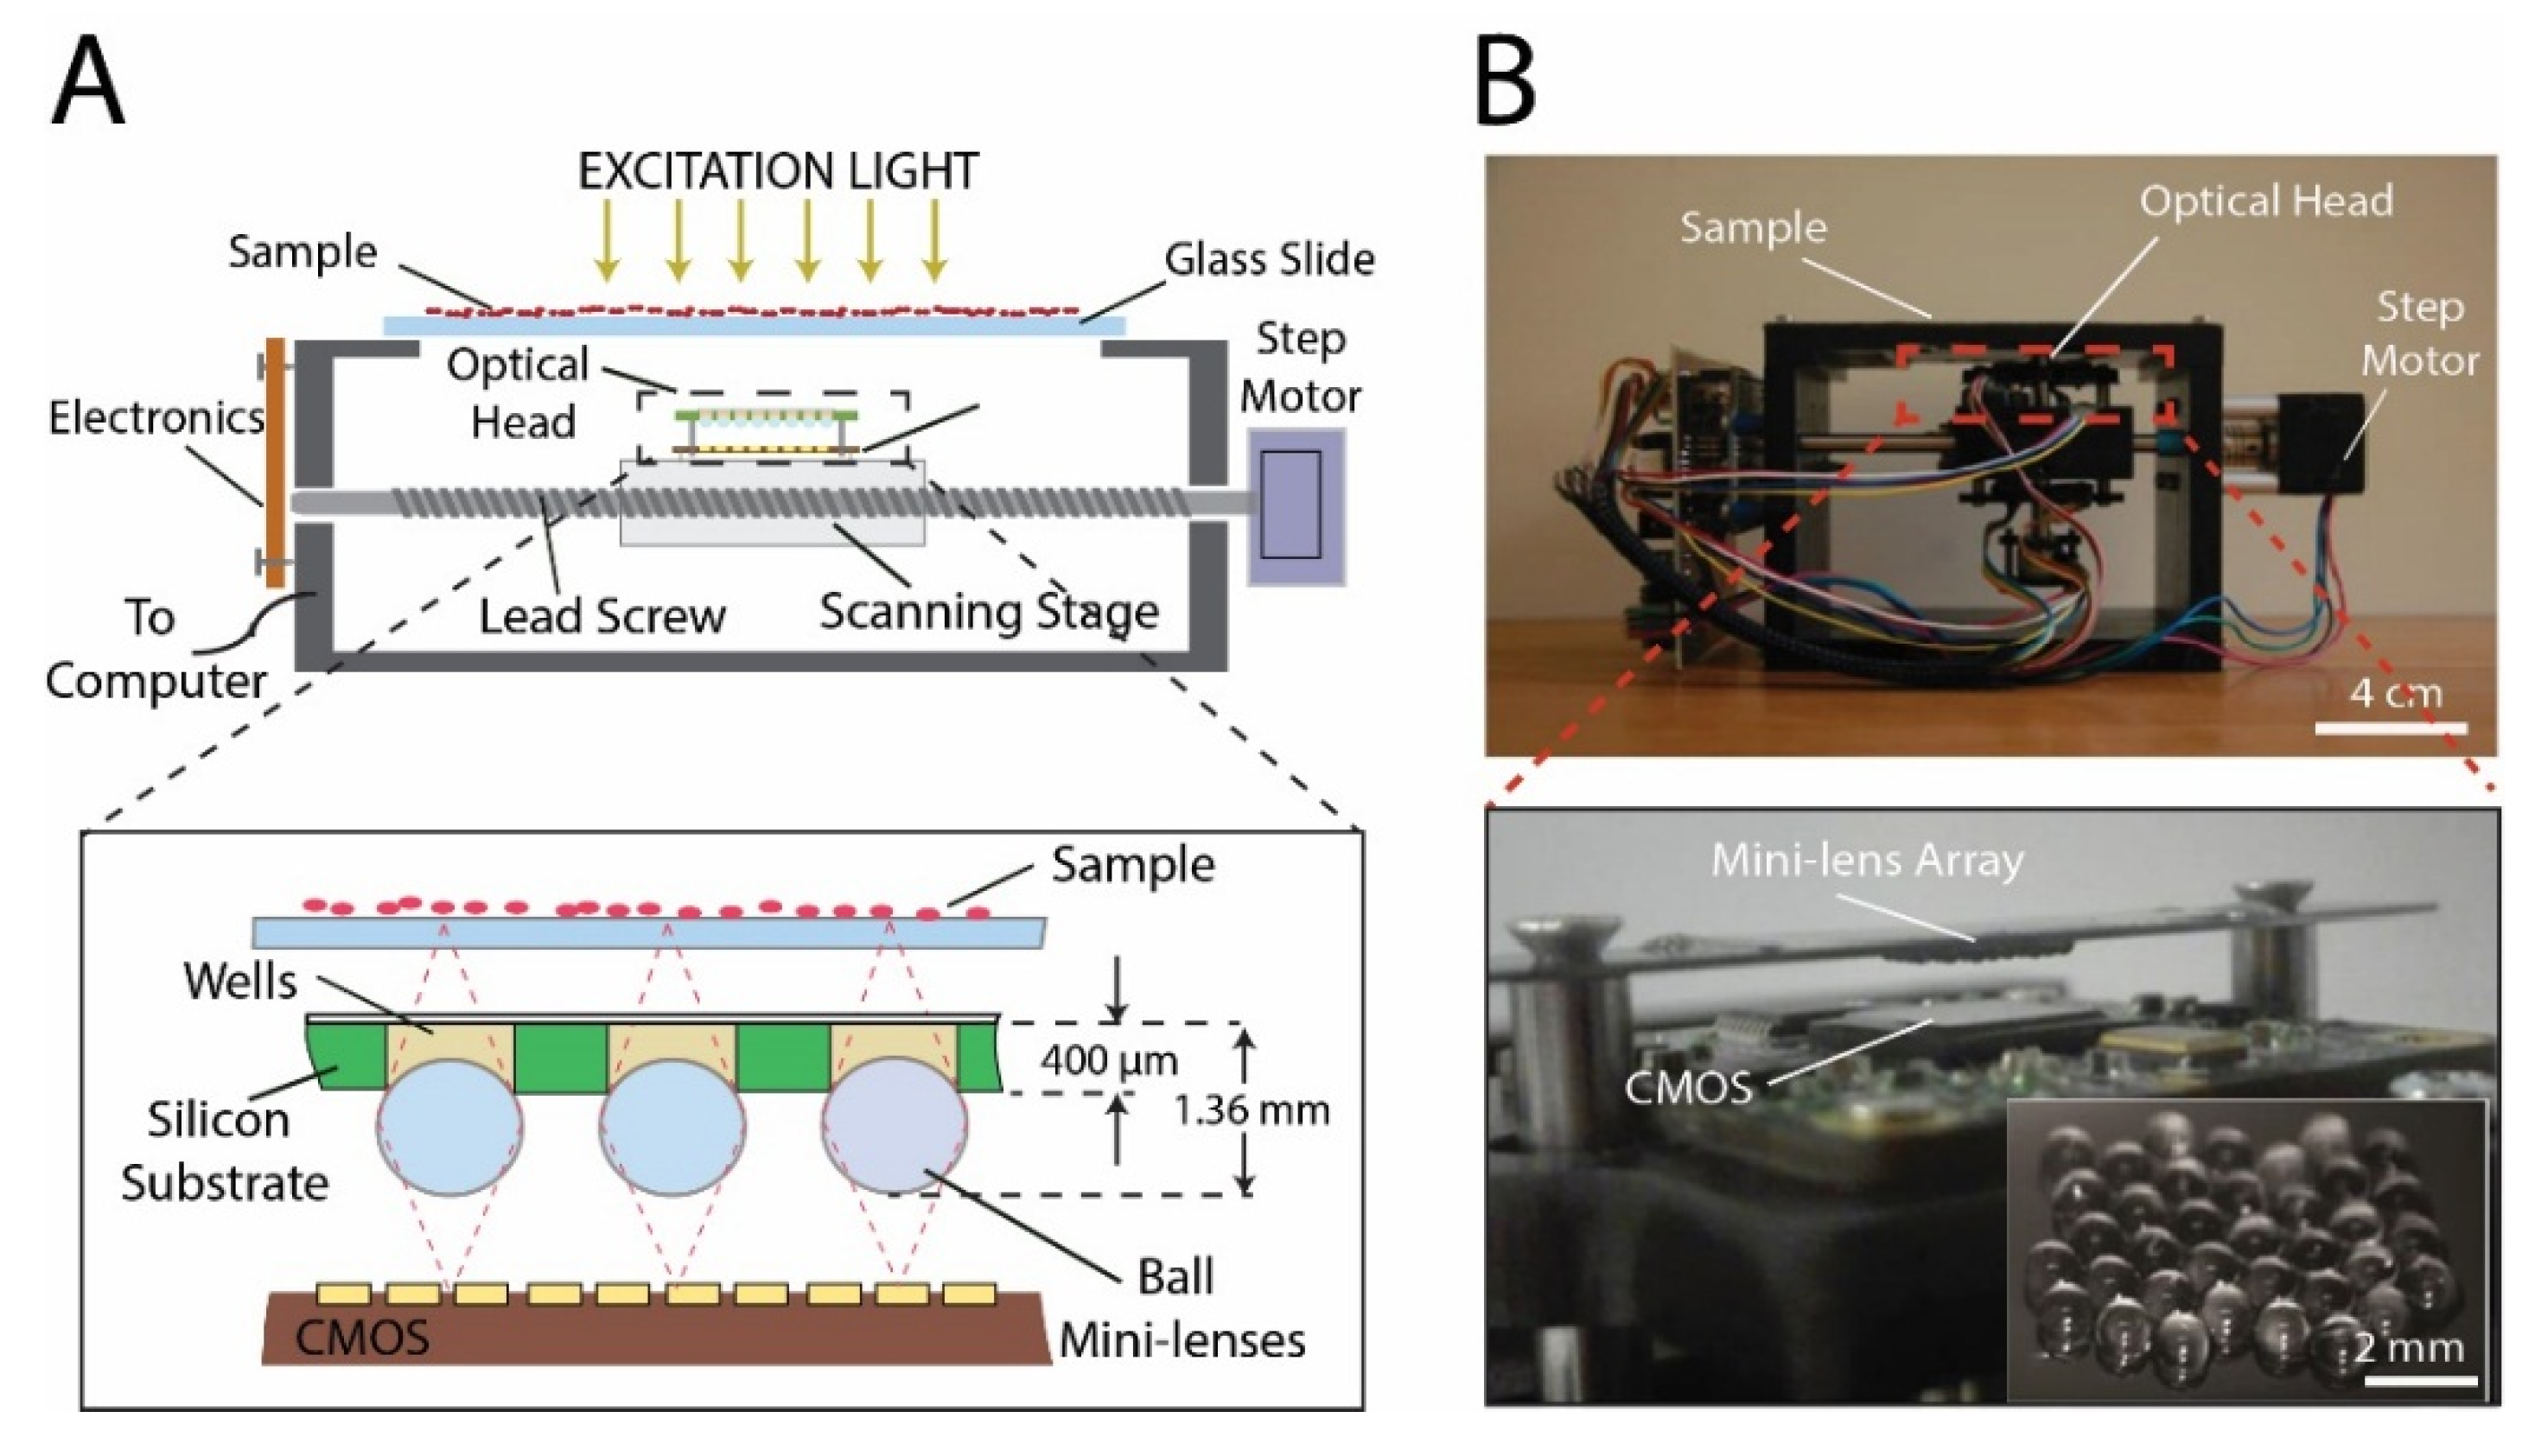
We developed an imaging, scanning system (Figure 1) that comprises of: (a) an optical head that images the specimen of interest and (b) a motorized, translation stage that is responsible for moving the optical head along the specimen (1D scanning). The optical head is an assembly of a 5Mpixel CMOS sensor (Imaging Source, DMM72BUC02-ML) and of a custom-made mini-lens array. The optical head is attached to a translation stage that is connected to a computer-controlled, step motor through a lead screw. The specimen—typically sitting on a glass slide or coverslip—is placed at a short distance (~0–500 μm) from the optical head and is illuminated by an external white light LED array (Edmund Optics, #66-830) that provides homogeneous illumination. The CMOS/mini-lens array assembly moves in one direction and has a travelling distance of approximately 40 mm. This configuration creates a 40 mm × 6 mm image of the specimen. The distances between the mini-lens array, the CMOS sensor and the specimen are controlled by two step motors (20 μm step, 3 mm range) that allows us to obtain a sharp, focused image of the specimen. The focusing procedure is performed manually prior to every scan.
Key element of the scanning system is the design of the 2D mini-lens array (Figure 2). It consists of 42, high numerical aperture (NA~0.7), 1 mm in diameter sapphire ball lenses (Edmund Optics, #43-638). They are glued on top of an array of 42 wells, DRIE-etched in a silicon chip [2] with a UV curable optical adhesivie (Norland 60). The mini-les array sits on top of the CMOS camera. All mini-lenses are equally spaced with an edge-to-edge distance of 50 μm. The lens array is placed with a tilt (17°) with respect to the scanning direction. The tilt design enables the FOV of a lens—estimated approx. 290 μm/lens—to overlap with the FOV of the neighboring one by ~20% during scanning. Having an overlapping FOV between neighboring lenses ensures that blind areas between them are also imaged.
In order to quantify the optical performance of the scanner, we conducted two experiments: (a) we measured the uniformity in the optical resolution and contrast across the mini-lens array and (b) we measured the in-focus factor for each lens as they are not located in the same plane within the array. The in-focus factor represents the ability of each lens to focus the image to the CMOS sensor, when the mini-lens array is positioned at the plane that produces the best focused image. It has its maximum value at the best focused image plane. For quantifying the resolution and contrast, line pairs from the USAF 1951 resolution chart pattern (group 7) were imaged in 1× magnification. The contrast (C), obtained from greyscale images from each lens, was based on the Michelson formula [3]:
3. Results
3.1. Optical System Characterization
The mean, optical resolution in the array, obtained by imaging the USAF 1951 resolution chart pattern, was 2.88 μm with a standard deviation of 0.5 μm (Figure 3A). 21 mini-lenses were selected for this experiment (out of 42), as those lenses captured images that fitted entirely into the CMOS effective detection area. The 0.5 μm standard deviation of the resolution, attributed to imperfections during the microfabrication process of the silicon chip and the assembly process, did not affect the image quality of the array as all lenses produce adequately focused images. The in-focus factor for each lens was measured using a smear blood test (Figure 3B). The best focused image produced by the array was selected as the one that the average in-focus factor (averaged from all lenses) was minimum. At the best focused image, defocusing error within the array was less than 8% while the contrast was within 30% of its maximum value.
3.2. Cell Detection
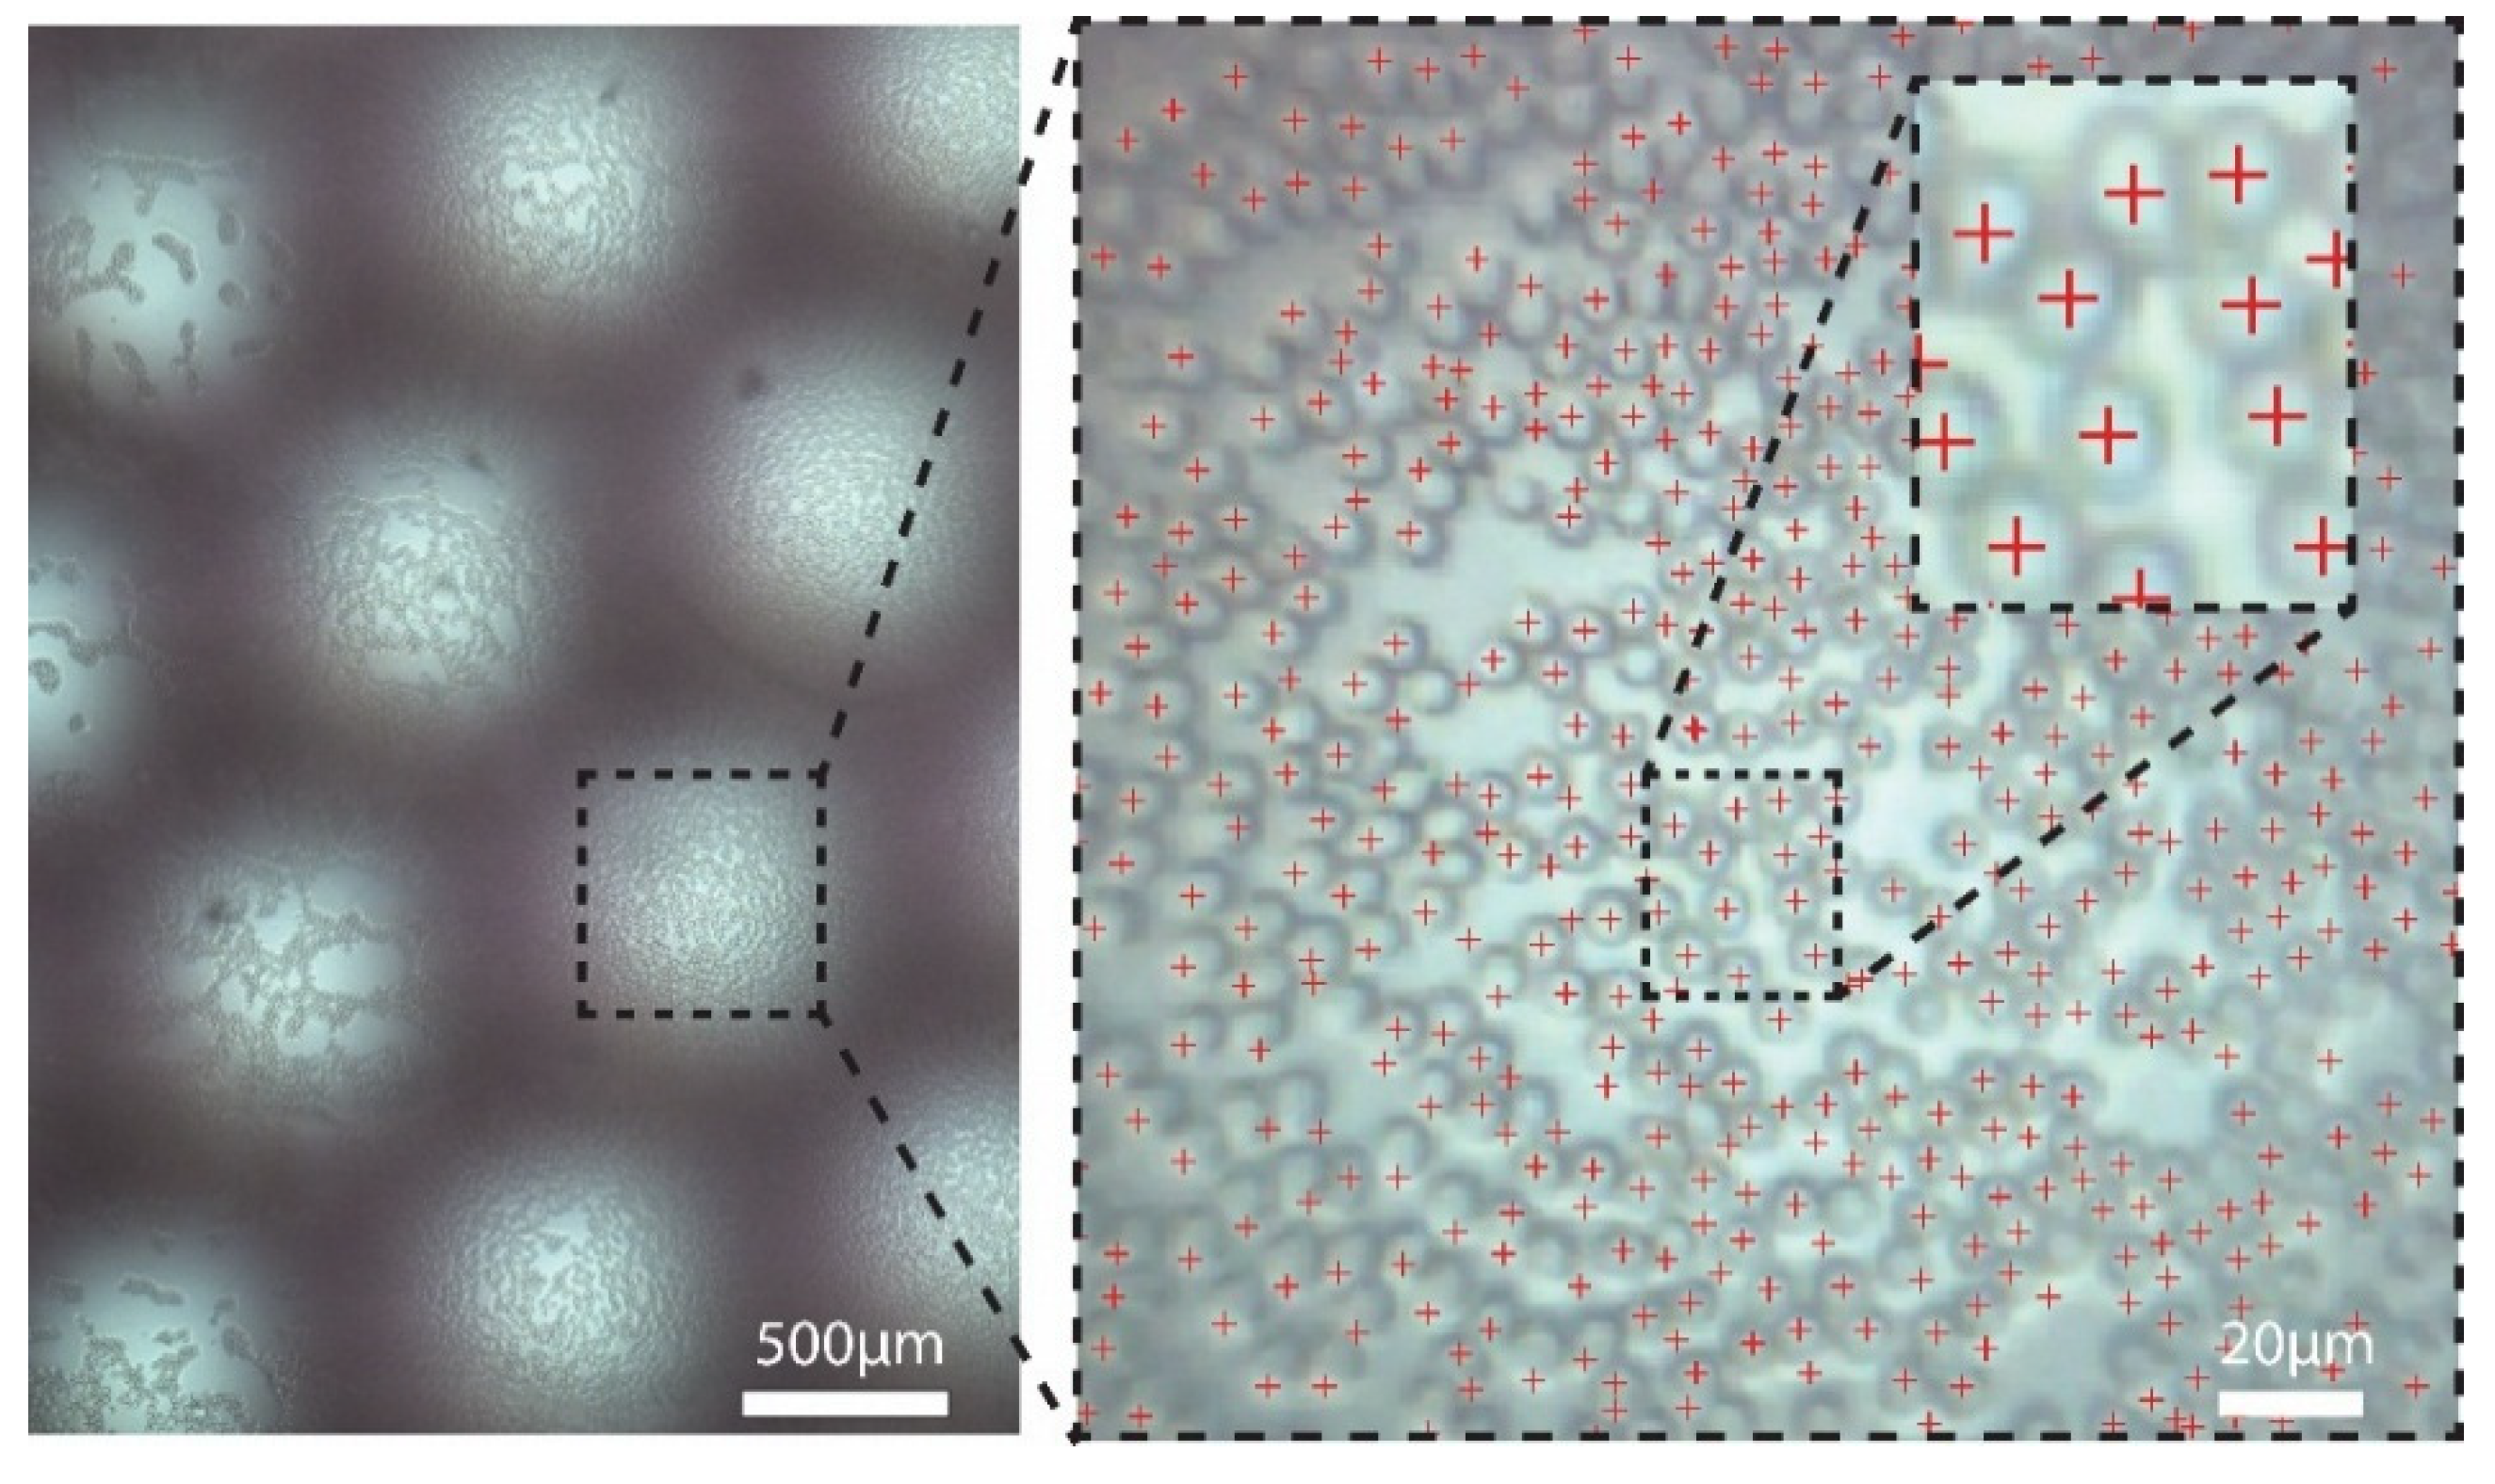
We performed single cell detection from a smear blood test (Figure 4) using an automated cell detection algorithm, specifically designed for bright field images [6]. Barrel distortion and vignetting effect corrections were performed prior to counting the cells. Dust particles—defined as particles with at least half the red blood cells size—were considered as background and were subtracted to provide enhanced contrast of the cell membranes with respect to the background. Hough transformation process was selected for image segmentation and for detecting single cells.
4. Discussion
We developed a portable, optical, scanning system that can image a large area (6 mm × 40 mm) with approximately 2.88 μm optical resolution in 1× magnification. The system operates in white light transmission mode and completes a full scan in a few minutes. We validated our system by performing single cell count from a smear blood test in an automated fashion. We envision our imaging system to be used for imaging biological specimens for the diagnosis and monitoring of a wide variety of diseases and conditions at the point-of-care.
Acknowledgments
We would like to thank Ning Gulari for useful discussions and for fabricating the silicon chip. Funding was provided by the ERC Starting Grant (project ID 693433) under the Horizon 2020 program.
Conflicts of Interest
The authors declare no conflict of interest. The founding sponsors had no role in the design of the study; in the collection, analyses, or interpretation of data; in the writing of the manuscript, and in the decision to publish the results.
References
- Boppart, S.A.; Kortum, R. Point-of-care and point-of-procedure optical imaging technologies for primary care and global health. Sci. Transl. Med. 2014, 6. [Google Scholar] [CrossRef]
- Gulari, M.N.; Tripathi, A.; Ghannad-Rezaie, M.; Chronis, N. An optofluidic Lens Array Microchip for High Resolution Stereo Micrscopy. Micromachines 2014, 5, 607–621. [Google Scholar] [CrossRef]
- Peli, E. Contrast in complex images. J. Opt. Soc. Am. 1990, 7, 2032–2040. [Google Scholar] [CrossRef] [PubMed]
- Santos, A.; Ortiz de Solorzano, C.; Vaquero, J.J.; Rena, J.M.; Malpica, N.; del Pozo, F. Evaluation of autofocus functions in molecular cytogenetic analysis. J. Microsc. 1997, 188, 264–272. [Google Scholar] [CrossRef] [PubMed]
- Sun, Y.; Duthaler, S.; Nelson, B.J. Autofocusing in Computer Microscopy: Selecting the Optimal Focus Algorithm. Microsc. Res. Tech. 2004, 65, 139–149. [Google Scholar] [CrossRef] [PubMed]
- Buggethin, F.; Marr, C.; Schwarzfischer, M.; Hoppe, P.S.; Hilsenbeck, O.; Schroeder, T.; Theis, F.J. An automatic method for robust and fast cell detection in bright field images from high-throughput microscopy. BMC Bioinform. 2013, 14. [Google Scholar] [CrossRef]
Figure 1.
(A) Schematic of the architecture of the integrated, portable scanning system and cross sectional view of the optical head; (B) photograph of the prototype and close-up view of the optical head.
Figure 1.
(A) Schematic of the architecture of the integrated, portable scanning system and cross sectional view of the optical head; (B) photograph of the prototype and close-up view of the optical head.

Figure 2.
(A) Top view schematic of the mini-lens array. The black, dotted outline indicates the effecting imaging area of the CMOS sensor, the green rectangular represents the silicon chip; (B) The tilt (17°) of the mini-lens array and the overlap between the FOV of neighboring lenses are crucial for covering the blind areas between the lenses; (C) Estimation of the FOV of a lens (~290 μm) based on a grid of lines imaged with the CMOS sensor in 1× magnification. The FOV is the diameter where the light intensity is 90% of its maximum value.
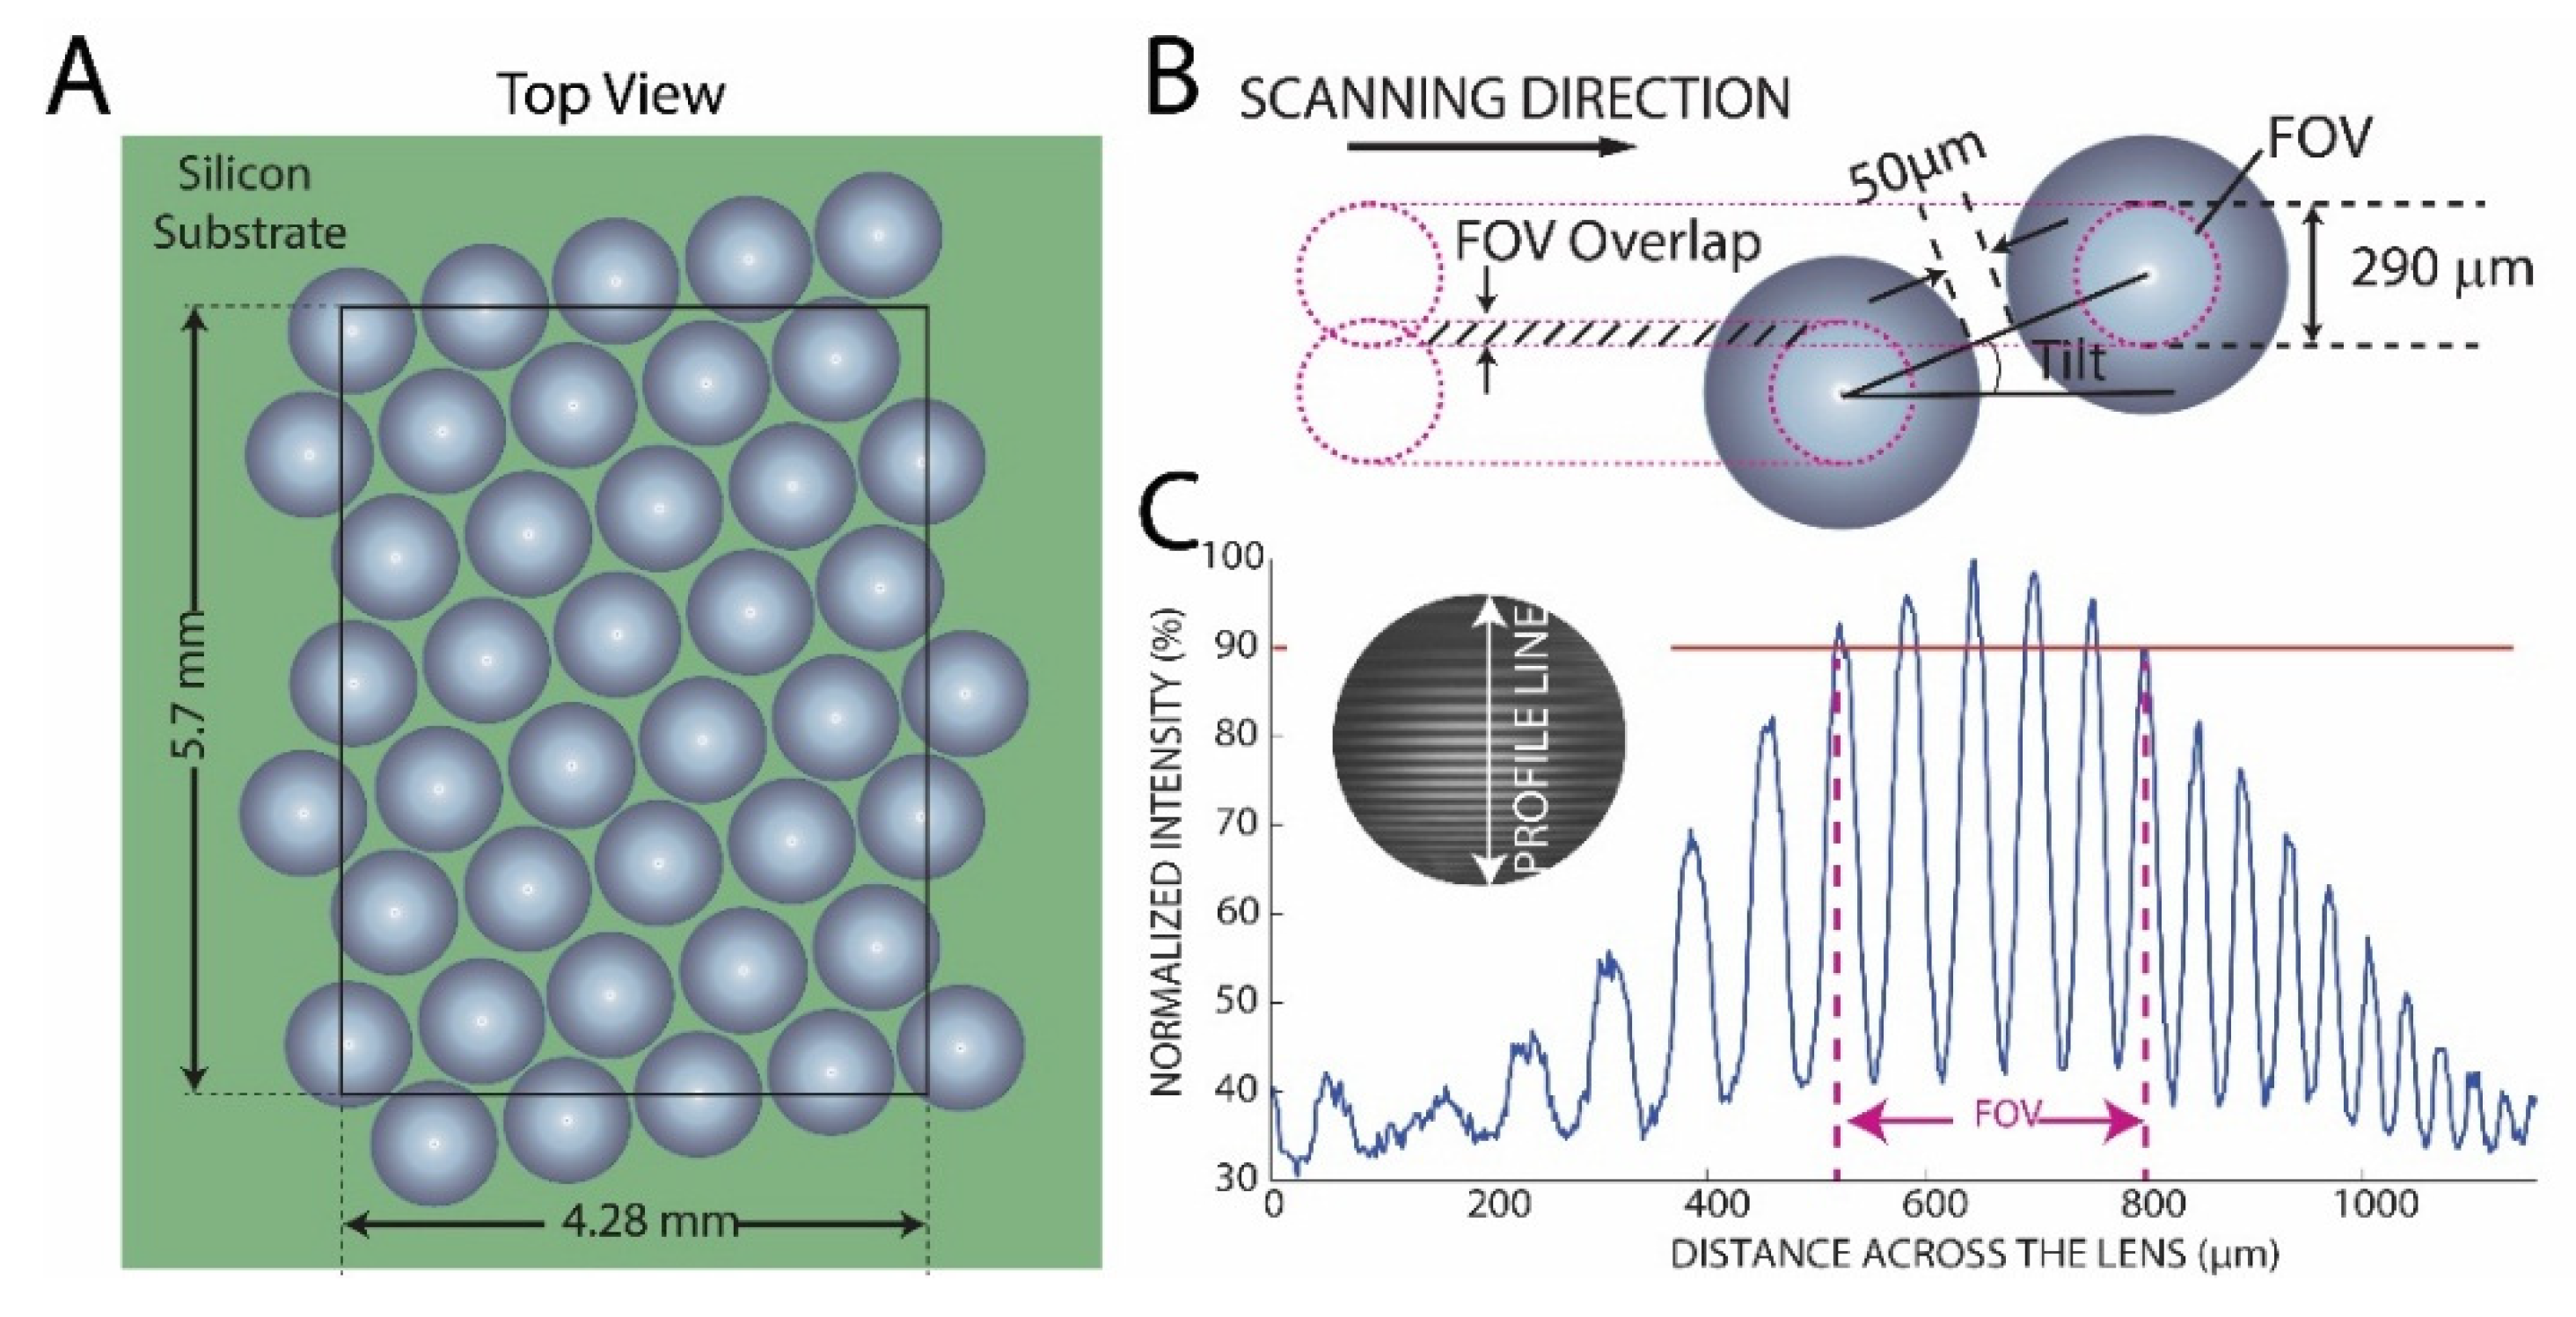
Figure 3.
(A) Contrast and resolution distribution within the mini-lens array using a 1951 USAF resolution chart mask; (B) Normalized in-focus factor for each lens within the array, as measured by images obtained from a blood smear test. 5 lenses were excluded from this experiment as they did not produce high quality images.
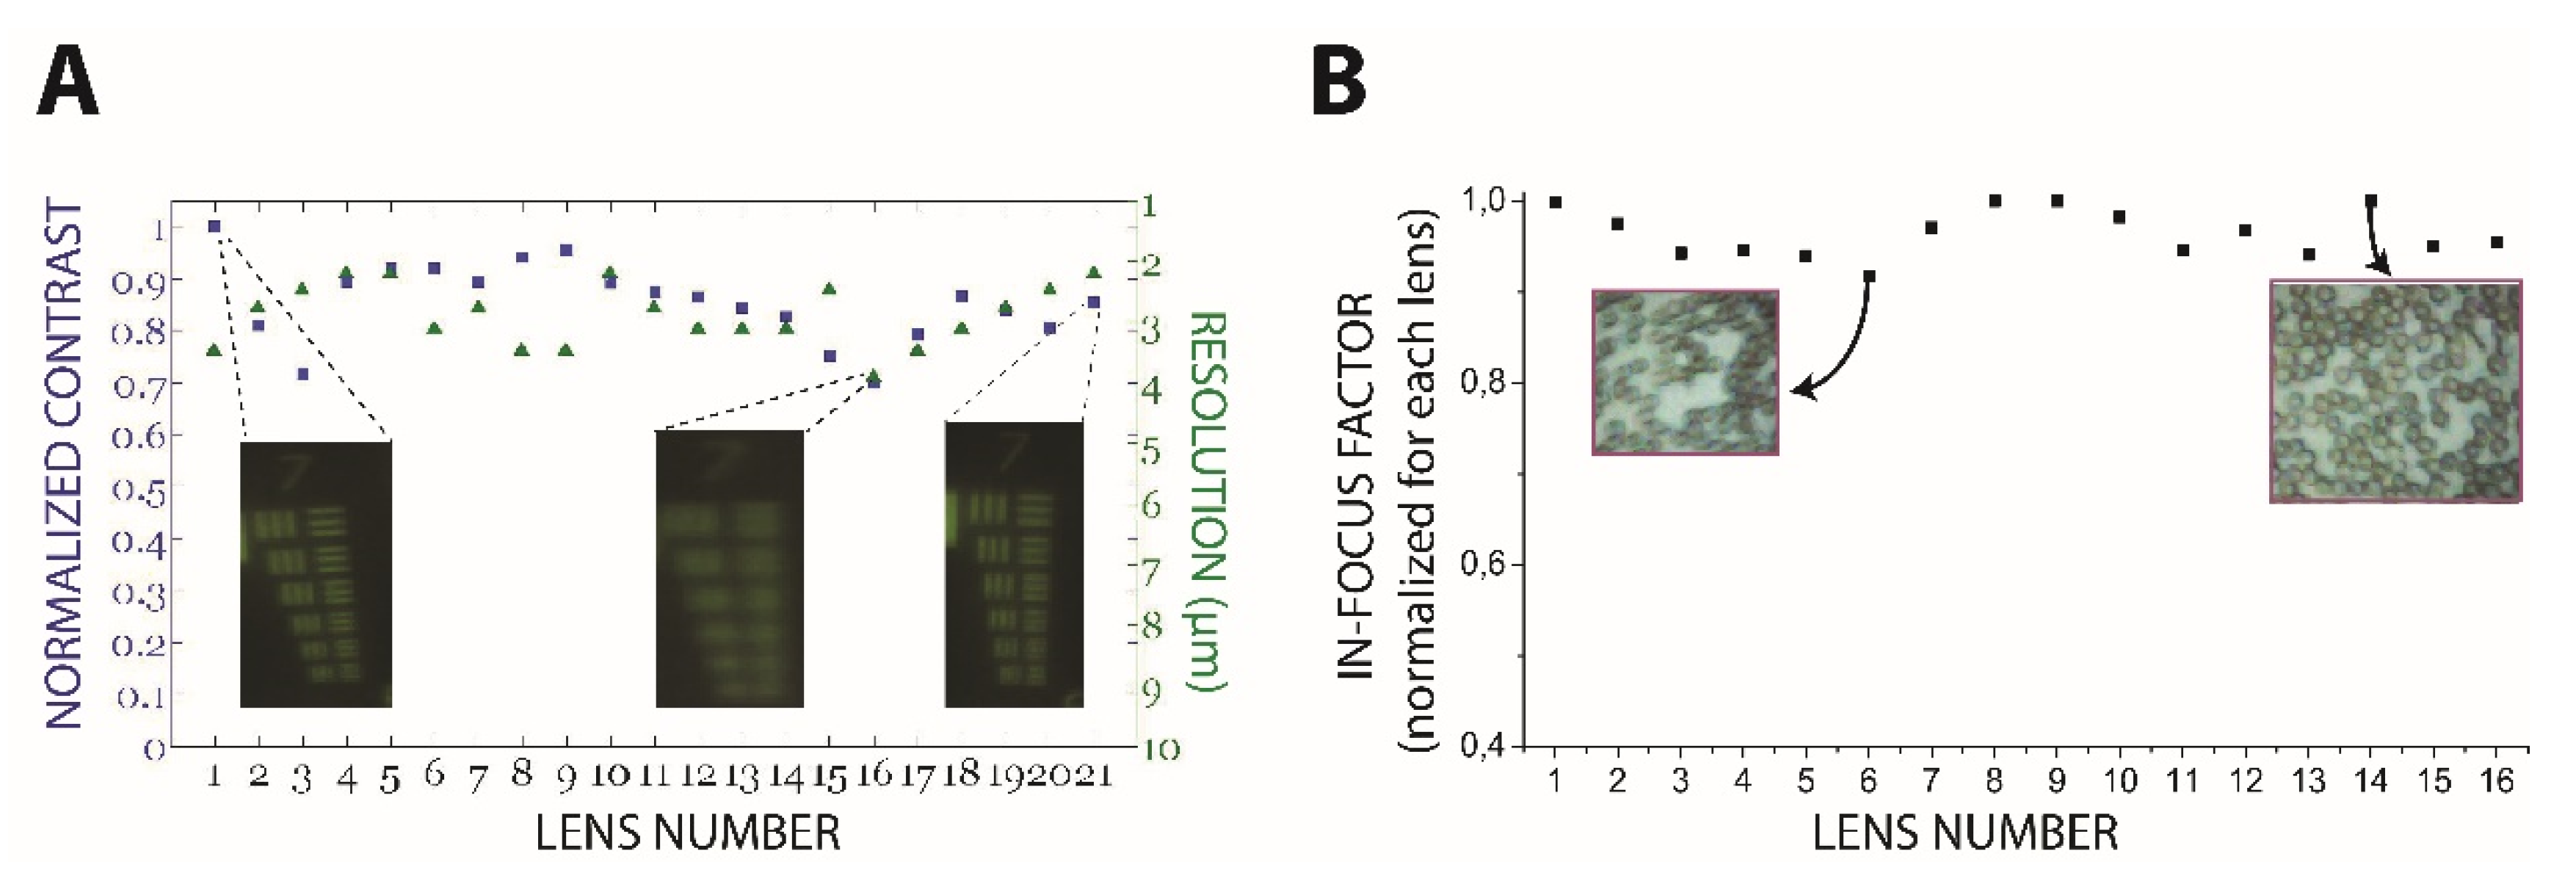
Figure 4.
Image of a whole blood smear test captured with our system Automated, single cell identification was made possible using a MATLAB algorithm of image enhancement and registration.
Figure 4.
Image of a whole blood smear test captured with our system Automated, single cell identification was made possible using a MATLAB algorithm of image enhancement and registration.

Publisher’s Note: MDPI stays neutral with regard to jurisdictional claims in published maps and institutional affiliations. |
© 2017 by the authors. Licensee MDPI, Basel, Switzerland. This article is an open access article distributed under the terms and conditions of the Creative Commons Attribution (CC BY) license (https://creativecommons.org/licenses/by/4.0/).
Share and Cite
MDPI and ACS Style
Korompili, G.; Kanakaris, G.; Ampatis, C.; Chronis, N. A Portable, Optical Scanning System for Large Field of View, High Resolution Imaging of Biological Specimens. Proceedings 2017, 1, 548. https://doi.org/10.3390/proceedings1040548
AMA Style
Korompili G, Kanakaris G, Ampatis C, Chronis N. A Portable, Optical Scanning System for Large Field of View, High Resolution Imaging of Biological Specimens. Proceedings. 2017; 1(4):548. https://doi.org/10.3390/proceedings1040548
Chicago/Turabian StyleKorompili, Georgia, Georgios Kanakaris, Christos Ampatis, and Nikos Chronis. 2017. "A Portable, Optical Scanning System for Large Field of View, High Resolution Imaging of Biological Specimens" Proceedings 1, no. 4: 548. https://doi.org/10.3390/proceedings1040548