Automatic Wireless Monitoring System for Real-Time Rock Fall Events †
by
 , , , , , and
Gianluca Barile
 ,
,
Giuseppe Ferri
 ,
,
Alfiero Leoni
,
Mirco Muttillo
,
Leonardo Pantoli
*,
Vincenzo Stornelli
and
Daniele Vettori
Dept. of Industrial and Information Engineering and Economics, Univ. of L’Aquila, L’Aquila, Italy
*
Author to whom correspondence should be addressed.
†
Presented at the Eurosensors 2017 Conference, Paris, France, 3–6 September 2017.
Proceedings 2017, 1(4), 569; https://doi.org/10.3390/proceedings1040569
Published: 11 August 2017
(This article belongs to the Proceedings of Proceedings of Eurosensors 2017, Paris, France, 3–6 September 2017)
Abstract
:In this work; we present an innovative sensing system able to recognize a rock fall event and to monitor the structural parameters of a falling rock protection barrier. The system has been conceived and optimized for any protection barrier; gabion mesh or concrete blocks; it has a modular and flexible architecture; organized with a control unit and sensing nodes that can be arranged directly on the considered site. This architecture provides information about the vibration and the inclination of the falling rock protection barrier. The data; continuously monitored; are collected on a web server responsible to check the overall status of the barrier itself and to generate and send automatic messages for any criticisms. A web application has been also developed for system monitoring; to create summary report and to analyze the data collected. The novel system is currently working on a gabion protecting mesh installed in the south of Italy.
1. Introduction
Geology and climate are the principal causes of rock fall events, together with factors such as rock mass integrity, discontinuities within the rock mass, weathering susceptibility, ground and surface water, freeze-thaw, root-wedging, and external stresses. Typically, rock fall events are mitigated by either passive or active strategies [1,2]. In particular, the passive mitigation approach acts only to the effects of the rock fall event and is generally employed in the deposition or run-out zones, such as through the use of drape nets, rock fall catchment fences, etc. Maintenance of the protection barriers is necessary in order to guarantee the efficiency of the passive mitigation. Falling rock protection barriers usually run for a long distance in hard-to-reach places and the monitoring of the structural integrity can be burdensome. This work has been conceived with the aim of recognize the rock fall event from low to high energy impact level and to identify the position where the events have occurred by using a remote monitoring system, furthermore to increase the human wellness and safety, through a continuous monitoring of the falling rock protection barrier status. The wireless sensor network we are presenting in this work consists of three ‘logically different’ blocks: the simple node which has the task to monitor the status of the structure where it is placed on and send messages about; the repeater which joins the tasks of the node, together with the capability to repeat messages from specified nodes; lastly, the data logger which has to receive data from nodes and repeaters, check whether it is corrupted or not and eventually upload it to a web server.
2. Proposed Network: Hardware
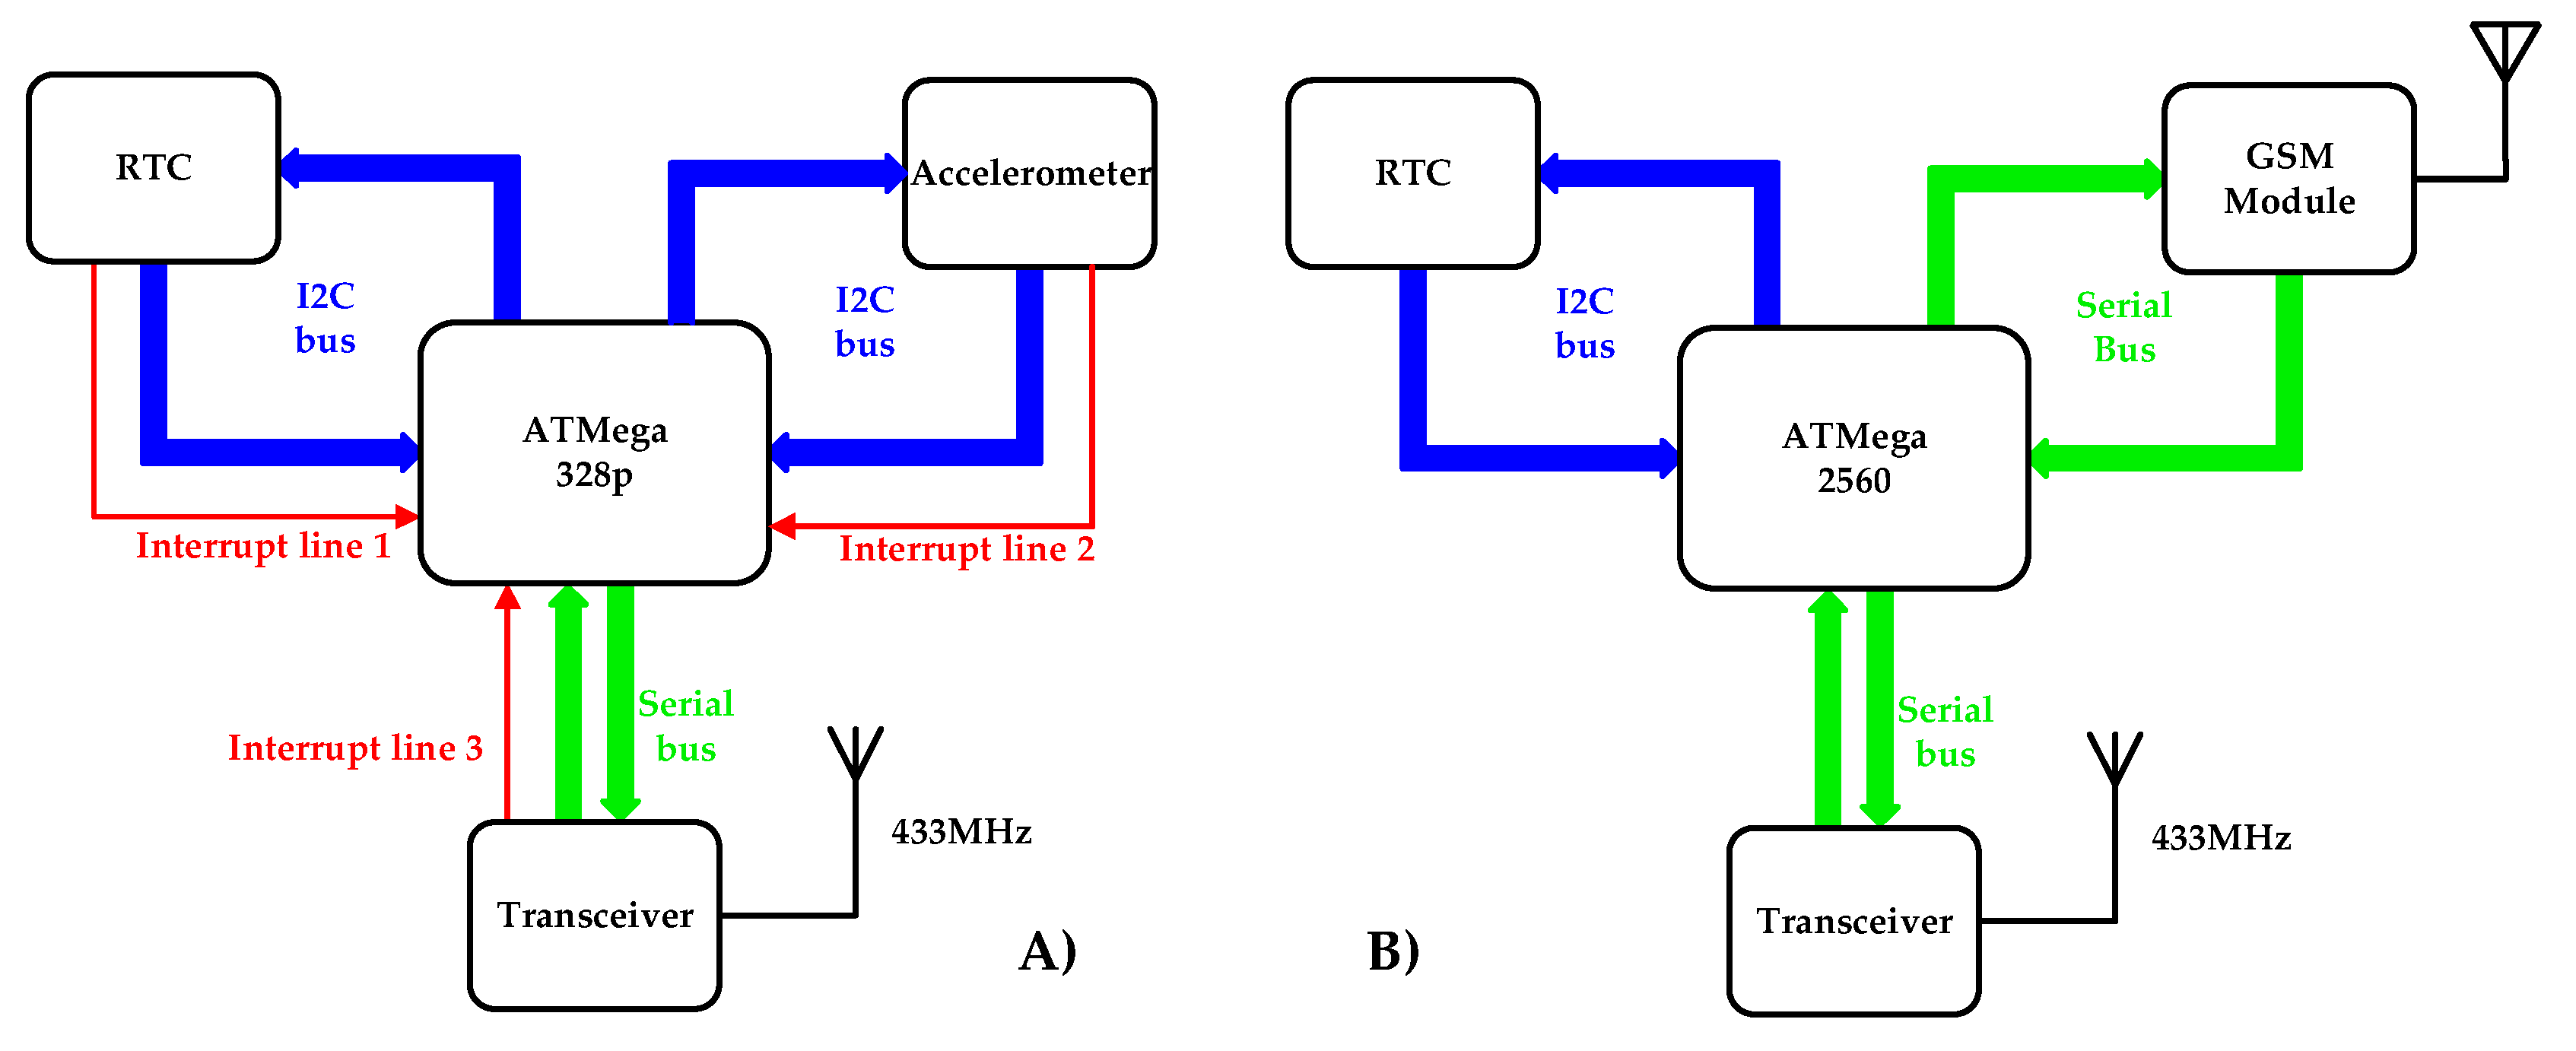
Besides their logical differentiation, the simple node and the repeater share the same hardware. The difference between them will be discussed in Section 3. Figure 1 shows a block diagram of both the node/and repeater (A) and the data logger (B).
Starting from the node we have employed an Atmel ATMega 328p as microcontroller. It is an 8-bit device working at 16 MHz. The communications with the RTC and the accelerometer are established through I2C bus, while data exchange with the transceiver is carried out via serial bus. The accelerometer is capable of measuring both dynamic and static accelerations along all the three axes. The first allows us to measure inclinations. It consists of a MEMS differential capacitive device suitably read by means of capacity to voltage conversion interface [3,4,5] whose output is sampled and made available to the output via I2C protocol. The transceiver hosts a dedicated microcontroller which manages the incoming data accumulation through an input buffer, and suitably transfers them to the main microcontroller. All the slave circuits (i.e., RTC, Accelerometer and Transceiver) are programmed so to send, as output, an asynchronous interrupt signal forcing the microcontroller to execute a specific ISR (Interrupt Service Routine) as shown in the next section. These interrupts are triggered when specific events occur: when specific hours are reached, when the acceleration experienced by the accelerometer exceeds a certain threshold or (for repeaters only) when an incoming message is received.
The data logger block diagram is similar to the node one, with the main difference being in the microcontroller choice: due to the lack of memory, the ATMega 328p is substituted by the ATMega 2560 which is still an 8-bit microcontroller working at 16 MHz, but its memory is 8 times greater than the 328p one. The increased amount of memory is needed to store incoming packages in a logical array before uploading them through the GSM module. No interrupt line is here needed since, differently from the nodes, the data logger does not implement any kind of sleep mode, so it can continuously sample the needed signals.
Each node/repeater is supplied by a 3.7 V battery suitably boosted to 5 V. The battery voltage level is continuously monitored and recharged by means of solar energy harvesting technique [6,7,8]. This, together with software optimization, allows each node to last up to 25 days of complete dark. The data logger power supply is directly taken from the power network.
3. Proposed Network: Firmware and Protocol
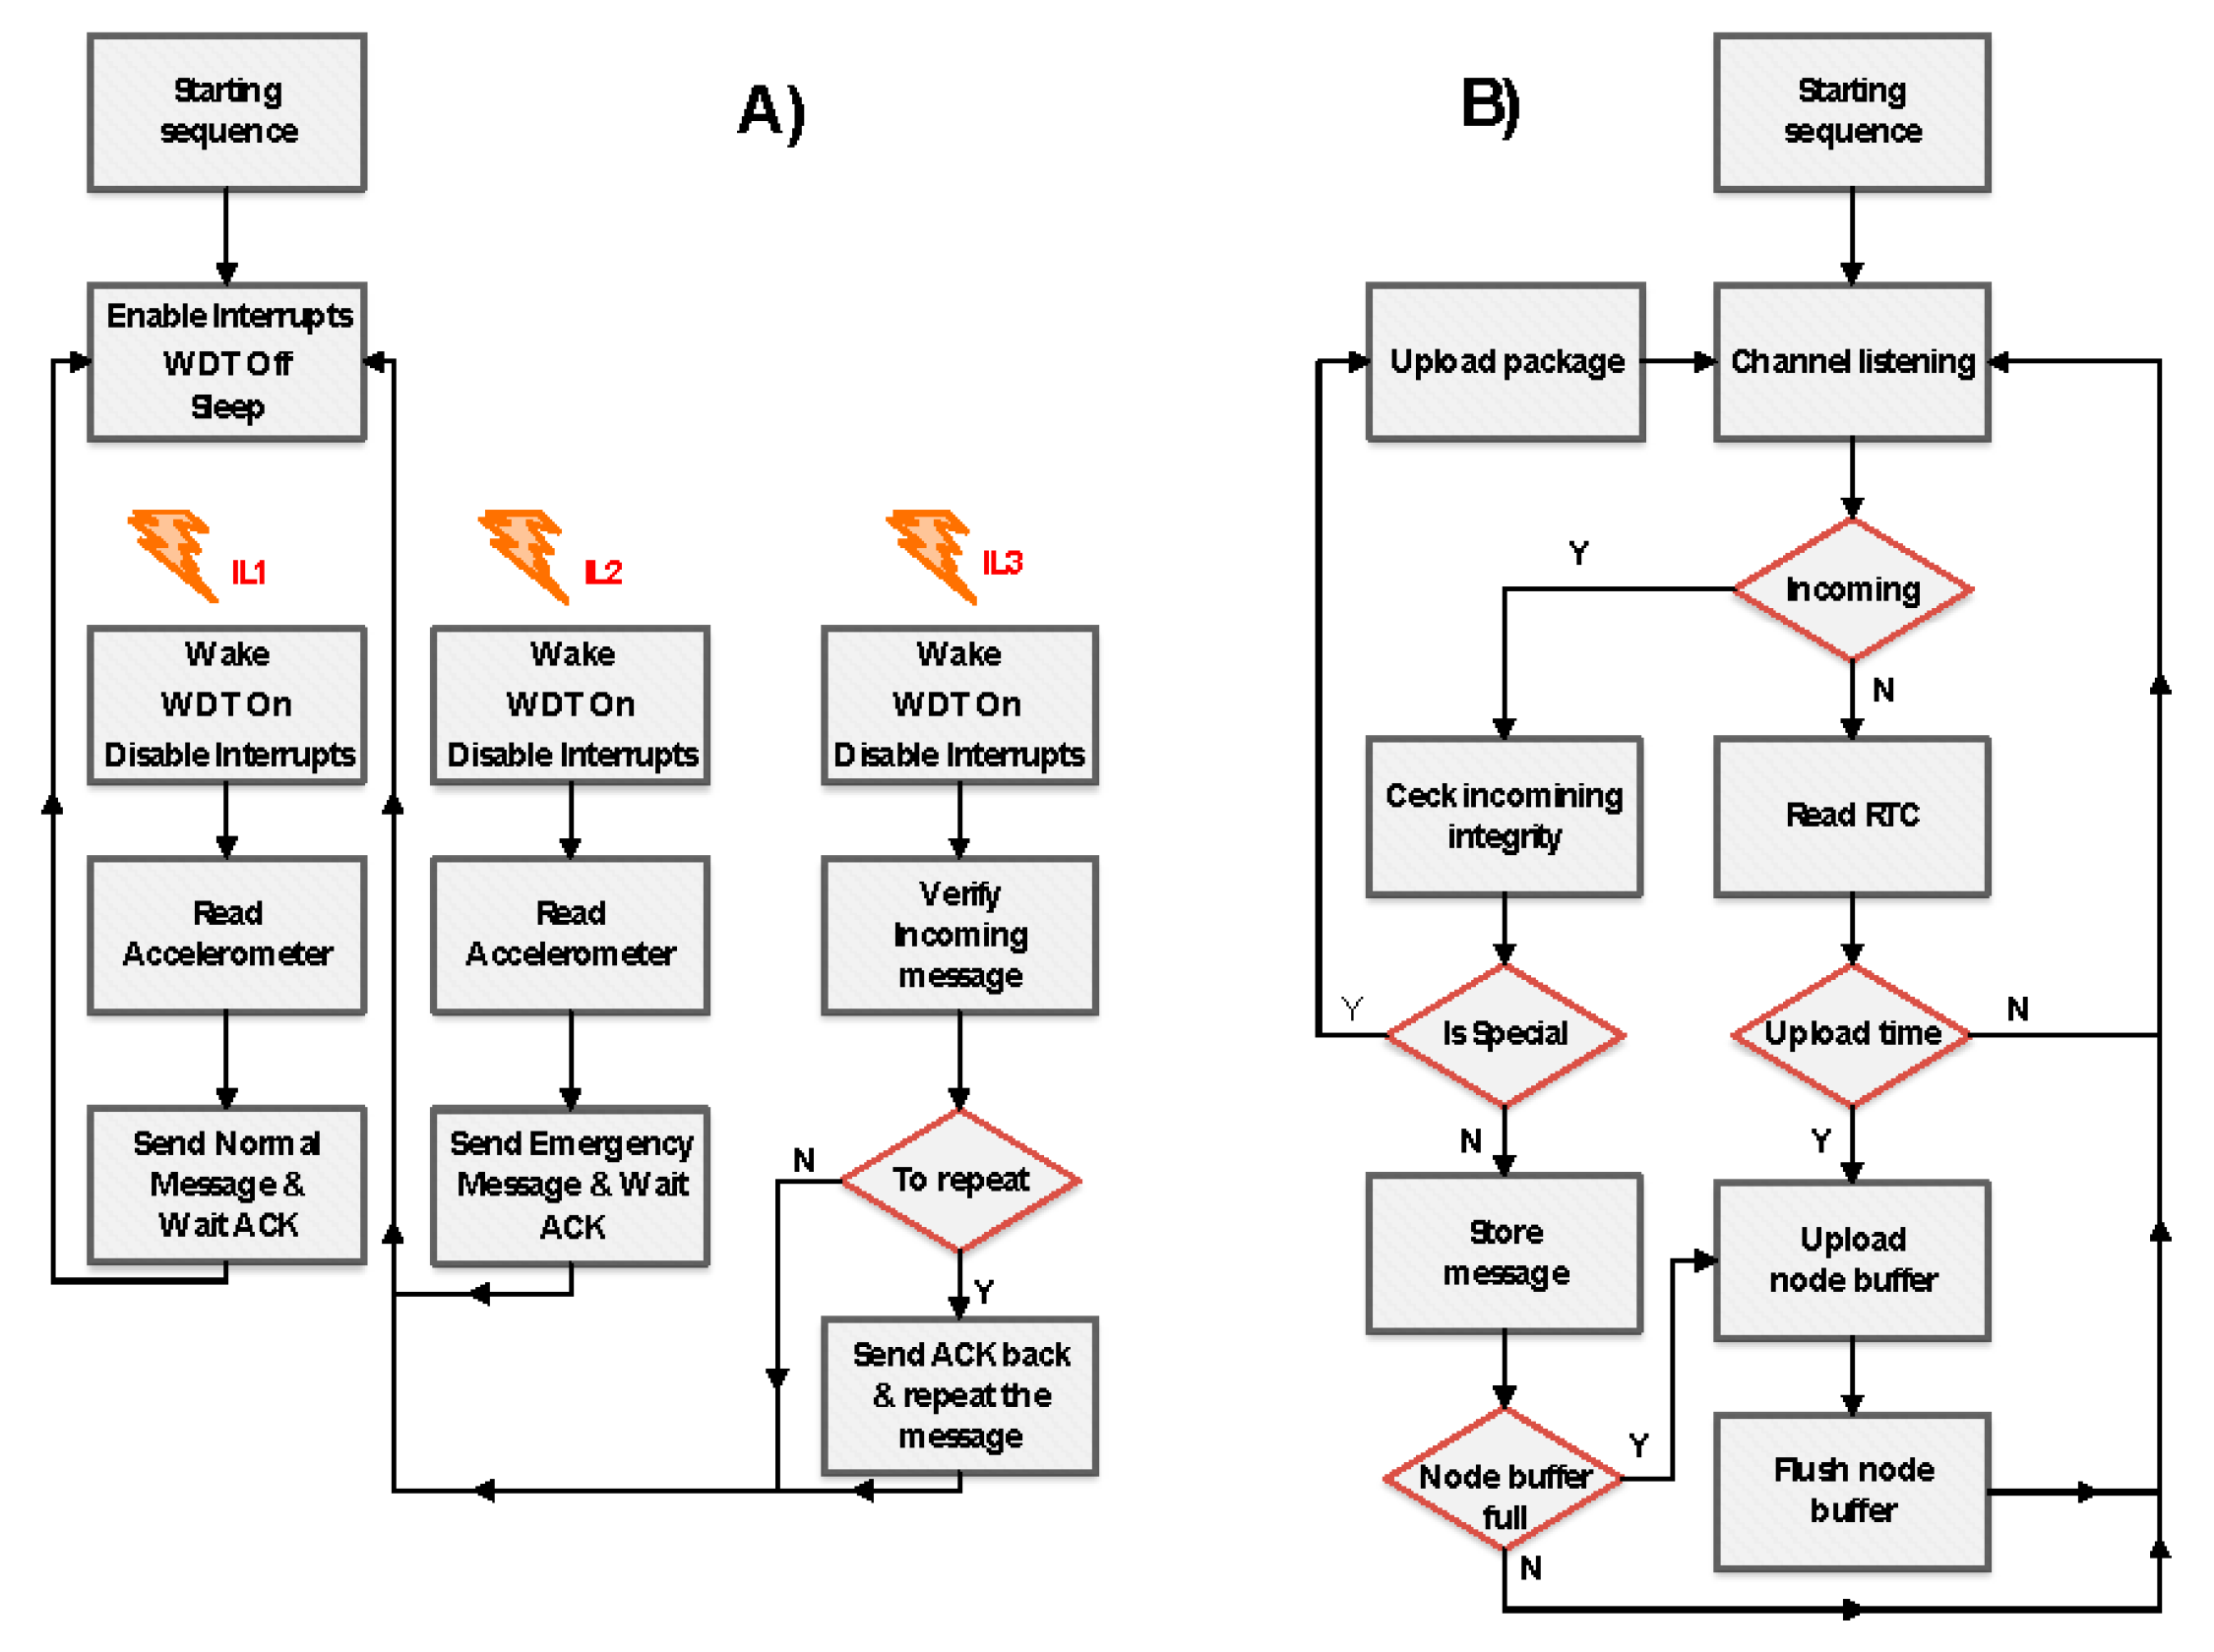
All the components of the network have been conceived as a finite state machine. Their behaviour is reported in the ASM diagrams of Figure 2A (for node/repeater) and Figure 2B (for data logger).
As shown in ASM diagram, nodes and repeaters have been programmed in order to enter deep sleep mode as soon as the starting sequence is completed so to lower power consumption as much as possible (down to less than 1 mA). Nodes can get out of the sleep mode asynchronously thanks to interrupt signals coming from the RTC, normal routine, or from accelerometer (i.e., when a rock fall event happened), emergency routine. With respect to repeaters only, the third interrupt line wakes them up when a transmission is caught so to eventually repeat it. The data logger, on the contrary, does not implement any kind of sleep mode. It continuously monitors the channel waiting for incoming data. These data are stored into a logical array which is then entirely uploaded to the web server at specific times. If the incoming package is tagged as ‘emergency package’, the data logger uploads it immediately without appending it into the buffer. Both for data logger and nodes a watch dog timer has been implemented so to reset the system if it suddenly stops responding.
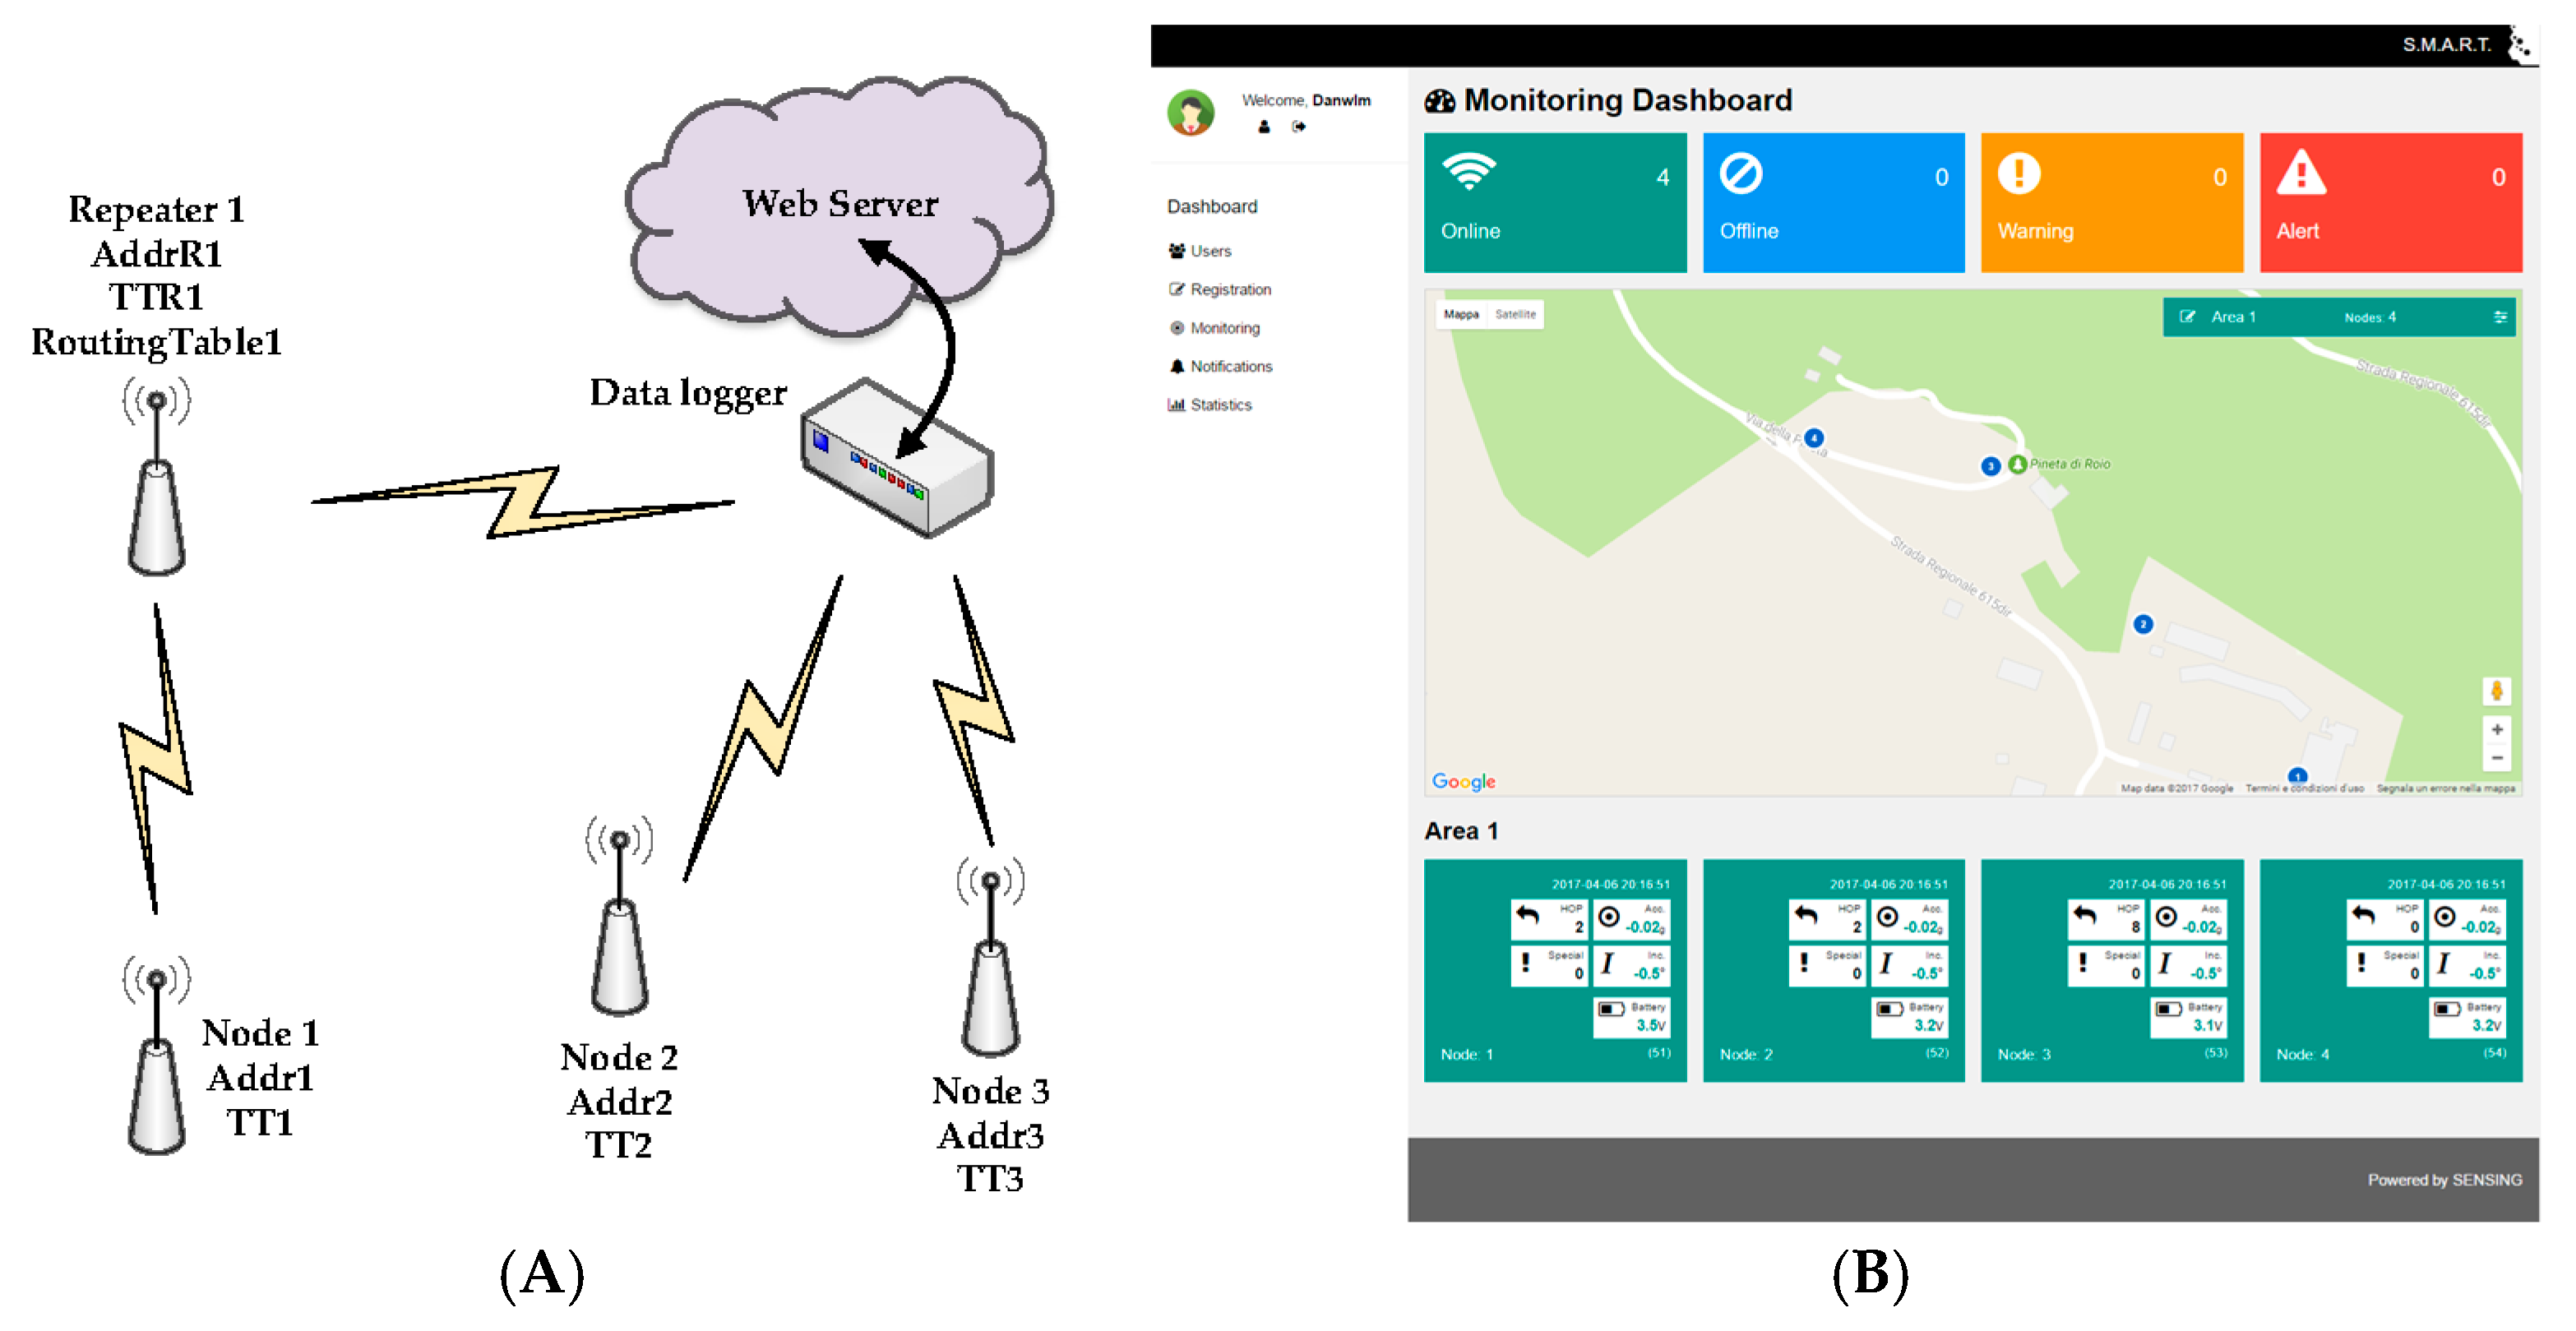
Figure 3A depicts a typical installation scenario. Each node is suitably addressed and can talk directly to the data logger or to a repeater which consults a routing table to check whether to repeat the message or discard it. To avoid message collisions over the channel, each node is provided with a time table (TT) so to adjust posting time. The communication protocol has been designed on purpose (so it is proprietary) to avoid data sniffing or channel jamming. The web application (Figure 3B) that manages all the uploaded data has been entirely programmed so to be compatible with all the most common platforms.
4. Conclusions
We presented a novel fully autonomous wireless sensors network. The possibility swap between different sensor types or even add more than one kind of sensor to each node, make the presented WSN suitable not only to monitor rock fall events, but also any other application where real time supervision is required. The reliability and the versatility of the system, both from hardware and software point of view allows it to be used in very difficult environments.
Conflicts of Interest
The authors declare no conflict of interest.
References
- Chehri, A.; Fortier, P.P.; Tardif, M. Security monitoring using wireless sensor networks. In Proceedings of the 5th Annual Conference on Communication Networks and Services Research (CNSR 2007), Fredericton, NB, Canada; 2007; pp. 13–17. [Google Scholar]
- Alippi, C.; Camplani, R.; Galperti, C.; Marullo, A.; Roveri, M. An hybrid wireless-wired monitoring system for real-time rock collapse forecasting. In Proceedings of the 7th International Conference on Mobile Ad Hoc and Sensor System (MASS), San Francisco, CA, USA, 8–12 November 2010; pp. 224–231. [Google Scholar]
- Ferri, G.; Parente, F.R.; Stornelli, V.; Barile, G.; Pantoli, L. Automatic bridge-based interface for differential capacitive full sensing. Procedia Eng. 2016, 168, 1585–1588. [Google Scholar] [CrossRef]
- Ferri, G.; Parente, F.R.; Stornelli, V.; Barile, G. Full range analog Wheatstone bridge-based automatic circuit for differential capacitance sensor evaluation. Int. J. Circuit Theory Appl. 2016. [Google Scholar] [CrossRef]
- Barile, G.; Ferri, G.; Parente, F.R.; Stornelli, V.; Depari, A.; Flammini, A.; Sisinni, E. A standard CMOS bridge based analog interface for differential capacitive sensors. In Proceedings of the IEEE 13th Prime Conference, Taormina, Italy, 12–15 June 2017; pp. 281–284. [Google Scholar]
- Pantoli, L.; Leoni, A.; Stornelli, V.; Ferri, G. An IC architecture for RF Energy Harvesting systems. J. Commun. Softw. Syst. 2017, 13, 96–100. [Google Scholar] [CrossRef]
- Di Marco, P.; Stornelli, V.; Ferri, G.; Pantoli, L.; Leoni, A. Dual band harvester architecture for autonomous remote sensors. Sens. Actuators A Phys. 2016, 247, 598–603. [Google Scholar] [CrossRef]
- Pantoli, L.; Leoni, A.; Stornelli, V.; Ferri, G. Energy Harvester for Remote Sensors Systems. In Proceedings of the IEEE International Multidisciplinary Conference on Computer and Energy Science (SpliTech), Split, Croatia, 13–15 July 2016; Volume 1. [Google Scholar]
Figure 1.
Node/repeater (A) and data logger (B) block diagram.

Figure 2.
Node/Repeater (A) and data logger (B) ASM diagram.

Figure 3.
(A) Installation scenario; (B) graphical web interfaces: monitoring control panel.

Publisher’s Note: MDPI stays neutral with regard to jurisdictional claims in published maps and institutional affiliations. |
© 2017 by the authors. Licensee MDPI, Basel, Switzerland. This article is an open access article distributed under the terms and conditions of the Creative Commons Attribution (CC BY) license (https://creativecommons.org/licenses/by/4.0/).
Share and Cite
MDPI and ACS Style
Barile, G.; Ferri, G.; Leoni, A.; Muttillo, M.; Pantoli, L.; Stornelli, V.; Vettori, D. Automatic Wireless Monitoring System for Real-Time Rock Fall Events. Proceedings 2017, 1, 569. https://doi.org/10.3390/proceedings1040569
AMA Style
Barile G, Ferri G, Leoni A, Muttillo M, Pantoli L, Stornelli V, Vettori D. Automatic Wireless Monitoring System for Real-Time Rock Fall Events. Proceedings. 2017; 1(4):569. https://doi.org/10.3390/proceedings1040569
Chicago/Turabian StyleBarile, Gianluca, Giuseppe Ferri, Alfiero Leoni, Mirco Muttillo, Leonardo Pantoli, Vincenzo Stornelli, and Daniele Vettori. 2017. "Automatic Wireless Monitoring System for Real-Time Rock Fall Events" Proceedings 1, no. 4: 569. https://doi.org/10.3390/proceedings1040569