Proceeding Paper

SO2 and Aerosol Evolution over the Very Clear Atmosphere at the Argentina Andes Range Sites of San Antonio de Los Cobres and El Leoncito †

by
Lara S. Della Ceca
1,
María I. Micheletti
1,2,
Martín M. Freire
1,
Beatriz García
3 and
Rubén D. Piacentini
1,4,*
1
Grupo Física de la Atmósfera, Radiación Solar y Astropartículas, Instituto de Física Rosario, CONICET—Universidad Nacional de Rosario, Rosario 2000, Argentina
2
Facultad de Ciencias Bioquímicas y Farmacéuticas, Universidad Nacional de Rosario, Rosario 2000, Argentina
3
ITeDAM (CNEA-CONICET-UNSAM), UTN Facultad Mendoza, Lab. Pierre Auger, Mendoza 5500, Argentina
4
Laboratorio de Eficiencia Energética, Sustentabilidad y Cambio Climático, IMAE, FCEIA, Universidad Nacional de Rosario, Rosario 2000, Argentina
*
Author to whom correspondence should be addressed.
Presented at the 2nd International Electronic Conference on Atmospheric Sciences, 16–31 July 2017; Available online: http://sciforum.net/conference/ecas2017.
Proceedings 2017, 1(5), 197; https://doi.org/10.3390/ecas2017-04153
Published: 17 July 2017

Abstract

:
The atmosphere at North-Central Argentina Andes range is exceptionally clear for the placement of astrophysical/astronomical/solar observatories (Piacentini et al., Advances Space Research, 2016). However, this region is part of the Pacific fire belt, due to the large number of active volcanoes. Consequently, the possibility of having strong sporadic emissions of different gases and aerosols needs to be investigated. In the present work, we analyze in particular the SO2 trace gas, since it can affect significantly the solar UVB (280–320 nm) radiation. Also, particulate matter can attenuate this radiation in the UV-visible ranges. One of the most significant contributions to volcanic eruptions that could arrive at the selected San Antonio de los Cobres (SAC) location is the near Lascar volcano. We used satellite images form the OMI/KMNI/Aura/NASA satellite instrument, for deriving the intensity of the eruption at the SAC geographical point. An important eruption was that of the Puyehue/ Cordón Caulle volcanic complex at Chile Patagonia, in June 2011. No significant influence on the other selected El Leoncito (LEO) location was registered. We present aerosol optical depth (AOD550) satellite data obtained with the Deep Blue Level 2 data provided by the SeaWiFS/SeaStar/NASA satellite instrument for SAC and LEO places, showing that AOD550 for the whole period is extremely low (0.0262 for SAC and 0.0266 for LEO). We also present ground atmospheric aerosol concentration measurements as a function of aerosol diameter with a high quality GRIMM laser instrument for some days of campaign performed in those sites.

1. Introduction

In the last decades, an important number of large projects for astronomy/astrophysics/solar observatories, have required isolated high altitude sites. These sites ensure skies free of light pollution, and a low aerosol content for observations in very high energy (GeV, TeV and even more) range. Examples of big astrophysics facilities are the Pierre Auger Observatory, for the detection and study of Ultra High Energy Cosmic Rays [1] and the Cherenkov Telescope.
Array (CTA), for the research in high energy Gamma Rays energies [2]. Adding the advantage of having a low humidity atmospheric content, observations in microwaves and radiofrequency ranges can be done, such as the Large Latin American Millimeter Array-LLAMA [3] and the Q & U-Bolometric Interferometer for Cosmology (QUBIC) [4] projects. In all these cases, the studies are performed according to the different needs, ensuring well-relieved sites that can be used or offered by the countries as host sites. The mega-astrophysics projects require the joint effort of several countries that contribute to them, involving economic and human resources to reduce risks and ensuring the possibility of installation of other new projects in the characterized area, which can take advantage of existing infrastructure. The emplacement of these facilities contributes to the development of science but also constitutes a benefit for the region by generating jobs and by establishing a synergic relationship with the local community.
The atmosphere at the North and Central Argentinean Andes range is exceptionally clear and very adaptable for the placement of astrophysical/astronomical/solar observatories, as was shown by Piacentini et al. [5], since the atmospheric components (gases and aerosols) are present in a very small proportion, with respect to many other places in the world where this type of observatories are placed. However, this region is part of the Pacific fire belt, composed of a large number of volcanoes, some of them very active. Consequently, the possibility of emissions of different gases and of particulate matter (or aerosol) that could contaminate the selected places has to be considered.
In the present work, we analyze in particular the sulfate dioxide (SO2) trace gas, since it can affect significantly the solar UVB (280–320 nm) radiation, due to its large quantum efficiency for the solar photon attenuation in this spectral range. Also, the particulate matter (coming from this and other sources, like biomass burning, traffic, intensive agriculture, etc.) attenuates this radiation in the UV and Visible ranges, as can be seen in photo-images of strong eruptions. Both atmospheric components are good indicators of volcanic activity, since the corresponding aerosol cloud can be detected if it goes in the direction of the analyzed site (see for example references [6,7,8,9,10,11,12]).
Other implications of SO2 and sulfate aerosol propagations for the air quality as well as for possible environmental and economical consequences have been described in the works of Yeh et al. [13] and Wang et al. [14].

2. Measurements and Methods

2.1. Measurements

In the past, the source of atmospheric SO2 was mainly the volcanic eruptions, but with the increase in human activities, the contribution of artificial sources of SO2 concentration started to increase significantly, being at present about 3/4 of the total (Max Plank Institute for Chemistry, Satellite Group, Mainz, Germany: http://joseba.mpch-mainz.mpg.de/so2t2.htm). The main sources are: fossil fuel consumptions, smelting of metal sulfide ores, coal burning and oxidation of soil organic material. Volcanoes also eject particulate matter which can arrive at the tropopause or even the lower stratosphere if the eruption has enough energy, as was the case for Pinatubo eruption in June 1991 [15].
We analyzed with satellite and ground instruments the air quality at two Argentina Andes range sites, in order to determine the possible arrival of gas (SO2) and aerosol clouds produced by volcanic eruptions. Concerning the selected places, they are the following:
  • San Antonio de los Cobres (24°02′42.7″ S, 66°14′05.8″ W, 3607 meters above sea level—m asl), Province of Salta, that we will call SAC. It is placed in the highest altitude desert of the world, called Puna of Atacama in the North region of Argentina East Andes range.
  • Complejo Astronómico El Leoncito (CASLEO) (31°04′48″ S, 69°16′12″ W, 2672 m asl), Province of San Juan, that we will call LEO. It is located in a flat region called Pampa El Leoncito, between high mountains of the Central region of Argentina East Andes range.
One of the most significant volcanic eruptions that could arrive at the SAC location is that produced by the near Lascar volcano (23°22′ S, 67°43′ W, 5592 m asl) and eventually transported to the SAC site by winds flowing from North-East to South-West. One of its latest strong eruptions occurred during the period from 18 to 26 April 1993. Other more recent minor eruptions were initiated the days: 20 July 2000, 26 October 2002, 4 May 2005, 18 April 2006, 2 April 2013 and 30 October 2015. Concerning the LEO site, one important eruption was that of the Puyehue/Cordón Caulle volcanic complex (40°35′ S, 72°07′ W, 2240 m asl), on June 2011, that propagates to the Nord-East of Argentina, arriving as far as Rosario and Buenos Aires cities in the Central-East of Argentina.
In order to follows the space-time evolution of these and other possible eruptions, that could arrive at SAC and LEO sites, we analyzed the aerosol optical depth data (AOD550) taken by the SeaWiFS instrument on board of SeaStar NASA satellite and the aerosol index (AI) by TOMS and OMI instruments, on board of different NASA satellites. We also analyzed aerosol optical depth at 500 nm data (AOD500), measured by the Cimel sunphotometer of the NASA Aerosol Network (AERONET). As a reference for normal days and as a test of the air quality concerning particulate matter, we used a GRIMM aerosol spectrometer for the ground determination of the aerosol concentration in both sites, in the campaign periods from 28 December 2012 to 4 January 2013 for LEO site and from 6 to 10 May 2013, for SAC site. We like to point out the extreme difficulty in doing this last ground measurement campaign, due to difficulty in the access and supervision of the instrument placed in high altitude desertic SAC place. In LEO, the presence of the El Leoncito Astronomical Complex facilitates the installation of the GRIMM instrument and the corresponding data acquisition.

2.2. Method

The satellite data corresponding to the different atmospheric variables introduced in Section 2.1 (AOD500, AOD550 and AI) being physical quantities, can be positive or zero. Consequently, they are distributed around their mean values following a Poisson type statistical distribution (see for example: www.statisticshowto.com/what-is-standard-deviation/), but not a Gaussian (normal) one, since the last one represents a series of values that, in theory could extend even up to minus infinity (in practice, large negative values). Since we are interested in the detection of few but important events (large gas and aerosol clouds produced by volcanic eruptions and arriving at the selected sites), we introduce the following significant events criteria:
Vlimit,L,X = V*L,X + 2.σP
where Vlimit,L,X is the lower limiting value of all the registered ones, that are equal or higher than the mean value V*L,X for a given instrument L and location X, plus two standard deviations of the Poisson distribution (σP). The Poisson distribution at a value as given by Formula (1), has only several percents of the measured values higher that the imposed limit. So, it is possible to determine in this way the annual frequency of events (mean number of events per year), that we call N*L,X, counting only the variable values equal or larger than Vlimit,L,X, as given by Formula (1).

3. Results

We present results in the following sections: satellite measurements of the SO2 cloud evolution (Section 3.1) and ground and satellite measurements of the particulate matter cloud propagation over the selected SAC and LEO sites (Section 3.2).

3.1. Satellite Measurements of the SO2 Cloud Evolution

One important indicator of volcanic eruptions is the emission of SO2 clouds that normally goes up to about several kilometers high and propagates, driven by wind speed and direction at these altitudes. We will analyze this gas emission, from the SO2 total column data obtained by the OMI instrument on board of Aura NASA satellite, during the 2005–2009 period.
In Figure 1 (top), we present results of the time evolution of this variable at SAC and LEO locations, measured with the OMI instrument on Aura/NASA satellite. A detailed description of this instrument is given in the corresponding web page: https://aura.gsfc.nasa.gov/. For the SAC site, the mean and Poisson standard deviation values are: SO2*OMI,SAC = 1.61 DU (σP = 1.27 DU). So, the limiting value is SO2limit,OMI,SAC = 4.15 DU and the mean number of events in the 5 year period of 2005 to 2009 was N*SO2,SAC = 3.4 events/year. We can see in the same Figure (at bottom), that a similar behavior exists for LEO site, with SO2*OMI,LEO = 1.60 DU (σP = 1.26 DU). In this case, SO2limit,OMI,LEO = 4.12 DU and N*SO2,LEO = 3.6 events/year.
We can see in Figure 1.top that the two large eruptive events produced by the Lascar volcano in 2005 and 2006 did not produced an appreciable effect in the geographical position of the SAC site and that no volcanic clouds arrived in the considered period to the LEO site.

3.2. Ground and Satellite Measurements of Particulate Matter Cloud Propagation

In what follows, we will present results corresponding to particulate matter (aerosol) propagation up to the selected sites of SAC and LEO.

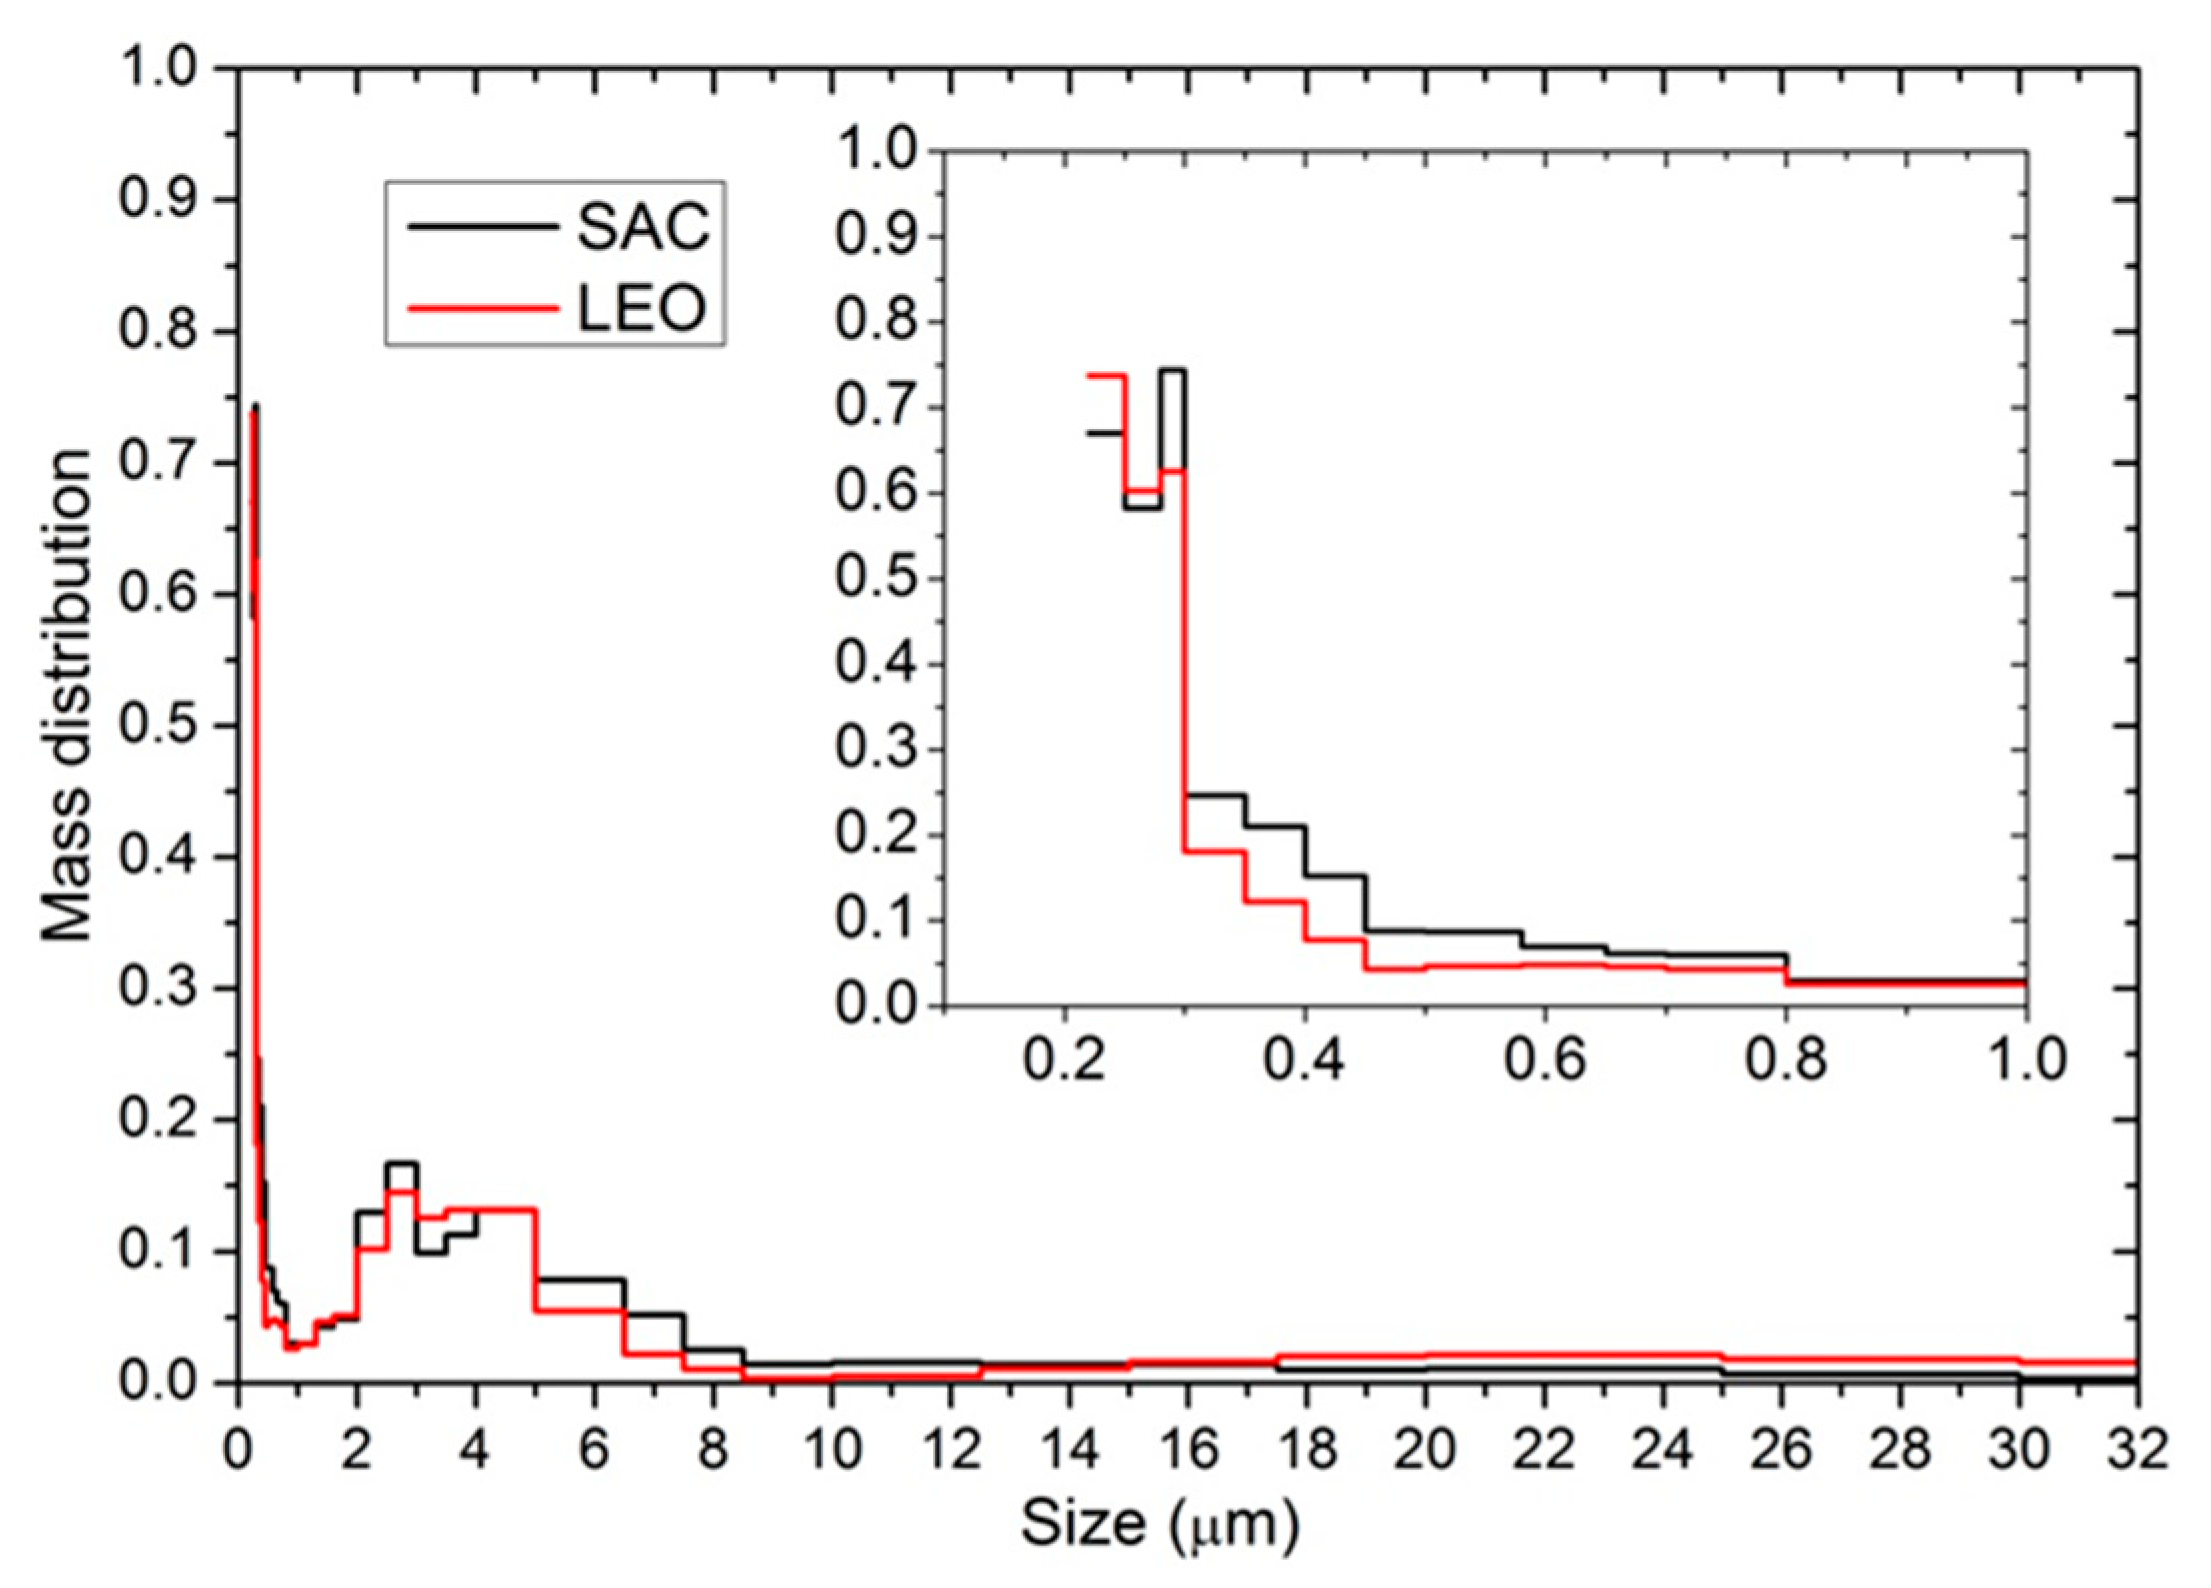
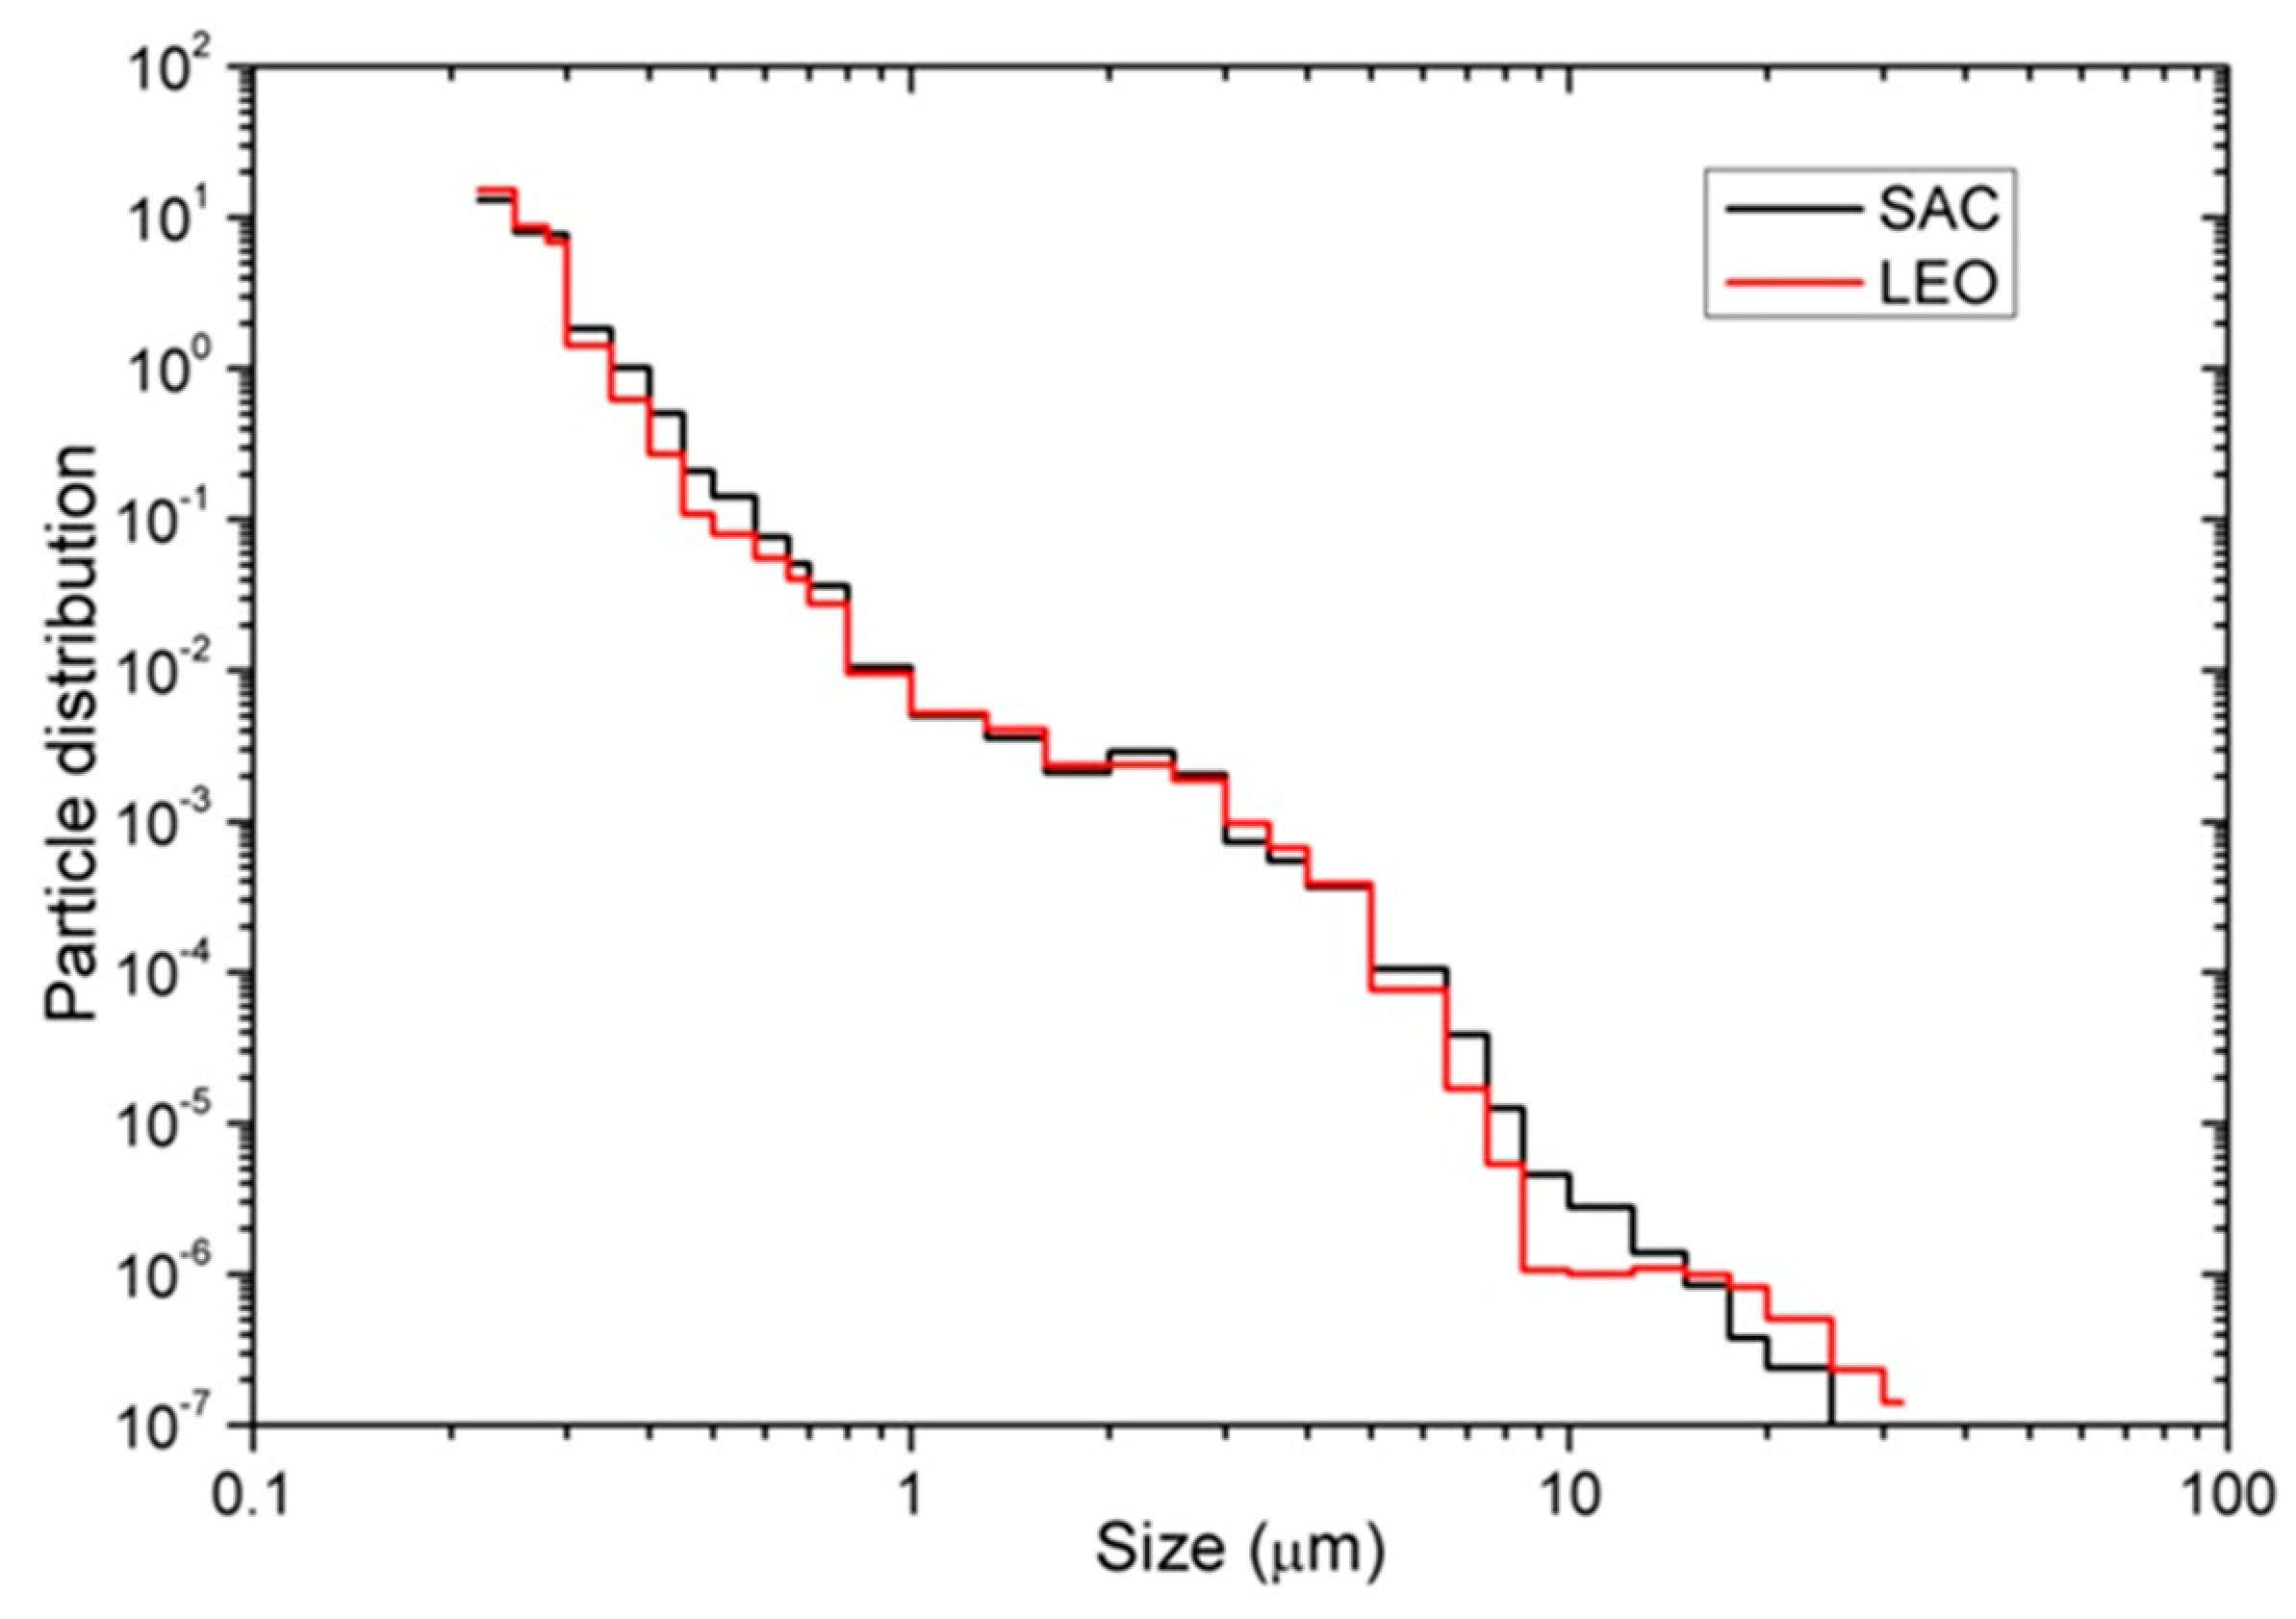
3.2.1. Ground Measurements with Aerosol Spectrometer at LEO Site

The aerosol content analysis was made performing concentration measurements near surface, using a GRIMM aerosol-spectrometer, model 1109 (manufactured by GRIMM Aerosol Technik GmbH & Co) that belongs to the Institute of Physics Rosario (IFIR, CONICET—National University of Rosario). This device analyzes the fraction PM > 0.22 and has a double measuring technique:
  • A mass of air (charged with aerosols) enters the device and interacts with a laser of 655 nm wavelength. By detecting the scattering signal and internal modeling, it counts particles, determining its size and mass in 31 size intervals (or channels) within the range (0.22 μm–32.0 μm). There is a final channel for large particles >32.0 μm, but even if the GRIMM instrument cannot determine their size, it can calculate its concentration. The aerosol number (aerosol mass) per unit air volume, corresponding to these 32 size channels are stored in a memory card every one minute.
  • Aerosols are collected on PTFE (Poly-tetrafluoroethylene) filters for further analysis.
The GRIMM aerosol spectrometer can measure mass concentration (total aerosol mass per unit volume of air) or particle concentration (total particle number per unit volume of air) directly, but it cannot measure in both modes, at the same time. In the present study, we measured aerosol mass concentration. It is possible to transform mass concentration into particle number concentration, making some assumptions: particles are spherical, the aerosol diameter on each size channel is the average value of the corresponding channel and the mass density is assumed to be a mean value of 1.68 g/cm3 [16].
Concentration measurements in LEO site were made from 28 December 2012 (5:36 pm local time = UT − 3 h) to 4 January 2013 (5:37 pm). In SAC site, measurements took place from 6 May 2013 (3:32 pm) to 10 May 2013 (9:16 am).Concentration measurements were made in a period when no volcanic activity or other high contamination events were detected near these locations, so the results presented would show a typical situation for the aerosol content on these sites. As mentioned before SAC and LEO sites. As mentioned before, the sites analyzed are rural sites far from large sources of anthropogenic pollution as well as the resources and instruments needed to perform ground measurements. With these complicated logistics necessary to carry out ground measurements the time extension of each was an important factor to consider, being only possible to perform continuous measurements for several days.
In Figure 2 we present normalized mass concentration distribution, with aerosol size corresponding to the whole period of measurement for each site (using mean concentration values of the 31 size channels, excluding the PM > 32). Mass fraction over an arbitrary size range [A;B] is calculated by integration of these curves, between the integration limits A and B. The total area below the curve is equal to 1..The inset graph on the mass concentration figures is a magnification of the normalized mass concentration in the range 0.1 μm to 1.0 μm. Mass figures presents well defined two modes, one corresponding to fine particles (PM2.5) and the other one to the coarse particles (PM2.5-10). In the case of LEO an incipient mode on larger particles (PM > 10) also appears. Table 1 describes the percentages of the particulate matter with mean diameter larger than 0.22 microns (PM > 0.22), corresponding to PM2.5, PM2.5-10, PM10 and PM > 10 fractions:
The normalized particle concentration is presented in Figure 3. As expected, there is a large number of PM > 10 particles in LEO than in SAC, showing again the PM > 10 mode. As it is shown in Figure 3, for small particles, the size distribution for both sites is very similar. A notorious difference appears for LEO, at large particles. In Table 2 percentages values of the total particle concentration (PM > 0.22) are presented for PM2.5, PM2.5-10, PM10 and PM > 10 fractions.
In a previous work [5], we determined with the same GRIMM instrument, a total particle number concentration of (2800 ± 140) particles/cm3 in SAC and of (5860 ± 140) particles/cm3 in LEO. The clearness of both skies is demonstrated, when compared with the definition of a clear atmosphere given by ISO 14644-1 Class 8 norm, that considers that the particle concentration for particulate matter larger than 5 microns (PM ≥ 5) must be not larger than 29,300 particles/cm3. In order to compare, we present typical results in other parts of the world, in particular in Eastern-Central China. The mean results obtained by Wang et al. [13] are the followings: 12,661, 11,189 and 12,797 particles/cm3 for Shijiazhuang, Nanjing and Suzhou, respectively.

3.2.2. Ground Measurements with Sunphotometer of the Aerosol Network AERONET at LEO Site

At the CASLEO Observatory (LEO in our notation), it was placed for a limited period of time, one of the hundreds Cimel sunphotometers of the Aerosol Network (AERONET)/NASA (https://aeronet.gsfc.nasa.gov). This instrument measures automatically the Aerosol Optical Depth, AODλ, a measure of how the atmospheric particles attenuate the solar radiation at different wavelength. From all the wavelength, we analyzed the nearest to the center of the visible spectrum, 500 nm. The mean of the values registered in the 2011 to 2013 years was: AOD500,AERONET,LEO = 0.026 P = 0.161). In this case, the significant events criteria (formula 1) presented in Section 3.1, gives AODlimit,AERONET,LEO = 0.35 and the number of events that surpassed this value in the 3 years period (2011–2013) of measurements is null.

3.2.3. Satellite Measurements of Aerosol Optical Depth at SAC and LEO Sites

The solar photon attenuation (absorption + dispersion) by atmospheric aerosols described by the aerosol optical depth (AOD) for a given wavelength has been measured all over the world and particularly at the SAC and LEO sites, by SeaWiFS instrument on board of SeaStar/NASA satellite, through the improved Deep Blue algorithm, level 3 products, with a 1° × 1° pixel resolution. This instrument is described in detail in the corresponding NASA web page: hthttp://oceancolor.gsfc.nasa.gov/SeaWiFS/SEASTAR/SPACECRAFT.html.
In Figure 4 we present the AOD550 daily time series for the 1998–2010 period, measured by the SeaWiFS satellite instrument at SAC and LEO sites. The corresponding (very low) mean values are: AOD*550,SW,SAC = 0.0262 (σP = 0.161) (top figure) and AOD*550,SW,LEO = 0.0266 (σP = 0.163) (bottom figure). Applying formula (1), the limiting value for SAC is AOD550,limit,SAC = 0.35 and the mean number of events in the 13 years period of 1998 to 2010 is N*SO2,SAC = 0. The same for LEO, form Figure 4 (at bottom), the limiting value is AOD550,limit,LEO = 0.353 and the mean number of events in the same period N*SO2,LEO is also null.

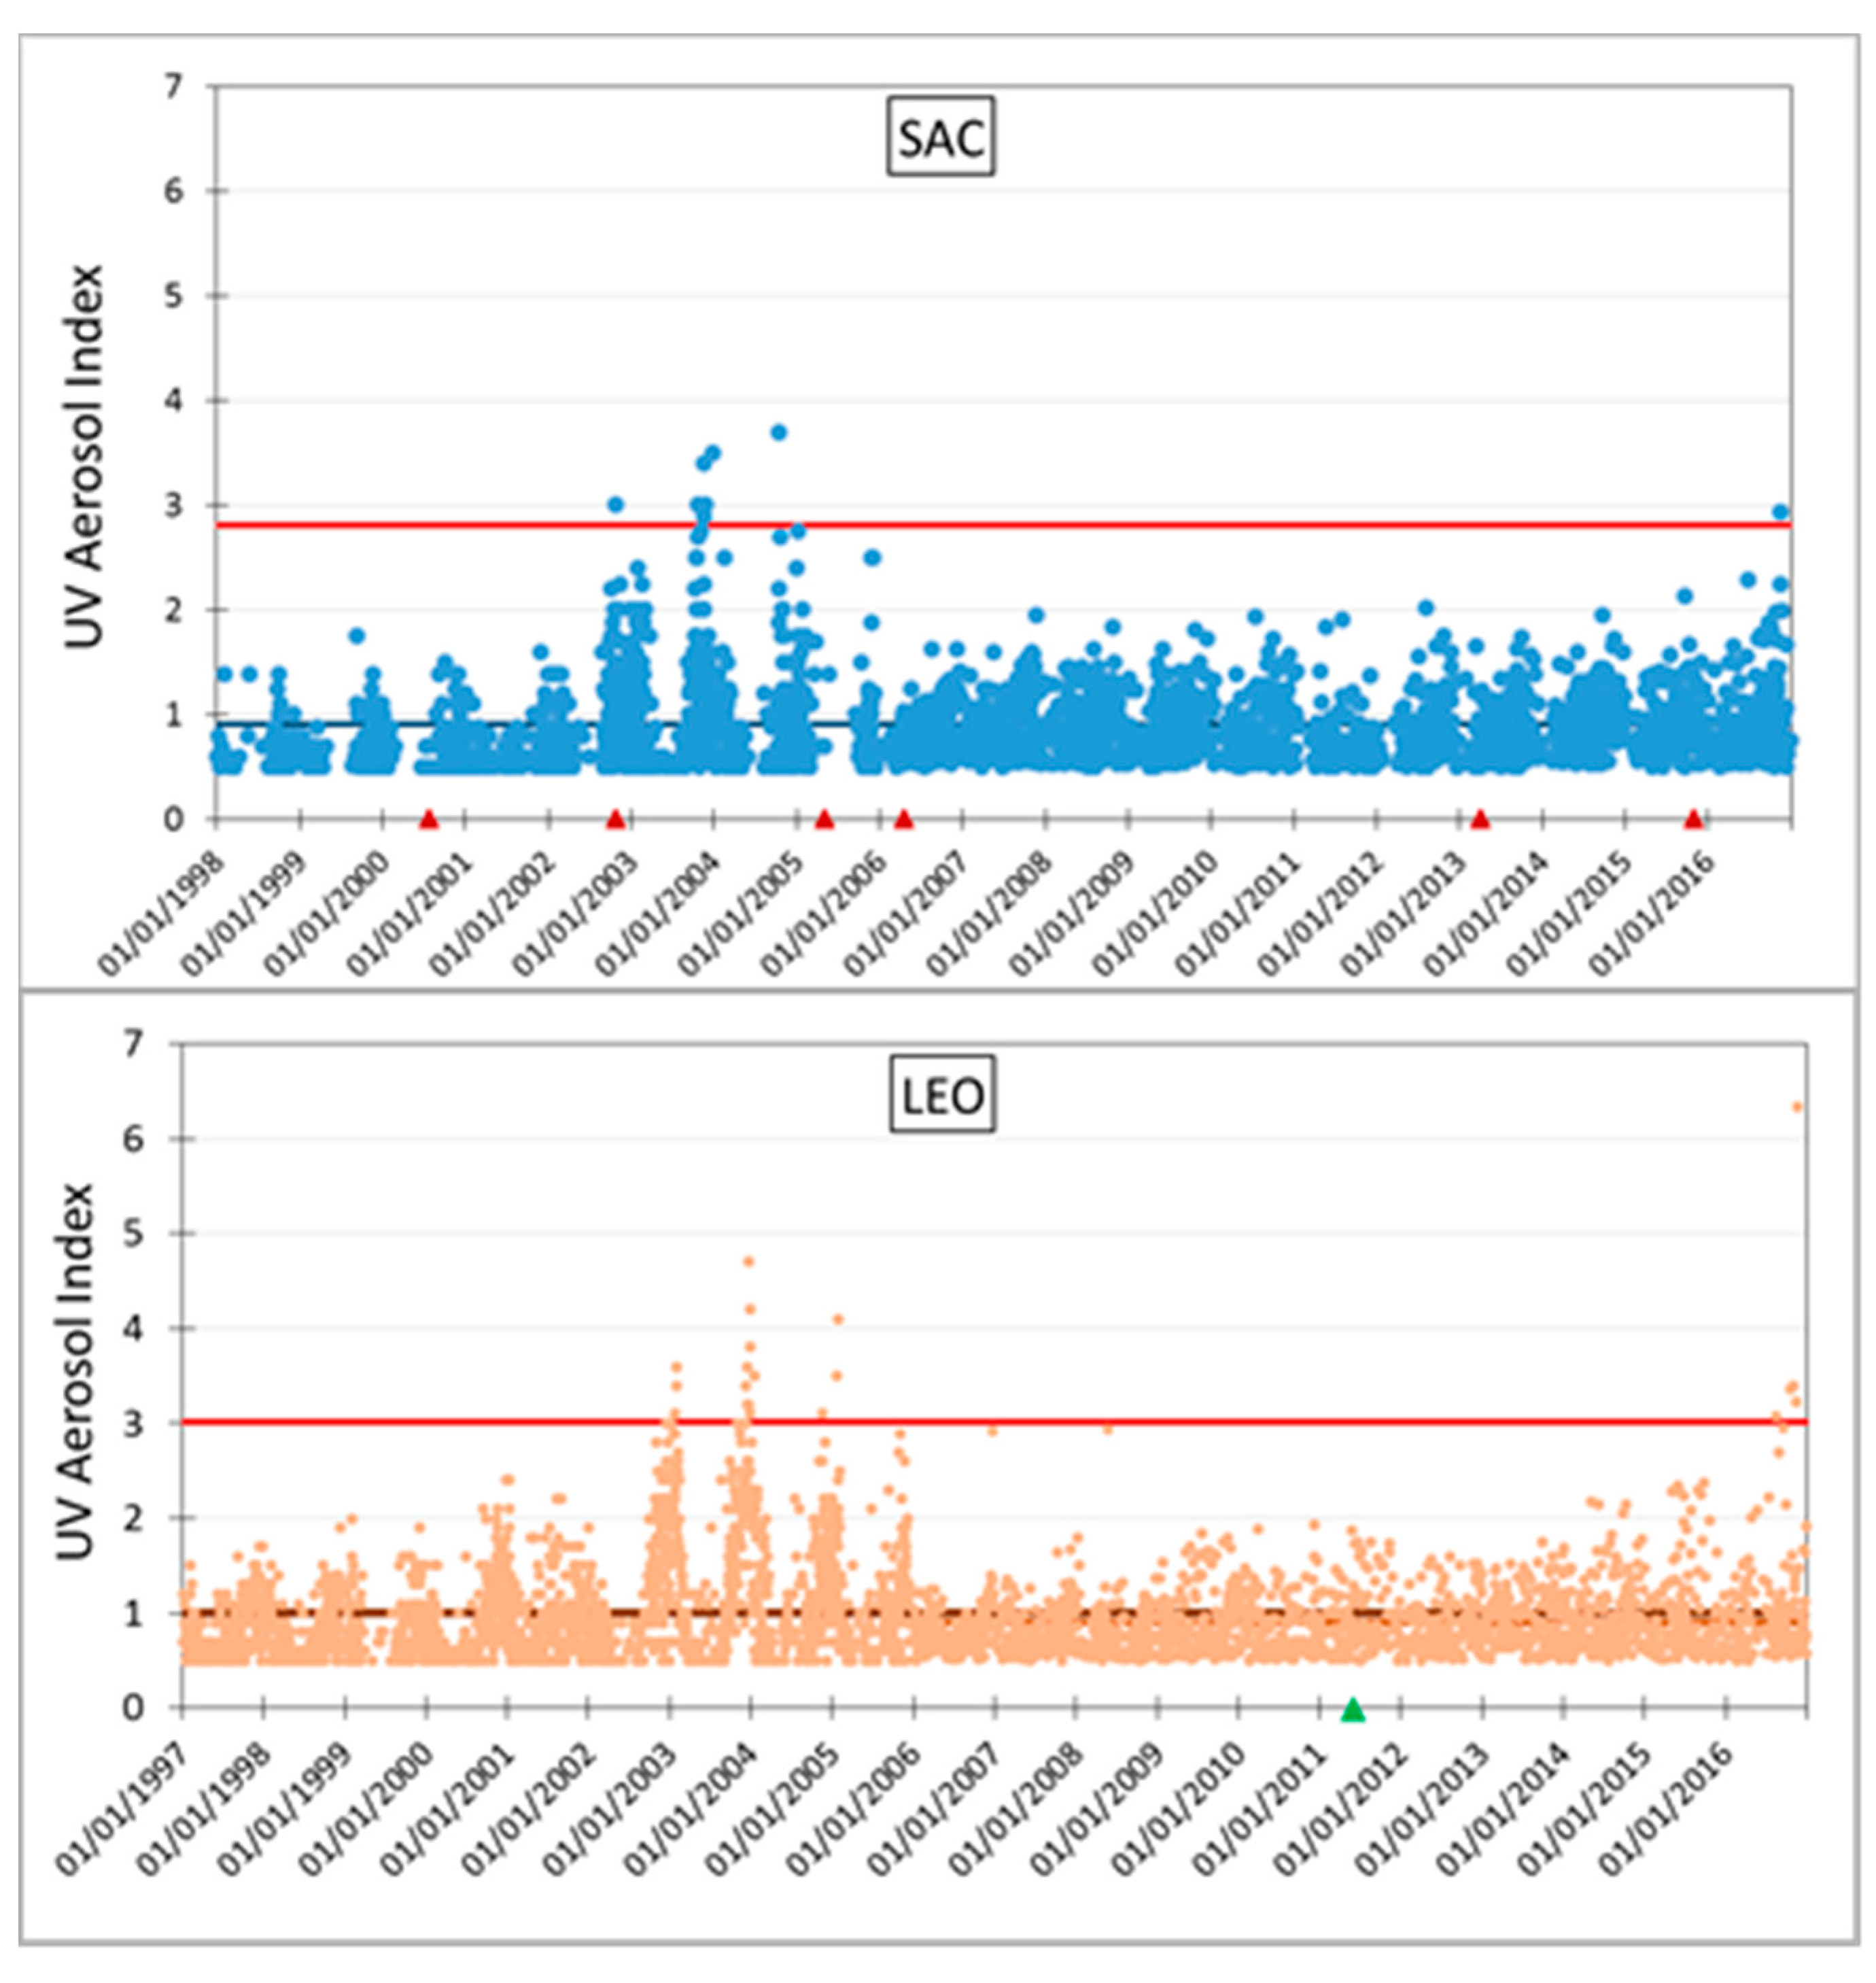
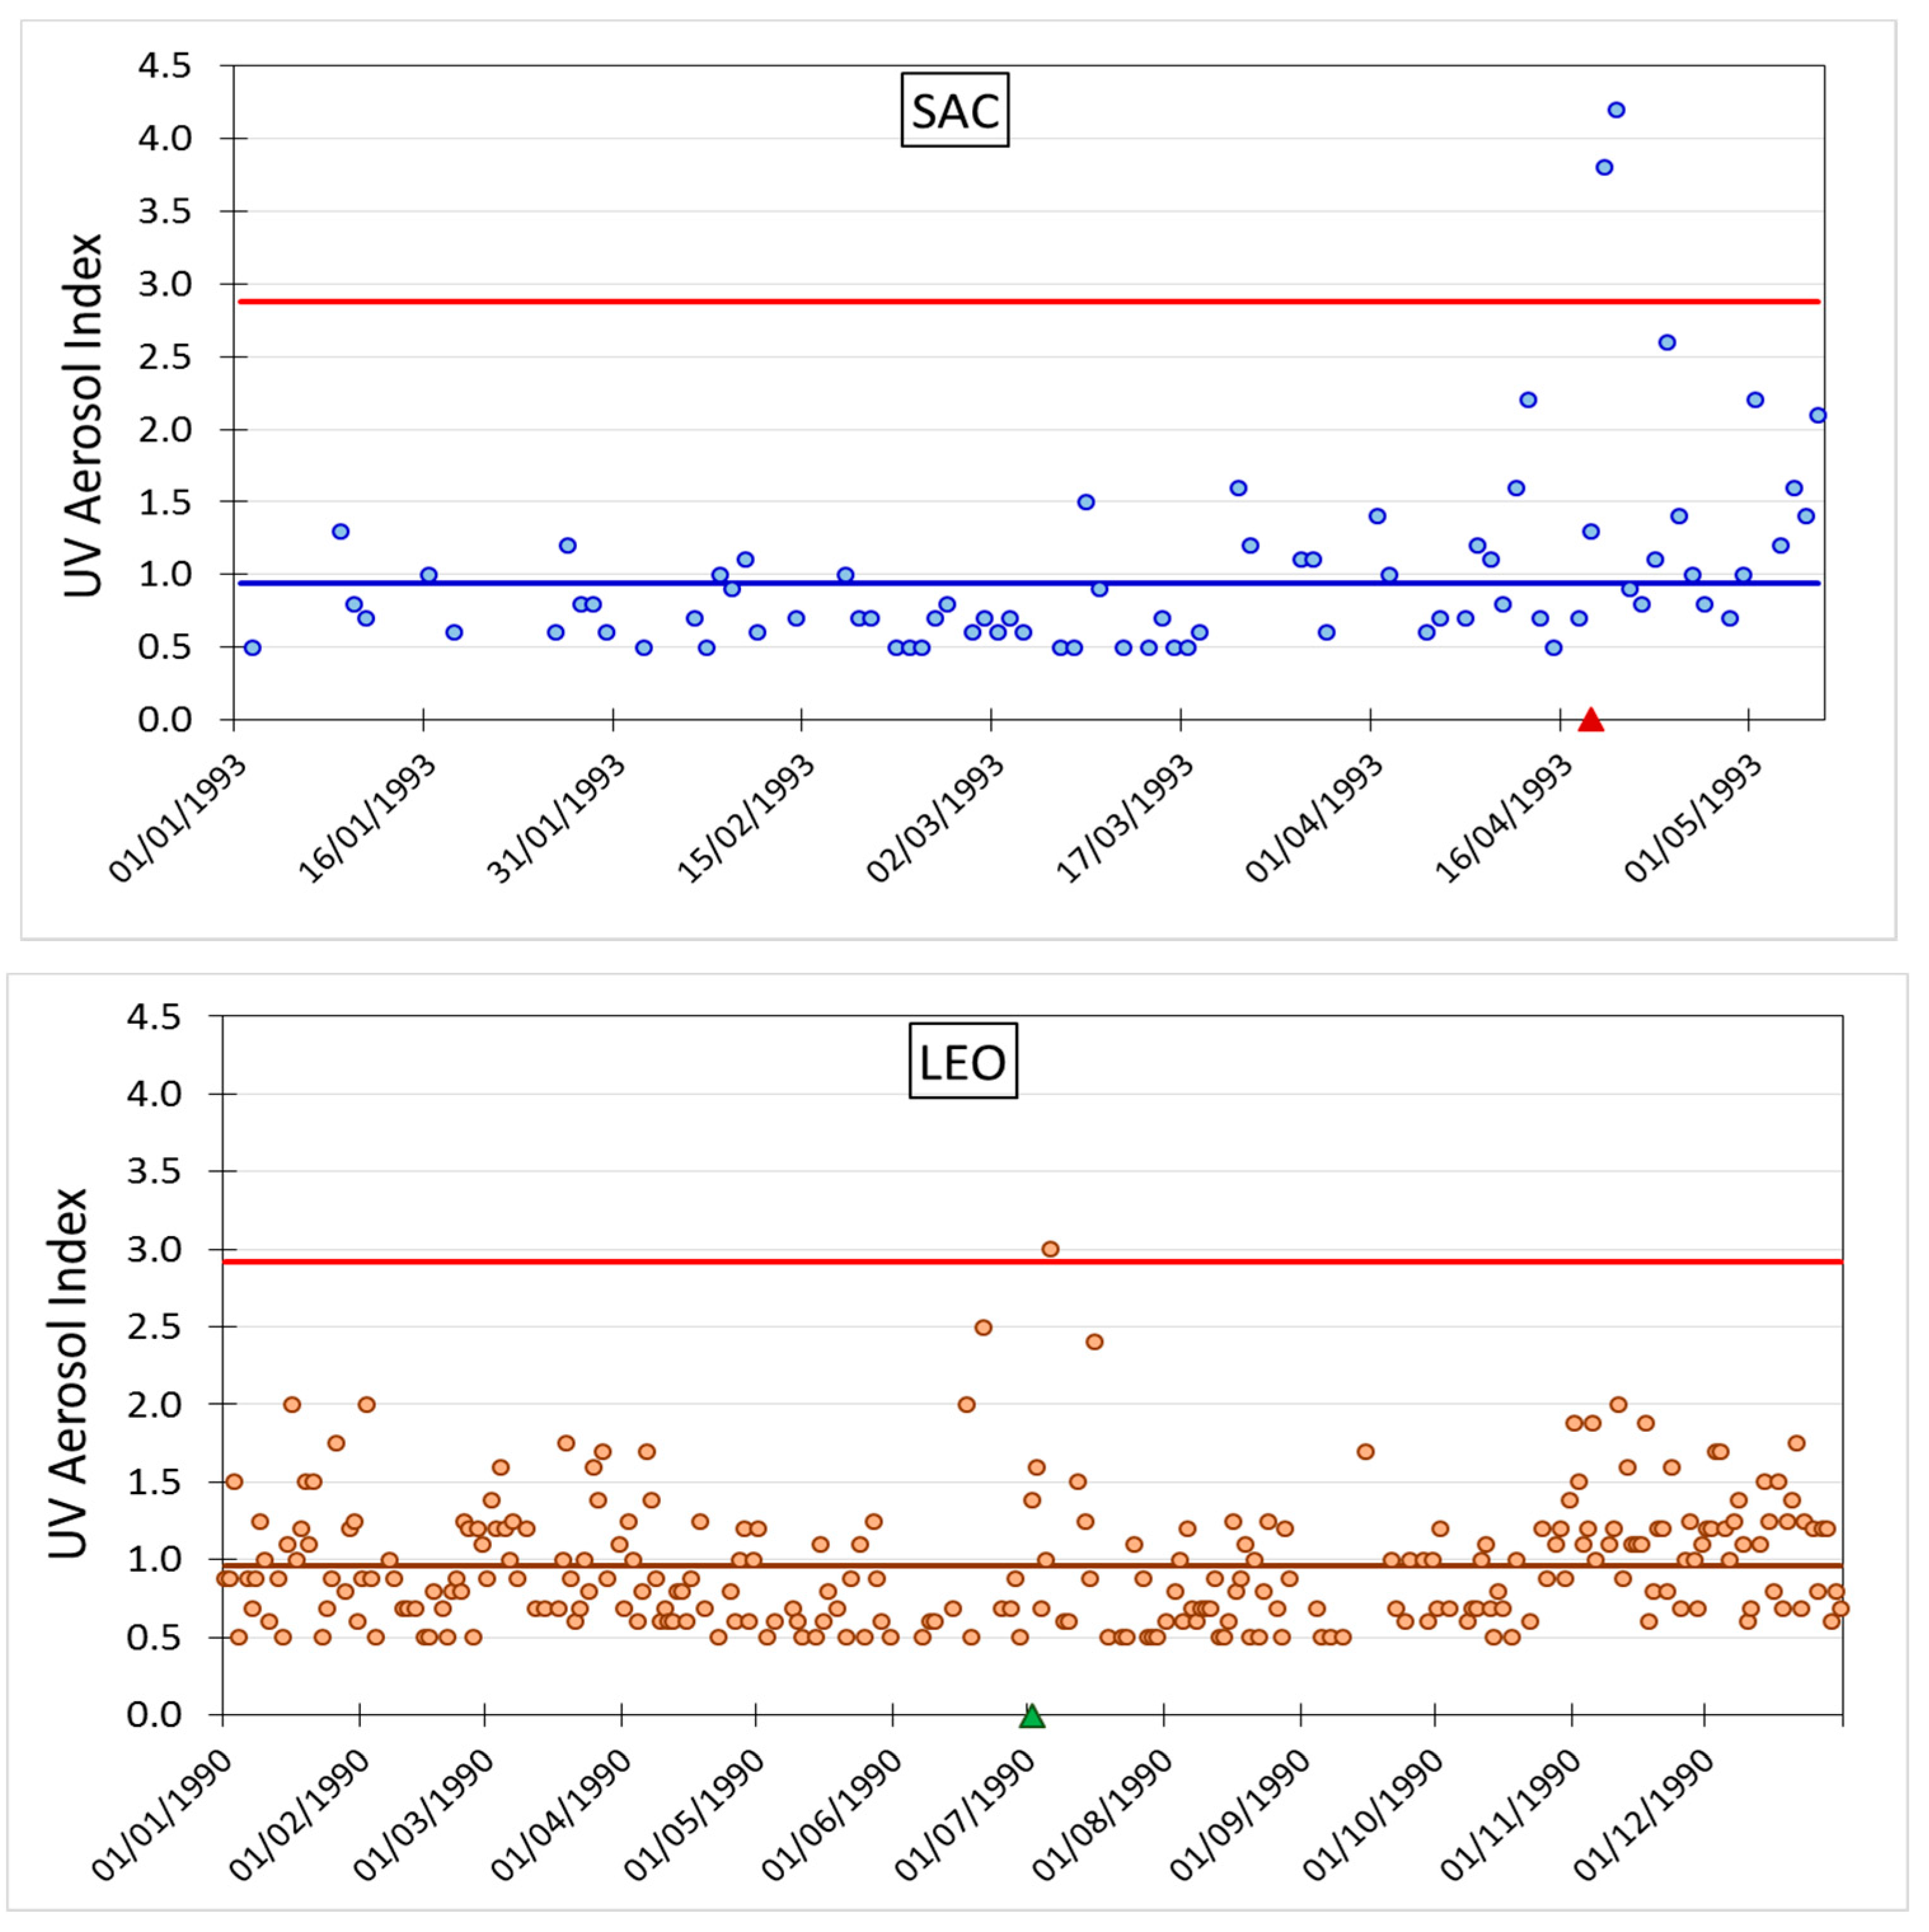
3.2.4. Satellite Measurements of UV Aerosol Index at SAC and LEO Sites

A large series of measurements of the Aerosol Index (AI), -a variant of the AOD in the UV solar range, have been obtained by the exceptional TOMS (Total Ozone Mapping Spectrometer) and OMI (Ozone Monitoring Instrument) equipments on board of different NASA satellites. In particular TOMS instrument details are given in https://science.nasa.gov/missions/toms. Figure 5 shows AI for the SAC place in the 1998–2016 period, having a mean value AI*TOMS/OMI,SAC = 0.91 (with a Poisson standard deviation of 0.95). Consequently, the limiting value given by formula (1) has a value AIlimit,TOMS/OMI,SAC = 2.81 and a frequency NTOMS/OMI,SAC = 0.5 events/year.
Similar values were obtained by both instruments in the same period in its LEO overpass: AI*TOMS/OMI,LEO = 1.00 (with a Poisson standard deviation of 1.00), AIlimit,TOMS/OMI,LEO = 3.00 and a frequency NTOMS/OMI,LEO = 1.53 events/year. Only one eruption in 2002, with respect to all the period of 18 years, seems to coincide with a quite high value of the UV aerosol index at the SAC place. In the other cases and in both locations, probably the wind blowed in another direction. The presence of high aerosol events in the SAC case for consecutive years by the end of each of the years 2003 to 2005, can eventually be explained by an intense deforestation (and consequently biomass burning and soil blow up) in the Nord-East of Argentina, Paraguay, Bolivia and South-West of Brazil.
It is of interest to note that in the 1990’s decade, the TOMS instrument detected a significant eruptive event that corresponds to Lascar volcano, around 18 April 1993. Figure 6 shows the AI index for the SAC place in the first months of the 1993 year, having a mean value AI*TOMS/OMI,SAC = 0.91 (with a Poisson standard deviation of 0.95). The limiting value of formula (1) has a value AIlimit,TOMS/OMI,SAC = 2.81 and NTOM/OMIS,SAC = 0.5 events/year. Similarly, for LEO, in this case correlated with Puyehue-Cordón Caulle volcano complex eruption, starting 2 July 1990: AI*TOMS/OMI,LEO = 1.00 (with a Poisson standard deviation of 1.00), AIlimit,TOMS/OMI,LEO = 3.00 and NTOMS/OMI,LEO = 1.93 events/year. In both cases, the AI values at the detailed dates, overpasses the limiting values.

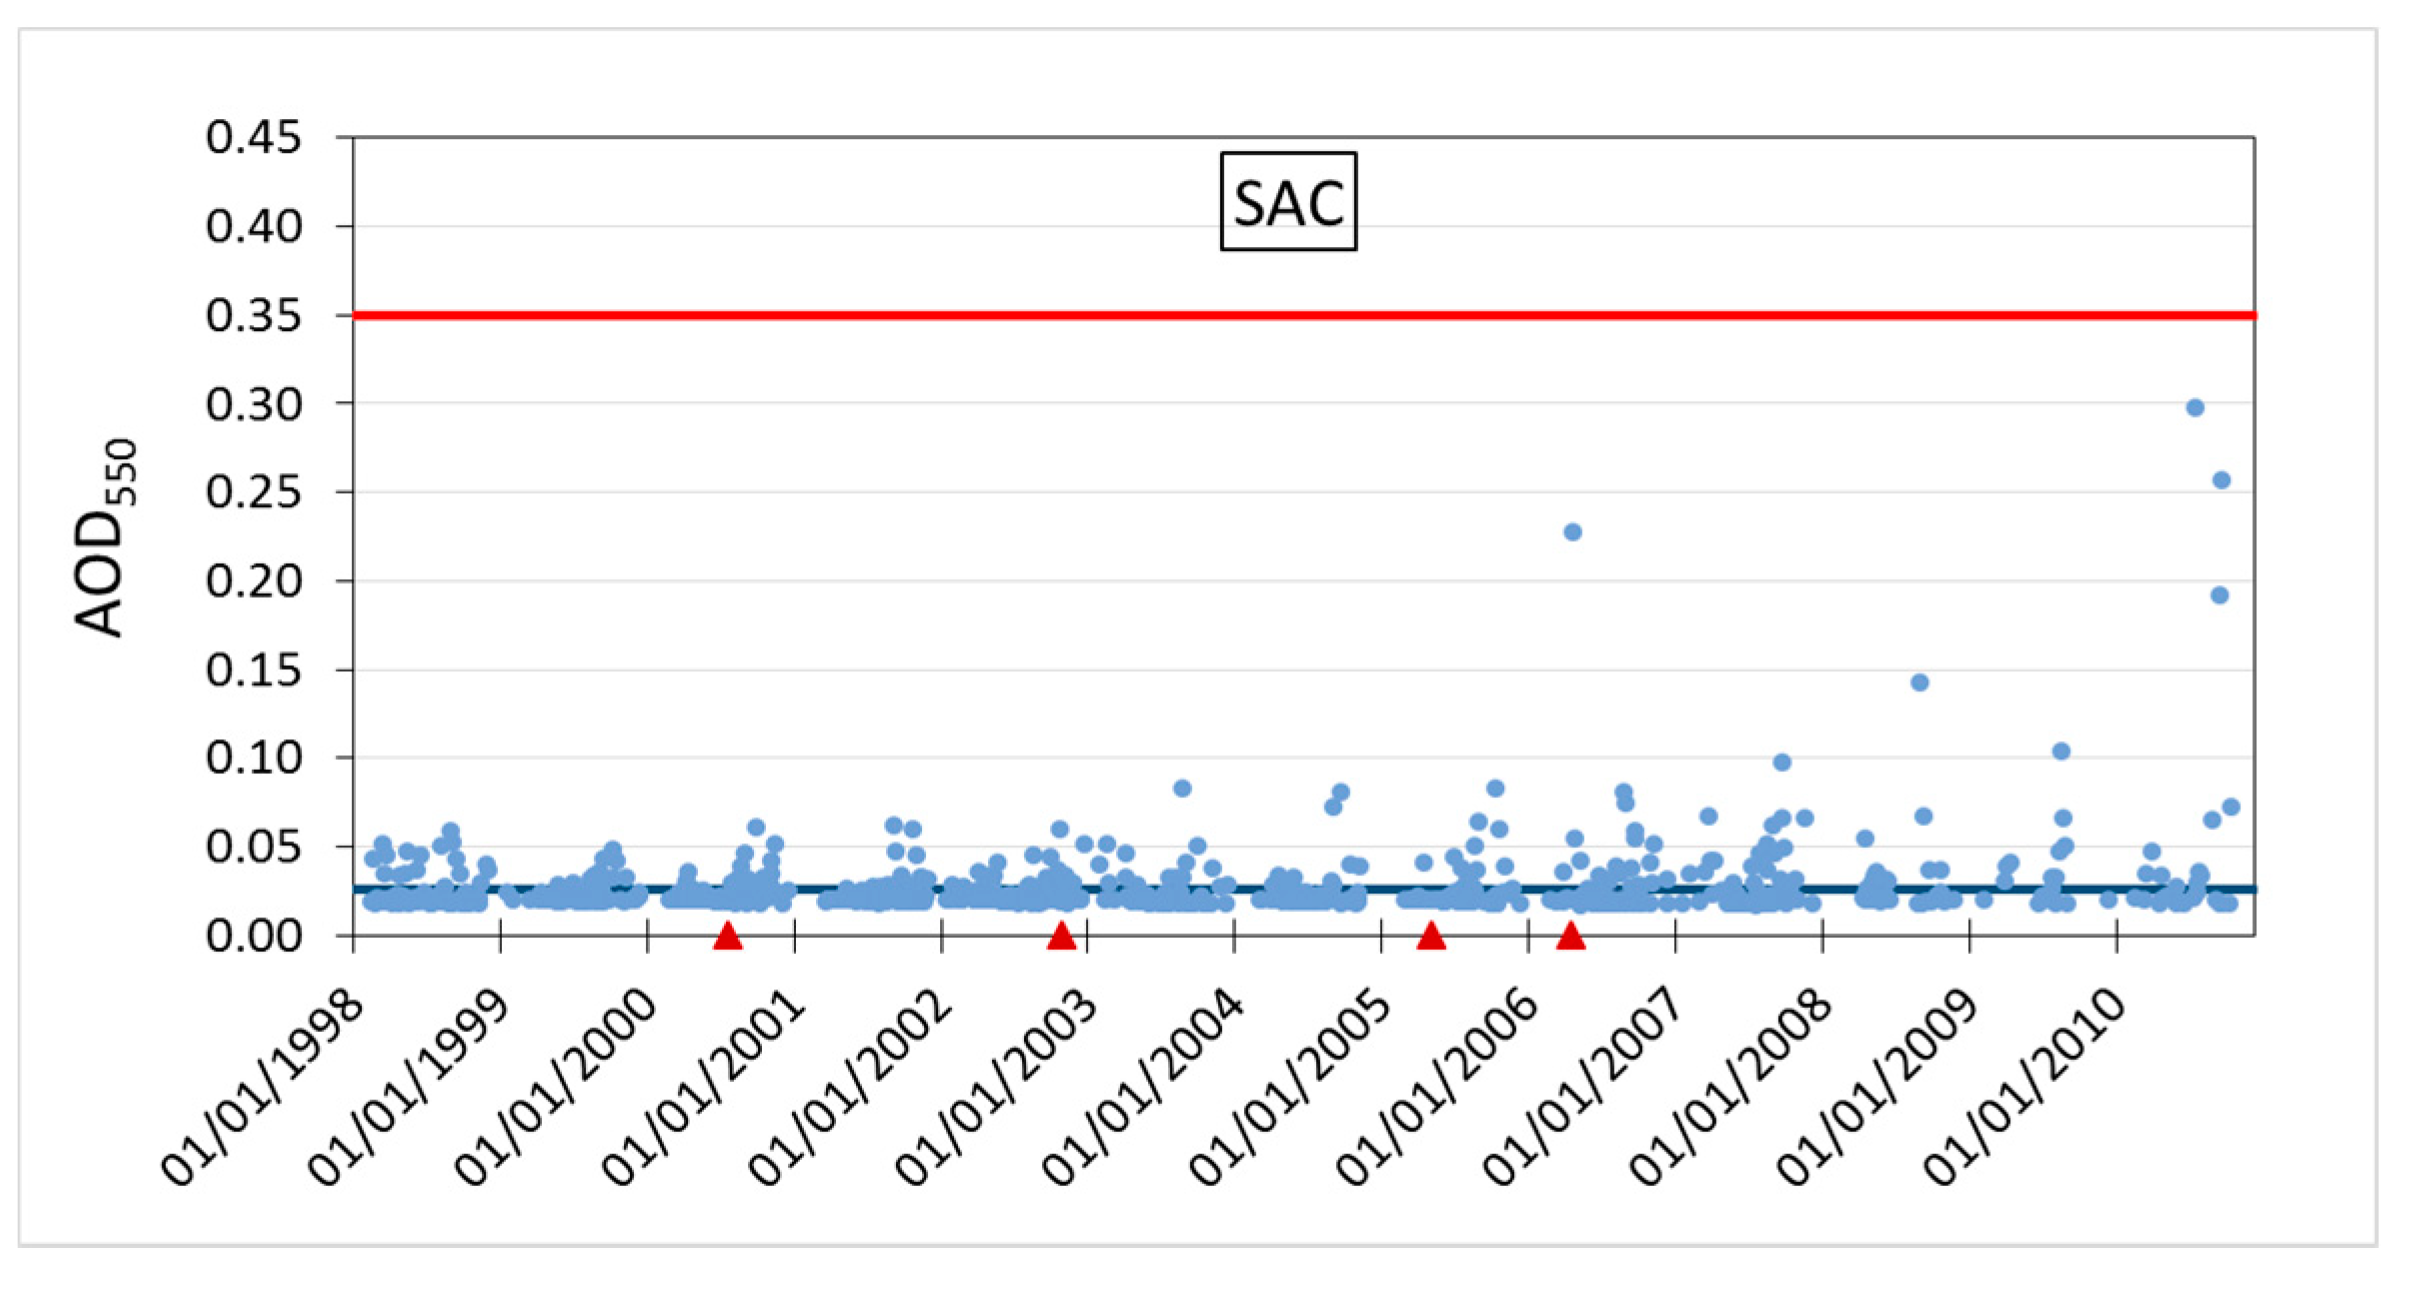
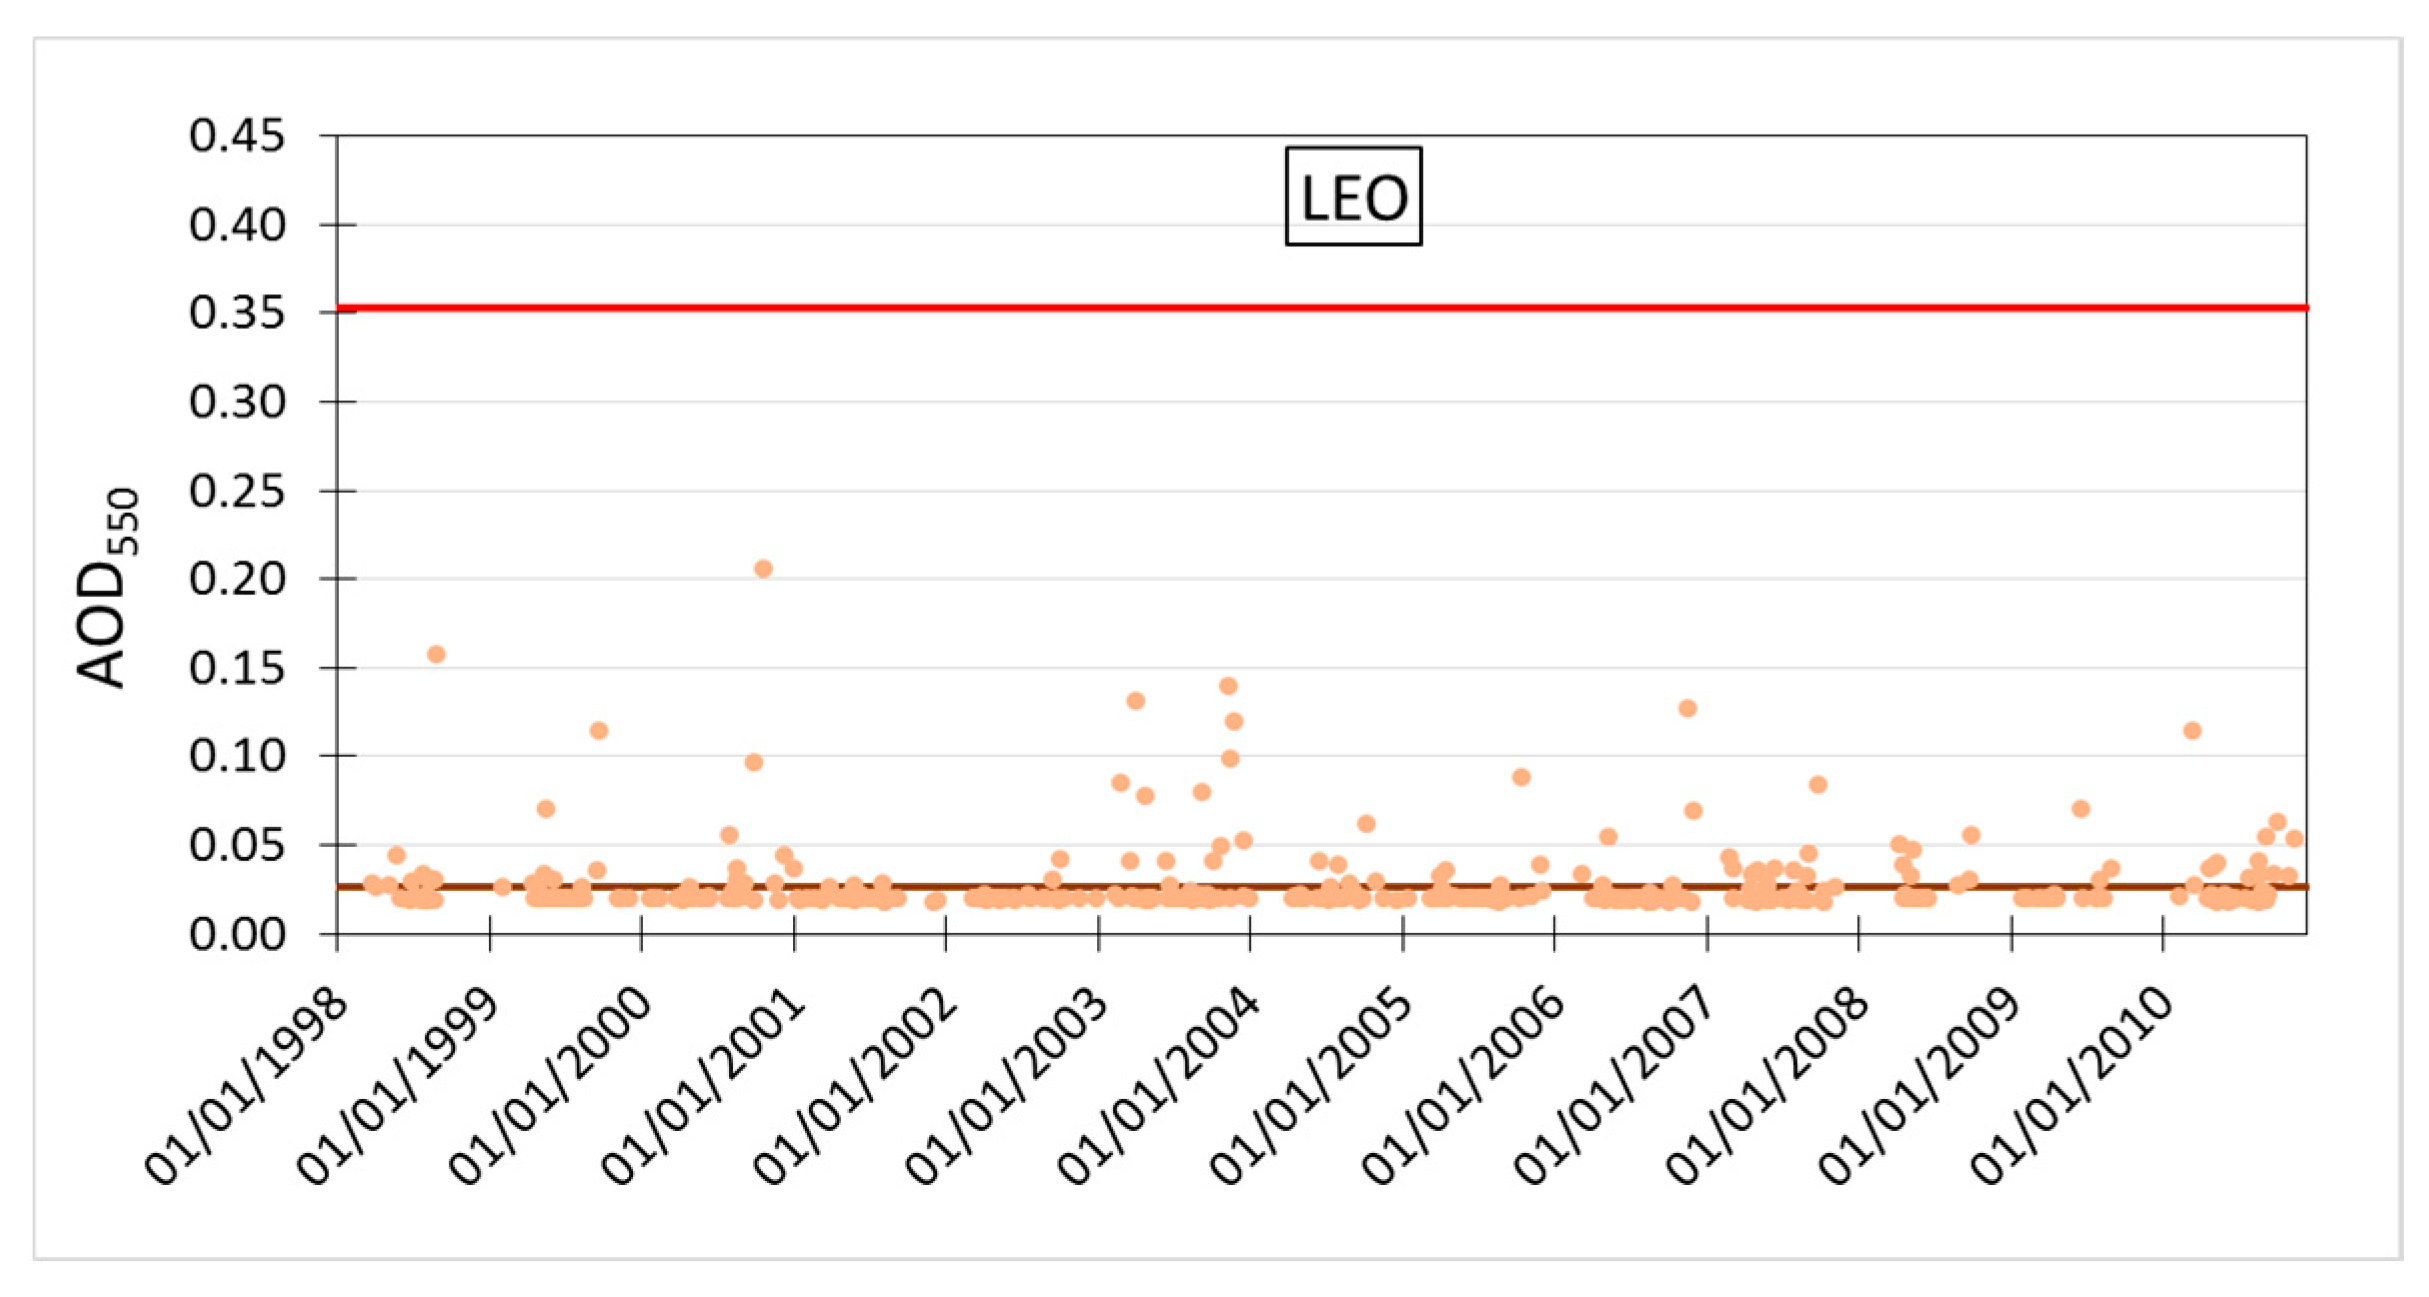
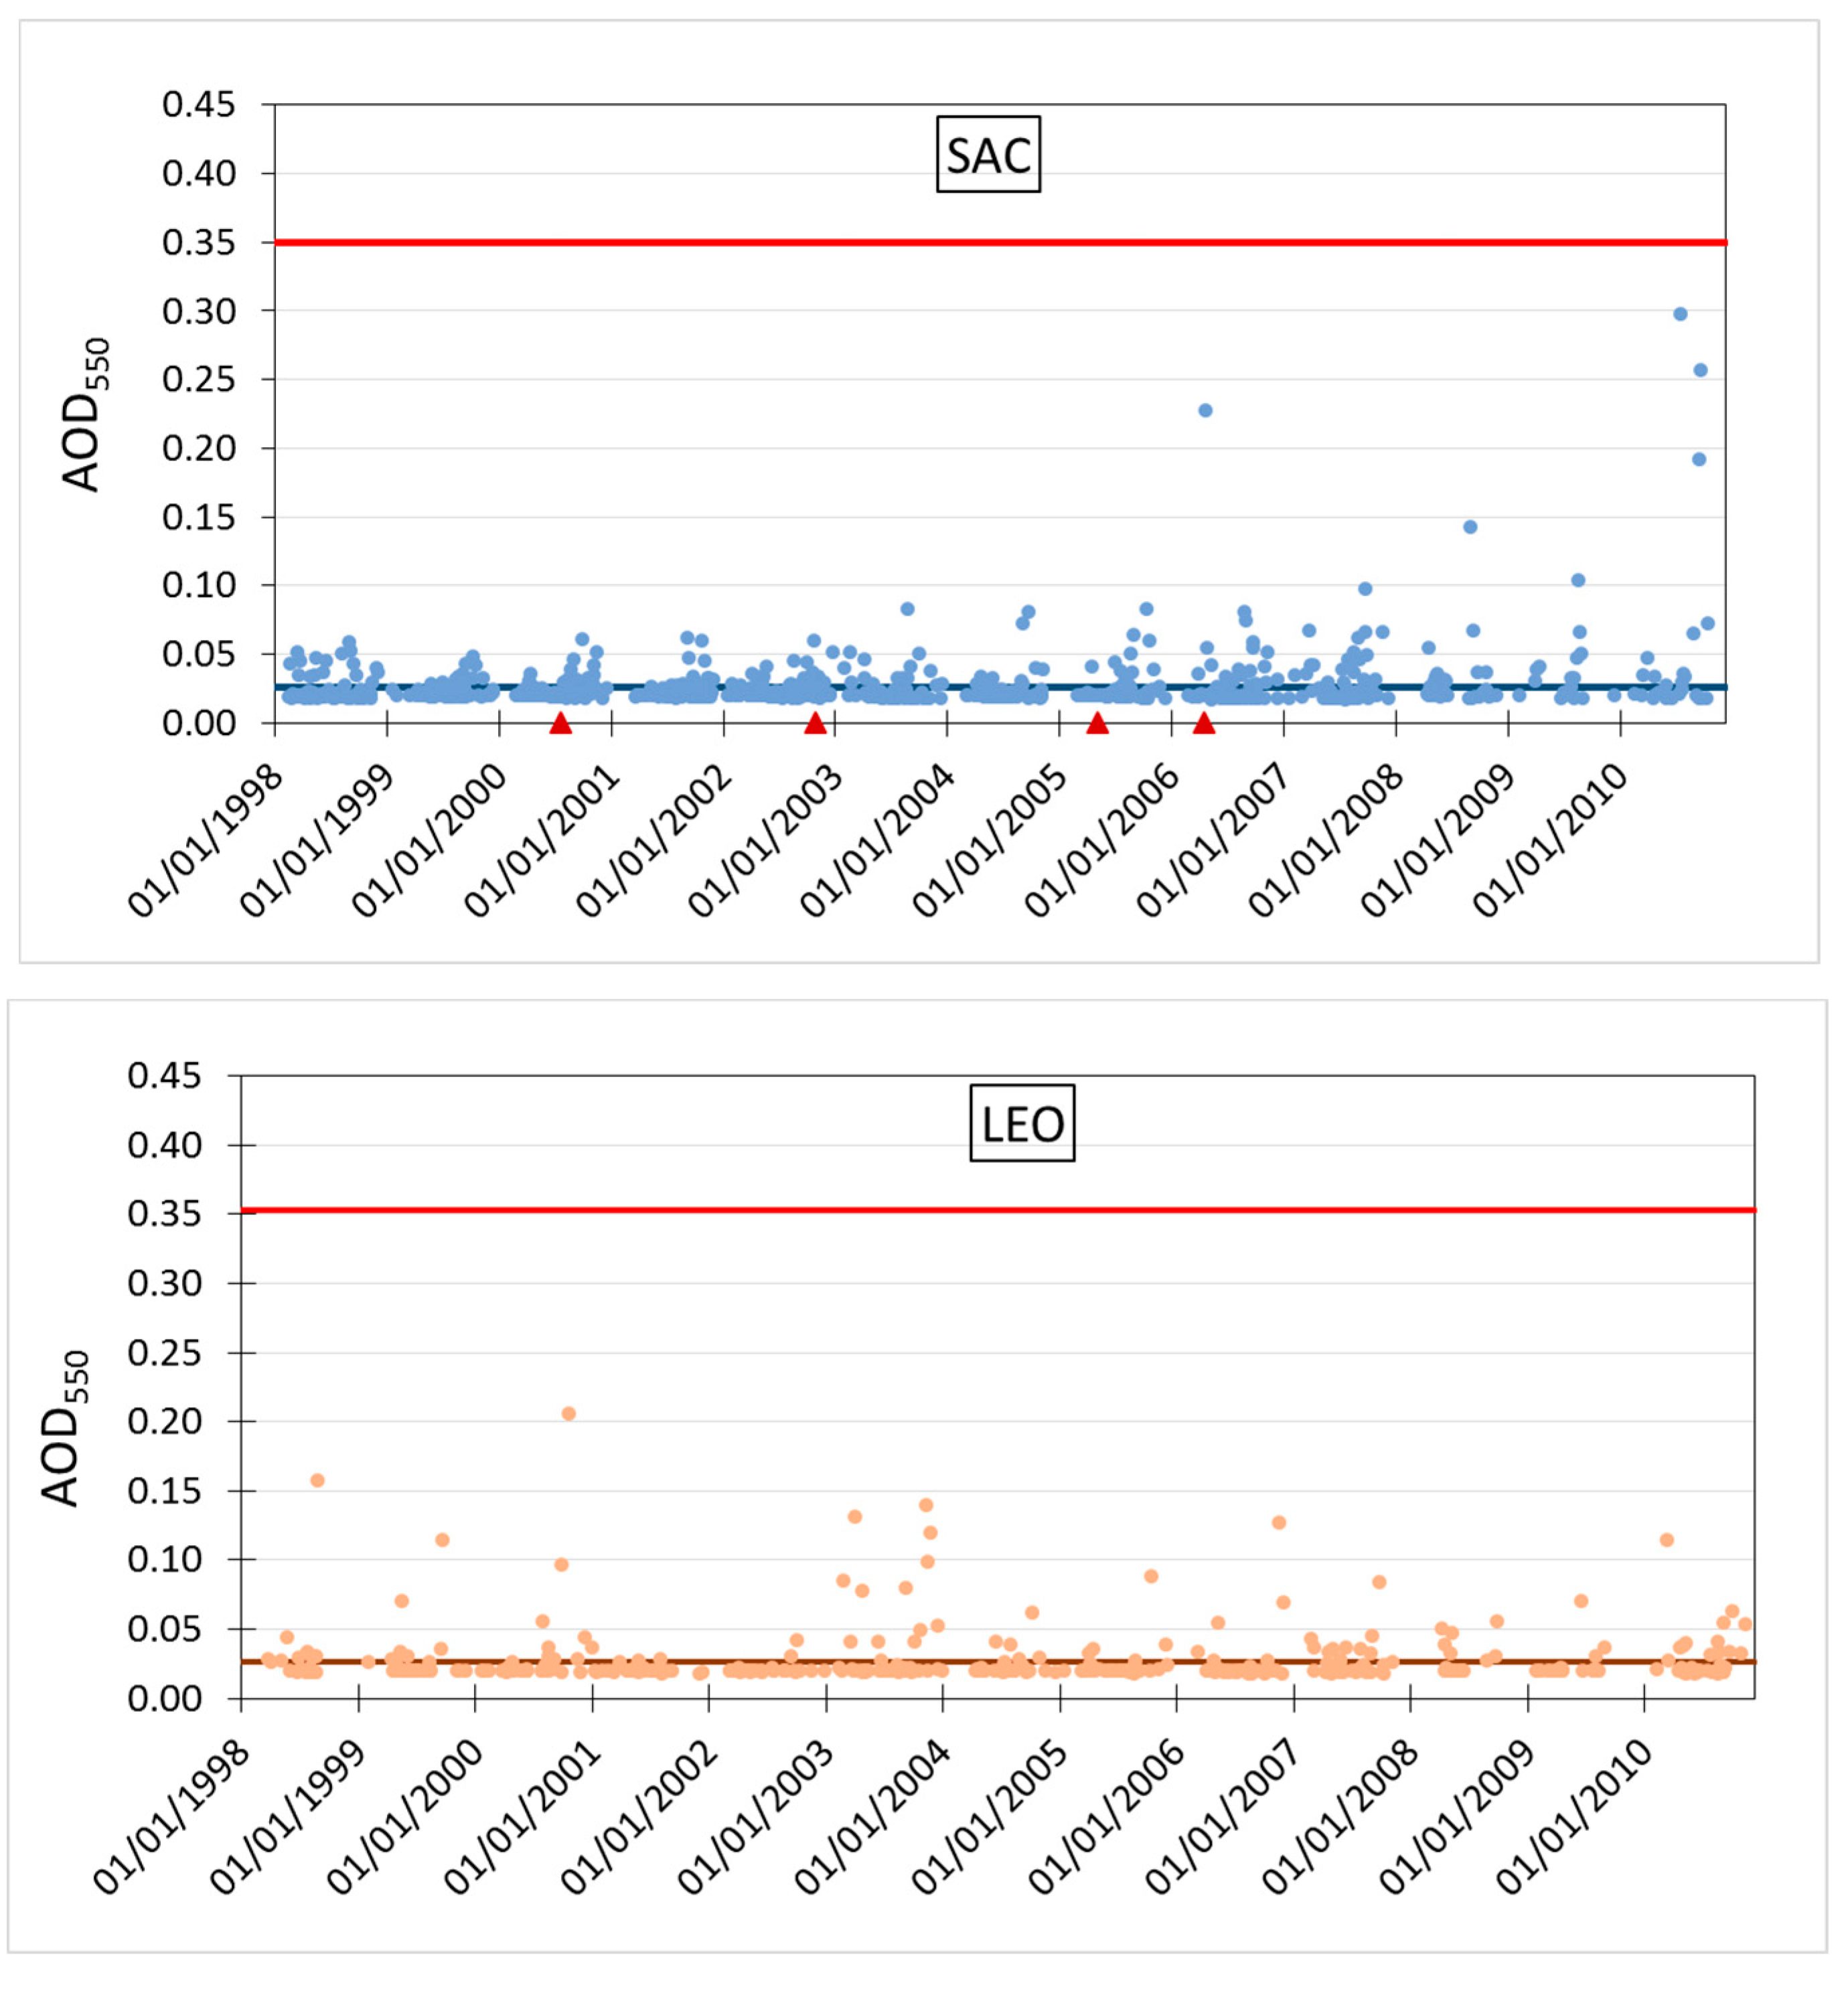
3.2.5. Satellite Measurements of Aerosol Optical Depth at SAC and LEO Sites

Another available series of data is that of AOD (at 550 nm), measured with SeaWiFS instrument on board of SeaStar/NASA satellite, in the rather long (1998–2010) period (Figure 7). In order to improve the data quality, the Deep Blue algorithm was employed (see https://disc.gsfc.nasa.gov/datasets/SWDB_L310_004/summary). The frequency of significant events can be obtained following the proposal we introduced in Section 2. Results:
  • AOD*SW,SAC = 0.0262 (with a Poisson standard deviation of 0.161), AODimit,SW,SAC= 0.35 and null NSW,SAC, for SAC site.
  • AOD*SW,LEO = 0.0266 (with a Poisson standard deviation of 0.163), AODlimit,SWI,LEO= 0.353 and also null NSW,LEO, for LEO site.

3.2.6. Frequency of Events from Different Satellite Data at SAC and LEO Sites

From the different satellite sources of information (SO2 total column, AOD550 and AI), we have the possibility to derive a mean value for the frequency of significant events, as it is shown in Figure 8. The mean values for SAC and LEO are: N*SAC =1.30 events/year and N*LEO = 1.71 events/year, quite small in both sites.

4. Discussions and Conclusions

SO2 and aerosol clouds generated by volcanic eruptions can propagate due to winds, influencing the air quality of particular geographical places. So, they can be used as a proxy for the determination of significant events. All the analyzed data show that SAC and LEO sites placed at the Argentina Andes range, are very little influenced by volcanic eruptions. These conclusions are supported by ground as well as satellite data. In particular, the following conclusions can be established:
  • SO2 total column at SAC and LEO sites presents a quite small number of events per year, only a mean of 3.40 and 3.60, respectively.
  • Aerosol index also shows a small mean number of events per year (0.50 and 1.53 for SAC and LEO, respectively) and Aerosol optical depth a null result for both sites.
  • The general mean frequency of events for each site is: 1.30 events/year for SAC and 1.71 events/year for LEO. These last results imply that less than 0.5% of the days in a year can be affected by gas or aerosol clouds due to volcanic eruptions (or other significant atmospheric events). In comparison, in observatories placed in desertic regions (or near them) and mainly due to the blow up of the sand by the wind, there is normally much more significant events that those in the Andes range. For example, at the Roque de los Muchachos observatory in La Palma, Canary Islands, in 1984 the Saharan dust period over this site lasted from 10 June to 30 August, affecting 45% of the nights and in 1985 from 5 June to 5 September, affecting 35% of the nights [14].
  • Concerning the Visibility variable of a given sky, the present results are a reference for the situation of the analyzed places in the time interval considered in the present work, since this variable (measured in Km) is inversely related to the aerosol content of the atmosphere (as given by the Koschmieder equation [17]). In particular, the mean AOD550 measured by SeaWiFS/SeaStar/NASA satellite instrument is very low: AOD*SW,SAC = 0.0262 for SAC and AOD*SW,LEO = 0.0266 for LEO, corresponding to a quite high Visibility (greater than 50 Km), as is confirmed from direct visual observation in the sites (verified during the measurement campaigns).
  • When compared with places around the world were astronomical/astrophysical/solar observatories are situated, the SAC and LEO sites are in the range of those with the lowest aerosol content [5], even if these sites are near active volcanoes. Another confirmation of this assessment is given by the volcanic dust database at the Servicio Meteorológico Nacional of Argentina, that in 5 years (2011–2016 period) informed of only one significant dust deposition event in San Juan Province (where the LEO site is located) and no dust deposition in Salta Province (where SAC is located, www.smn.gov.ar/vaac/buenosaires/cenizaenargentina.php?lang=es).
Future work will be oriented to the analysis of other Argentina Andes range sites for the same purpose, the placement of Observatories and also of Solar power plants.

Author Contributions

R.D.P. conceived and designed the present study that includes ground measurements and satellite data analysis; B.G. and the ITEDA Group performed SAC and LEO in situ measurements, collected data and helped in the data analysis of these measurements; L.S.D.C., M.M.F. and M.I.M. analyzed the data; R.D.P. (and partially each other authors) wrote the paper. All authors have read and agreed to the published version of the manuscript.

Acknowledgments

We acknowledge the support of CONICET through a PID 0405 grant, of MINCyT through a grant to the Cherenkov Telescope Array International Collaboration (Argentina branch), Government of the Salta Province, CNEA, Municipality of San Antonio de los Cobres and the Authorities of CASLEO (El Leoncito Astronomical Complex). Also we like to acknowledge to Alexis Mancilla and Javier Maya, that contributed placing and supervising the GRIMM instrument in the SAC and LEO sites. We also acknowledge the Science Team of the satellite instruments used in the present work (TOMS, OMI and SeaWiFS) for their dedication in the collection and maintenance of the corresponding databases.

Conflicts of Interest

The authors declare no conflict of interest. The founding sponsors had no role in the design of the study; in the collection, analyses, or interpretation of data; in the writing of the manuscript, and in the decision to publish the results.

References

  1. The Pierre Auger Collaboration. The Pierre Auger Cosmic Ray Observatory. Nucl. Instrum. Methods Phys. Res. Sect. A 2015, 798, 172–213. [Google Scholar] [CrossRef]
  2. Hilton, J.; Sarkar, S.; Torres, D.; Knapp, J. New Era in Gamma-Ray Astronomy with the Cherenkov Telescope Array. Astroparticle Phys. 2013, 43, 1–2. [Google Scholar]
  3. LLAMA Project. Information. Available online: http://www.iar.unlp.edu.ar/llama-web/project.htm (accessed on 7 July 2017).
  4. Aumont, J. QUBIC Collaboration, QUBIC Technological Design Report. Available online: https://arxiv.org/abs/1609.04372 (accessed on 7 July 2017).
  5. Piacentini, R.D.; García, B.; Micheletti, M.I.; Salum, G.; Freire, M.M.; Maya, J.; Mancilla, A.; Crino, E.; Mandat, D.; Pech, M.; et al. Selection of astrophysical/astronomical/solar sites at the Argentina East Andes range taking into account atmospheric components. Adv. Space Res. 2016, 57, 2559–2574. [Google Scholar] [CrossRef]
  6. McCormick, B.T.; Herzog, M.; Yang, J.; Edmonds, M.; Mather, T.A.; Carn, S.A.; Hidalgo, S.; Langmann, B. A comparison of satellite- and ground-based measurements of SO2 emissions from Tungurahua volcano, Ecuador. J. Geophys. Res. Atmos. 2014, 119, 4264–4285. [Google Scholar] [CrossRef]
  7. Carn, S.A.; Krotkov, N.A.; Yang, K.; Krueger, A.J. Measuring global volcanic degassing with the Ozone Monitoring Instrument (OMI). Geol. Soc. Lond. Spec. Publ. 2013, 380, 229–257. Available online: http://sp.lyellcollection.org/content/380/1/229 (accessed on 27 June 2017). [CrossRef]
  8. Theys, N.; De Smedt, I.; van Gent, J.; Danckaert, T.; Wang, T.; Hendrick, F.; Stavrakou, T.; Bauduin, S.; Clarisse, L.; Li, C.; et al. Sulfur dioxide vertical column DOAS retrievals from the Ozone Monitoring Instrument: Global observations and comparison to ground-based and satellite data. J. Geophys. Res. Atmos. 2015, 120, 2470–2491. [Google Scholar] [CrossRef]
  9. He, H.; Li, C.; Loughner, C.P.; Li, Z.; Krotkov, N.A.; Yang, K.; Wang, L.; Zheng, Y.; Bao, X.; Zhao, G.; et al. SO2 over central China: Measurements, numerical simulations and the tropospheric sulfur budget. J. Geophys. Res. 2017, 117. [Google Scholar] [CrossRef]
  10. GSFC/NASA Global Sulfur Dioxide Monitoring Group Publications. Available online: https://so2.gsfc.nasa.gov/pubs.html (accessed on 27 June 2017).
  11. Pitari, G.; Di Genova, G.; Mancini, E.; Visioni, D.; Gandolfi, I.; Cionni, I. Stratospheric Aerosols from Major Volcanic Eruptions: A Composition-Climate Model Study of the Aerosol Cloud Dispersal and e-folding Time. Atmosphere 2016, 7, 75. Available online: www.mdpi.com/2073-4433/7/6/75/htm (accessed on 27 June 2017). [CrossRef]
  12. Khokhar, M.F.; Frankenberg, C.; Van Roozendael, M.; Beirle, S.; Kühl, S.; Richter, A.; Platt, U.; Wagner, T. Satellite observations of atmospheric SO2 from volcanic eruptions during the time-period of 1996–2002. Adv. Space Res. 2005, 36, 879–887. [Google Scholar] [CrossRef]
  13. Wang, H.; Shen, L.; Zhu, B.; Kang, H.; Hou, X.; Miao, Q.; Yang, Y.; Shi, S. Spatial and temporal distributions of Air Pollutants and size distribution of aerosols over central and Eastern China. Arch. Environ. Contam. Toxicol. 2017, 72, 481–495. [Google Scholar] [CrossRef] [PubMed]
  14. Murdin, P.; Geology and meteorology of Saharan Dust. RGO/La Palma Technical Note No. 41, April 1986. Available online: http://www.ing.iac.es:8080/Astronomy/observing/manuals/ps/tech_notes/tn041.pdf (accessed on 7 July 2017).
  15. Parodi, M.A.; Ceccatto, H.A.; Piacentini, R.D. Effects of the Pinatubo Aerosols on South Hemisphere High Latitude Ozone Measured with TOMS/NASA and Analyzed with Artificial Neural Networks. Trans. Inf. Sci. Appl. 2006, 3, 588–594. [Google Scholar]
  16. Barthel, M. (GIP Messinstrumente Company, Pouch, Germany). Personal communication, 2011.
  17. Wilson, R.T.; Milton, E.J.; Nield, J.M. Are visibility-derived AOT estimates suitable for parameterizing satellite data atmospheric correction algorithms? Int. J. Remote Sens. 2015, 36, 1675–1688. Available online: www.tandfonline.com/doi/abs/10.1080/01431161.2015.1023558www.rtwilson.com/academic/WilsonMiltonNield_2015_VisAOT.pdf (accessed on 27 June 2017). [CrossRef]
Figure 1. SO2 total column time series (2005–2009 period) for SAC (top) and LEO (bottom) sites, measured with OMI instrument on Aura/NASA satellite. The mean values are also represented with horizontal lines at: SO2*OMI,SAC = 1.61 DU and SO2*OMI,LEO = 1.60 DU. The red lines correspond to the lower limit value for a significant event (see formula 1). Source: Goddard Space Flight Center/NASA (https://disc.gsfc.nasa.gov/).
Proceedings 01 00197 g001
Figure 2. Normalized mean mass concentration distribution for SAC site (black line) and LEO site (red line).
Proceedings 01 00197 g002
Figure 3. Mean particle concentration distribution for SAC (black line) and LEO (red line).
Proceedings 01 00197 g003
Figure 4. Area average (1° × 1°) time series (1998–2010 period) aerosol optical depth at 550 nm (AOD550) for SAC and LEO sites. The mean values are: AOD*550,SW,SAC = 0.0262 P = 0.161) for SAC (top figure) and AOD*550,SW,LEO = 0.0266 P = 0.161) for LEO (bottom figure). The red line corresponds to the limiting value given by Formula (1). Note: in the top figure, the red arrows indicate the Lascar volcano eruption days: 20 July 2000, 26 October 2002, 4 May 2005 and 18 April 2006. Source: SeaWiFS instrument on SeaStar/NASA satellite Deep Blue Level 3 long-term aerosol data at http://disc.sci.gsfc.nasa.gov/giovanni/.
Proceedings 01 00197 g004aProceedings 01 00197 g004b
Figure 5. (Top) UV aerosol index measured by TOMS and OMI instruments on board of different NASA satellites, at the SAC site. The red arrows indicate the days when a significant eruption was produced by the near Lascar volcano; (Bottom) similar results for LEO site, with a green arrow indicating the day of large eruption originated in the Puyehue- Cordón Caulle volcanic complex. The horizontal line in the middle of the data indicates the mean value. Goddard Space Flight Center/NASA https://science.nasa.gov/missions/toms.
Proceedings 01 00197 g005
Figure 6. (Top) UV aerosol index measured by TOMS instrument onboard Nimbus-7 NASA satellite, at the SAC site. The red arrow indicates the day 18 April 1993 when a significant eruption was produced by the near Lascar volcano; (Bottom) similar results for LEO site, with a green arrow indicating the day 2 July 1990 of a large eruption produced by the Puyehue-Cordón Caulle volcanic complex. The horizontal line in the middle of the data indicates the mean value. Source. Goddard Space Flight Center/NASA.
Proceedings 01 00197 g006
Figure 7. (Top) Aerosol optical depth at a wavelength of 550 nm (AOD550) measured by SeaWiFS instrument on board of SeaStar/NASA satellite, for SAC site, in the 1998–2010 period. The days with significant eruptions of the Lascar volcano (20 July 2000, 26 October 2002, 4 May 2005 and 18 April 2006) are indicated with red arrows on the horizontal axis. The horizontal line in the middle of the data indicates the mean value; (Bottom) similar results for LEO site. Source: Goddard Space Flight Center/NASA. https://www.nasa.gov/goddard.
Proceedings 01 00197 g007
Figure 8. Comparison between the frequency of events from different sources of data (SO2 total column, AOD550 or AI), and mean value, for the SAC and LEO sites.
Proceedings 01 00197 g008
Table 1. Percentages of the total mean mass concentration for the fractions PM2.5, PM2.5-10, PM10 and PM > 10.
LEOSAC
PM2.518.7022.04
PM2.5-1045.3955.08
PM1064.0977.12
PM > 1035.9122.88
Table 2. Percentages (%) of the total mean particle concentration for the fractions PM2.5, PM2.5-10, PM10 and PM > 10.
LEOSAC
PM2.599.770099.7737
PM2.5-100.22860.2248
PM1099.998699.9985
PM > 100.00140.0015
Publisher’s Note: MDPI stays neutral with regard to jurisdictional claims in published maps and institutional affiliations.

