Determination of Pressure Drop and Flow Velocity in Old Rough Pipes †


Department of Civil Engineering and Architecture, Tallinn University of Technology, 19086 Tallinn, Estonia
*
Author to whom correspondence should be addressed.
†
Presented at the 3rd EWaS International Conference on “Insights on the Water-Energy-Food Nexus”, Lefkada Island, Greece, 27–30 June 2018.
Proceedings 2018, 2(11), 590; https://doi.org/10.3390/proceedings2110590
Published: 31 July 2018
(This article belongs to the Proceedings of EWaS3 2018)
Abstract
:The aim of this paper is to determine the influence of irregular wall roughness of old pipes to pressure drop and flow velocity in Water Distribution Systems (WDS). Typical calibration of a numerical model of an existing WDS that contains old pipes is usually based on the estimation of roughness of the pipes using nominal pipe diameters. Due to wall build-up the shape of the inner pipe surface can vary temporally and spatially. In this study a series of numerical investigations are carried out using CFD (Computational Fluid Dynamics) software to determine the effect of irregular pipe diameter to pressure drop and flow velocity.
1. Introduction
Many engineering pipelines, e.g., water distribution systems (WDS) contain surfaces that can be considered hydrodynamically rough. Therefore, models that are able to accurately predict turbulent flows over rough surfaces are needed. The typical calibration of a numerical model of an existing WDS that contains old pipes is usually based on the estimation of roughness of the pipes using nominal pipe diameters. However, due to build-up the shape of the inner wall can vary significantly over the pipe length, resulting in non-homogenous cross-sections. In calibration procedure the pipe wall build-up is compensated by adjusting the roughness value [1]. This approach does not take into account that the developed irregular wall roughness elements greatly complicate the flow dynamics [2]. Therefore, the usage of nominal pipe diameters in modelling process is not always justified. In addition, information about real pipe diameters and flow dynamics is very important for estimating the propagation rate of the contaminated zones in WDS in case of chemical or biological threats [3,4,5].
Over the years, a number of experimental and numerical studies have been conducted using pipes with regular roughness (corrugated pipes) to analyze the flow dynamics (e.g., [6,7,8,9,10]) but just a few of these are using pipes with irregular surface elements (e.g., [2]). Most of the numerical models used in the corrugated pipes studies are calibrated using the measured pressure difference between the inlet and outlet of the test section. Conclusions about the flow dynamics and corresponding friction factors are based only on the numerical investigations. It has been found that in case of regular roughness elements the friction factor increases with the increase of Reynolds number and groove length but is not affected by the groove height [8,9]. But real old pipe surfaces generally have a range of roughness scales. Therefore Cristensen et al. [2] conducted a series of numerical investigations to model flow through aged pipes at Reynolds numbers ranging from 6700 to 31,000. Modelled Darcy-Weisbach friction factors were compared to experimentally obtained values and it was found that the CFD models underestimated the friction factors 8–30% (dependent on Reynolds number and model used).
Different studies carried out in Tallinn WDS (e.g., [11]) have shown that the build-up of pipe inner surface is not only time dependent but is affected by water quality, area and velocity in the pipes. Typically the roughness is not evenly distributed over the perimeter and length making it hard to estimate the average roughness. Analyses of the pipe specimens taken from the real WDS have indicated that two types of roughness build-up can occur (Figure 1a,b)—evenly distributed roughness, where roughness height is up to 10 mm (representative to areas where ground water is used) and unevenly distributed roughness where roughness height can be up to half a diameter and sometimes even block the flow (representative to areas where surface water is used). This study concentrates on the flow dynamics in pipes with the latter roughness elements.
In this study a series of numerical investigations are carried out using CFD to determine the effect of irregular roughness and pipe diameter to pressure drop and flow velocity. CFD results are compared with EPANET2 calculations. Analysis show that in case of old rough pipes the mean velocities are higher than expected indicating that in case of modelling the propagation of contamination in a WDS actual pipe diameters need to be defined. Preliminary results indicate that the use of constant roughness estimated in EPANET2 with nominal pipe diameter may lead to quite large errors in estimating the pressure differences.
2. Materials and Methods
3D analyses were conducted using a pressure-based solver with a segregated solution algorithm and a standard k-ω model based on the model proposed by Wilcox [12] for turbulence. The k-ω is one of commonly used RANS-based two equation turbulence models that include two extra transport equations for turbulent properties of the flow. The transported variables are most often the turbulent kinetic energy k and turbulent dissipation ε or specific turbulence dissipation rate ω, depending on the model chosen. Two transport equations are solved to determine the scale and energy of turbulence. The advantages of using the ω equation instead of the ε equation are: (i) the second is easier to integrate (more robust); (ii) it can be integrated through sub-layer without the need for additional damping functions; and (iii) it performs better for flows with weak adverse pressure gradient. One of the weak points of the Wilcox model is the sensitivity of the solutions to values for k and ω outside the shear layer (free stream sensitivity). Different turbulence models were compared with experimental results gained in a pipe with a sudden change in diameter using 2D PIV (Particle Image Velocimetry). The analysis of measured and modelled velocity and kinetic energy distributions over the pipe segment length and perimeter were performed [13]. The standard k-ω model showed the best qualitative and quantitative correlation with the experimental results when using standard turbulence model coefficients. Therefore, in this study the CFD analyses were performed using standard k-ω model.
Description of the Pipe Model
A model of a 0.5 m long pipe segment with the initial internal diameter of 100 mm was modified to mimic the irregular pipe inner wall surface of a typical old rough pipe in a working WDS. A pipe configuration where the roughness height is not evenly distributed and can be up to half a diameter was taken as an example (Figure 1b). For that a random surface pattern was created (Figure 2) and “bruised into” the pipe wall. The random surface pattern was applied to the test pipe surface at four different places over the pipe length both on the top and bottom side (Figure 3).
The computational domain was divided into ~750,000 mesh cells with the minimal mesh size of 1 mm and maximal 2 mm. The grid distribution over the cross-section was uniform. Different mesh sizes and distributions were used to study the sensitivity of mesh parameters and the stability of the solutions. CutCell method that converts a volume mesh into a predominantly Cartesian mesh (that is, the mesh consists of mostly hexahedral elements, with faces that are aligned with the coordinates axes) was used. In case of complex geometry smaller elements were used and the interfaces between the different size elements were non-conformal.
Calculations were performed at 11 different pressure difference values between the pipe inlet and outlet varying from 50 to 2500 Pa. This corresponds to typical average velocities in WDS ranging from 0.2 to 1.34 m/s. The surface roughness of the pipe model was 1–2 mm. CFD was used to calculate the average flow rate at different pressure differences. Those flow values were used as inputs for the EPANET2 model and a simple optimization procedure was applied to deduce the estimated roughness values at different pressure differences. Results of the CFD and EPANET2 calculations are presented in the next section.
3. Results
In Table 1 the modelling results of CFD and EPANET2 are presented. The pipe surface roughness in CFD model in the presented case was 1 mm and the pipe cross-section was deformed in 4 places over the pipe length (Figure 3). In EPANET2 the pipe section had a uniform cross-section with an internal diameter of 100 mm. The pipe surface roughness was estimated using a simple optimization procedure to meet the required pressure drop at the predefined flow rate.
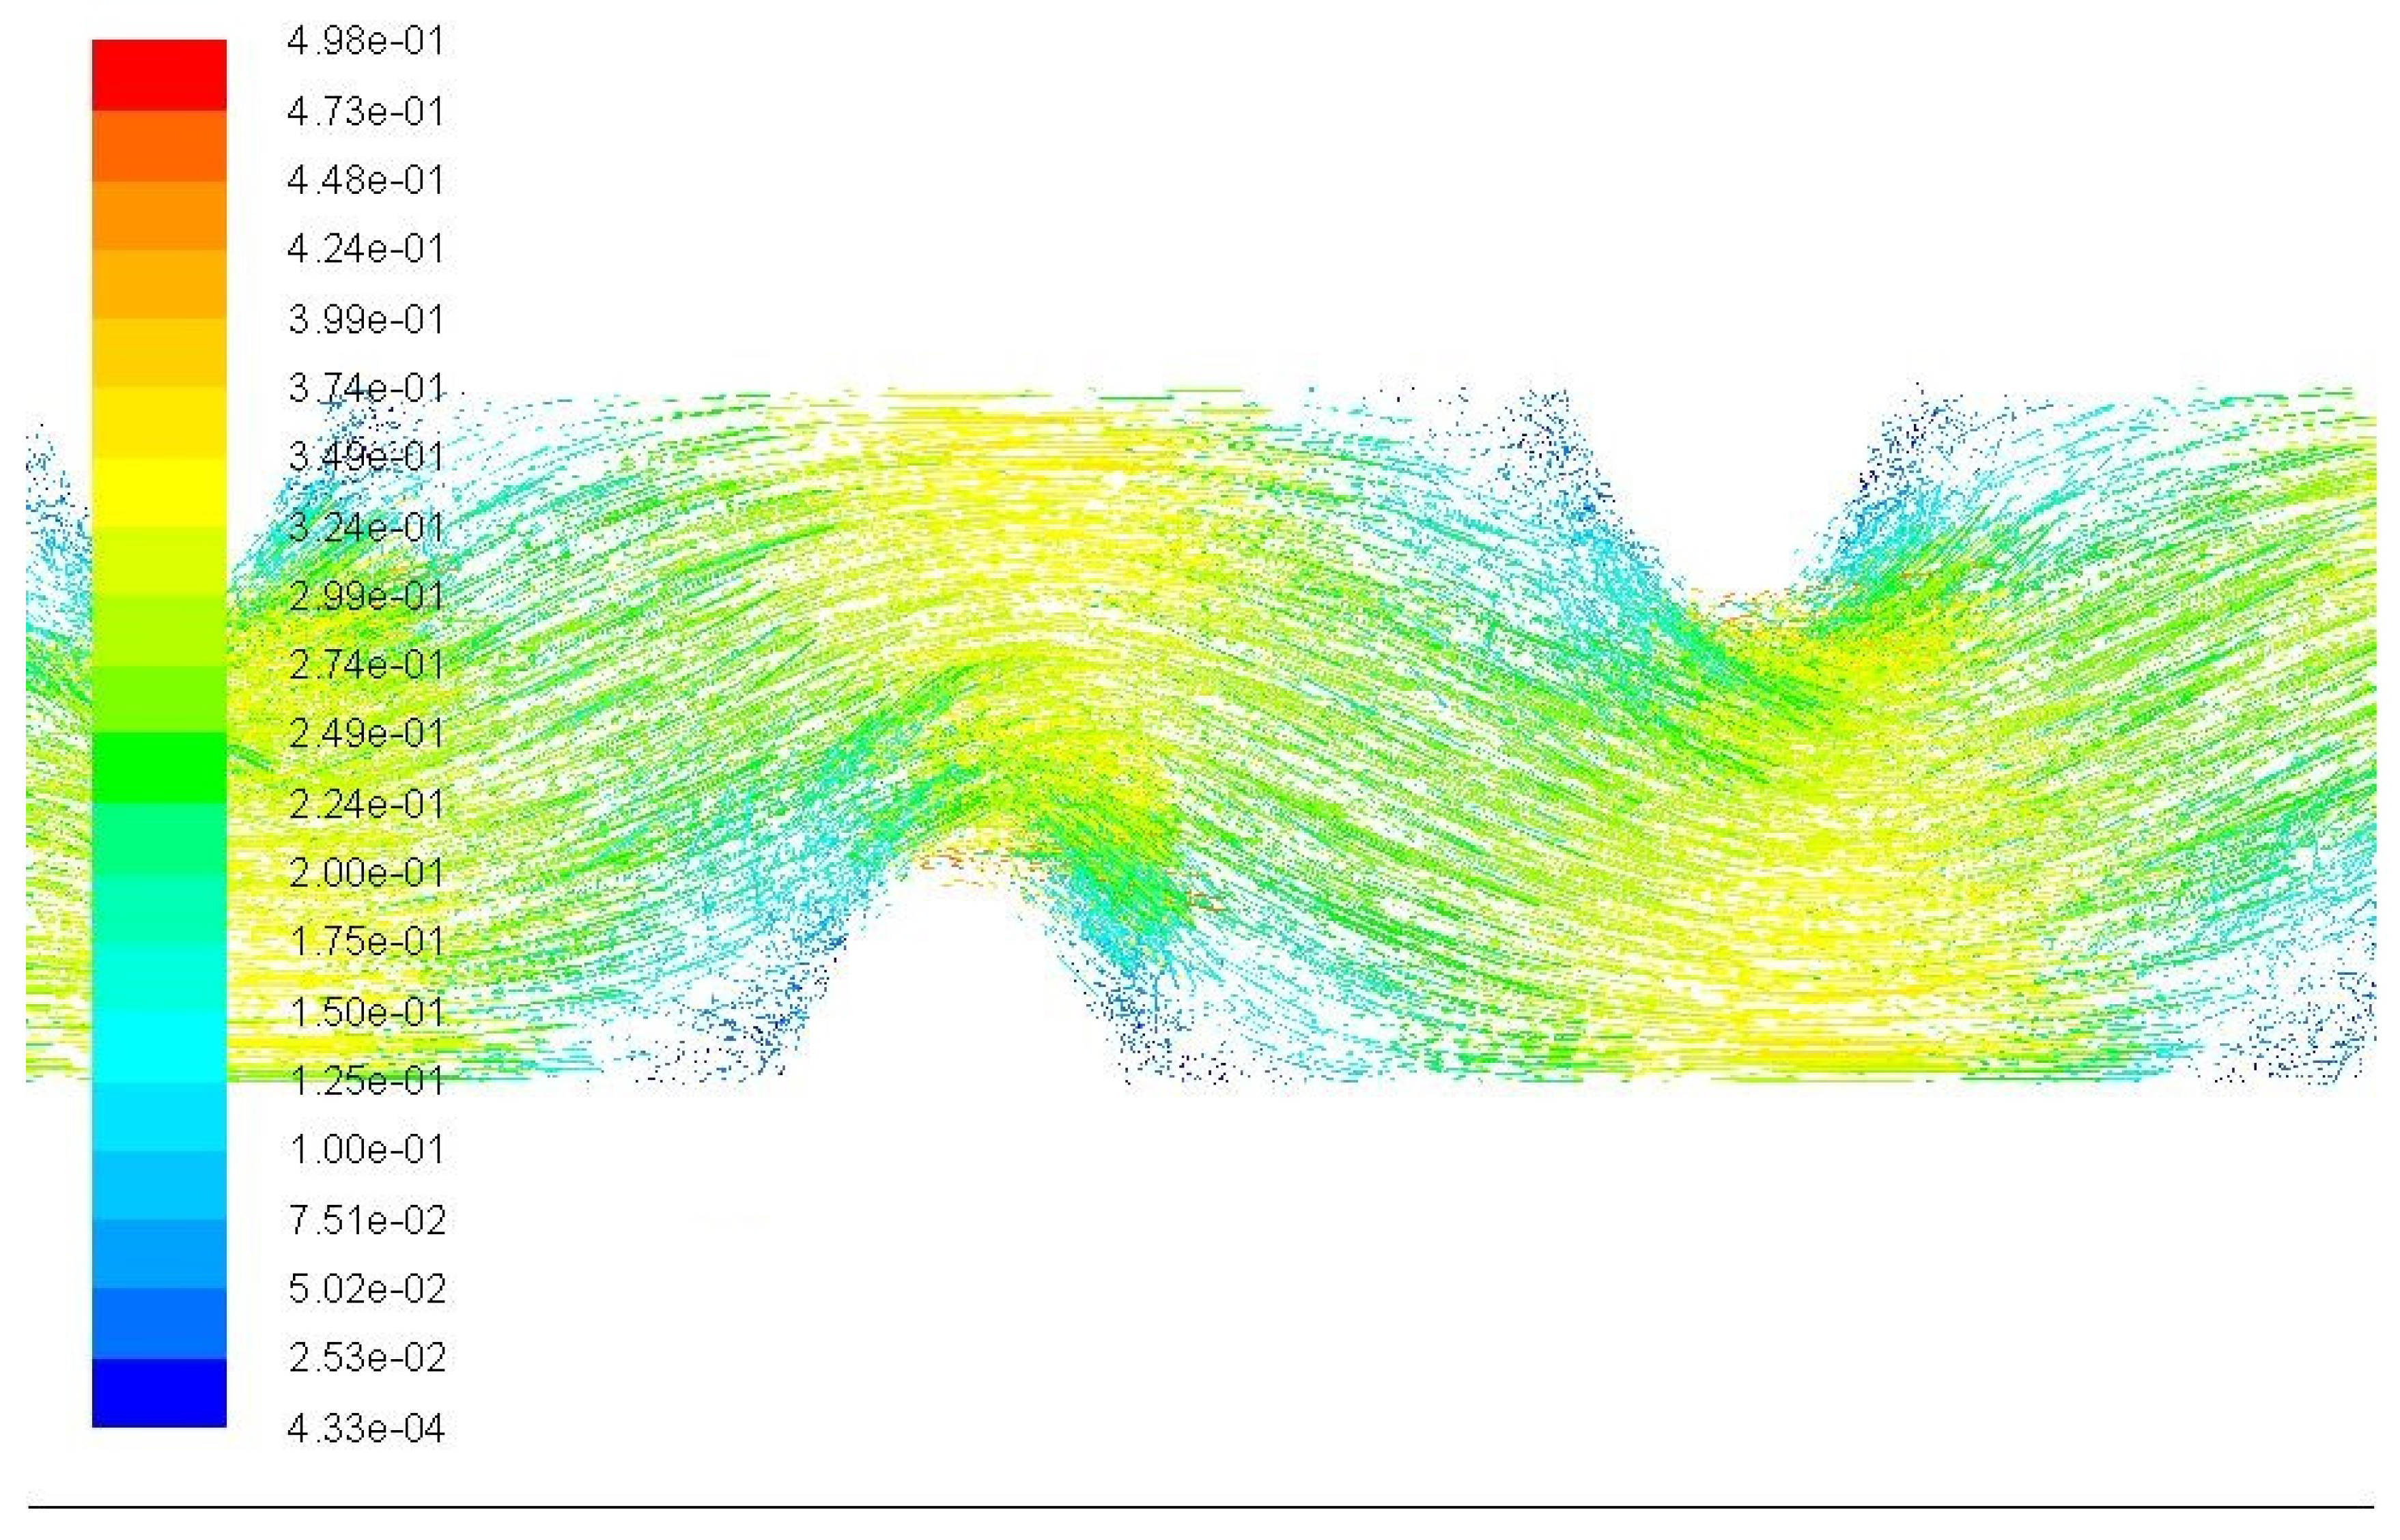
The flow in a pipe with irregular wall roughness (leading to non-circular cross section) is not uniform. In Figure 4 the axial velocity distribution and streamlines in case of 50 Pa pressure drop are shown. The flow direction in the pipe section is changing and flow velocity near the pipe wall deformations is close to zero. This means that the effective diameter of the deformed pipe is smaller than the nominal diameter used in WDS models. Smaller effective diameters lead to larger velocities that have to be taken into account especially in case of water quality modelling, but have a considerable effect on calculating pressure drop as well.
4. Discussion
In this study the wall roughness of a pipe with irregular inner wall surface was taken 1 mm. Roughness values calculated at the same pressure drop and flow rate by EPANET2 were up to 2.7 times higher than results from CFD model. Moreover, according to CFD, the roughness values were not constant. This leads to significant errors in WDS modelling. For example if one will take the average pipe roughness gained by EPANET2 and use it in the calculations, the error in estimating the pressure drop in the 0.5 m pipe segment would be 2.2 mm. In real WDS the pipe lengths can be hundreds of kilometers. So in case of a 1 km pipe the difference in the estimated pressure drop would be 2000 times larger, leading to 4.4 m error. Therefore in case of old rough pipes one should use nominal pipe diameters and take into account that roughness is dependent on Re number or try to estimate real pipe diameters while keeping the roughness values in a reasonable range [4]. The roughness values in a WDS model are much lower and more realistic in case of decreasing pipe diameters.
The aging process of pipes should rather be described by the reduction of their diameter and the increase of their absolute roughness than by the increase of absolute roughness only. It is especially important in case of water quality modelling and defining flow parameters in extreme conditions (e.g., fire flows). Simple CFD modelling reveals that the streamlines in a pipe with deformed cross section curve and the effective pipe diameter decreases compared to the nominal diameter. Calculations show that the mean velocity in EPANET2 is underestimated in this case around 10%. This is significant when modelling the propagation rate of the contamination in a WDS. For example inspections in water systems in Bergen, Norway and Tallinn, Estonia have shown that nominal pipe diameter can be reduced up to 50%. Flow variations in WDS could lead to sedimentation in pipes [14] and velocity changes cause sediment settling in the lower half of the horizontal pipe (in case of low velocities) or settling on the entire pipe wall (in case of higher velocities) [15]. This means that the diameter in old pipes is not homogenous along its length and the flow conditions in the conduits should be taken into account while calibrating the WDS model.
5. Conclusions
This study shows that:
- In case of pipes with non-homogenous diameter the flow velocity is larger than in pipes with nominal diameter, leading to errors in water quality modelling and risk assessment in WDS.
- The pipe wall roughness in old pipes is not constant at different Re numbers when using nominal diameters. This should be taken into account in WDS models to decrease the modelling errors.
- Sedimentation settling may reduce the pipe nominal diameter up to 50%, which will lead to large roughness values in WDS model calibration. Therefore the flow conditions and pipe installation age should be taken into account in the model preparation phase. Actual pipe diameters should be estimated and used in the WDS model calibration because this leads to more realistic roughness values and average flow velocities. This is very important in case of water quality modelling and risk assessment.
Author Contributions
K.K. and I.A. conceived, designed and performed the experiments to calibrate the CFD models; A.V., K.K. and I.A. performed the numerical study; A.V. prepared and performed the EPANET2 calculations; N.K. prepared and performed the pipe specimen investigations. All authors contributed to writing the paper.
Acknowledgments
The research was supported by the Institutional Research Funding IUT19-17 at Tallinn University of Technology.
Conflicts of Interest
The authors declare no conflict of interest.
References
- Lansey, K.E.; El-Shorbagy, W.; Ahmed, I.; Araujo, J.; Haan, C.T. Calibration assessment and data collection for water distribution networks. J. Hydraul. Eng. 2001, 127, 270–279. [Google Scholar] [CrossRef]
- Christensen, R.T.; Spall, R.E.; Barfuss, S.L. Application of three RANS turbulence models to aged water transmission pipes. J. Hydraul. Eng. 2011, 137, 135–139. [Google Scholar] [CrossRef]
- Vassiljev, A.; Koppel, T. Estimation of real-time demands on the basis of pressure measurements by different optimization methods. Adv. Eng. Softw. 2015, 80, 67–71. [Google Scholar] [CrossRef]
- Annus, I.; Vassiljev, A. Different approaches for calibration of an operational water distribution system containing old pipes. Procedia Eng. 2015, 119, 526–534. [Google Scholar] [CrossRef]
- Boxall, J.B.; Saul, A.J.; Skipworth, P.J. Modeling for hydraulic capacity. J. Am. Water Works Assoc. 2004, 96, 161–169. [Google Scholar] [CrossRef]
- Vijiapurapu, S.; Cui, J. Performance of turbulence models for flows through rough pipes. Appl. Math. Model. 2010, 34, 1458–1466. [Google Scholar] [CrossRef]
- Vijiapurapu, S.; Cui, J. Simulation of turbulent flow in a ribbed pipe using large eddy simulation. Numer. Heat Transf. A Appl. 2007, 51, 1137–1165. [Google Scholar] [CrossRef]
- Stel, H.; Morales, R.E.M.; Franco, A.T.; Junqueira, S.L.M.; Erthal, R.H.; Gonc¸alves, M.A.L. Numerical and experimental analysis of turbulent flow in corrugated pipes. ASME J. Fluids Eng. 2010, 132, 071203. [Google Scholar] [CrossRef]
- Stel, H.; Franco, A.T.; Junqueira, S.L.M.; Erthal, R.H.; Mendes, R.; Gonc¸alves, M.A.L.; Morales, R.E.M. Turbulent flow in d-type corrugated pipes: Flow pattern and friction factor. ASME J. Fluids Eng. 2012, 134, 121202. [Google Scholar] [CrossRef]
- Calomino, F.; Tafarojnoruz, A.; De Marchis, M.; Gaudio, R.; Napoli, E. Experimental and numerical study in the flow field and friction factor in a pressurized corrugated pipe. J. Hydraul. Eng. 2015, 141, 04015027. [Google Scholar] [CrossRef]
- Kändler, N. Optimal Algorithm for Rehabilitation of a Water Distribution Network. Master’s Thesis, Tallinn University of Technology, Tallinn, Estonia, 2002. [Google Scholar]
- Wilcox, D.C. Turbulence Modeling for CFD; DCW Industries Inc.: La Canada, CA, USA, 1998. [Google Scholar]
- Annus, I.; Kaur, K.; Vassiljev, A.; Laanearu, J.; Šanin, M. Flow dynamics in a pipe with a sudden change in diameter. In Proceedings of the 14th International CCWI Conference, Amsterdam, The Netherlands, 7–9 November 2016; pp. 1–8. [Google Scholar]
- Vreeburg, J.H.G.; Blokker, E.J.M.; Horst, P.; van Dijk, J.C. Velocity-based self-cleaning residential drinking water distribution systems. Water Sci. Technol. Water Supply 2009, 9, 635–641. [Google Scholar] [CrossRef]
- Vreeburg, J.H.G.; Boxall, J.B. Discolouration in potable water distribution systems: A review. Water Res. 2007, 41, 519–529. [Google Scholar] [PubMed]
Figure 1.
Typical pipe wall build-up: (a) evenly distributed roughness; (b) unevenly distributed roughness. Samples from Tallinn WDS [11].
Figure 1.
Typical pipe wall build-up: (a) evenly distributed roughness; (b) unevenly distributed roughness. Samples from Tallinn WDS [11].
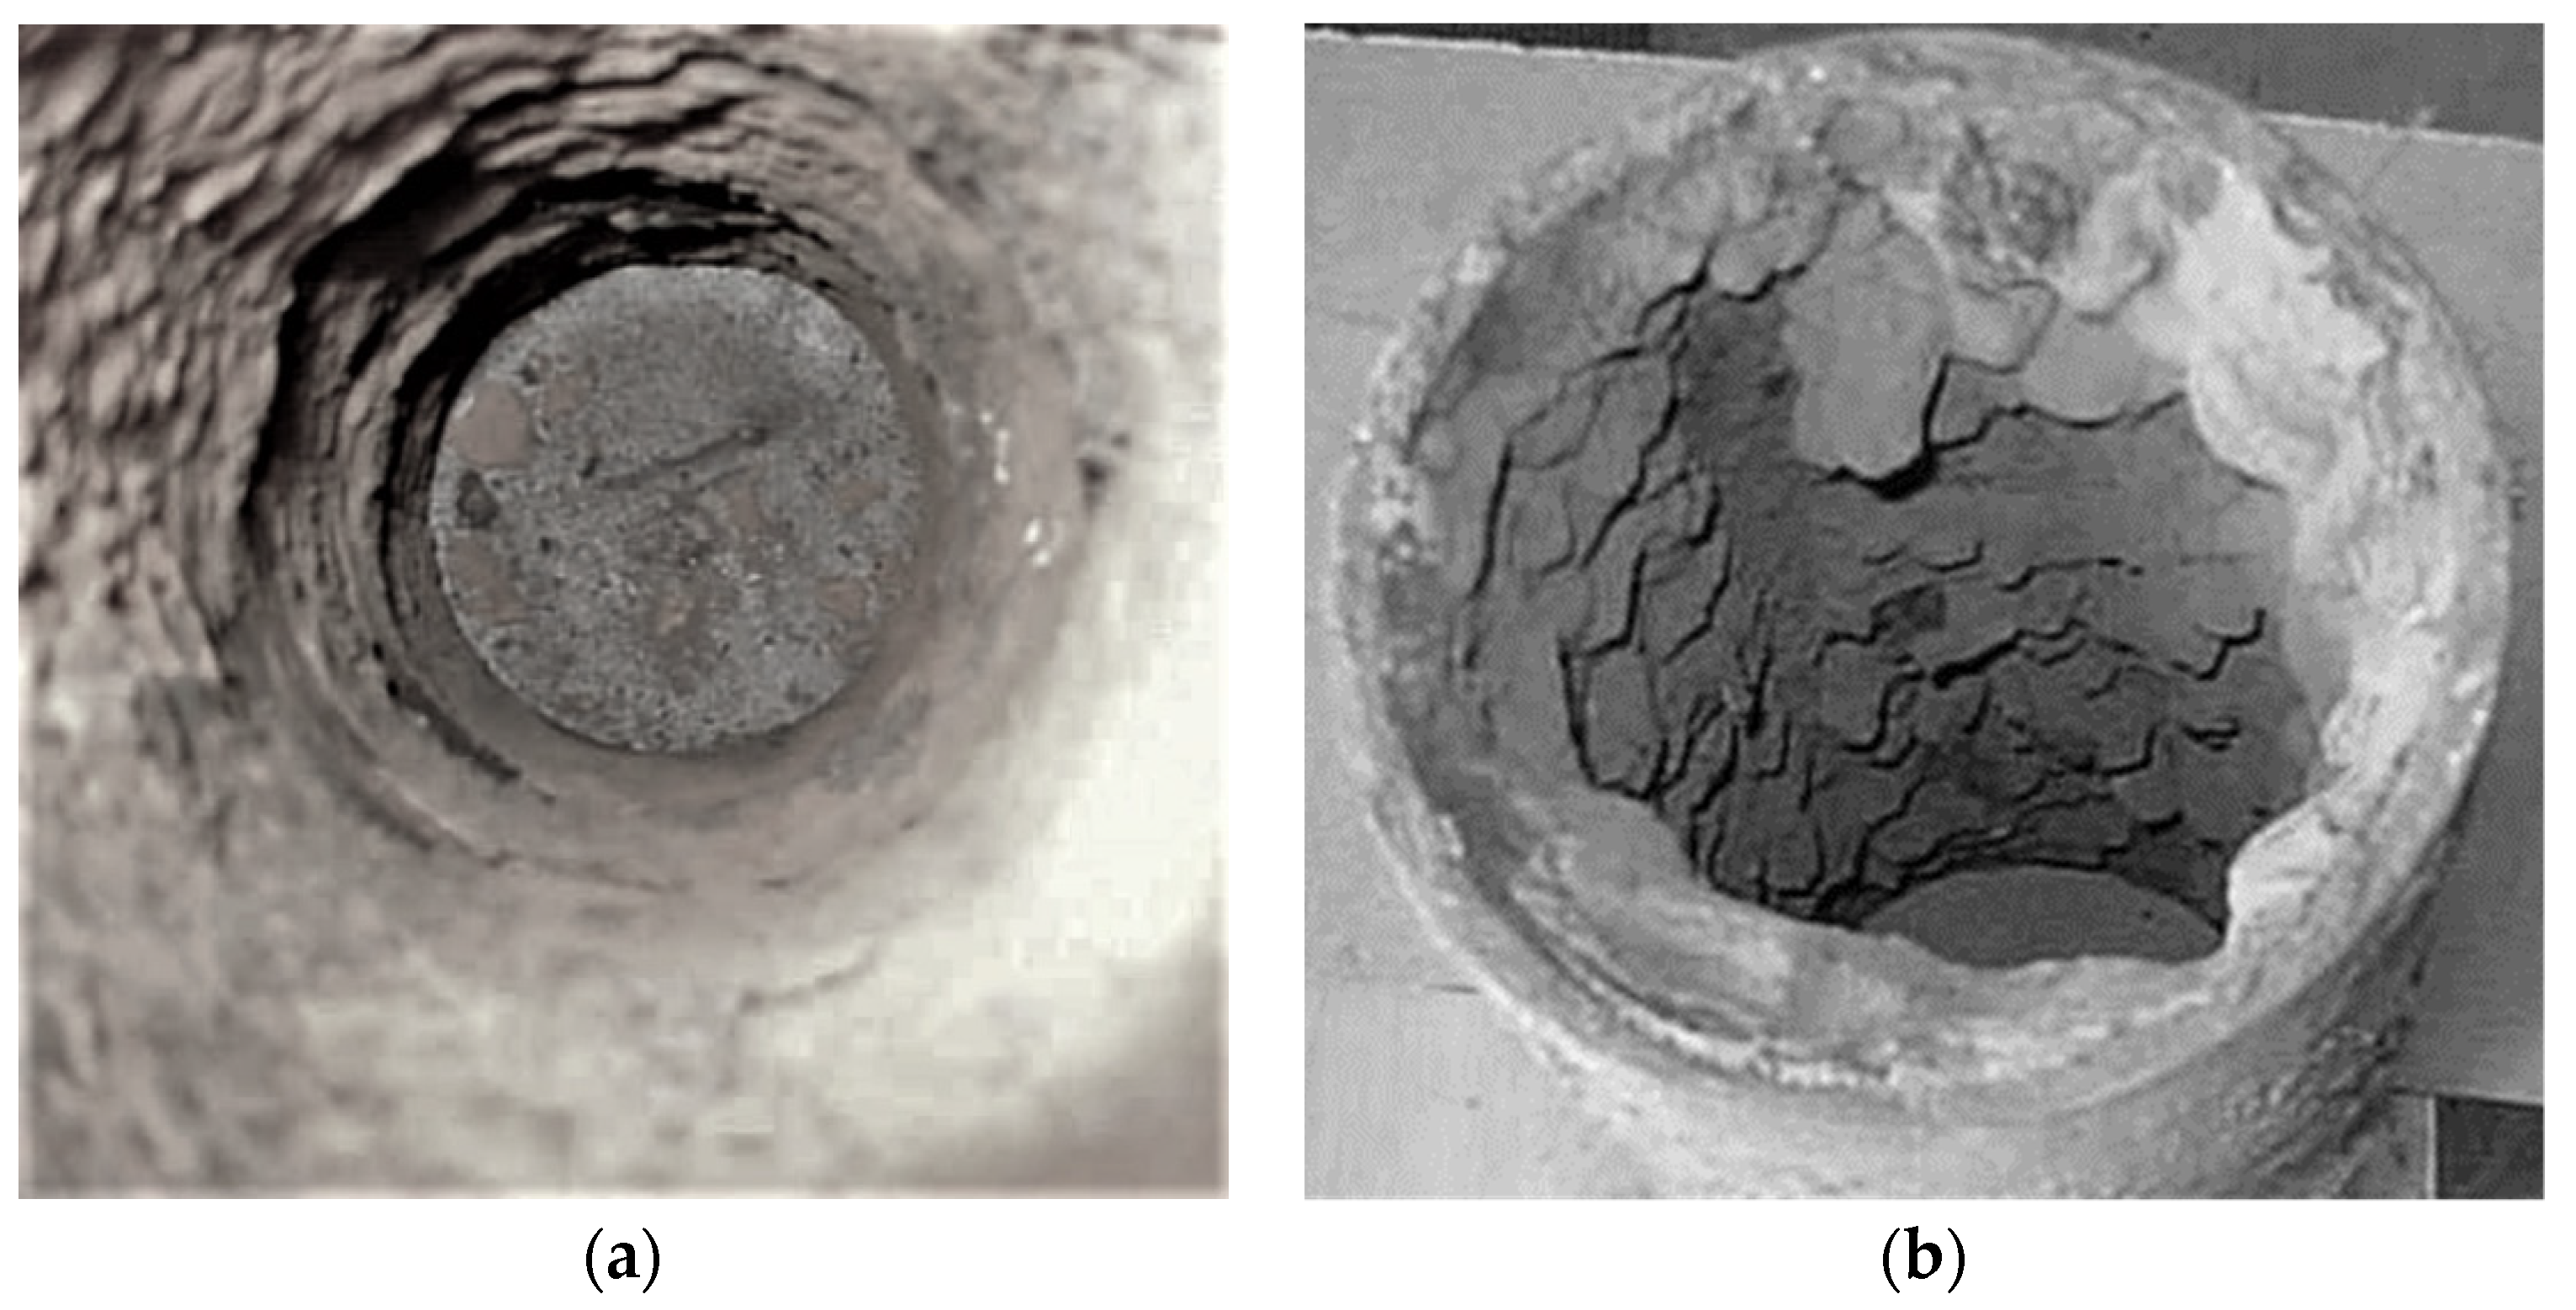
Figure 2.
3D visualization of a random surface pattern.
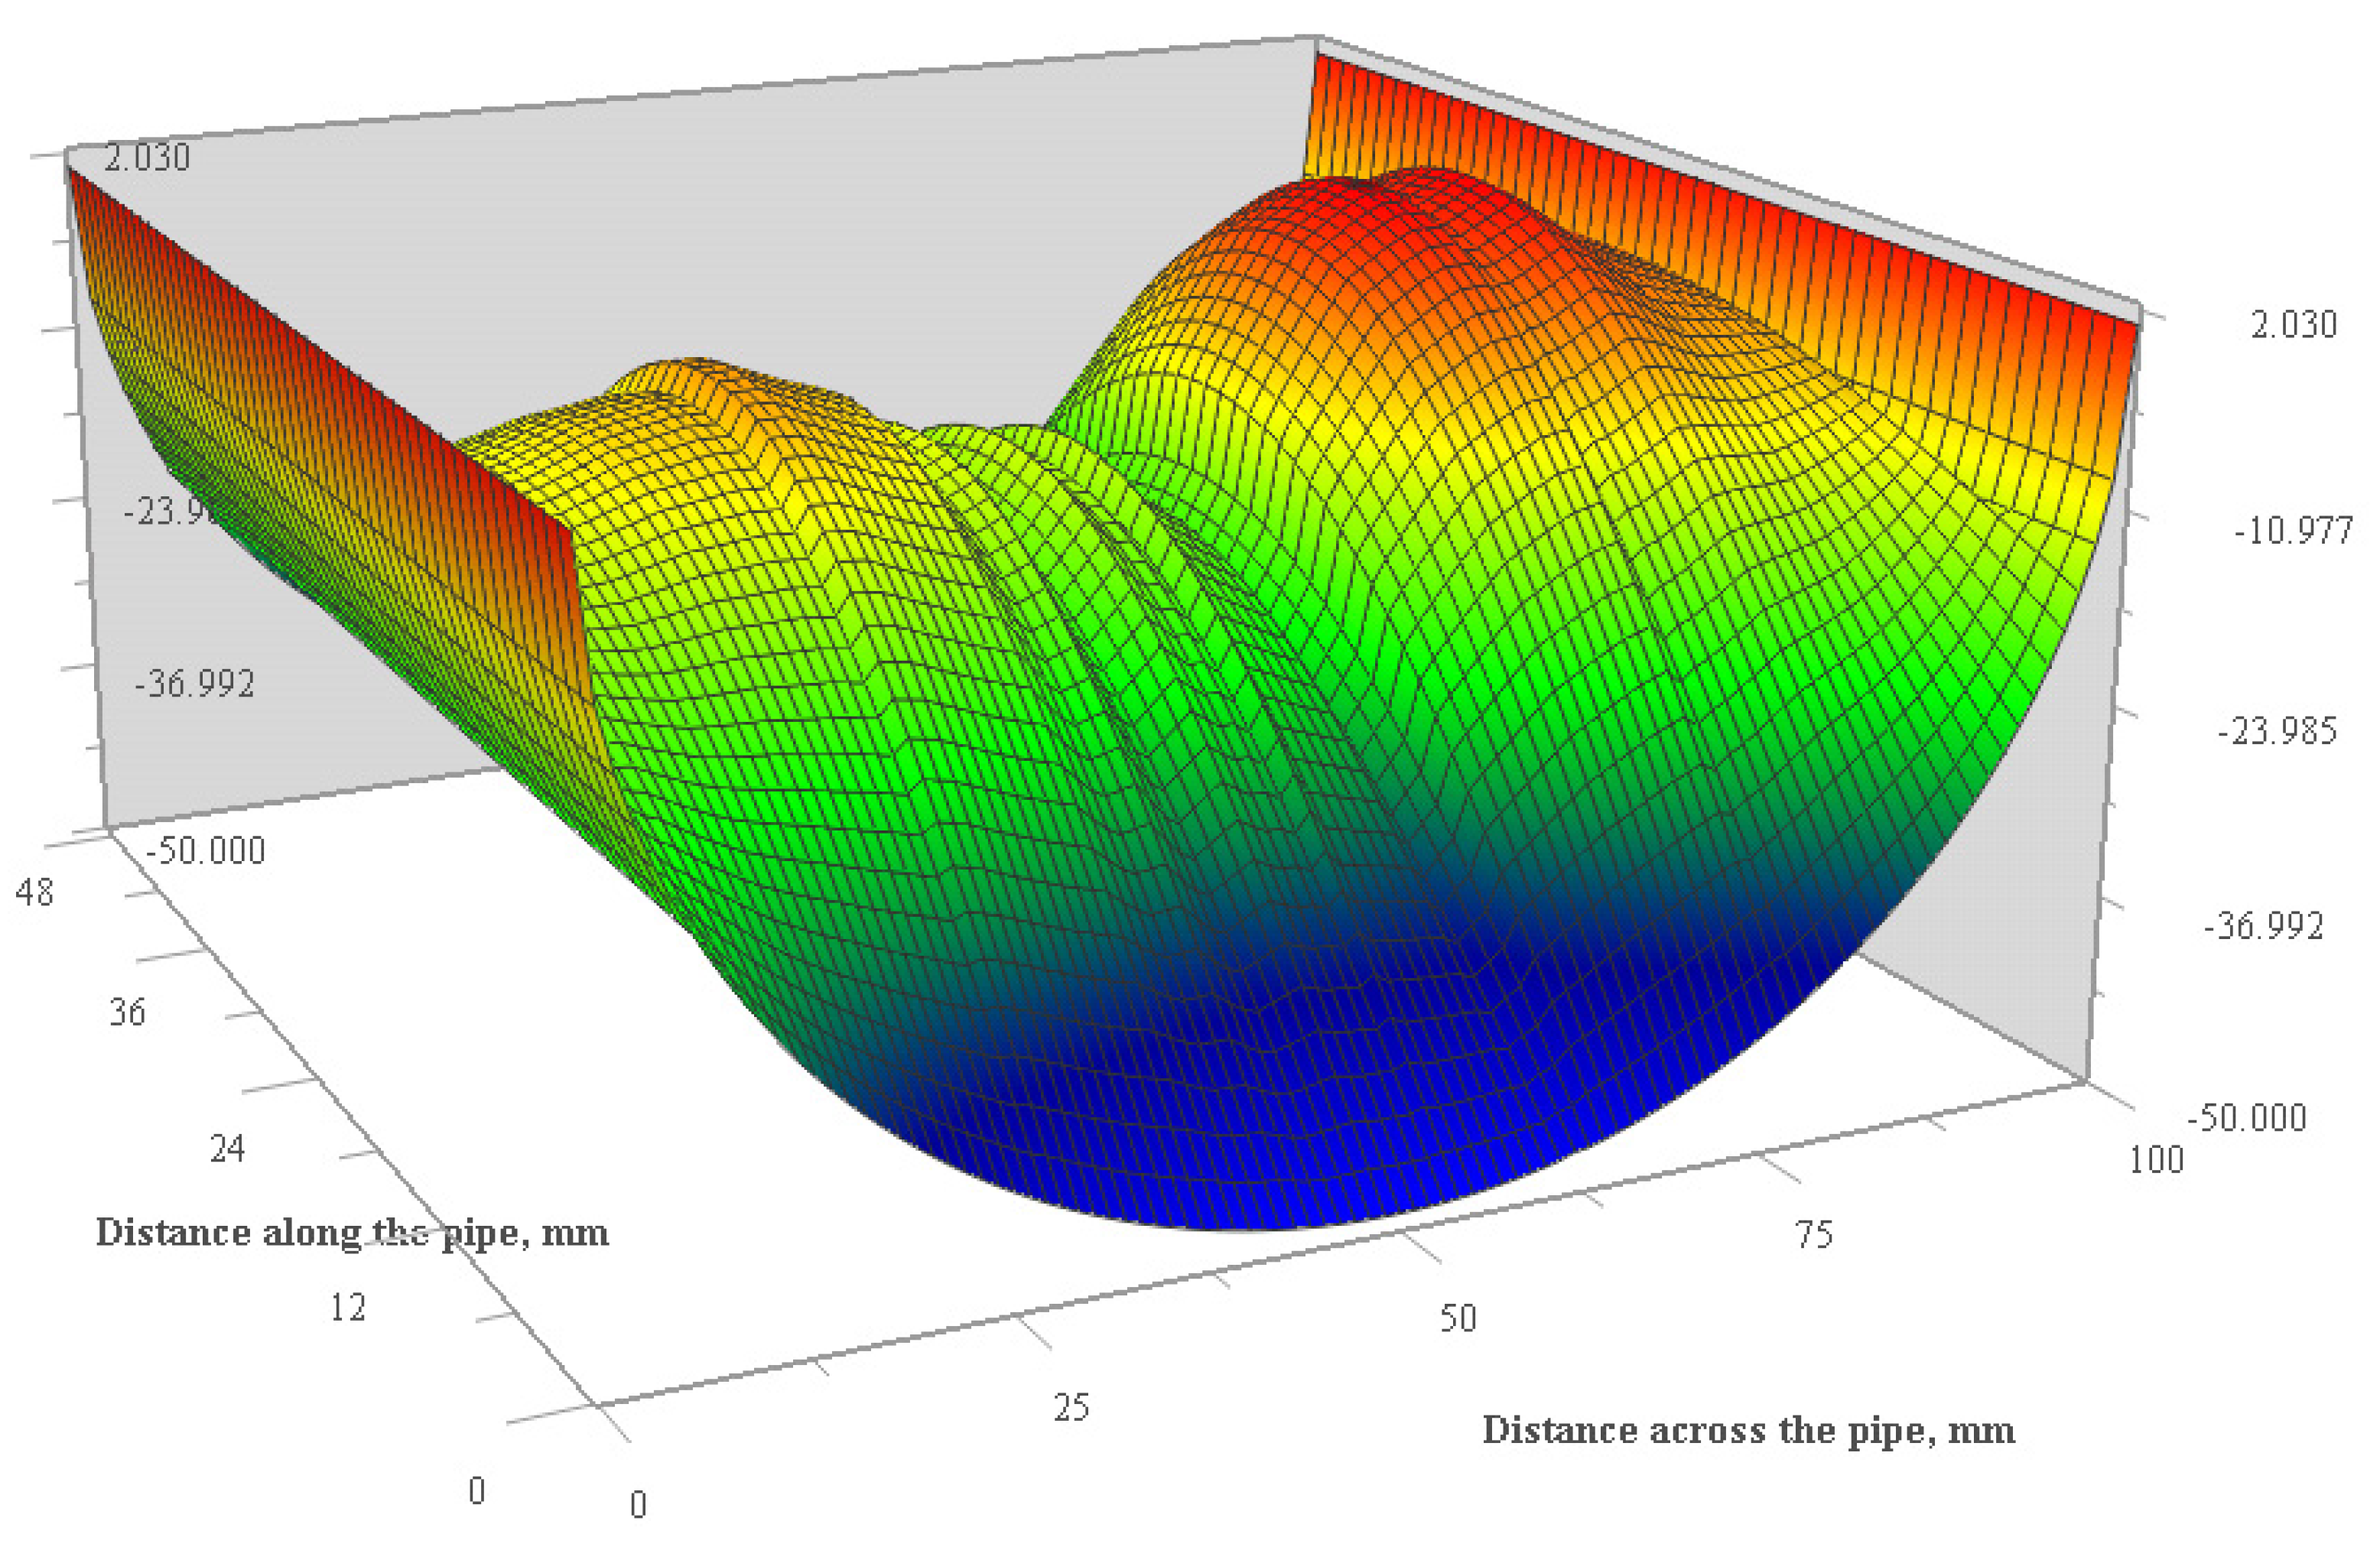
Figure 3.
Locations of pipe deformations over the pipe length (pipe length = 0.5 m, diameter = 100 mm).
Figure 3.
Locations of pipe deformations over the pipe length (pipe length = 0.5 m, diameter = 100 mm).

Figure 4.
Streamlines and distribution of axial velocity (m/s) in a pipe with non-homogenous cross-section.
Figure 4.
Streamlines and distribution of axial velocity (m/s) in a pipe with non-homogenous cross-section.

Table 1.
Modelled average velocities and estimated roughness using CFD and EPANET2.
| Pressure Drop, Pa | QCFD, L/s | Umean, CFD, m/s | Roughness in CDF Model, mm | Roughness Estimated by EPANET2, mm | Umean at Nominal Diameter, m/s |
|---|---|---|---|---|---|
| 2500 | 10.50 | 1.48 | 1.00 | 2.66 | 1.34 |
| 2000 | 9.46 | 1.33 | 1.00 | 2.56 | 1.20 |
| 1500 | 8.27 | 1.17 | 1.00 | 2.43 | 1.05 |
| 1100 | 7.15 | 1.01 | 1.00 | 2.3 | 0.91 |
| 900 | 6.51 | 0.92 | 1.00 | 2.22 | 0.83 |
| 700 | 5.80 | 0.82 | 1.00 | 2.09 | 0.74 |
| 500 | 4.96 | 0.70 | 1.00 | 1.96 | 0.63 |
| 300 | 3.89 | 0.55 | 1.00 | 1.81 | 0.49 |
| 200 | 3.19 | 0.45 | 1.00 | 1.74 | 0.41 |
| 100 | 2.26 | 0.32 | 1.00 | 1.66 | 0.29 |
| 50 | 1.60 | 0.23 | 1.00 | 1.59 | 0.20 |
Publisher’s Note: MDPI stays neutral with regard to jurisdictional claims in published maps and institutional affiliations. |
© 2018 by the authors. Licensee MDPI, Basel, Switzerland. This article is an open access article distributed under the terms and conditions of the Creative Commons Attribution (CC BY) license (https://creativecommons.org/licenses/by/4.0/).
Share and Cite
MDPI and ACS Style
Kaur, K.; Annus, I.; Vassiljev, A.; Kändler, N. Determination of Pressure Drop and Flow Velocity in Old Rough Pipes. Proceedings 2018, 2, 590. https://doi.org/10.3390/proceedings2110590
AMA Style
Kaur K, Annus I, Vassiljev A, Kändler N. Determination of Pressure Drop and Flow Velocity in Old Rough Pipes. Proceedings. 2018; 2(11):590. https://doi.org/10.3390/proceedings2110590
Chicago/Turabian StyleKaur, Katrin, Ivar Annus, Anatoli Vassiljev, and Nils Kändler. 2018. "Determination of Pressure Drop and Flow Velocity in Old Rough Pipes" Proceedings 2, no. 11: 590. https://doi.org/10.3390/proceedings2110590