Statistical Measures: Promising Features for Time Series Based DDoS Attack Detection †


Department of Electrical and Electronics Engineering, Boğaziçi University, Istanbul 34342, Turkey
*
Author to whom correspondence should be addressed.
†
Presented at the International Workshop on Computational Intelligence for Multimedia Understanding (IWCIM), Kos Island, Greece, 2 September 2017.
Proceedings 2018, 2(2), 96; https://doi.org/10.3390/proceedings2020096
Published: 10 January 2018
(This article belongs to the Proceedings of International Workshop on Computational Intelligence for Multimedia Understanding (IWCIM))
Abstract
:Data availability should be guaranteed by a web service in order to satisfy customers. One of the main challenges of information security professionals is DDoS attack which affects the availability. By masquerading itself as a legitimate user, a DDoS attacker tries to overwhelm a server by sending a great number of useless packets that influences the quality of service (QoS) of the network. DDoS attack can result in a great damage to network services. Useless packets similar to normal ones are dispatched by the attacker which leaves the intrusion detection system impotent of detection. Transferring from conventional packet-based analysis methods to time series based (flow-based) algorithms would be a promising alternative to spot DDoS attacks. In this work, we extract four measures of periodicity, kurtosis, skewness and self-similarity of a time series and investigate the performance of these parameters in separating DDoS attack from normal traffic.
1. Introduction
Nowadays, Internet and in general on-line activities have become integral parts of our lives. Exchanging critical information such as credit card numbers, passwords, personal information and etc., via Internet, make it an appropriate target for cyber-criminals to carry out their illegal activities. Therefore, all information security considerations should be taken into account to prevent any illicit activities. One of the main concern of information security is availability. Availability means that a web server should provide service to its authorized clients in all conditions without any interruption. Distributed Denial of Service (DDoS) attacks threat this criterion [1,2]. By finding and compromising a large number of vulnerable unaware users, so called Zombies, through the Internet, a DDoS attacker makes an army to flood a victim server with a large number of spurious packets [3]. As the attack begins, the victim tries to reply to incoming packets, eventually, because of the limited resources, the victim will be overwhelmed and become out of reach from its legitimate users. Additionally, packets source IP are also spoofed to make the tracing back difficult during the attack investigation [4]. In general two detection approaches of signature based and anomaly based are used by IDSs [5]. In the signature based method, a set of known malicious activities is fed to the system, some specific features are extracted and used as the signature of those activities. When a new activity is introduced to the system, its features are compared with the database and any match is reported as intrusion. This method cannot detect new intrusions which are not in its database [6]. In anomaly based approach, the pattern of normal activity is determined and any structure out of this model is reported as intrusion. The detection rate of this approach is less than that of in signature-based method [5].
Traditional detection systems implement packet level analysis to extract features [7]. In this method, payloads of arrival packets are scrutinized and specific attributes which are different in normal and abnormal activities are obtained. Most of the new DDoS attacks mimic the legitimate web service traffic, which leaves the traditional methods ineffective in detecting intrusions. Flow level analysis and treating DDoS attack as a time series would be an alternative for traditional methods. In this method, at each specific time interval, the number of arriving packets or the number of flows are counted, a time series is generated and its statistical features are obtained to separate attack from normal traffic.
2. Related Work
Different literatures have employed the capability of the time series based methods to analyze traffic patterns, and to discover abnormalities. Authors in [10], proposed an ARIMA model time series to detect DDoS attack. Number of packets in every one minute is sampled. Then number of packets in the following minute is estimated using ARIMA model. The repeatability of chaotic behavior and the enormous growth in the ratio of number of packets to the number of source IP are used to identify attack. A real-time application layer DDoS attack detection based on time series analysis is proposed in [11]. The time series is generated based on the entropy of HTTP GET request per source IP address. Adaptive autoregressive model (AAR) is employed to create time series. Support vector machine (SVM) classifier is implemented to classify attack. Authors in [12] propose a wavelet based anomaly detection algorithm. The anomalous activities in a network traffic are determined by using high-band wavelet components. Authors in [13] use spectral analysis to detect shrew DDoS attack in TCP/UDP streams. Using two deviation scores obtained from power spectrum of the traffic flow, authors in [14] classify traffics of an NGMN as normal, DoS and DDoS. Authors show that the energy of power spectrum of Dos and DDoS attacks are distributed in low and high frequency bands respectively. Authors in [15] based on statistical methods, propose an algorithm to detect bottleneck remotely. The strong frequencies in aggregate traffics are scrutinized to find bottlenecks. This algorithm is also applicable for DDoS attack detection. Authors in [16] propose a frequency based approached to detect specific types of DDoS attack called booters. Low frequency features obtained by combining spectrum, and discrete wavelet analysis, are used by a naive Bayes classifier to separate normal traffic from abnormal one.
In this paper, we contribute to previous works, by considering four statistical properties of a time series consisting of periodicity, kurtosis, skewness and self-similarity. By using binary hypothesis test, the capability of these measures to separate attack from normal traffic are examined.
3. Theory and Overview
3.1. Periodicity
In order to find the periodic component in a time series, we need to estimate power spectral density (PSD). The distribution of energy in different frequencies is revealed by PSD. Since period and frequency are the reverse of each other, dominant periods can be identified by finding frequencies which carry most of the energy. Periodogram and circular autocorrelation are two popular estimators that are used to find PSD [17]. Both methods are calculated using Discrete Fourier Transform (DFT) [18]. Assume X is the DFT of a sequence x with N samples. The periodogram is computed by squaring the length of each Fourier coefficient as:
which indicates the amount of energy at frequency , or equivalently, at period . Low accuracy in detection of large period components and spectral leakage are two main issues associated with this estimator [17]. The second way to find dominant periods in a time series is to estimate circular autocorrelation function(ACF):
which can be used as a metric to find how similar a sequence is to its previous values. ACF can address the problems related to periodogram estimator. This approach which will be used in this paper, is introduced in [17]. First we find candidate periods by using periodogram estimator. If a candidate period resides on the hill of ACF, we consider it as a true one, otherwise we discard it as a false alarm. In order to avoid high DC component at zero of periodogram causing by existing trend in the sequence, the trend is eliminated from the input sequence before introducing to the estimator.
3.2. Skewness and Kurtosis
The lack of symmetry in a distribution is identified by using skewness. If a distribution is symmetric, the left and right sides of its center look the same. For a time series x, the skewness is estimated by:
where and are mean value and standard deviation of the sequence respectively. The skewness of normal distribution is zero. Negative value of skewness indicates that the distribution is left skewed, on the other hand values greater than zero mean right skewed.
In order to find how flat or peaked a distribution compared to normal distribution, kurtosis is used. For a time series x, kurtosis is estimated by:
3.3. Self-Similarity (Long-Range Dependence)
Self-similarity is the property associated with the object whose structure is unchanged at different scales [19]. A stochastic process is self-similar if:
Equation (5) refers to the equality of probability distribution. a is the scaling factor and H is called the Hurst parameter. Using the Hurst exponent we can classify time series into types and gain some insight into their dynamics. In a Brownian time series (also known as a random walk or a drunkard’s walk) there is no correlation between the observations and a future observation. A Hurst exponent close to 0.5 is indicative of a Brownian time series. A Hurst exponent value between 0 and 0.5 is indicative of anti-persistent behavior and the closer the value is to 0, the stronger is the tendency for the time series to revert to its long-term means value. A Hurst exponent value between 0.5 and 1.0 indicates persistent behavior; the larger the H value the stronger the trend.
4. Discussion and Result
In this work, passive monitoring is used to obtain data for both normal and DDoS traffics. In order to generate time series , the number of arrival packets in each 1 ms are counted. Timestamps values in pcap files of CAIDA datasets are used to find arrival time. Having generated both attack and normal time series, each random process is further divided into 1024-length window. Finally, we have two matrices of normal and attack traffics. Each row is a 1024-length sample window of arrival packets. Statistical measures of each row consisting of periodicity, kurtosis, skewness and Hurst parameter are used as the features to segregate attack from normal traffic.
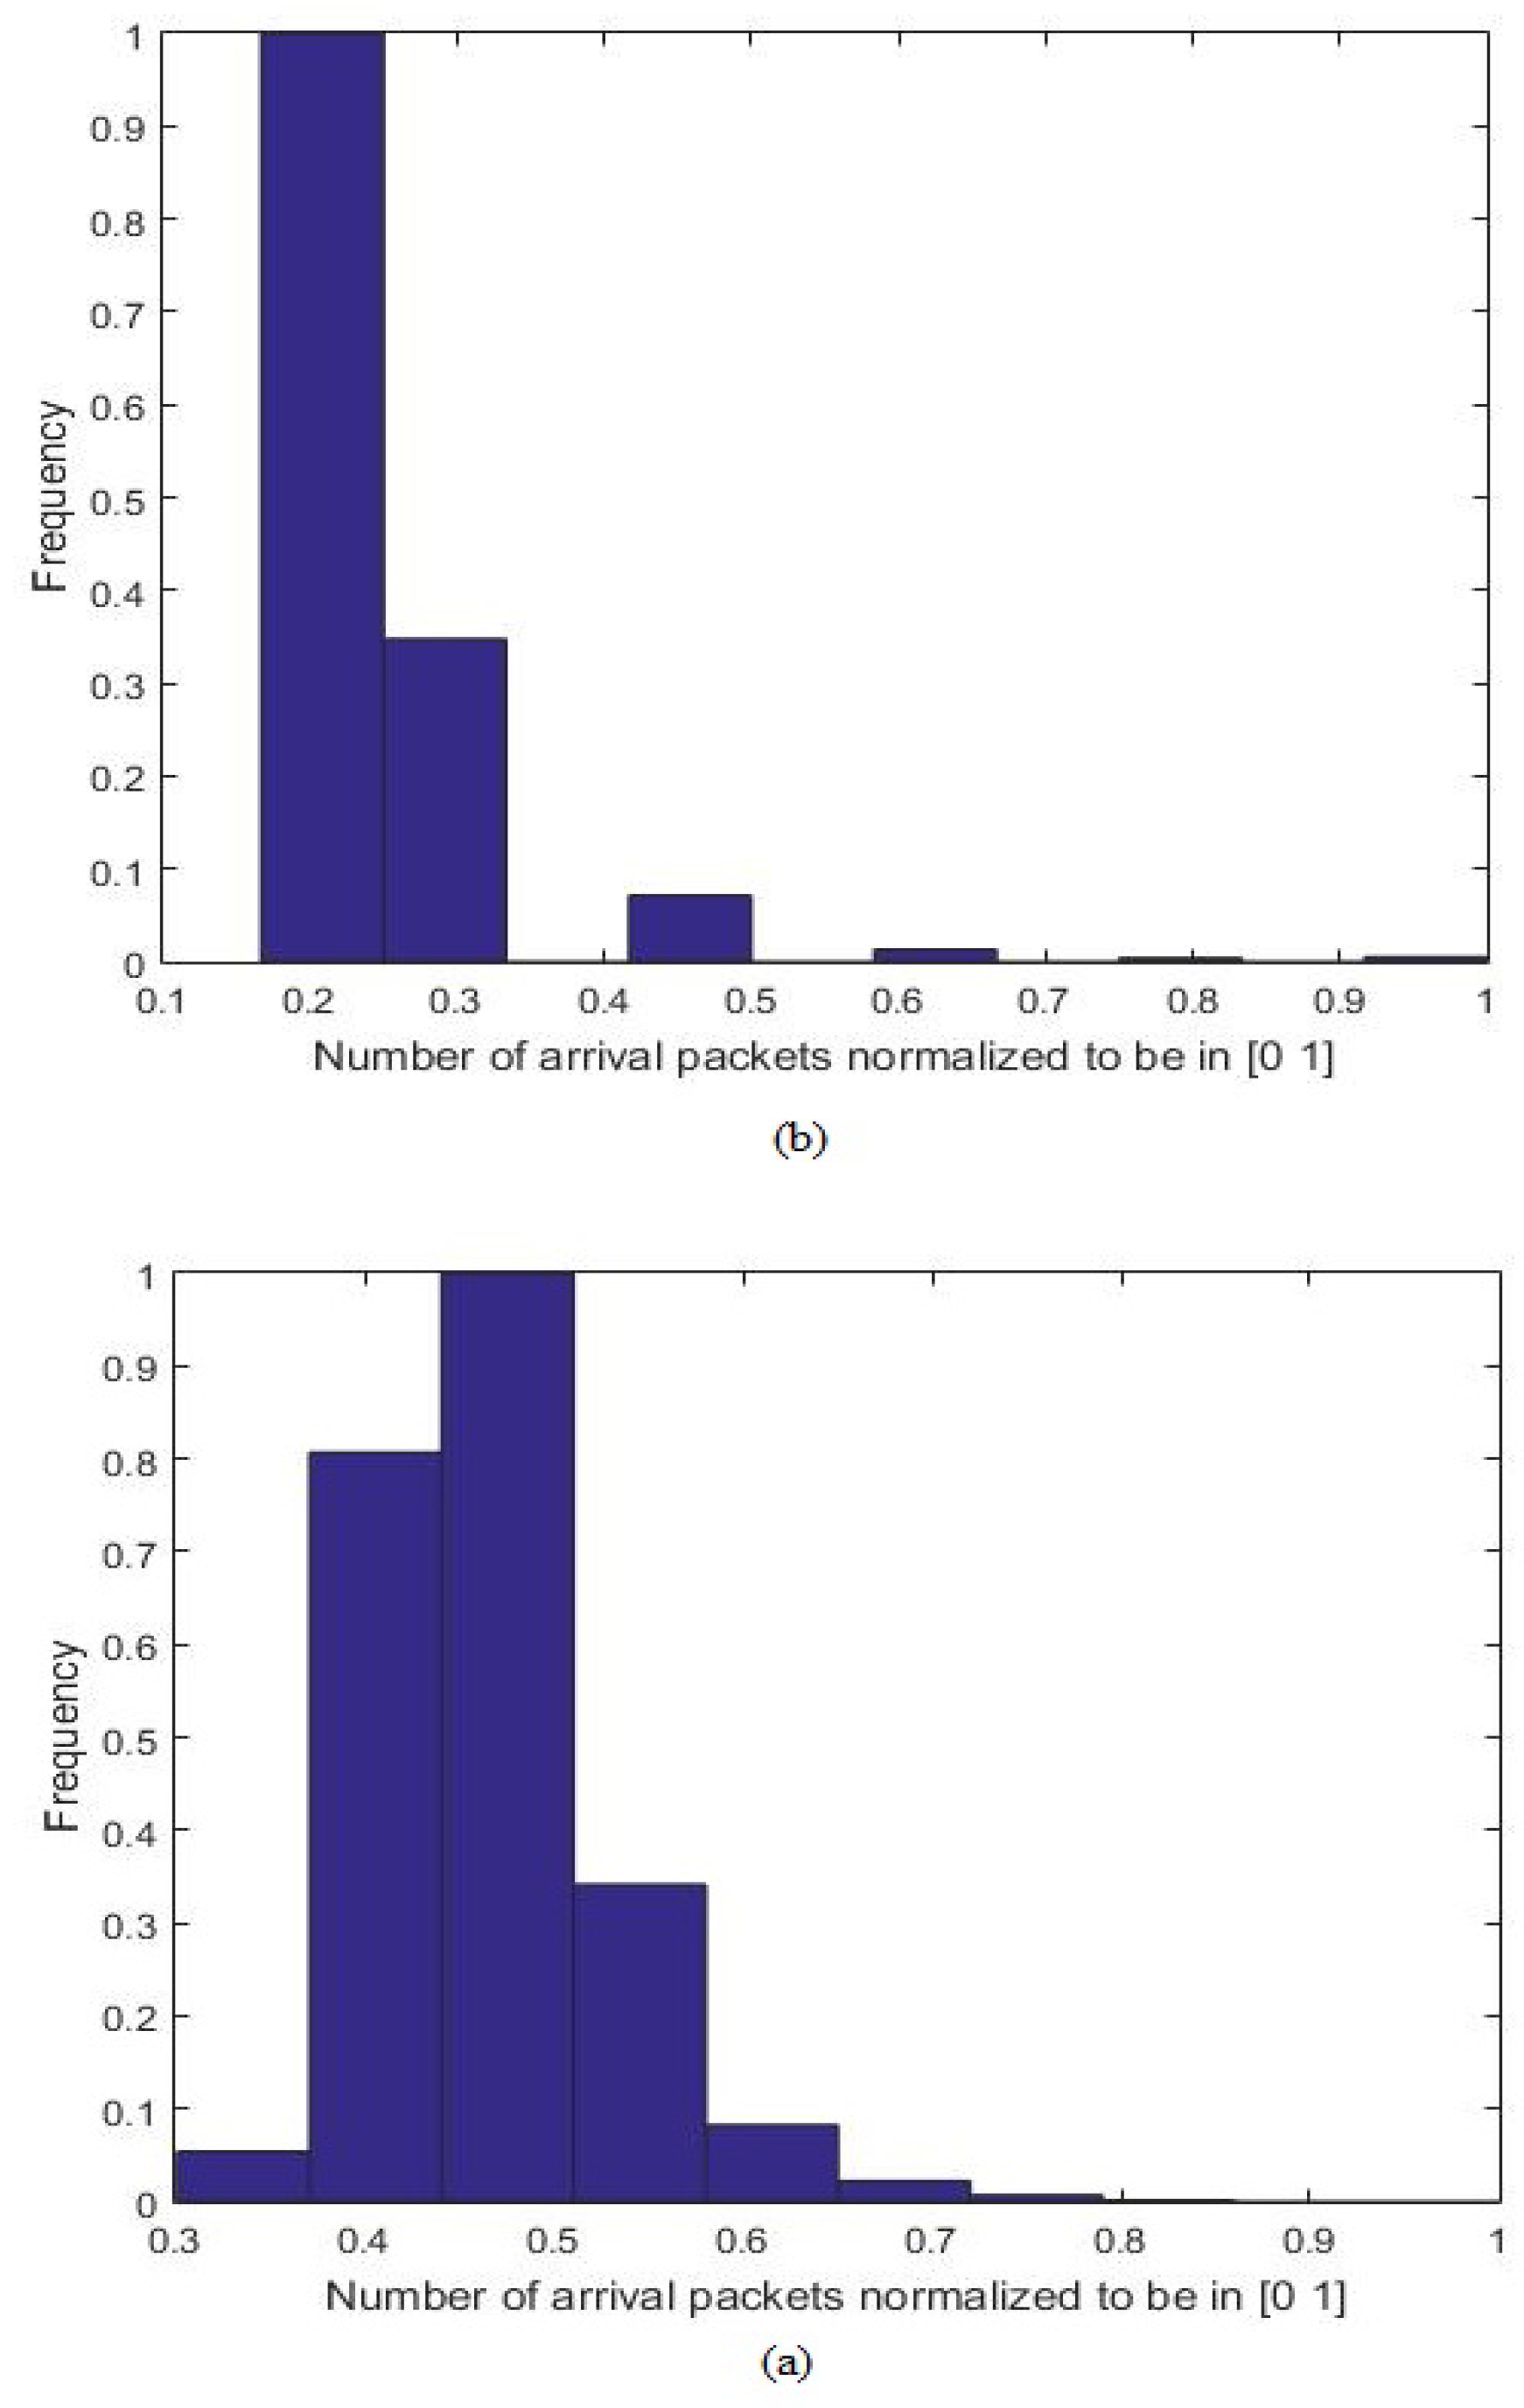
Each dataset consists of 400 windows. These two sets further divided into two subsets of Training and Test, which include 340 (85%), and 60 (15%) features respectively. Figure 1 displays the histogram of both normal and traffic packets number (The obtained ). Both histograms are normalized to make the number of arrival packets reside in [0 1] interval. From the Figure 1, it can be deduced that packet number by itself- cannot be a good feature to distinct attack from normal traffic; so, appropriate ones should be extracted from the packet number time series. Table 1 summarizes the statistical measures of both traffics. Both traffics are heavy tailed and right skewed. Table 1 confirms that both kurtosis and skewness could be used as the criteria to separate attack from normal traffic.
4.1. Training
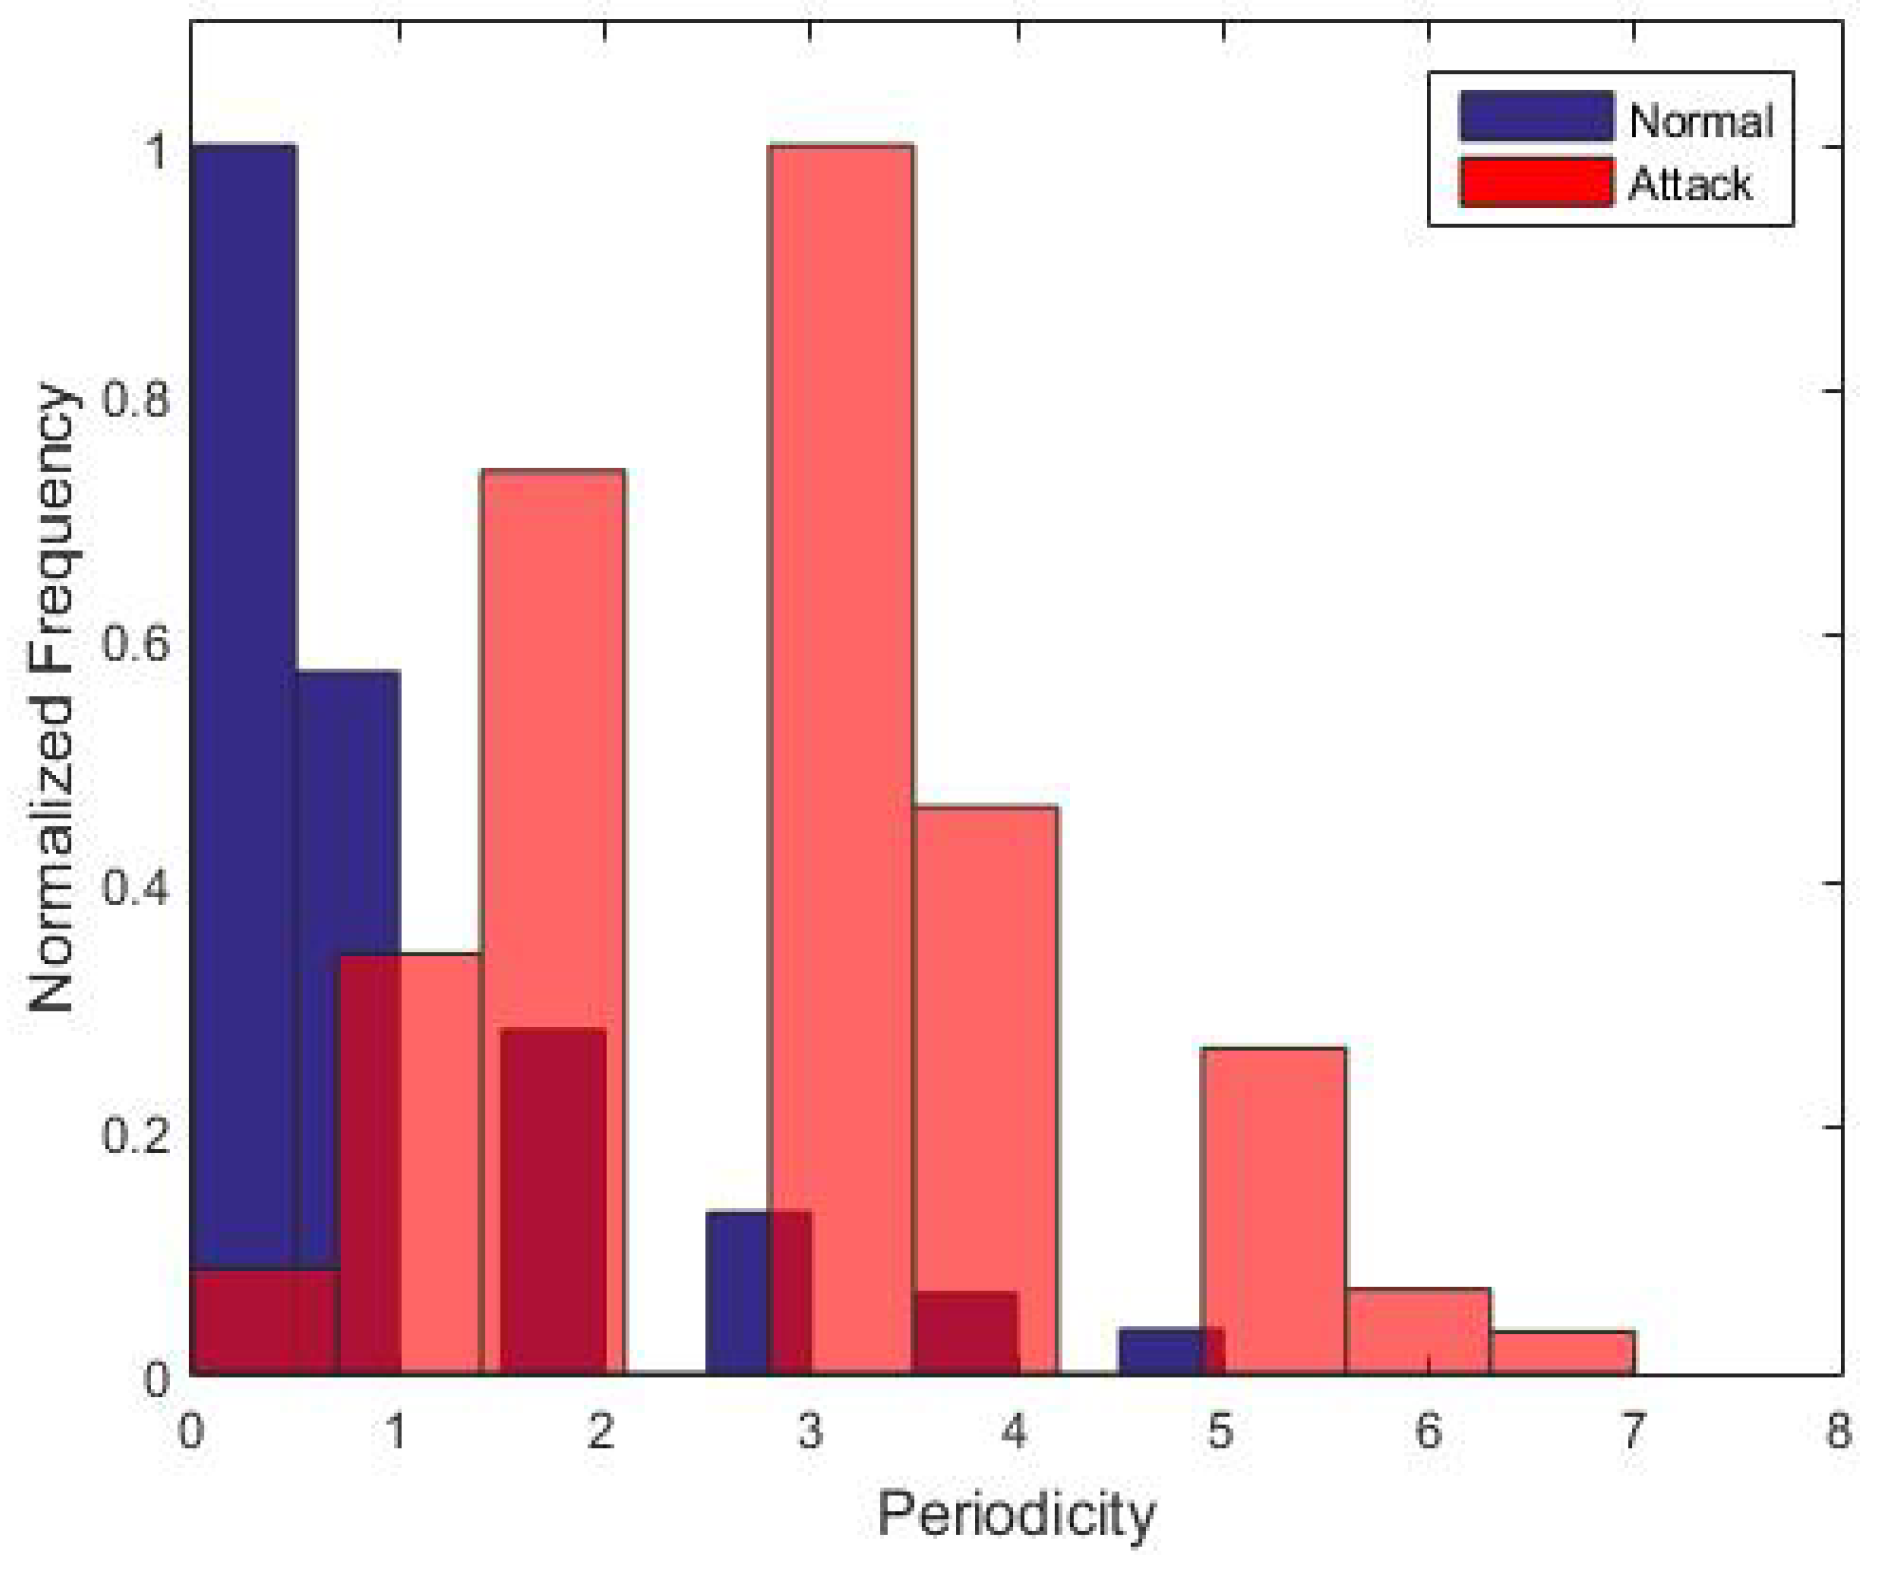
According to the Nyquist theorem, the maximum frequency of received signal which can be realized, is 500 Hz. By 1024-length window, we achieve 0.488 Hz frequency resolution, distributed in 512 bins. Figure 2 displays the normalized average periodogram of training datasets. In contrast to main energy of normal traffic which resides in lower frequencies, the attack one is distributed in different bounds of frequencies. Moreover, it can also be deduced that attack traffic has more periodic components than normal traffic. Figure 3 displays the normalized histogram of number of period components for both traffics. Both traffics share different number of periodic components; therefore, this feature would not be a good choice for DDoS attack detection.
Figure 4 displays the normalized histogram of skewness values for training windows. Both traffics are right skewed, but the attack one has heavier tail than the normal one which can be confirmed considering Figure 1.
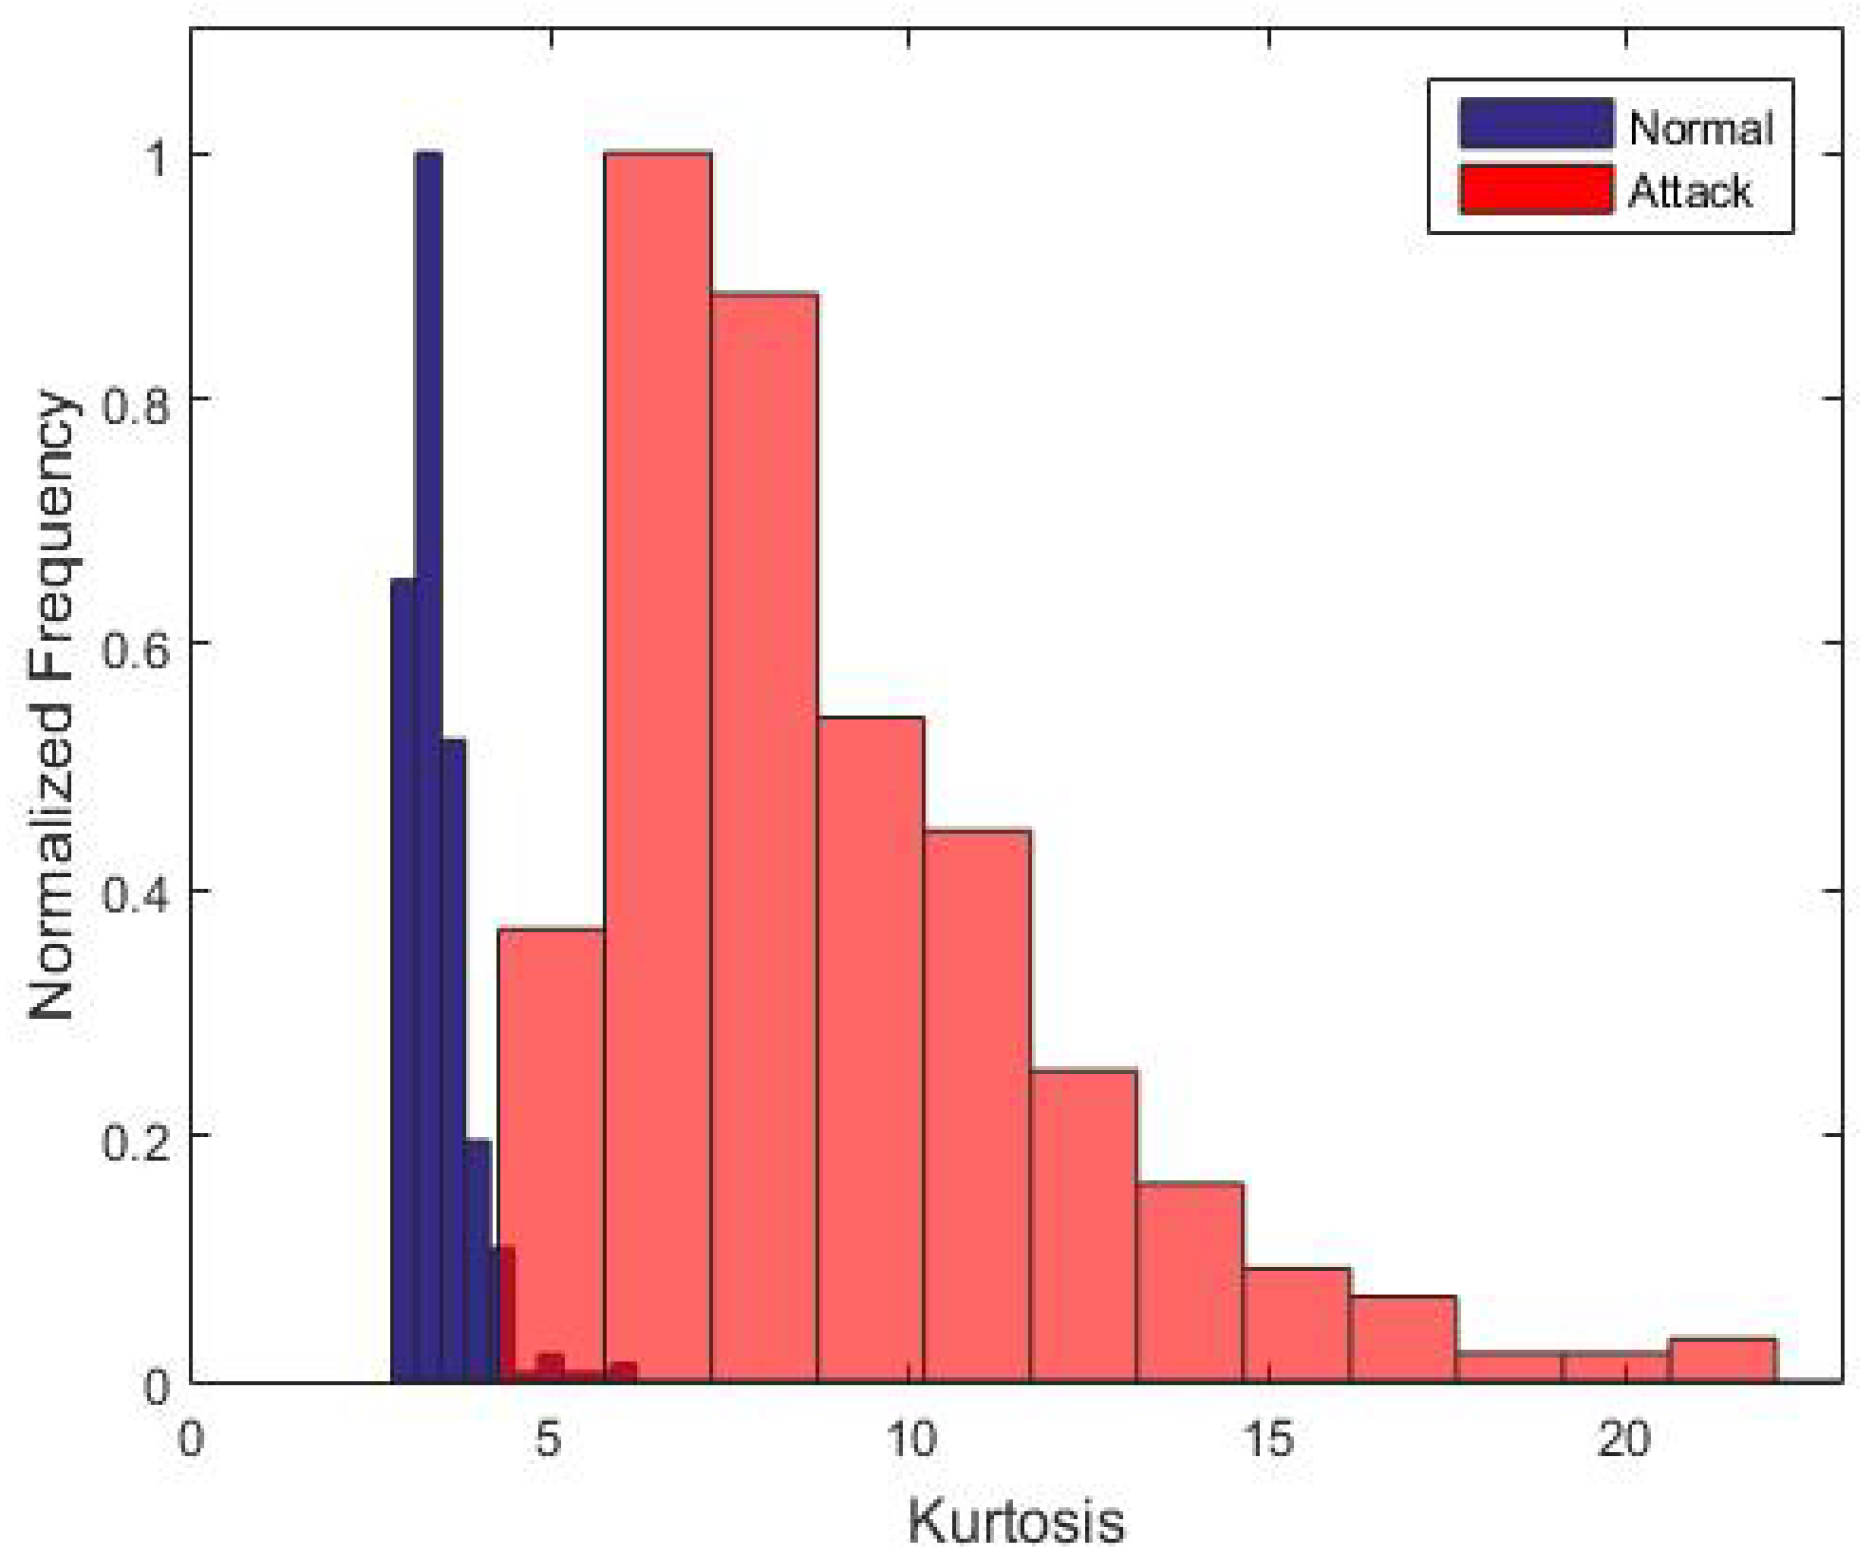
Figure 5 shows the normalized histogram of kurtosis value for both normal and attack traffics. Both traffics have heavy tailed distribution. While the kurtosis of normal traffic is distributed near the value of 4, the kurtosis of attack has a large variance.
The Hurst exponent distribution for both traffics is depicted in Figure 6. The attack traffic tends to have anti-persistent behavior; on the other hand, normal traffic has persistent behavior.
Receiver operating characteristics (ROC) is used as the performance criterion [20]. The discrimination accuracy of a model, can be related to the area under the ROC which is so called area under the curve(AUC) [20]. Figure 7 displays the ROC of four different statistical parameters. The corresponding AUC and threshold values are summarized in Table 2.
4.2. Test Result
Having found the threshold value for each statistical parameter, test dataset is used to examine the performance of each measure for separating attack from normal traffic. If the values of kurtosis, skewness, and periodic components greater than those thresholds specified in Table 2, the test sample is assumed to be an attack, otherwise it is classified as a normal instance. For Hurst parameter, values less than corresponding threshold is considered to be an attack. Three metrics of false positive rate (FPr), true positive rate (TPr) and accuracy (ACC) are used which are defined as:
Each test traffic consists of 60 sample windows. Using thresholds from Table 2 and then carrying out binary hypothesis test, the confusion table for all measures are summarized in Table 3. Skewness outperforms all other parameters. Although both histograms share a common area less than the threshold vale of 1 in Figure 4, it can be considered to be the effect of outliers on attack traffic. Considering the packets number histogram in Figure 1, normal traffic tends to be more symmetric than does attack traffic, therefore; out-performance of skewness in detection is logically expected. The least performance belongs to period parameter. The reason for this low performance can be inferred from Figure 3. It is clear that both normal and attack dataset overlap each other in different part of histogram. Kurtosis and Hurst exponent also performs well enough in detecting DDoS attack. The test results agree with the outcomes of the training part. As two histograms share more area in common, the detection accuracy decreases.
5. Conclusions
Availability of web services plays an important role in customers satisfaction. DDoS attacks are the major threats for this key parameter. Pretending to be a legitimate user, an attacker deluge the victim server with fraudulent and useless packets. Many efforts have been made to detect and counter-measure against DDoS attacks. Traditional methods rely on packet level scrutinizing. In these methods, payloads of arriving packets are scanned to find for any suspicious activity. New attack’s payload characteristics are very similar to normal packets, which leave these methods ineffective. Flow level analyzing might be an alternative. In this proposed new method, the network traffic is treated as a time series. The statistical measures of the time series are used to find abnormality. In this paper, four measures of periodicity, kurtosis, skewness and self-similarity were examined. Skewness outperformed other parameters in separating DDoS attack from normal traffic. The performance of kurtosis and Hurst exponent were also acceptable.
Conflicts of Interest
The authors declare no conflict of interest.
References
- Bouzida, Y.; Cuppens, F.; Gombault, S. Detecting and reacting against distributed denial of service attacks. In Proceedings of the IEEE International Conference on Communications, Istanbul, Turkey, 11–15 June 2006; Volume 5, pp. 2394–2400. [Google Scholar]
- Trostle, J. Protecting against distributed denial of service (ddos) attacks using distributed filtering. In Proceedings of the Securecomm and Workshops, Baltimore, MD, USA, 28 August–1 September 2006; pp. 1–11. [Google Scholar]
- Chauhan, K.; Prasad, V. Distributed denial of service (ddos) attack techniques and prevention on cloud environment. Int. J. Innov. Adv. Comput. Sci. 2015, 4, 210–215. [Google Scholar]
- Zargar, S.T.; Joshi, J.; Tipper, D. A survey of defense mechanisms against distributed denial of service (ddos) flooding attacks. IEEE Commun. Surv. Tutor. 2013, 15, 2046–2069. [Google Scholar] [CrossRef]
- Liao, H.; Lin, C.R.; Lin, Y.; Tung, K. Intrusion detection system: A comprehensive review. J. Netw. Comput. Appl. 2013, 36, 16–24. [Google Scholar] [CrossRef]
- Modi, C.; Patel, D.; Borisaniya, B.; Patel, H.; Patel, A.; Rajarajan, M. A survey of intrusion detection techniques in cloud. J. Netw. Comput. Appl. 2013, 36, 42–57. [Google Scholar] [CrossRef]
- Shinde, P.; Guntupalli, S. Early dos attack detection using smoothened time-series andwavelet analysis. In Proceedings of the Third International Symposium on Information Assurance and Security, Manchester, UK, 29–31 August 2007; pp. 215–220. [Google Scholar]
- Caida, 2011. The Cooperative Analysis for Internet Data Analysis. Available online: http://www.caida.org/data/passive/ddos-20070804_dataset.xml (accessed on 4 August 2007).
- I MathWorks. Matlab and Statistics Toolbox Release, 2012. Available online: https://www.mathworks.com/company/newsroom/mathworks-announces-release-2012a-of-the-matlab-and-simulink-product-families.html (accessed on 2 March 2012).
- Nezhad, S.M.T.; Nazari, M.; Gharavol, E.A. A novel dos and ddos attacks detection algorithm using arima time series model and chaotic system in computer networks. IEEE Commun. Lett. 2016, 20, 700–703. [Google Scholar] [CrossRef]
- Ni, T.; Gu, X.; Wang, H.; Li, Y. Real-time detection of application-layer ddos attack using time series analysis. J. Control Sci. Eng. 2013, 4, 2013. [Google Scholar] [CrossRef]
- Barford, P.; Kline, J.; Plonka, D.; Ron, A. A signal analysis of network traffic anomalies. In Proceedings of the 2nd ACM SIGCOMM Workshop on Internet Measurment, Marseille, France, 6–8 November 2002; pp. 71–82. [Google Scholar]
- Chen, Y.; Hwang, K. Collaborative detection and filtering of shrew ddos attacks using spectral analysis. J. Parallel Distrib. Comput. 2006, 66, 1137–1151. [Google Scholar] [CrossRef]
- Hashim, F.; Kibria, M.R.; Jamalipour, A. Detection of dos and ddos attacks in ngmn using frequency domain analysis. In Proceedings of the 2008 14th Asia-Pacific Conference on Communications, Tokyo, Japan, 14–16 October 2008; pp. 1–5. [Google Scholar]
- He, X.; Papadopoulos, C.; Heidemann, J.; Mitra, U.; Riaz, U. Remote detection of bottleneck links using spectral and statistical methods. Comput. Netw. 2009, 53, 279–298. [Google Scholar] [CrossRef]
- Fouladi, R.F.; Kayatas, C.E.; Anarim, E. Frequency based ddos attack detection approach using naive bayes classification. In Proceedings of the 2016 39th International Conference on Telecommunications and Signal Processing (TSP), Vienna, Austria, 27–29 June 2016; pp. 104–107. [Google Scholar]
- Vlachos, M.; Yu, P.; Castelli, V. On periodicity detection and structural periodic similarity. In Proceedings of the 2005 SIAM International Conference on Data Mining, Newport Beach, CA, USA, 21–23 April 2005; pp. 449–460. [Google Scholar]
- Bracewell, R. The Fourier Transform and Iis Applications; Mcgraw-Hill College: New York, NY, USA, 1965; Volume 5. [Google Scholar]
- Maftei, C.; Barbulescu, A.; Carsteanu, A.A. Long-range dependence in the time series of taiţa river discharges. Hydrol. Sci. J. 2016, 61, 1740–1747. [Google Scholar] [CrossRef]
- Nevin, J.A. Signal detection theory and operant behavior: A review of david m. green and john a. swets’ signal detection theory and psychophysics. J. Exp. Anal. Behav. 1969, 12, 475–480. [Google Scholar] [CrossRef]
Figure 1.
Normalized Histogram of Arrival Packet Numbers, (a) Normal, (b) Attack.

Figure 2.
Normalized Averaged Periodogram, (a) Normal, (b) Attack.

Figure 3.
Normalized Histogram of Number of Period Components.

Figure 4.
Normalized Histogram of Skewness.

Figure 5.
Normalized Histogram of Kurtosis.

Figure 6.
Normalized Histogram of Hurst Exponent.

Figure 7.
Receiver Operating Characteristics of four different statistical parameters.


Table 1.
Statistic Measures of Both Traffics.
| Mean | Std | Kurtosis | Skewness | |
|---|---|---|---|---|
| Normal | 0.47 | 0.06 | 4.63 | 0.98 |
| Attack | 0.23 | 0.12 | 11.42 | 2.42 |
Table 2.
AUC and Threshold Values for Different Parameters.
| Period | Kurtosis | Skewness | Hurst Exponent | |
|---|---|---|---|---|
| AUC(%) | 85.66 | 99.86 | 99.95 | 97.96 |
| Threshold Value | 2 | 4.5 | 1 | 0.57 |
Table 3.
Confusion Table.
| Normal | Attack | TP(%) | FP(%) | Accuracy (%) | ||
|---|---|---|---|---|---|---|
| Period | Normal | 46 | 14 | 80 | 23.33 | 78.33 |
| Attack | 12 | 48 | ||||
| Kurtosis | Normal | 58 | 2 | 95 | 3.33 | 95.83 |
| Attack | 3 | 57 | ||||
| Skewness | Normal | 60 | 0 | 96.67 | 0 | 98.33 |
| Attack | 2 | 58 | ||||
| Hurst | Normal | 55 | 5 | 91.66 | 8.33 | 91.66 |
| Attack | 5 | 55 |
Publisher’s Note: MDPI stays neutral with regard to jurisdictional claims in published maps and institutional affiliations. |
© 2018 by the authors. Licensee MDPI, Basel, Switzerland. This article is an open access article distributed under the terms and conditions of the Creative Commons Attribution (CC BY) license (https://creativecommons.org/licenses/by/4.0/).
Share and Cite
MDPI and ACS Style
Fouladi, R.F.; Kayatas, C.E.; Anarim, E. Statistical Measures: Promising Features for Time Series Based DDoS Attack Detection. Proceedings 2018, 2, 96. https://doi.org/10.3390/proceedings2020096
AMA Style
Fouladi RF, Kayatas CE, Anarim E. Statistical Measures: Promising Features for Time Series Based DDoS Attack Detection. Proceedings. 2018; 2(2):96. https://doi.org/10.3390/proceedings2020096
Chicago/Turabian StyleFouladi, Ramin Fadaei, Cemil Eren Kayatas, and Emin Anarim. 2018. "Statistical Measures: Promising Features for Time Series Based DDoS Attack Detection" Proceedings 2, no. 2: 96. https://doi.org/10.3390/proceedings2020096