Extended Abstract

Hydropower Potential Assessment in Water Supply Systems †

by
Eva Gómez-Llanos
*,
Juana Arias-Trujillo
,
Pablo Durán-Barroso
,
José M. Ceballos-Martínez
,
Jesús A. Torrecilla-Pinero
,
Carlos Urueña-Fernández
and
Miguel Candel-Pérez
Department of Construcction, University of Extremadura, 10003 Cáceres, Spain
*
Author to whom correspondence should be addressed.
Presented at Environment, Green Technology and Engineering International Conference (EGTEIC 2018), Caceres, Spain, 18–20 June 2018.
Proceedings 2018, 2(20), 1299; https://doi.org/10.3390/proceedings2201299
Published: 19 October 2018

Abstract

:
Energy recovery in water supply systems (WSS) is environmentally friendly, since it is a renewable energy based on exploiting the excess pressure existing in water pipes for obtaining electricity. This paper presents the methodology development for the identification of the hydropower potential in WSS and the possible installations by means of a Matlab rutine. The results showed the interactions among the design flow and maximum head have provided the possible scenarios with electric potential and the selection of possible turbines. The methodology proposed allows determining the suitability of electricity production in the urban water cycle by MHPs, in order to avoid the need for the installation of dissipation devices for this energy.

1. Introduction

An opportunity for the development of alternative renewable energy resources is to exploit the excess pressure existing in water pipes for obtaining electricity. They are called as energy recovery or pico-hydroelectric plants. Currently, pressure reducing valves (PRV) are necessary and widely employed to reduce water pressure in the water supply system (WSS).The PRV reduces overall water pressure inside of a pipeline by throttling the cross sectional area to increase the water head loss in piping systems, and therefore this excess of energy is wasted [1]. This technology is environmentally friendly, since no greenhouse gas emissions are produced and it is supported on existing infrastructures, so the civil works are reduced.
Generally, the typical range of flow rates and application heights of each type of turbine, is shown in Figure 1, which has been compiled from [1,2]. This leads to the choice of the Pelton and Turgo turbines in the high-head; Francis, Kaplan and cross-flow turbines in the central part of the heads and the propeller turbines and the low-elevation wheels. As can be seen in Figure 1, the peak range, less than 5 kW generation, seems to be barely covered by the application domains reported. The use of PATs is considered as a viable and flexible solution for water head reduction as well as hydropower generation in WSS. However, the pump manufacturers usually could not provide the performance curves of their pumps in turbine mode [2].
The turbine selection depends mainly on the site head and the flow rate. Respect to the head, it is dependent of topographic conditions, whereas the flow is linked to the population size and the corresponding water demand. In the literature, some researches can be found about the estimation of the potential for hydropower in wastewater systems [4] or run-of river micro-hydropower plants [5]. They expos a methodology to assess the potential for hydropower, which could be extrapolated to the WSS, although the losses in driving must be calculated with accuracy since they affect the final supply pressure, which is a fundamental variable in these systems.
This paper presents the design procedure of a pico-hydroelectric power plant in WSS. The proposed methodology has been developed by means of a Matlab rutine and the objective of this is the identification of the hydropower potential in WSS and the possible installations, from the catchment area or water purification plant (WPP) to water reservoir, before the pipe network for distribution of water to the consumers in a municipality. The interactions among the design flow and maximum head have provided the possible scenarios with electric potential is analyzed.

2. Materials and Methods

2.1. Supply Flow

The flow is linked to the population size and the corresponding water demand. In this study, daily consumption of a population has been estimated from the average consumption per inhabitant per day data quantified by the Spanish Statistics National Institute [6], a 12% increase is added to take into account the uncertainties. Therefore, the average consumption per inhabitant per day data considered is 150 l per person and day.

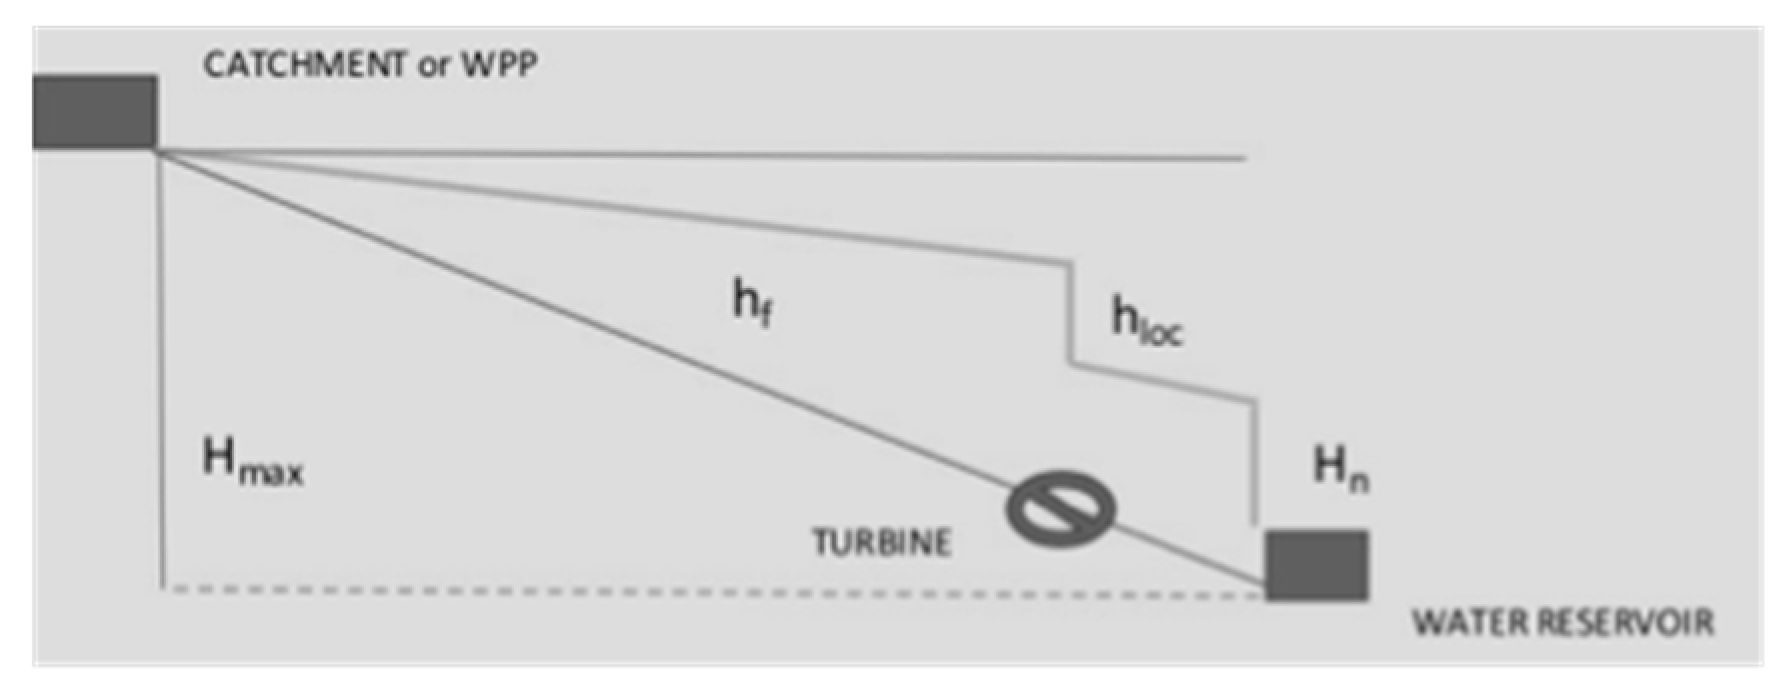
2.2. Head Measurement

The gross head (Hmax), is the vertical distance between the water surface level at the catchment area and at the turbine locate as the Figure 2 is shown. As can be seen in Figure 2, the net head (Hn) is defined as the gross head less the hydraulic losses produced along the supply pipe by friction (hf) and local losses (hloc) due to the existence of an irregularity, such as an elbow or the turbine itself. These second ones have not been taken into account in this study.

2.3. Pipe Design

The pipe friction loss is estimated by the Darcy-Weisbach’s law according to Equation (1).
h f = 8 f L π 2 g D 5 Q 2
where h f is the pipe friction loss (m), f is the Darcy-Weisbach friction factor, L is pipe length (m), g is the gravity acceleration constant (approximately 9.8 m/s2), D is pipe diameter (m) and Q is the water flow (m3/s).
The pipe length is derived from the plan and elevation distances between the catchment area or water purification plant (WPP) to the turbine, located, in the hypothetical scenario studied, near the water tank, to take advantage of the maximum head. Commercial diameters are considered and the Darcy-Weisbach friction factor ( f ), which depends on the flow conditions and on the pipe roughness, is determined according to the Colebrook-White equation, where the pipe roughness depends primarily on the penstock material. The Colebrook-White equation is given Equation (2).
f = 0.25 [ l o g ( K 3.7 D + 5.74 R e 0.9 ) ] 2 ,
where f is the Darcy-Weisbach friction factor, K is absolute roughness (m), D is pipe diameter (m) and R e is the Reynolds number.
The Reynolds number is calculated to turbulent flow in a pipe as Equation 3.
R e = 4 Q π ν D ,
where R e is the Reynolds number,   Q is the water flow (m3/s), D is pipe diameter (m) and ν is the water kinematic viscosity (1.004 × 10⁻⁶ m2/s).

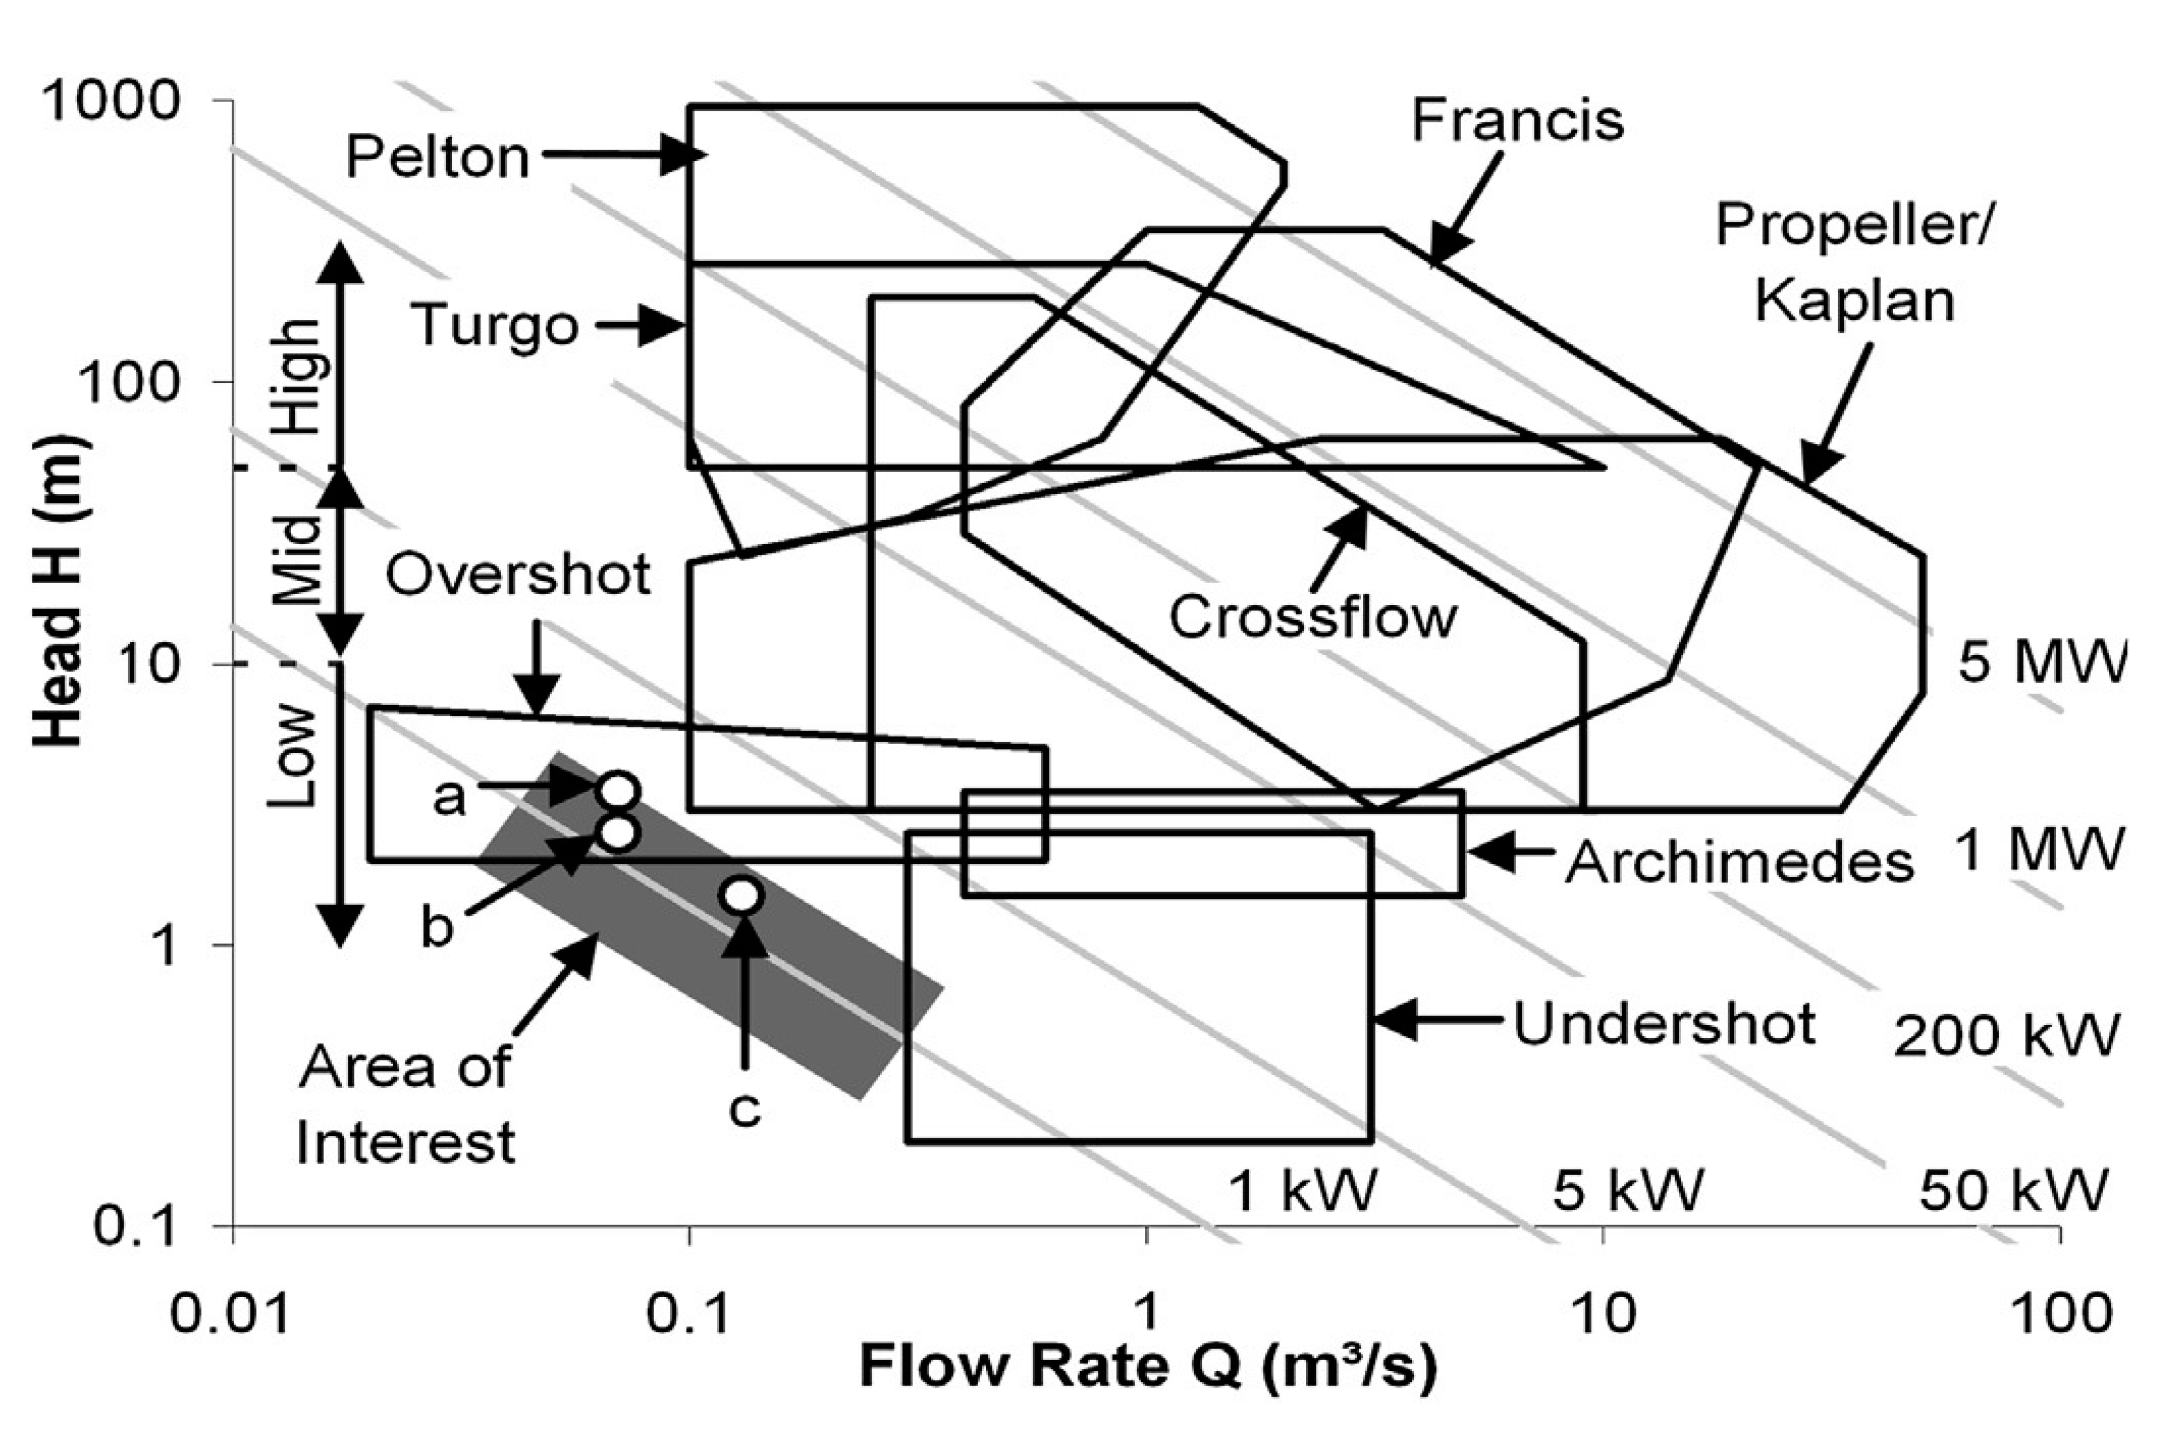
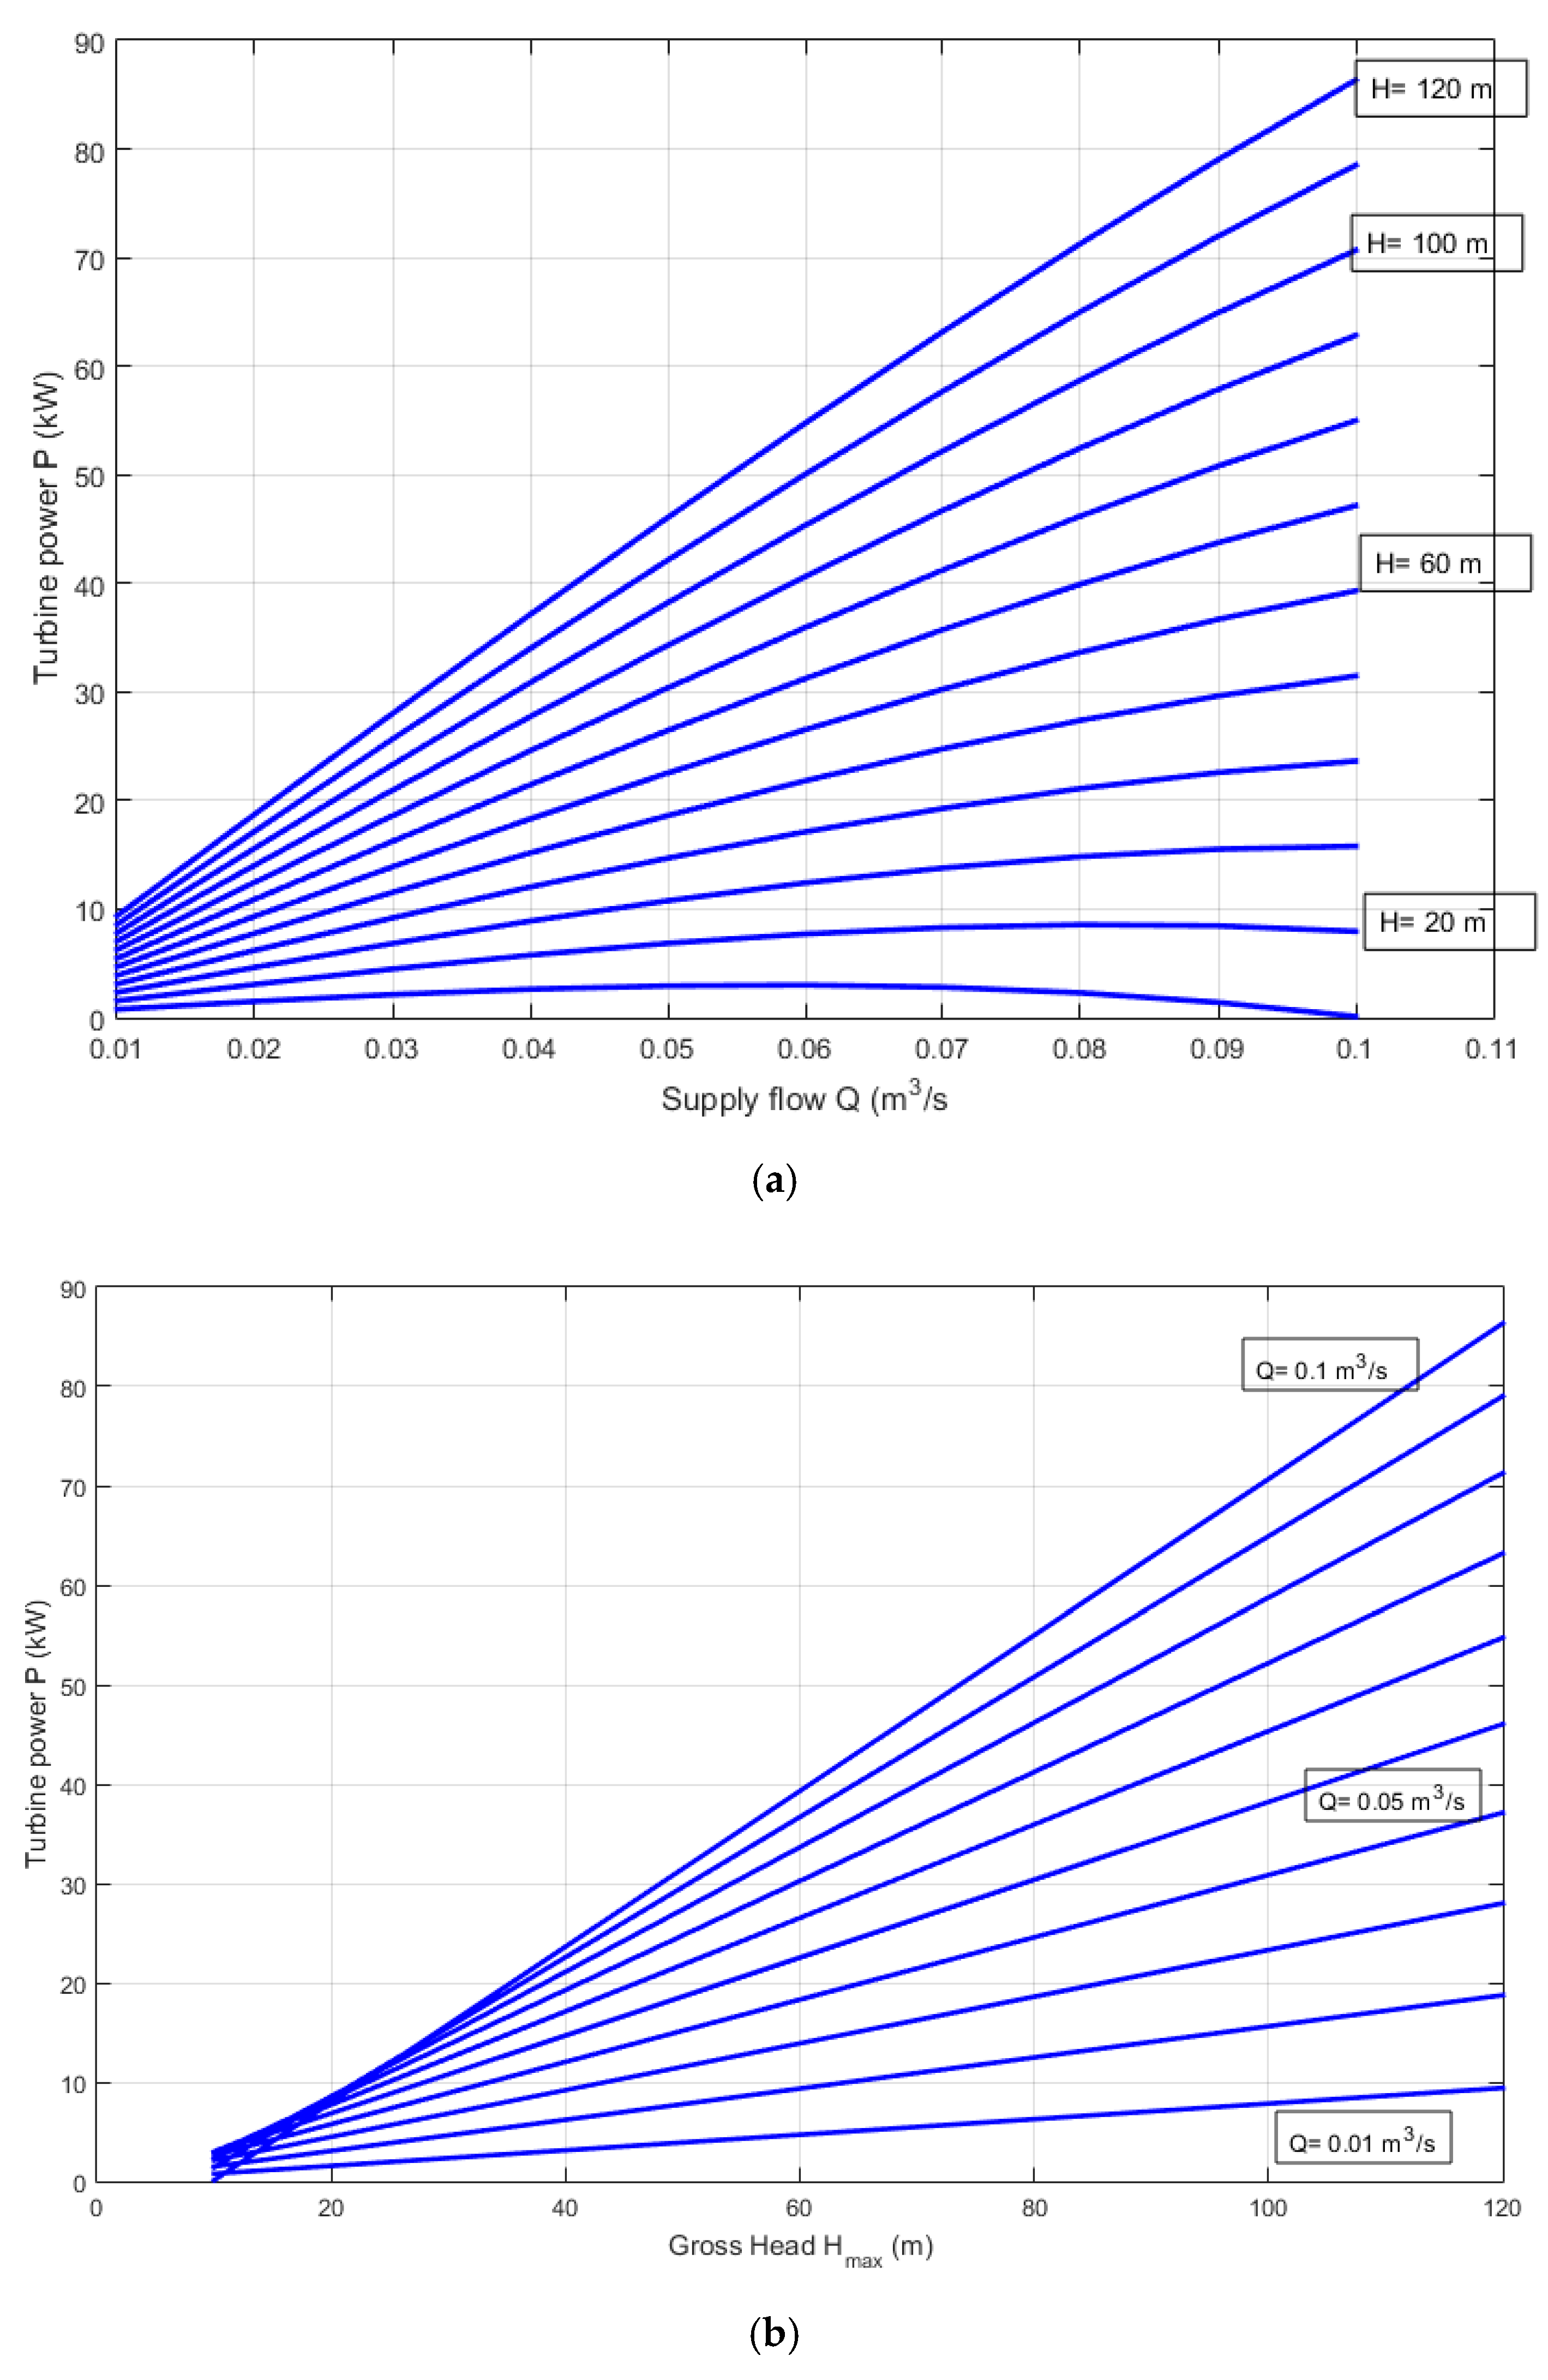
2.4. Power Generate in a Turbine

All hydro-electric generation depends on falling water. Regardless of the water path through an open channel or penstock, the power generated in a turbine (lost from water potential energy) is given as Equation (4) [4,5].
P = η g ρ Q H n = η g ρ Q ( H m a x h f ) ,
where g is the gravity acceleration constant (approximately 9.8 m/s2), ρ is water density (1000 kg/m3), Q is the water flow (m3/s) H m a x is gross head (m) and h f is the pipe friction loss (m). The turbine efficiency ( η ) normally is defined between a range of 80% to 90% [5].

3. Results and Discussion

The design procedure of pico-hydroelectric power plant in WSS was implemented by Matlab rutine. The WSS parameters designed based on a typical infrastructure selected from data in [7]. The material selected has been ductile cast iron, since it is the most abundant in Spanish WSS, which has an absolute roughness (K) approximately 0.2 mm. In this study, the diameter selected is 200 mm. The value selected in this study to the pipe length has been 1000 m and the turbine efficiency has been 80%. The flow range considered is from 0.01 m3/s to 1 m3/s, since the range where the flow rate range where the supply is situated according considerations average consumption per inhabitant per day established. The gross head range considered is from 10 m to 120 m.
After introducing the site measurements and calculations as input data to the computer program, head loss and turbine power were determined. Figure 3a shows the relation between turbine power with gross head at different values of water flow and Figure 3b the variation of turbine power with water flow rate at different values of site head. From these results, the turbine power was directly proportional with the gross head and water flow. For a usual supply flow value of 0.03 m3/s the maximum power value obtained is close to 30 kW with the maximum value of the gross head range, this case is situated in an area outside the working range of typical turbines, according to Figure 1. In the same way, the typical hydropower turbine could be used is Pelton or Turgo turbine with the highest flow, 0.1 m3/s and high gross head range. Cross-flow turbines are also considered best for pico-hydro projects with a head of 10 m or less and water flow nearly to 0.1 m3/s.

4. Conclusions

The energy recovery in WSS is especially important from a social point of view. The use of this hydropower potential should benefit mainly to the local corporations and that could satisfy the own energetic demand of the WSS. This work presents the basic methodology to determine the suitability of electricity production in the urban water cycle by MHPs, in order to avoid the need for the installation of dissipation devices for this energy. The methodology has been proposed allows estimating the possible equipment according to WSS hydraulic variables. The results for a usual supply flow value showed the pico-hydropower area has situated outside the working range of typical turbines, so a particularized study of a PAT installation is necessary.

Acknowledgments

This study was funded by the Government of Extremadura and the European Regional Development Fund, Una manera de hacer Europa, under project IB16145.

Conflicts of Interest

The authors declare no conflict of interest.

References

  1. Du, J.; Yang, H.; Shen, Z.; Chen, J. Micro hydro power generation from water supply system in high rise buildings using pump as turbines. Energy 2017, 137, 431–440. [Google Scholar] [CrossRef]
  2. Binama, M.; Su, W.-T.; Li, X.-B.; Li, F.-C.; Wei, X.-Z.; An, S. Investigation on pump as turbine (PAT) technical aspects for micro hydropower schemes: A state-of-the-art review. Renew. Sustain. Energy Rev. 2017, 79, 148–179. [Google Scholar] [CrossRef]
  3. Williamson, S.J.; Stark, B.H.; Booker, J.D. Low head pico hydro turbine selection using a multi-criteria analysis. Renew. Energy 2014, 61, 43–50. [Google Scholar] [CrossRef]
  4. Bousquet, C.; Samora, I.; Manso, P.; Rossi, L.; Heller, P.; Schleiss, A.J. Assessment of hydropower potential in wastewater systems and application to Switzerland. Renew. Energy 2017, 113, 64–73. [Google Scholar] [CrossRef]
  5. Nasir, B.A. Design Considerations of Micro-hydro-electric Power Plant. Energy Procedia 2014, 50, 19–29. [Google Scholar] [CrossRef]
  6. INEbase/Agricultura y Medio Ambiente/Agua /Estadística Sobre el Suministro y Saneamiento del Agua/Últimos Datos. Available online: http://www.ine.es/dyngs/INEbase/es/operacion.htm?c=Estadistica_C&cid=1254736176834&menu=ultiDatos&idp=1254735976602 (accessed on 1 June 2018).
  7. CEDEX. Guía Técnica Sobre Tuberías para Transporte de agua a Presión; Ministerio de Fomento y Ministerio de Medio Ambiente: Madrid, Spain, 2003; ISBN 84-7790-384-0. [Google Scholar]
Figure 1. The typical range of flow rates and application heights of each type of turbine in [3].
Proceedings 02 01299 g001
Figure 2. Scheme of turbine installation in WSS where the head considered are indicated: gross head (Hmax), net head (Hn) and hydraulic friction losses (hf) and local losses (hloc).
Proceedings 02 01299 g002
Figure 3. The relation between turbine power with (a) gross head at different values of water flow and (b) with water flow rate at different values of site head.
Proceedings 02 01299 g003
Publisher’s Note: MDPI stays neutral with regard to jurisdictional claims in published maps and institutional affiliations.

