Offshore Wind Energy Resource Atlas of Asturias (N Spain) †


1
Department of Construction and Manufacturing Engineering, University of Oviedo, EPM, C/Gonzalo Gutiérrez Quirós s/n, 33600 Mieres, Asturias, Spain
2
Hydraulic Engineering, University of Santiago de Compostela, EPS, Campus Universitario s/n, 27002 Lugo, Spain
*
Author to whom correspondence should be addressed.
†
Presented at the 2nd International Research Conference on Sustainable Energy, Engineering, Materials and Environment (IRCSEEME), Mieres, Spain, 25–27 September 2018.
Proceedings 2018, 2(23), 1416; https://doi.org/10.3390/proceedings2231416
Published: 20 November 2018
(This article belongs to the Proceedings of The 2nd International Research Conference on Sustainable Energy, Engineering, Materials and Environment)
Abstract
:This work assesses for the first time the offshore wind energy resource in Asturias, a region in the North of Spain. Numerical model and observational databases are used to characterize the gross wind energy resource at different points throughout the area of study. The production of several wind turbines is then forecasted on the basis of each technology power curve and the wind speed distributions. The results are mapped for a better interpretation and discussion.
1. Introduction
In order to preserve our planet, switching to renewable sources of energy is a global objective. Among the different renewable energies, wind energy has been the renewable power most used up to now, mainly by means of onshore installations [1]. Nonetheless, to satisfy current electricity consumption at a global scale with onshore wind turbines requires covering a 2% of the countries surface [2]. In this context, offshore wind farms present two main advantages in comparison with onshore ones [3]:
- the better quality of the resource (the wind speed is higher and more uniform in the sea); and
- the larger suitable free areas where offshore wind farms can be installed, which leads to larger installations and reduced environmental impacts in terms of noise emission and visual impact.
Fixed offshore wind farms have been operating in Europe since the nineties. In 2012 the average water depth of wind turbines was 22 m, while the average distance to shore was of 29 km [4]. However, given that shallow waters are required to develop fixed offshore wind farms, the places are limited. For this reason, most future offshore wind farms will move into deeper water [5].
Asturias is a region on the northern coast of Spain that faces the Cantabrian Sea. The offshore of Asturias presents very deep waters close to the coast that make impossible the development of fixed wind turbines. Nonetheless, it is expected the deployment (in a near future) of floating wind energy farms in Asturias thanks to the ongoing research and development of enabling technologies such as WindFloat [6].
This work presents and discusses the offshore wind energy resource in Asturias. The gross wind energy resource was obtained at different heights on the basis of wind time series. Then, the power production of a selection of offshore wind technologies was estimated. Finally, several parameters such as the capacity factor and the variability index were obtained and compared with those available in the literature for other regions worldwide.
2. Material and Methods
3.1. Wind Datasets
To assess the offshore wind energy resource in Asturias, both observational and numerical modelling data were used. The former corresponds to the data obtained by an offshore buoy to the west of Cape Peñas and by two onshore meteorological stations at the Port of Avilés and the Port of Gijón, covering different time periods each one. The numerical data corresponds to SIMAR, an hourly dataset that covers the period from 1958 to the present by concatenating two subsets: SIMAR-44 and WANA. The SIMAR-44 subset covers the period 1958–1999 and is based on the re-analysis of meteorological observations produced by the European Centre for Medium-Range Weather Forecasts (ECMWF) in collaboration with many institutions [7]. The WANA subset covers the period from 2000 to the present and corresponds to the wind fields of the High Resolution Limited Area Model (HIRLAM, [8]). The 64 SIMAR data points shown in Figure 1 were considered in this work. To estimate the wind energy resource at each point, the hourly time series of the mean wind speed and the mean wind direction at a reference level of 10 m above the sea level (U10 and ϴ, respectively) were used.
3.2. Wind Profile
The wind speed varies along the atmospheric boundary layer following a profile that is mainly determined by the surface roughness characteristics, the heat transfer and the evaporation process. Although more complex wind profile expressions have been proposed, wind industry commonly uses the potential wind profile:
where: U is the mean wind speed at height z above the sea surface; Uref is the mean wind speed at the reference height zref; and α is an empirical coefficient that accounts for the site- and time-specific atmospheric conditions. Bearing in mind the values for α obtained in previous work for a nearby coastal region within the Cantabrian Sea, a value of α = 0.049 was considered in this work (see ref. [9] for more details).
3.3. The Weibull Distributtion
The time series of mean wind speed were fitted to a Weibull distribution before estimating the power output of the wind turbines. The Weibull distribution is a two-parameter distribution commonly applied in the field that presents the following probability density function:
where U is the wind speed; and a and b are the shape and scale parameters, respectively. Accordingly, the cumulative density function of Weibull distribution is given by
3.4. Quantification of the Offshore Wind Resource
Once known the Weibull distribution at a specific location and height above the sea level, the average gross wind power can be obtained as
where ρ is the air density. To estimate the power and energy output of a specific wind turbine, the power curve of the turbine (Figure 2) is combined with the wind speed distribution. The average power output is given by
where PT(UT) is the power curve defined as a density function of the wind speed at the rotor height and f(UT) is the Weibull probability density function of the wind speed at the rotor height. The total output energy for a given period of time, Eout, can be simply obtained by multiplying Pout by the corresponding time duration.
4. Results
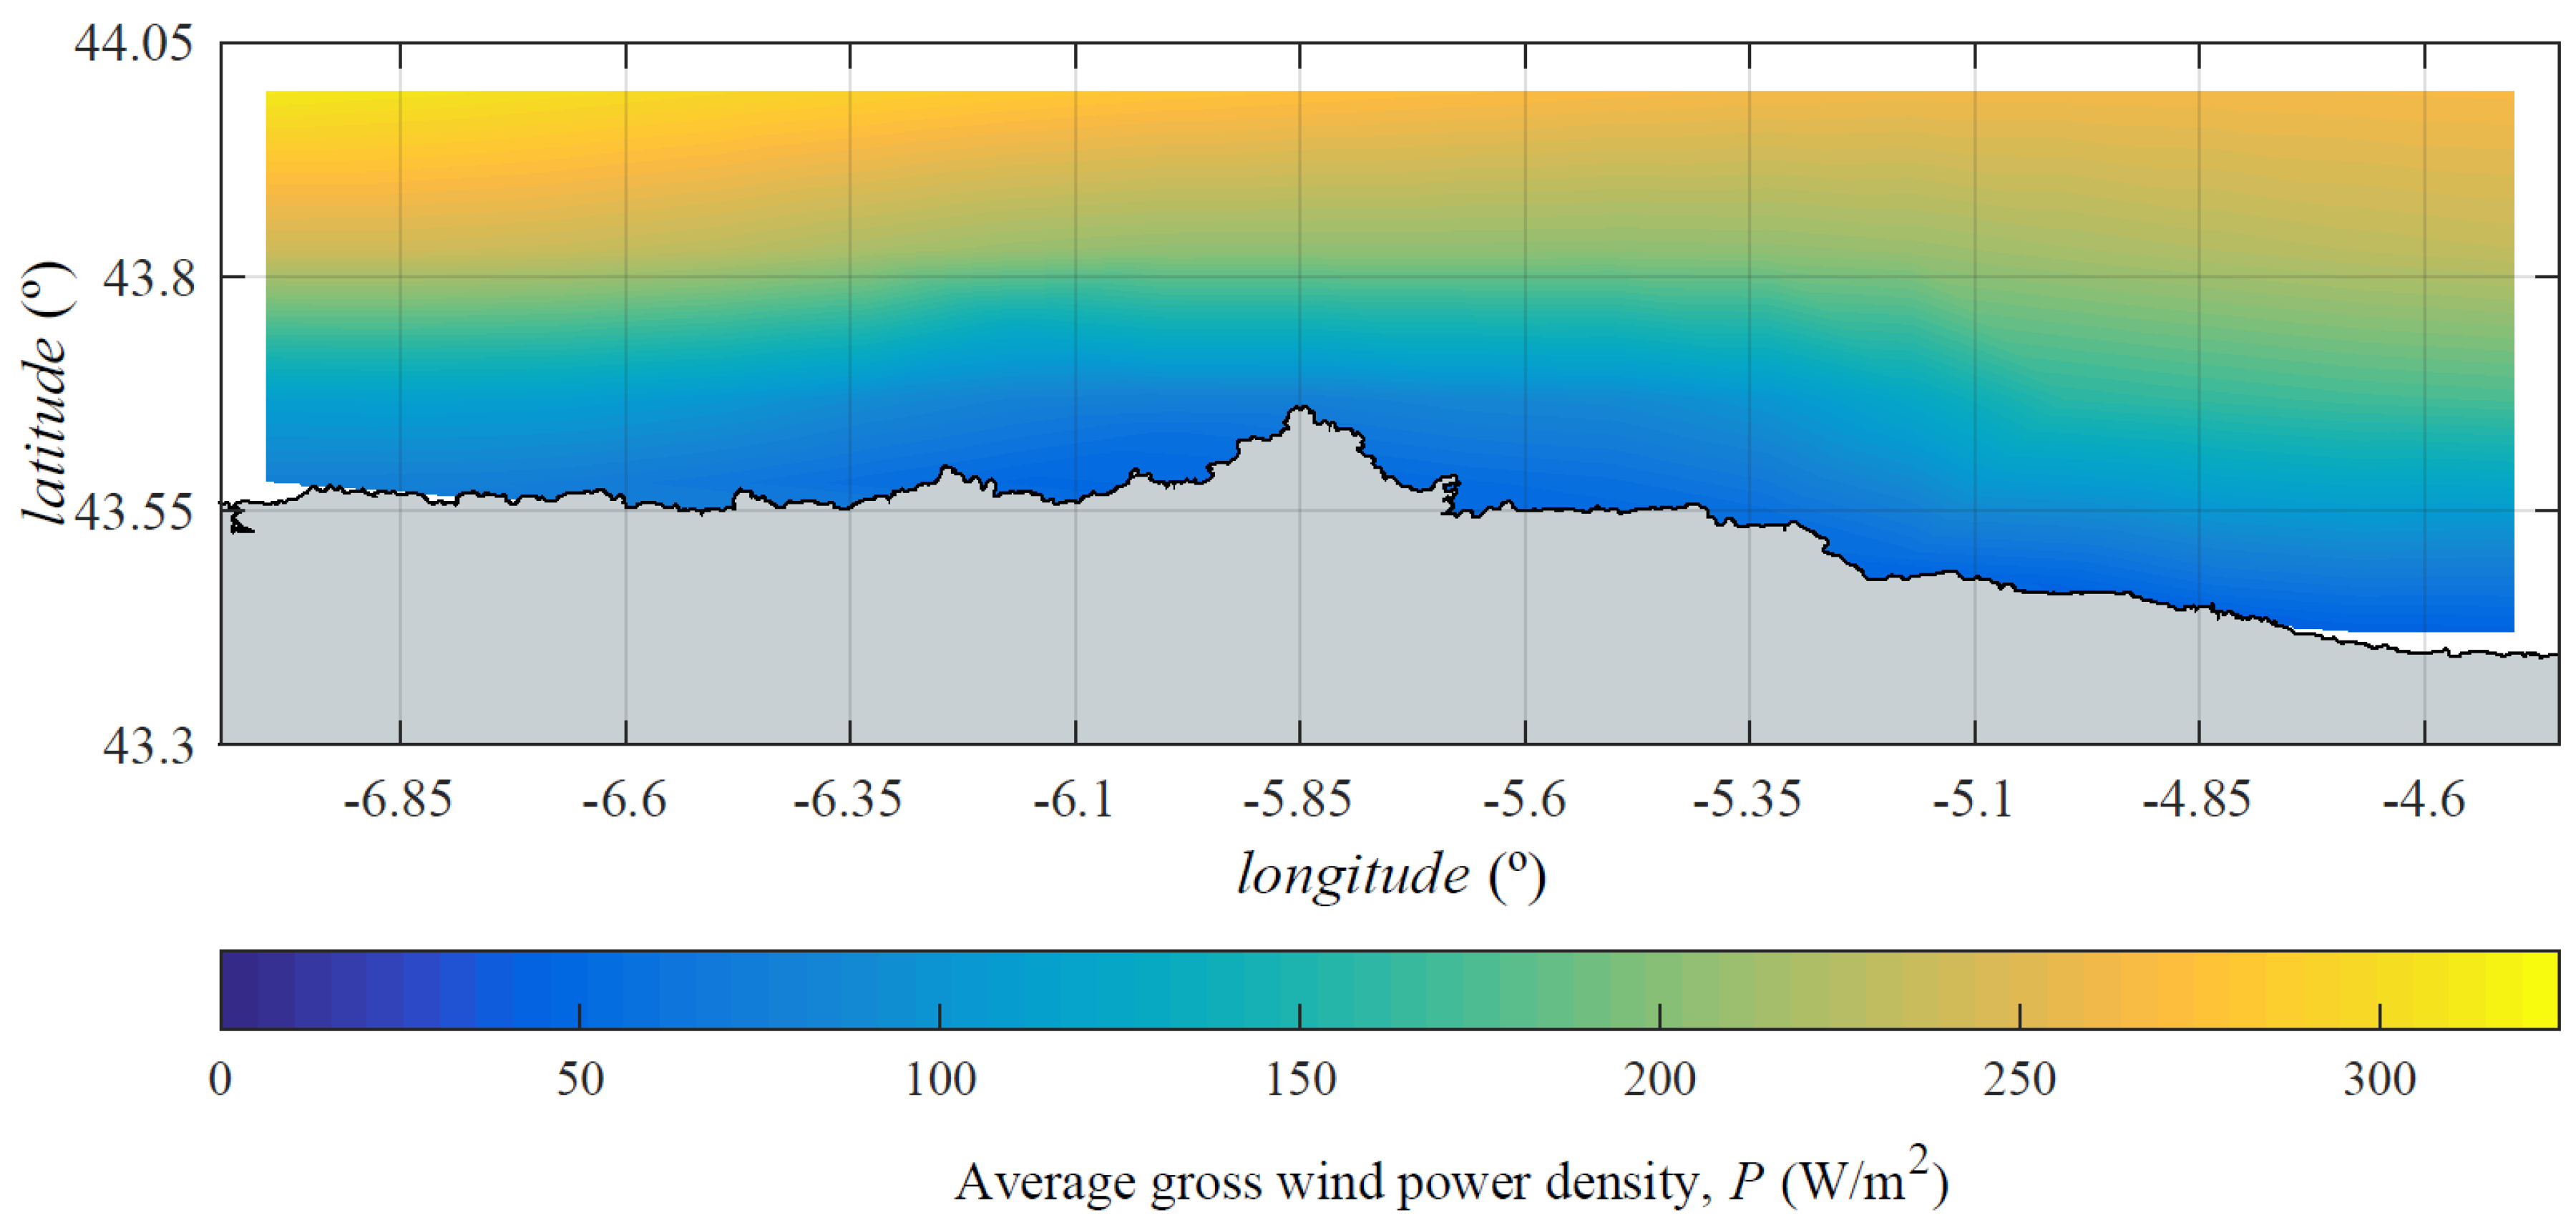
An example of the maps obtained in this work is presented in Figure 3, where the average gross wind power density is shown. The resource at 10 m above the sea surface reaches values of the power density over 300 kW/m2 in areas to the North of the study and with water depths above 100 m. As expected, higher values of the gross power density are obtained when higher heights above the sea surface are considered; however, the same pattern holds for all cases: the resource increases with westing and northing. On the other hand, the maximum energy output corresponds to the XSenvion Repower 6.2M152 offshore wind turbine, with more than 15 GWh per year.
Author Contributions
M.L. designed the research work; N.R.-F. analyzed the wind speed data; M.L. and R.C. contributed analysis tools; all authors wrote the paper.
Acknowledgments
The authors acknowledge Puertos del Estado (Spanish Ministry of Public Works) for providing the SIMAR-44 datasets.
Conflicts of Interest
The authors declare no conflict of interest.
References
- Esteban, M.D.; Diez, J.J.; López, J.S.; Negro, V. Why offshore wind energy? Renew. Energy 2011, 36, 444–450. [Google Scholar] [CrossRef]
- Jung, C.; Schindler, D.; Laible, J. National and global wind resource assessment under six wind turbine installation scenarios. Energy Convers. Manag. 2018, 156, 403–415. [Google Scholar] [CrossRef]
- Veigas, M.; Carballo, R.; Iglesias, G. Wave and offshore wind energy on an island. Energy Sustain. Dev. 2014, 22, 57–65. [Google Scholar] [CrossRef]
- Arapogianni, A.; Genachte, A.B.; Ochagavia, R.M.; Vergara, J.P.; Castell, D.; Tsouroukdissian, A.R.; Ugarte, A. Deep Water: The Next Step for Offshore Wind Energy; European Wind Energy Association: Brussels, Belgium, 2013; Available online: http//www.ewea.org (accessed on 25 September 2018).
- Pacheco, A.; Gorbeña, E.; Sequeira, C.; Jerez, S. An evaluation of offshore wind power production by floatable systems: A case study from SW Portugal. Energy 2017, 131, 239–250. [Google Scholar] [CrossRef]
- Kim, H.C.; Kim, M.H.; Lee, J.Y.; Kim, E.S.; Zhang, Z. Global Performance Analysis of 5MW WindFloat and OC4 Semi-Submersible Floating Offshore Wind Turbines (FOWT) by Numerical Simulations. In Proceedings of the 27th International Ocean and Polar Engineering Conference 2017, San Francisco, CA, USA, 25–30 June 2017. [Google Scholar]
- Uppala, S.M.; Kållberg, P.W.; Simmons, A.J.; Andrae, U.; Bechtold, V.D.C.; Fiorino, M.; Li, X. The ERA-40 re-analysis. Q. J. R. Meteorol. Soc. 2005, 131, 2961–3012. [Google Scholar] [CrossRef]
- Cats, G.; Wolters, L. The Hirlam project. IEEE Comput. Sci. Eng. 1996, 3, 4–7. [Google Scholar] [CrossRef]
- Del Jesus, F.; Menéndez, M.; Guanche, R.; Losada, I.J. A wind chart to characterize potential offshore wind energy sites. Comput. Geosci. 2014, 71, 62–72. [Google Scholar] [CrossRef]
Figure 1.
Bathymetry of Asturias and location of the SIMAR data points considered in this work. The water depths are in meters (m).
Figure 1.
Bathymetry of Asturias and location of the SIMAR data points considered in this work. The water depths are in meters (m).
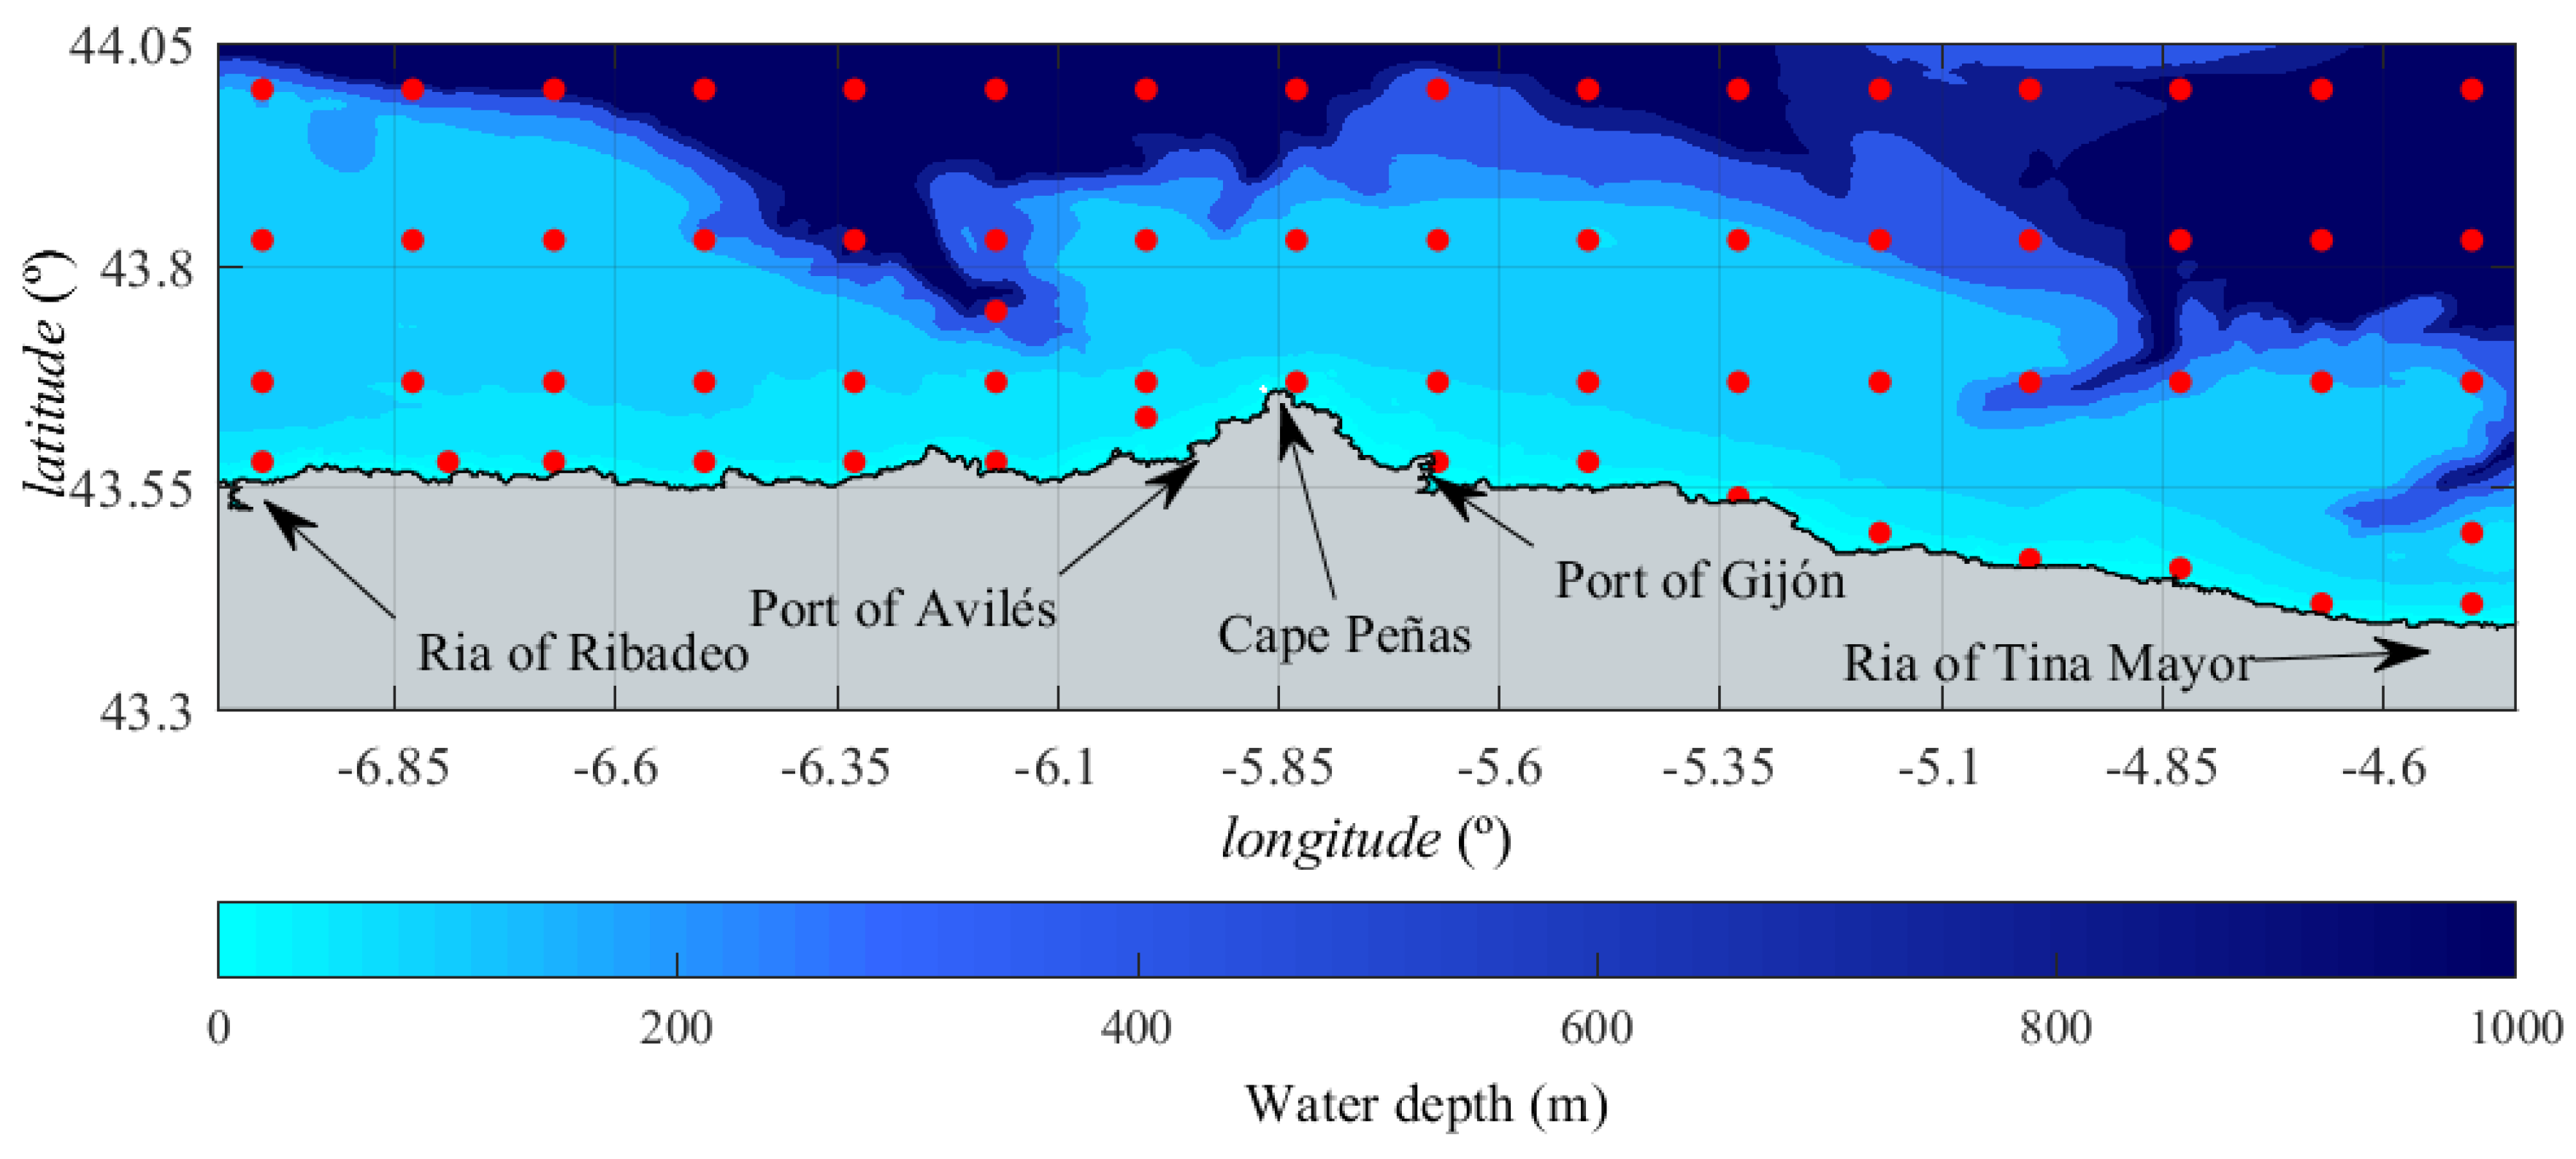
Figure 2.
Example of a wind speed distribution and the corresponding Weibull fit for a site in the area of the Port of Avilés (left) and the power curve of the 6.2M152 offshore wind turbine (right).
Figure 2.
Example of a wind speed distribution and the corresponding Weibull fit for a site in the area of the Port of Avilés (left) and the power curve of the 6.2M152 offshore wind turbine (right).
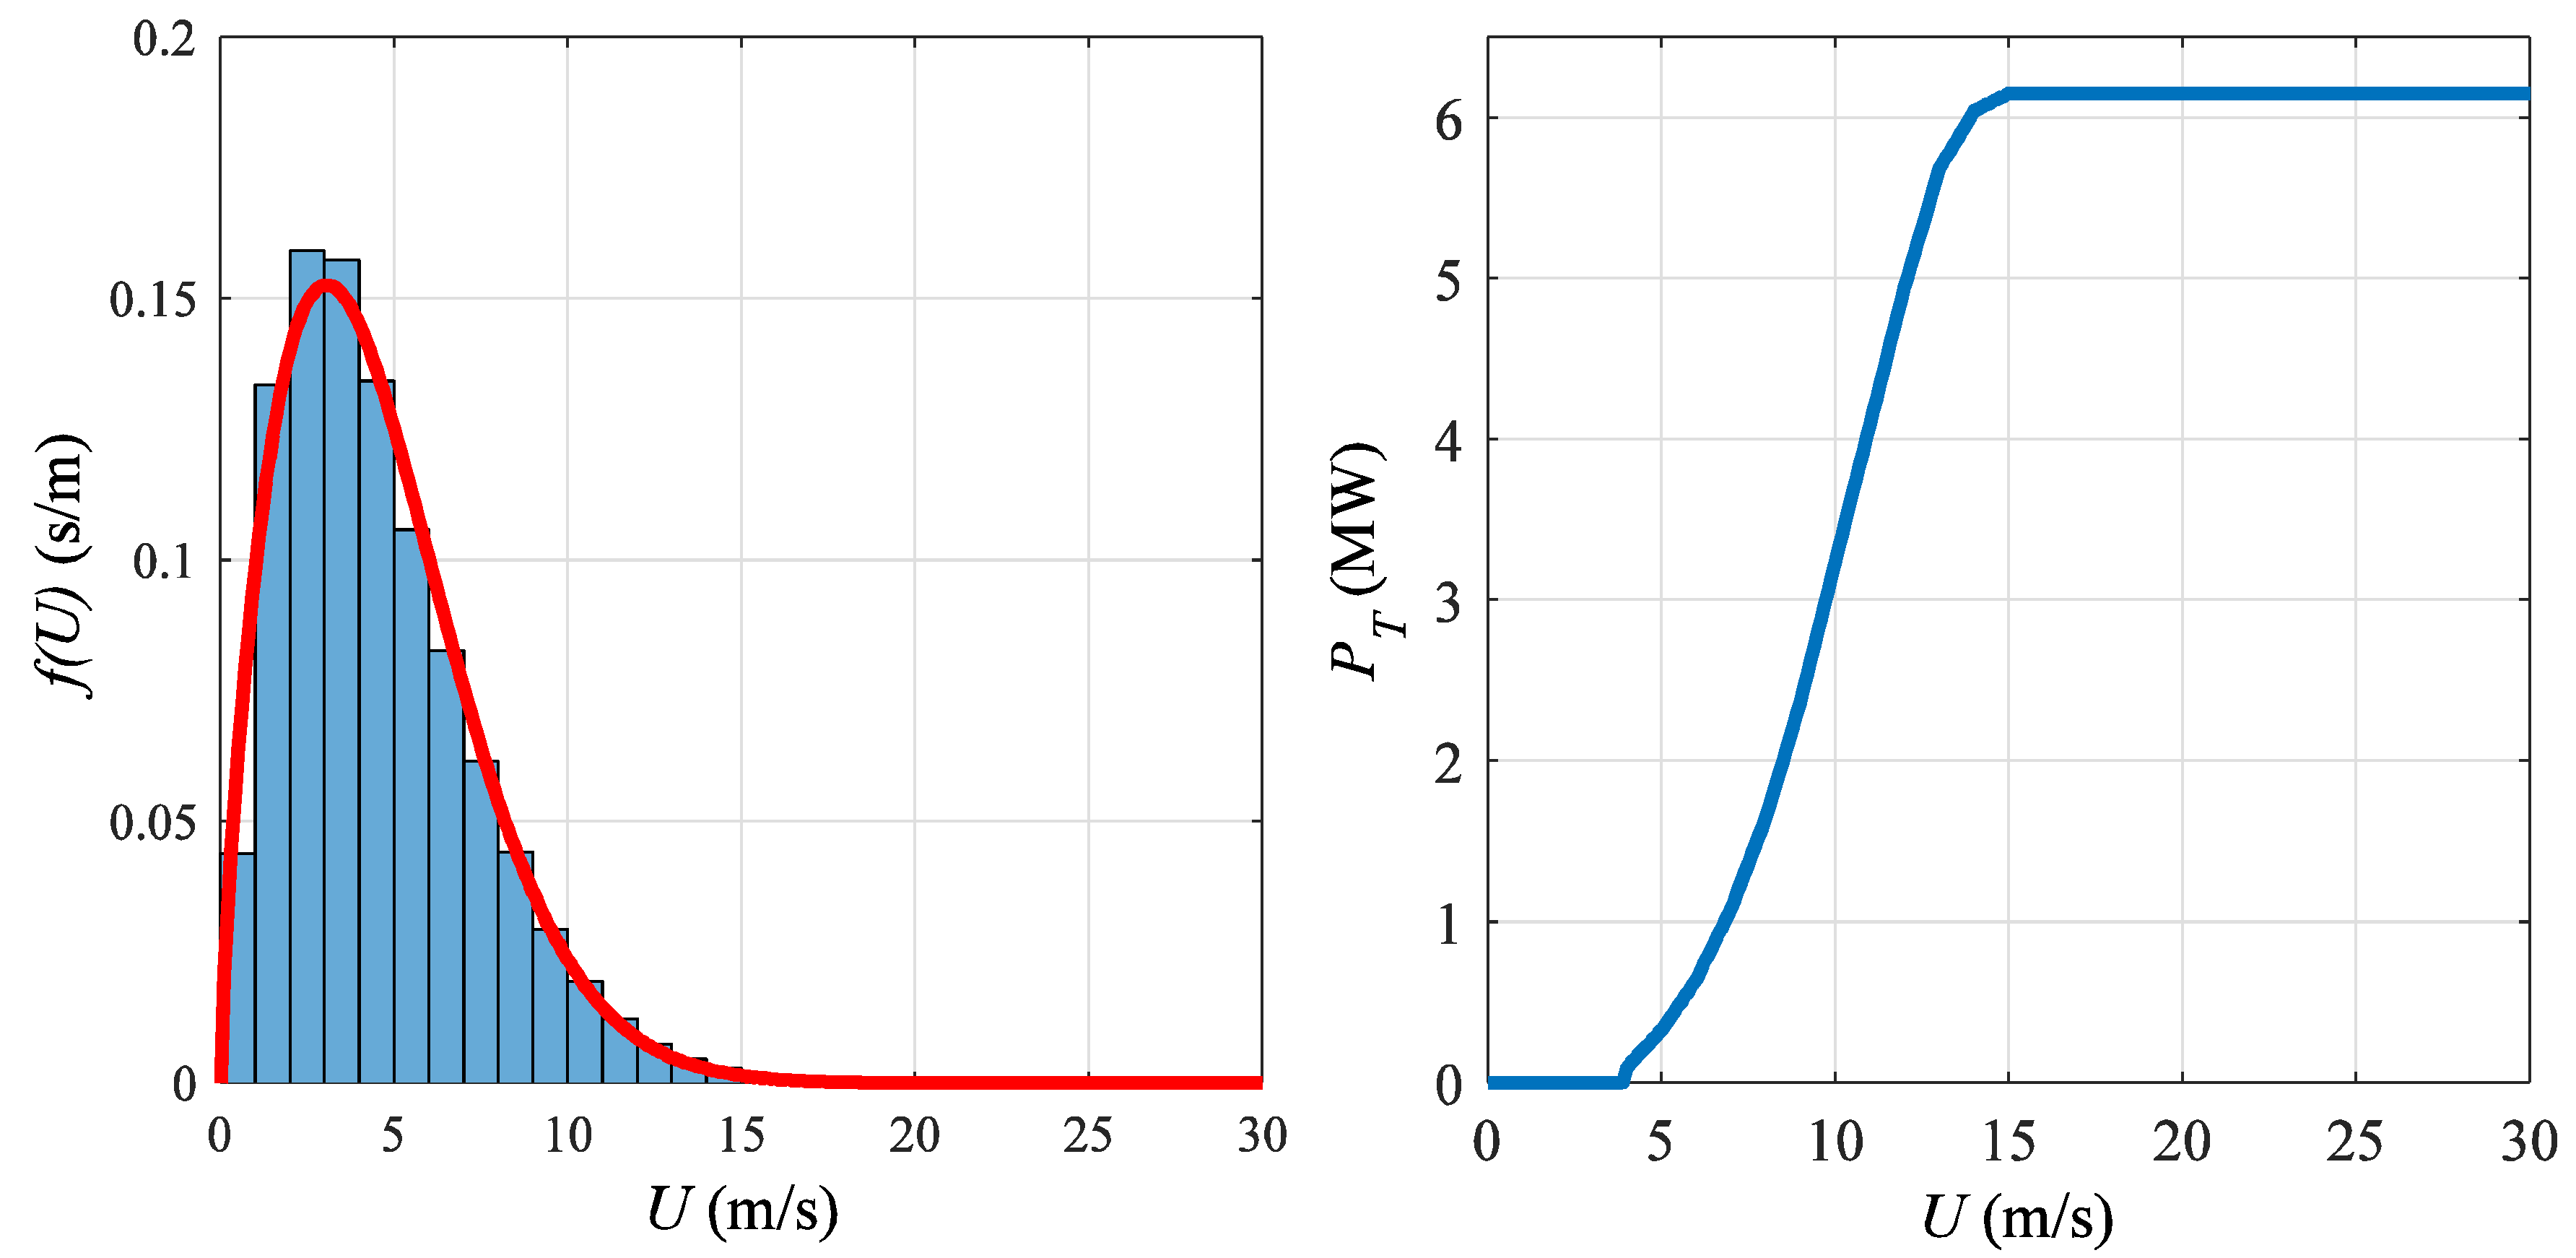
Figure 3.
Average gross wind power density (P) off Asturias coast corresponding to a height of 10 m above the sea surface level.
Figure 3.
Average gross wind power density (P) off Asturias coast corresponding to a height of 10 m above the sea surface level.
Publisher’s Note: MDPI stays neutral with regard to jurisdictional claims in published maps and institutional affiliations. |
© 2018 by the authors. Licensee MDPI, Basel, Switzerland. This article is an open access article distributed under the terms and conditions of the Creative Commons Attribution (CC BY) license (https://creativecommons.org/licenses/by/4.0/).
Share and Cite
MDPI and ACS Style
López, M.; Rodríguez-Fuertes, N.; Carballo, R. Offshore Wind Energy Resource Atlas of Asturias (N Spain). Proceedings 2018, 2, 1416. https://doi.org/10.3390/proceedings2231416
AMA Style
López M, Rodríguez-Fuertes N, Carballo R. Offshore Wind Energy Resource Atlas of Asturias (N Spain). Proceedings. 2018; 2(23):1416. https://doi.org/10.3390/proceedings2231416
Chicago/Turabian StyleLópez, Mario, Noel Rodríguez-Fuertes, and Rodrigo Carballo. 2018. "Offshore Wind Energy Resource Atlas of Asturias (N Spain)" Proceedings 2, no. 23: 1416. https://doi.org/10.3390/proceedings2231416