Modelling and Simulation of a Building Energy Hub †
by
Angel A. Bayod-Rújula
1,*, 
Yue Yuan
2,
Amaya Martínez-Gracia
3,
Jiangyu Wang
4,
Javier Uche
3 and
Huanxin Chen
4 1
CIRCE Institute, Department of Electrical Engineering, University of Zaragoza, 50009 Zaragoza, Spain
2
China-Eu Institute for clean and Renewable Energy, Huazhong University of Science and Technology, Wuhan 430074, China
3
CIRCE Institute, Department of Mechanical Engineering, University of Zaragoza, 50009 Zaragoza, Spain
4
Department of Refrigeration & Cryogenics, Huazhong University of Science and Technology, 1037 Luoyu Road, Wuhan 430074, China
*
Author to whom correspondence should be addressed.
†
Presented at the International Research Conference on Sustainable Energy, Engineering, Materials and Environment 2018, Mieres, Spain, 25–27 July 2018.
Proceedings 2018, 2(23), 1431; https://doi.org/10.3390/proceedings2231431
Published: 21 November 2018
(This article belongs to the Proceedings of The 2nd International Research Conference on Sustainable Energy, Engineering, Materials and Environment)
Abstract
:The development of technologies such as efficient multi-generation system, lead to realizing the benefits of integrated energy infrastructure such as electricity, natural gas, and heating networks, and thus a rapid movement toward multi-energy systems (MES). In such systems, different energy carriers and systems interact together in a synergistic way. An Energy hub (EH) can be defined as the place where the production, conversion, storage and consumption of different energy carriers takes place, is a promising option for integrated management of MES. In this work we present the hourly Schedule along a year of a building energy hub, with local generation of heat and power, energy storage and electrical and thermal loads. We include PVT systems and a CHP system in the local generation of heat and power, and a gas boiler. A battery is considered as electrical storage and a water tank as thermal storage. The system is connected to the mail grids of power and gas. The typical thermal and electrical load of a building has been considered, with a heat pump that is considered as a deferral load. The model for all the components has been developed, and a yearly simulation has been carried out in which prices of electricity and gas have been considered.
1. Introduction
An energy hub can be regarded as an input-output unit model integrating energy conversion, energy transport, energy storage and load dissipation, see Figure 1 [1].
The basic mathematical model of energy hub system is
In this formula, explicates the energy demand and demonstrates the power supply.
The basic matrix function of energy hub:
In this expression, cth is coupling factor, which represents the conversion efficiency between the ith form energy input and the jth form energy output.
Because energy hub has high abstract characteristics, no matter how heterogeneous a system is, it can be expressed in energy hub. In an energy hub model, there’s a lot of flexibility about input resource, such as electricity from conventional grid, renewable energy or nuclear. In order to explore what renewable energy can be involved in a distributed energy source system. It is reasonable that in [2,3,4,5], energy hub was designed by using grid electricity, natural gas or renewable energy such as solar and wind energy. Besides, the energy hub output side represents customers’ demand, which can be a known quantity. The energy saving, low economic cost and higher energy efficiency have been presented at the same time through running whole system under optimum operation rules [6,7,8].
2. Case Study
In this paper, a 3-storey residential building of 1660.73 m2 with 5 apartments per floor located in the city of Zaragoza (Spain) has been modeled for simulation (see Figure 2). Climate parameters of Zaragoza, including ambient temperature, solar irradiation and wind speed, have been taken from PVGIS database.
The daily average energy consumption of the building for each month is shown as Figure 3, where blue bars represent the electricity consumption and the red curve represents the heat demand. Electricity demand include air conditioning consumption and heat demand includes heating and hot water demand. As shown in Figure 3, in August, building has the most electricity consumption and the lowest heating demand. The highest electricity demand can approach 220 kWh per day and the highest heating demand is approximate 55 kWh per day.
The electricity price is calculated by local actual-time price in Spain in 2017 (Figure 4). The gas price according to Spain actual gas price selected by 0.0667 Euro/kWh and 0.0865 Euro/kWh. To these values we have to add the taxes
Table 1 shows the total energy cost, CO2 emissions and consumptions of gas and electricity if we only rely on grid to satisfied electricity and heating demand of this building, the economic cost is 1.1713 × 10⁴ Euro/year, being the total CO2 emissions 2.1711 × 10⁴ kg/year. In this way, it not only caused amount of economic costs and greenhouse gas emissions, but also caused a considerable impact on the power grid during the electricity consumption peak period, increasing power grid maintenance cost.
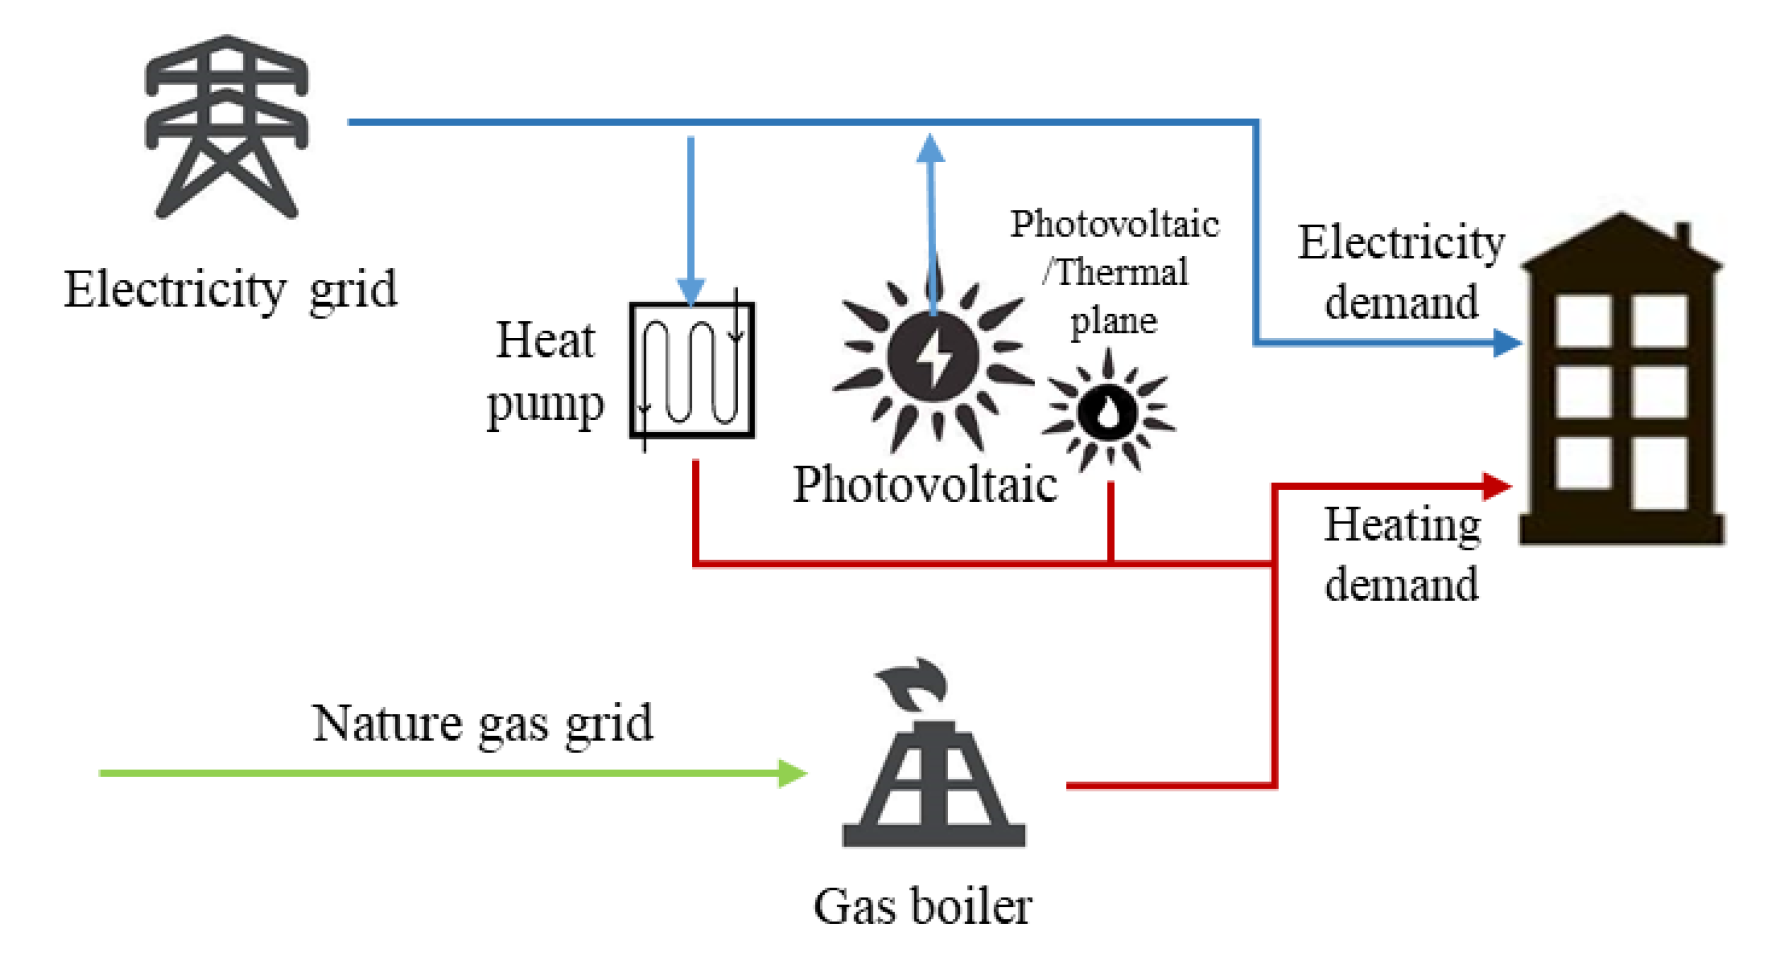
Accordingly, it is necessary to build an energy hub model according to this simulation building, which aim to decline the cost, decrease greenhouse gas emissions, and meanwhile relief grid’s pressure from peak load. In order to decrease economic cost of this building, heat pump (HP) and Photovoltaic plane (PV) introduced to constituent the energy hub HP is an equipment which can only take few electricity supply qualities of heating and cooling. Therefore, it’s often considered as a significant component introduce in energy hub. The HP mentioned in this paper selected COP as 3.2. In order to get the optimized result, multiple simulation experiments have been conducted on the different capacity combination of this two components. Each component parameter includes capacity, efficiency, capital cost, fixed cost and variable cost is shown in Table 2. And CO2 emission from grid is shown in Table 3 respectively.
In a conventional photovoltaic system, the conversion efficiency is approximate 15–20% generally. Part of unused solar energy will heat up the panel, causing efficiency and lifetime decline. It is obviously beneficial to collect thermal energy from solar while generating electricity from sunlight. This hybird system, which produces electricity and hea simultaneously is called Photovoltaic/Thermal (PV/T system).
The thermal part of PV/T system efficiencyis influenced by many factors, such as solar irradiation, pipe fluid temperature and so on, which can be represented as Equation (3).
In this equation, means the optical performance of the PV/T system. and are the thermal losses coefficients, in this paper set as 3.3 (W/m2)/K and 0.018(W/m2)/K2 respectively. represents solar irradiation. is average value of pipe fluid temperature and is ambient temperature.
The annual cost of energy hub is comprised by 3 parts. Electricity from grid, gas from net and components cost, at the meantime components cost include average installation cost, operation and management annual fee, which shown as Equation (4).
The result shown as Table 4 and Table 5, while operating with 20 kW HP and 65 m2 PV, the economic cost reach the minimum value 1.0727 × 10⁴ Euro/year. The CO2 emission achieve 1.356 × 10⁴ kg/year at the meantime. Compared to supply all electricity and heating from grid, 8.42% economic cost will be saved and reduce 37.54% CO2 emission. We can illustrate that introduce suitable capacity of HP and PV system can cut cost and reduce carbon emission simultaneously. With more renewable energy participant into the hub, the lower CO2 emission energy hub system will achieve. So, the CO2 emission can’t obtain the minimum value with economic cost at same time.
In order to obtain an optimal value with the least amount of computation, around the global area of PV/T and PV system around 65 m2, several different PV/T to PV proportions are calculated. The result is shown in Table 6. The optimal capacity of PV/T and PV system is when the capacity of PV is 36 m2 and PV/T is 30 m2. Compared to original system present in Table 4 and Table 5, 2.4% cost and 3.24% CO2 emission will be saved this system.
3. Conclusions
In this work, a multi-variable energy hub model has been designed for a residential building. Besides the fundamental elements such as main grid, natural gas net and gas boiler, heat pump and photovoltaic panel are considered in the initial energy hub system. Secondly, next, the optimal proportion between PV system and PV/T system has been considered. The efficiency of the electrical and thermal generation of both systems (PV and PV/T) are considered variable. The results show that the optimal scheduling method is beneficial to improve energy utilization efficiency and the practical application of renewable energy, reducing greenhouse gas emissions.
References
- Favre-Perrod, P. A vision of future energy networks. In Proceeding of the Power Engineering Society Inaugural Conference and Exposition in Africa. Durban, South Africa, 11–15 July 2006; pp. 13–17. [Google Scholar]
- Setlhaolo, D.; Sichilalu, S.; Zhang, J. Residential load management in an energy hub with heat pump water heater. Appl. Energy 2017, 208, 551–560. [Google Scholar] [CrossRef]
- Sharif, A.; Almansoori, A.; Fowler, M.; Elkamel, A.; Alrafea, K. Design of an energy hub based on natural gas and renewable energy sources. Int. J. Energy Res. 2014, 38, 363–373. [Google Scholar] [CrossRef]
- Maniyali, Y.; Almansoori, A.; Fowler, M.; Elkamel, A. Energy Hub Based on Nuclear Energy and Hydrogen Energy Storage. Ind. Eng. Chem. Res. 2013, 52, 7470–7481. [Google Scholar] [CrossRef]
- Pazouki, S.; Haghifam, M.R. Optimal planning and scheduling of energy hub in presence of wind, storage and demand response under uncertainty. Int. J. Electr. Power Energy Syst. 2016, 80, 219–239. [Google Scholar] [CrossRef]
- Thanhtung, H.A.; Zhang, Y.; Thang, V.V.; Huang, J. Energy hub modeling to minimize residential energy costs considering solar energy and BESS. J. Mod. Power Syst Clean Energy 2017, 5, 389–399. [Google Scholar]
- Zhang, X.; Shahidehpour, M.; Alabdulwahab, A.; Abusorrah, A. Optimal Expansion Planning of Energy Hub with Multiple Energy Infrastructures. IEEE Trans. Smart Grid 2017, 6, 2302–2311. [Google Scholar] [CrossRef]
- Vahid-Pakdel, M.J.; Nojavan, S.; Mohammadi-Ivatloo, B.; Zare, K. Stochastic optimization of energy hub operation with consideration of thermal energy market and demand response. Energy Convers. Manag. 2017, 145, 117–128. [Google Scholar] [CrossRef]
- Ma, T.; Wu, J.; Hao, L. Energy flow modeling and optimal operation analysis of the micro energy grid based on energy hub. Energy Convers. Manag. 2017, 133, 292–306. [Google Scholar] [CrossRef]
- Sheikhi, A.; Ranjbar, A.M.; Safe, F. A novel method to determine the best size of CHP for an energy hub system. In Proceedings of the 2011 2nd International Conference on Electric Power and Energy Conversion Systems (EPECS), Sharjah, United Arab Emirates, 15–17 November 2011; pp. 1–7. [Google Scholar]
- Wang, Y.; Hou, K.; Jia, H.; Mu, Y.; Zhu, L.; Li, H.; Rao, Q. Decoupled Optimization of Integrated Energy System Considering CHP Plant Based on Energy Hub Model. Energy Procedia 2017, 142, 2683–2688. [Google Scholar] [CrossRef]
- Wang, H.; Zhang, H.; Gu, C.; Li, F. Optimal design and operation of CHPs and energy hub with multi objectives for a local energy system. Energy Procedia 2017, 142, 1615–1621. [Google Scholar] [CrossRef]
Figure 1.
Energy hub definition.

Figure 2.
Simulation model in Energy plus.
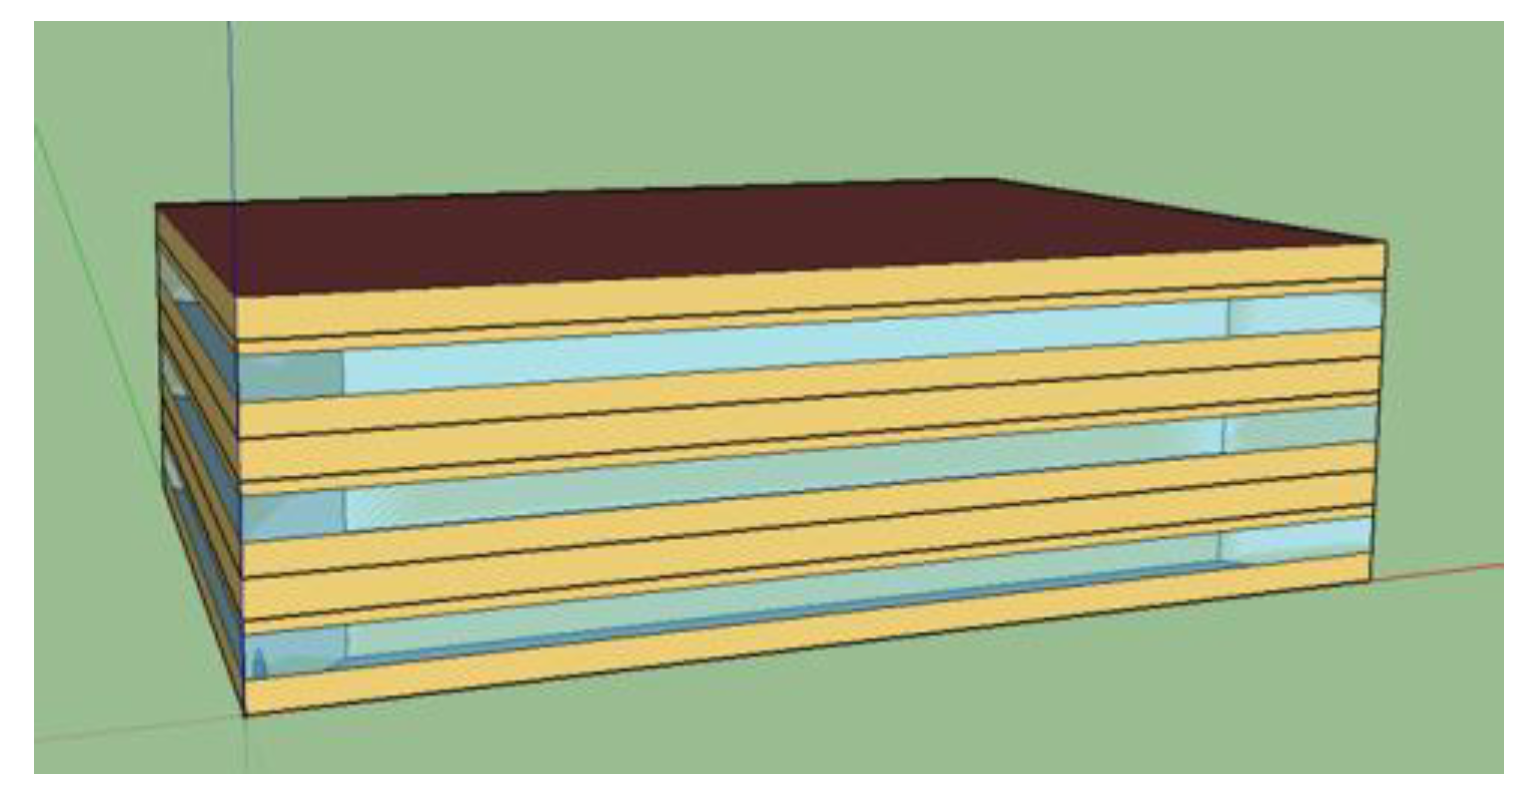
Figure 3.
Daily energy consumption of simulation building each month.
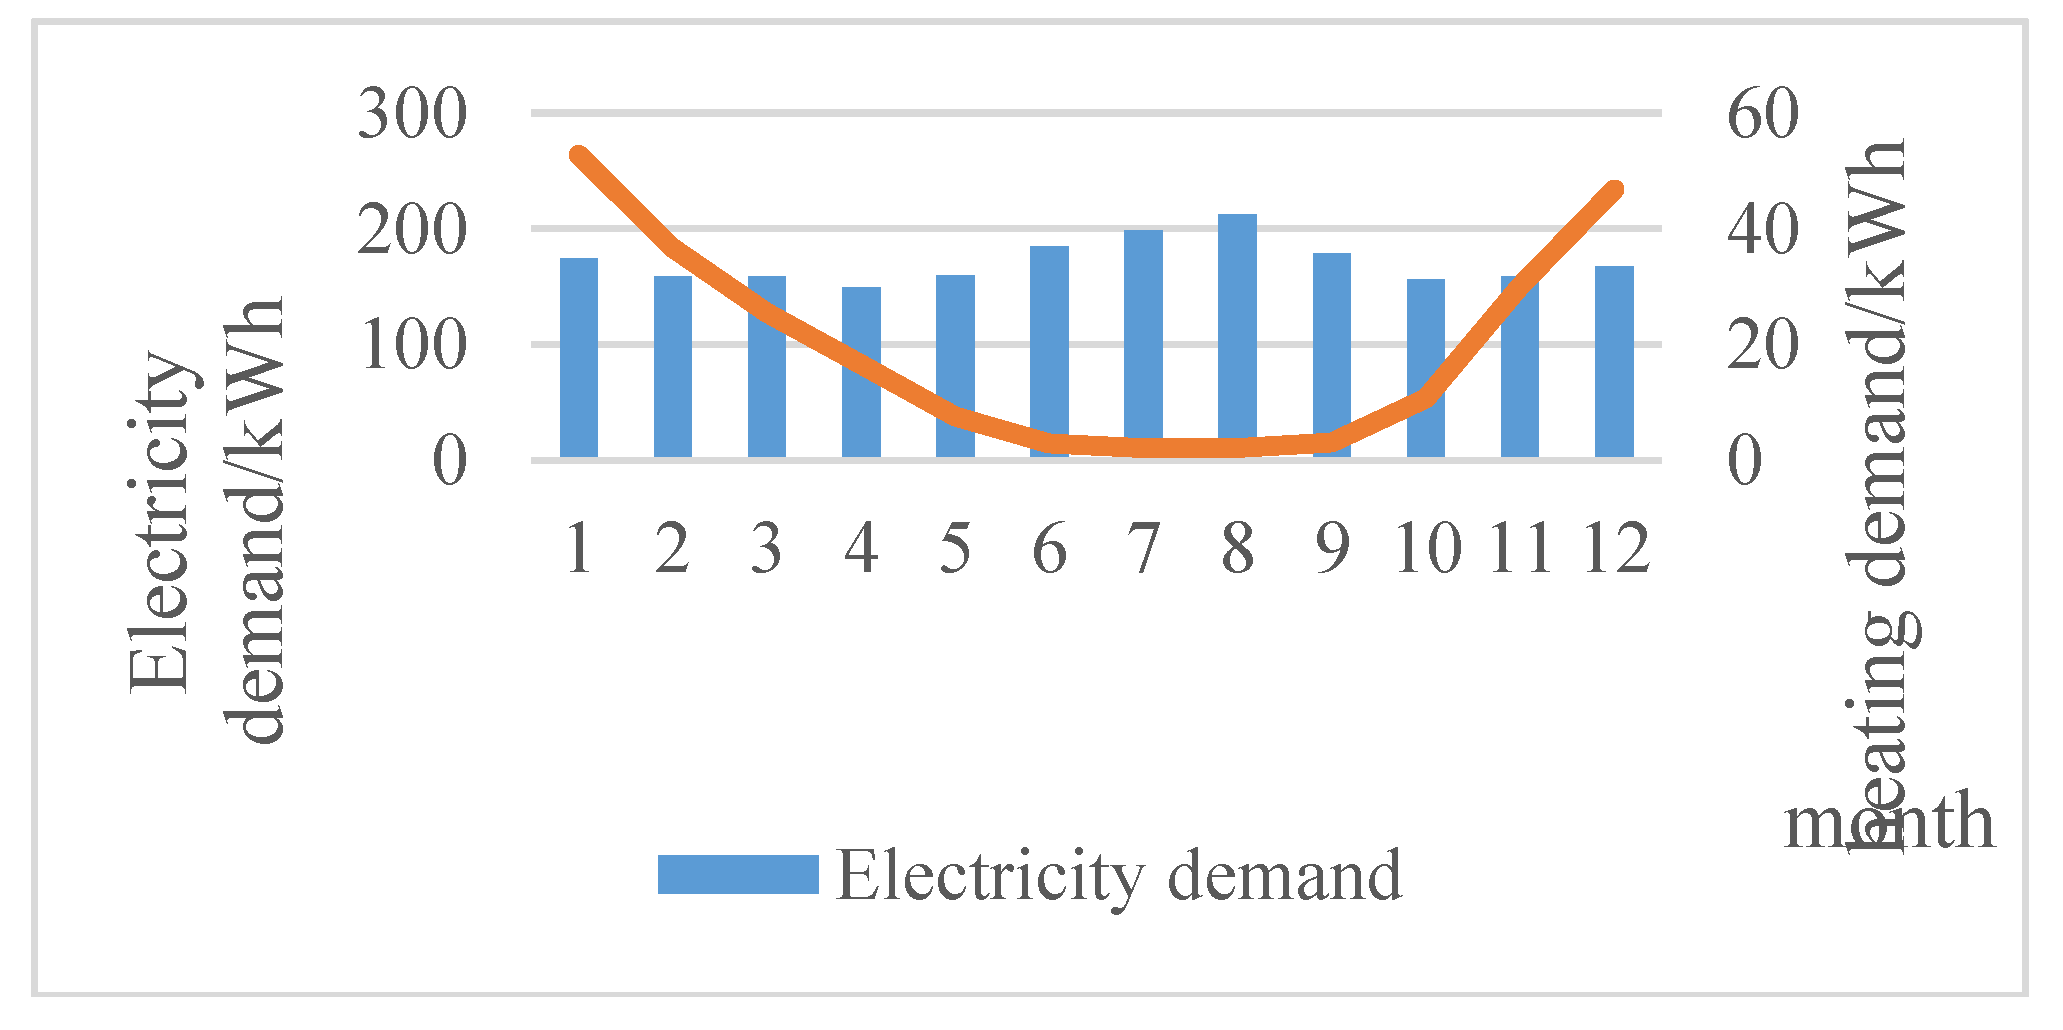
Figure 4.
Single Building energy hub model.

Table 1.
Energy consumption only supply by net.
| Cost (Euro/Year) | CO2 Emission (kg/Year) | Gas Consumption (kWh/Year) | Electricity Consumption (kWh/Year) |
|---|---|---|---|
| 1.1713 × 10⁴ | 2.1711 × 10⁴ | 2.0518 × 10⁴ | 6.2589 × 10⁴ |
Table 2.
Energy hub component parameters.
| Component | Efficiency | Capìtal Cost | Lifetime |
|---|---|---|---|
| Gas Boiler | 70% | 800 Euro/kW | 20 |
| Heat Pump | 3.2 (average COP) | 1000 Euro/kW | 20 |
| PV | 17%, PR = 0.8 | 1500 Euro/kW | 30 |
| PVT | variable | 700 Euro/m2 | 30 |
Table 3.
Other parameters.
| Name | Value with Unit |
|---|---|
| CO2 emission from grid electricity | 0.280 kg/kWh |
| CO2 emission from natural gas | 0.204 kg/kWh |
Table 4.
Annual Cost for single building under Different PV and HP capacity (×104 Euro/year).
| HP Capacity (kW) | ||||||||
|---|---|---|---|---|---|---|---|---|
| PV Capacity (m2) | 0.5 | 1 | 5 | 10 | 20 | 25 | 30 | |
| 5 | 1.1514 | 1.1378 | 1.1220 | 1.0984 | 1.0953 | 1.1005 | 1.1090 | |
| 10 | 1.1468 | 1.1333 | 1.1175 | 1.0939 | 1.0908 | 1.0960 | 1.1045 | |
| 20 | 1.1402 | 1.1266 | 1.1108 | 1.0872 | 1.0841 | 1.0893 | 1.0978 | |
| 30 | 1.1363 | 1.1226 | 1.1068 | 1.0832 | 1.0801 | 1.0853 | 1.0938 | |
| 50 | 1.1309 | 1.1173 | 1.1014 | 1.0778 | 1.0747 | 1.0799 | 1.0884 | |
| 60 | 1.1295 | 1.1158 | 1.0998 | 1.0762 | 1.0731 | 1.0783 | 1.0868 | |
| 65 | 1.1295 | 1.1157 | 1.0996 | 1.0758 | 1.0727 | 1.0778 | 1.0864 | |
| 70 | 1.1315 | 1.1175 | 1.1012 | 1.0772 | 1.0740 | 1.0792 | 1.0877 | |
Table 5.
Annual CO2 emission for single building under Different PV and HP capacity (×104 kg/year).
| HP Capacity (kW) | ||||||||
|---|---|---|---|---|---|---|---|---|
| PV Capacity (m2) | 0.5 | 1 | 5 | 10 | 20 | 25 | 30 | |
| 5 | 2.088 | 2.054 | 2.009 | 1.923 | 1.891 | 1.865 | 1.852 | |
| 10 | 2.041 | 2.008 | 1.963 | 1.876 | 1.845 | 1.818 | 1.806 | |
| 20 | 1.952 | 1.919 | 1.874 | 1.787 | 1.756 | 1.730 | 1.717 | |
| 30 | 1.869 | 1.836 | 1.791 | 1.704 | 1.673 | 1.647 | 1.634 | |
| 50 | 1.708 | 1.674 | 1.629 | 1.542 | 1.511 | 1.485 | 1.472 | |
| 60 | 1.630 | 1.596 | 1.551 | 1.464 | 1.432 | 1.406 | 1.393 | |
| 65 | 1.554 | 1.520 | 1.475 | 1.387 | 1.356 | 1.330 | 1.317 | |
| 70 | 1.482 | 1.448 | 1.402 | 1.315 | 1.283 | 1.257 | 1.244 | |
Table 6.
Energy hub Performance of different PV and PV/T capacity.
| PV Capacity (m2) | PV/T Capacity (m2) | Global PV Area (m2) | Cost (×104 Euro/Year) | Electricity Consumption (×104 kWh/year) | CO2 Emissions (×104 kg/Year) | PVT Generation (kWh/Year) | HP Electricity Consumption (×103 kWh/Year) |
|---|---|---|---|---|---|---|---|
| 28 | 20 | 48 | 1.0573 | 5.40 | 1.60 | 118.9 | 3.45 |
| 24 | 52 | 1.0532 | 4.80 | 1.43 | 142.7 | 3.43 | |
| 30 | 58 | 1.0473 | 4.60 | 1.37 | 178.3 | 3.39 | |
| 30 | 20 | 50 | 1.0567 | 4.85 | 1.44 | 118.9 | 3.45 |
| 24 | 54 | 1.0528 | 4.72 | 1.41 | 142.7 | 3.43 | |
| 30 | 60 | 1.0471 | 4.52 | 1.35 | 178.3 | 3.39 | |
| 36 | 20 | 56 | 1.056 | 4.71 | 1.40 | 118.9 | 3.45 |
| 24 | 60 | 1.0523 | 4.58 | 1.37 | 142.7 | 3.43 | |
| 30 | 66 | 1.047 | 4.38 | 1.31 | 178.3 | 3.39 | |
| 40 | 20 | 60 | 1.0556 | 4.54 | 1.36 | 118.9 | 3.45 |
| 24 | 64 | 1.0521 | 4.41 | 1.32 | 142.7 | 3.43 | |
| 30 | 70 | 1.0475 | 4.22 | 1.27 | 178.3 | 3.39 | |
| 42 | 20 | 62 | 1.0555 | 4.49 | 1.34 | 118.9 | 3.45 |
| 24 | 66 | 1.0522 | 4.36 | 1.31 | 142.7 | 3.43 | |
| 30 | 72 | 1.0478 | 4.17 | 1.25 | 178.3 | 3.39 | |
| 48 | 20 | 68 | 1.0556 | 4.38 | 1.31 | 118.9 | 3.45 |
| 24 | 72 | 1.0526 | 4.26 | 1.28 | 142.7 | 3.43 | |
| 30 | 78 | 1.0488 | 4.07 | 1.23 | 178.3 | 3.39 |
Publisher’s Note: MDPI stays neutral with regard to jurisdictional claims in published maps and institutional affiliations. |
© 2018 by the authors. Licensee MDPI, Basel, Switzerland. This article is an open access article distributed under the terms and conditions of the Creative Commons Attribution (CC BY) license (https://creativecommons.org/licenses/by/4.0/).
Share and Cite
MDPI and ACS Style
Bayod-Rújula, A.A.; Yuan, Y.; Martínez-Gracia, A.; Wang, J.; Uche, J.; Chen, H. Modelling and Simulation of a Building Energy Hub. Proceedings 2018, 2, 1431. https://doi.org/10.3390/proceedings2231431
AMA Style
Bayod-Rújula AA, Yuan Y, Martínez-Gracia A, Wang J, Uche J, Chen H. Modelling and Simulation of a Building Energy Hub. Proceedings. 2018; 2(23):1431. https://doi.org/10.3390/proceedings2231431
Chicago/Turabian StyleBayod-Rújula, Angel A., Yue Yuan, Amaya Martínez-Gracia, Jiangyu Wang, Javier Uche, and Huanxin Chen. 2018. "Modelling and Simulation of a Building Energy Hub" Proceedings 2, no. 23: 1431. https://doi.org/10.3390/proceedings2231431