A Novel Geometry for Shear Test Using Axial Tensile Setup †
by
Sibo Yuan
1,*, 
Laurent Duchêne
1,
Olivier Milis
2,
Clément Keller
3,
Eric Hug
4 and
Anne-Marie Habraken
1,5 1
ArGEnCo Department, University of Liège, 4000 Liège, Belgium
2
Laboratory for Materials and Structures, University of Liège, 4000 Liège, Belgium
3
Groupe de Physique des Matériaux, INSA Rouen, Université de Rouen, UMR CNRS 6634, 76800 Saint-Etienne du Rouvray, France
4
Laboratoire de Cristallographie et Science des Matériaux, UNICAEN, 14050 Caen, France
5
Research Director of the Fonds de la Recherche Scientifique—FNRS, B-1000 Brussels, Belgium
*
Author to whom correspondence should be addressed.
†
Presented at the 18th International Conference on Experimental Mechanics, Brussels, Belgium, 1–5 July 2018.
Proceedings 2018, 2(8), 422; https://doi.org/10.3390/ICEM18-05277
Published: 28 May 2018
(This article belongs to the Proceedings of The 18th International Conference on Experimental Mechanics)
Abstract
:This paper studies a novel geometry for the in-plane shear test performed with an axial electromechanical testing machine. In order to investigate the influence of the triaxiality rate on the mechanical behavior, different tests will be performed on the studied material: simple tensile tests, large tensile tests and shear tests. For the whole campaign, a common equipment should be employed to minimize the impact of the testing device. As a consequence, for the shear tests, the geometry of the specimen must be carefully designed in order to adapt the force value and make it comparable to the one obtained for the tensile tests. Like most of the existing shear-included tensile test specimens, the axial loading is converted to shear loading at a particular region through the effect of geometry. A symmetric shape is generally preferred, since it can restrict the in-plane rotation of the shear section, keep shear increasing in a more monotonic path and double the force level thanks to the two shear zones. Due to the specific experimental conditions, such as dimensions of the furnace and the clamping system, the position of the extensometer or the restriction of sheet thickness (related to the further studies of size effect at mesoscale and hot temperature), several geometries were brought up and evaluated in an iterative procedure via finite element simulations. Both the numerical and experimental results reveal that the final geometry ensures some advantages. For instance, a relatively low triaxiality in the shear zone, limited in-plane rotation and no necking are observed. Moreover, it also prevents any out-of-plane displacement of the specimen which seems to be highly sensitive to the geometry, and presents a very limited influence of the material and the thickness.
1. Introduction
In the present study, a novel specimen geometry for the in-plane shear test is proposed. By benefiting from this exotic geometry, the shear test can be carried out with the common experimental equipment as the one used for the tensile tests and the plane strain tests. The interest of using a single press is to avert the uncertain impacts from the equipment for different loading paths during the experimental campaign. The main objective to develop such in-plane shear test is to prepare the further investigation of the downscaling effects on the mechanical behavior at different triaxility rates and various temperatures [1,2,3,4].
In order to comply with equipment constraints, the geometry of the shear test sample is required to be redesigned in order to adapt the force level to make it comparable to the one obtained for the tensile tests. Like most of the proposed geometries in the literature [5,6,7,8,9], the axial loading is converted to shear the material at a specific region thanks to the effects of the geometry. An iterative procedure is numerically performed by finite element simulations to determinate the best geometry yielding to a homogenous shear zone whose finality is assessed thanks to the triaxiality ratio T (pure shear corresponds to T = 0), free from the spurious deformation modes in the sample. The results are further validated by experiments with different materials and thicknesses of specimens.
2. Numerical Modeling
Considering the potential in-plane rotation of the shear zone, a symmetric geometry is preferred as shown in Figure 1a. By reason of the constraints of experimental conditions, such as the dimension of the furnace and the clamping device, the position of the extensometer’s arm etc., the global dimensions (in mm) are defined and shown in Figure 1a. As the final goal is to investigate the scale effect under different strain paths and temperatures, this experimental campaign have to deal with sheet thickness of 0.5 mm to follow the previous researches [2,3,4,10]. The shaded area denotes the grip zone and will not be considered in the simulation. The parameters l and h refer to the width between the two shear zones and the height of the latter respectively. The mesh and the boundary conditions for the middle part with the height of 80 mm are illustrated in Figure 1b.
The symmetry about Y-Z plane (Figure 1b) is taken into account; hence only a half of the sample is modeled. The imposed displacement at the top surface acts as the driving force to deform the specimen. An extra out-of-plane force is applied near the shear zone (see Figure 1b) aiming to break the perfect symmetry of the model along the thickness direction to trigger the possible out-of-plane deformation. As shown in Figure 1c, the out-of-plane force is merely applied at the beginning of the simulation and its magnitude remains relatively small, the peak value is 3 N. Once the deformed geometry is eventually unsymmetric, the axial load continues to deform the specimen. The imposed displacement UY evolves linearly from 0 to 10 mm throughout the simulation.
An isotropic elastoplastic constitutive law (the hardening behavior is expressed by Equation (1)) is utilized and the relevant parameters are listed in Table 1.
3. Numerical Results
3.1. Influence of and Parameters
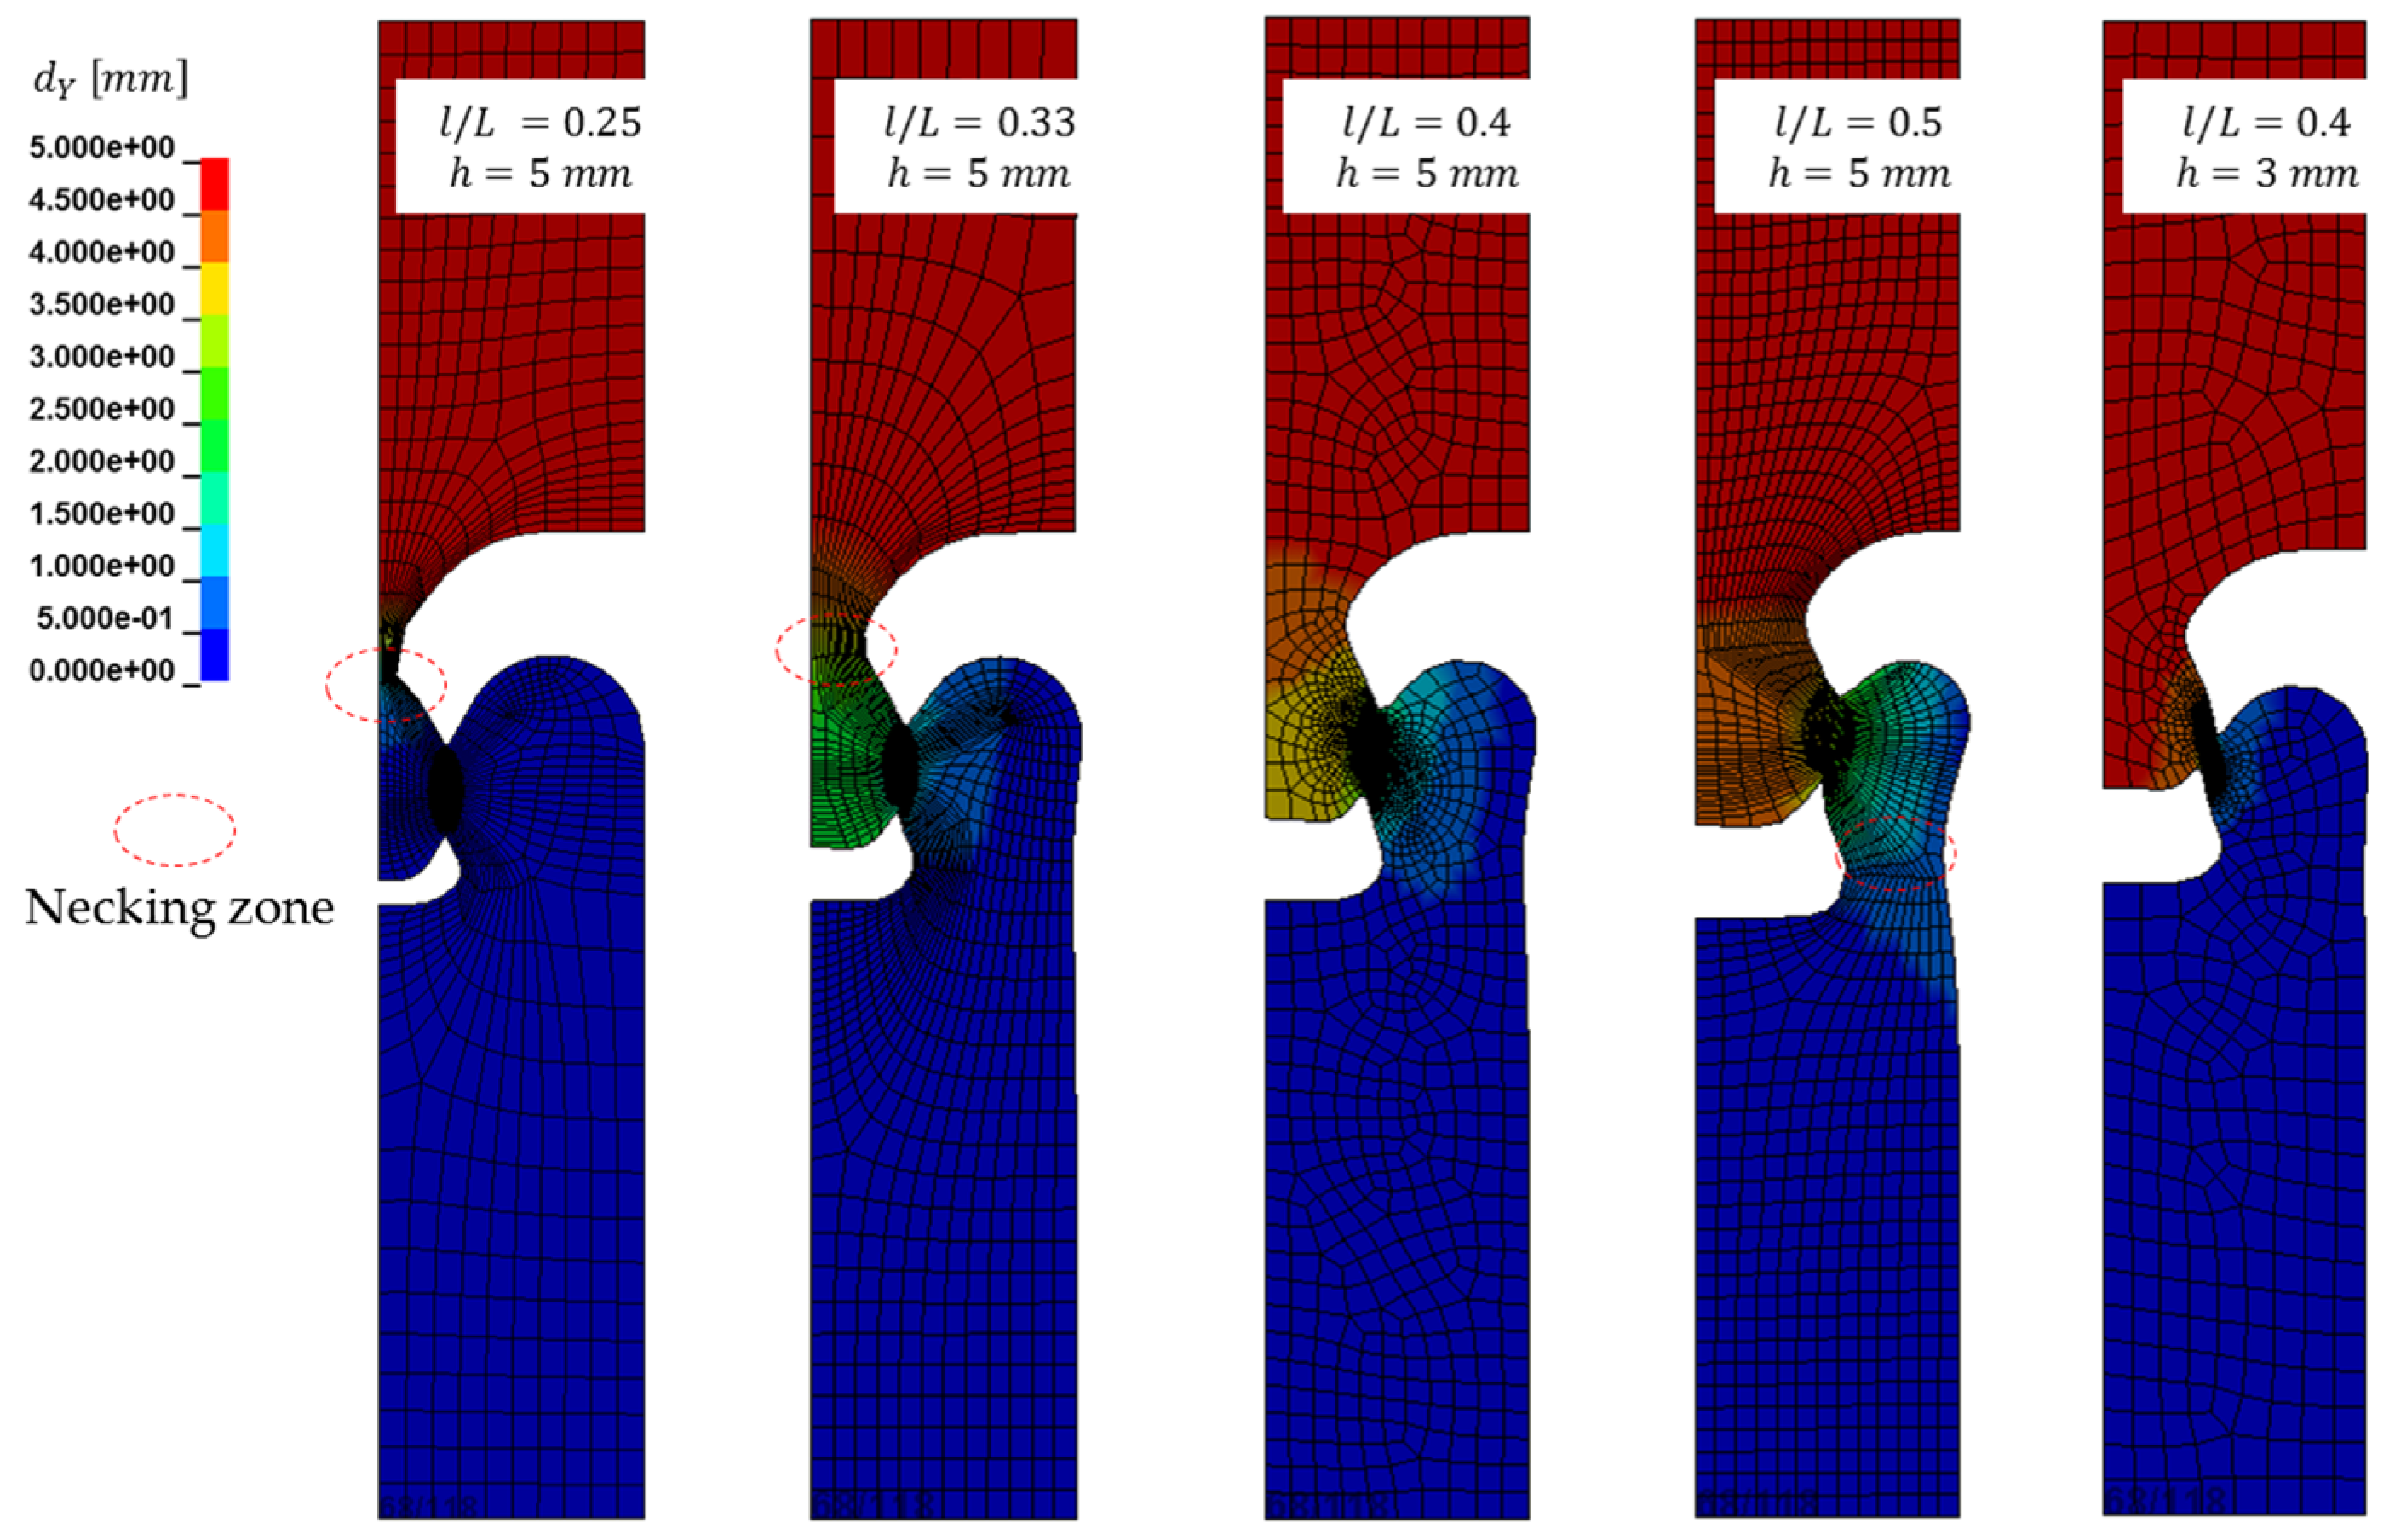
Figure 2 depicts the deformed configurations for different l and h values. The parameter L denotes the initial width of the specimen which is 30 mm as shown in Figure 1a. The fringe levels refer to the displacement field along the loading direction. The material inside the shear zone is supposed to be purely sheared when one side of the shear zone moves vertically and the other side remains immobile. It is additionally desired that such displacement appears without generating any necking zone in the sample. Hence, the geometries with l/L ratios of 0.25, 0.33 and 0.5 are already eliminated.
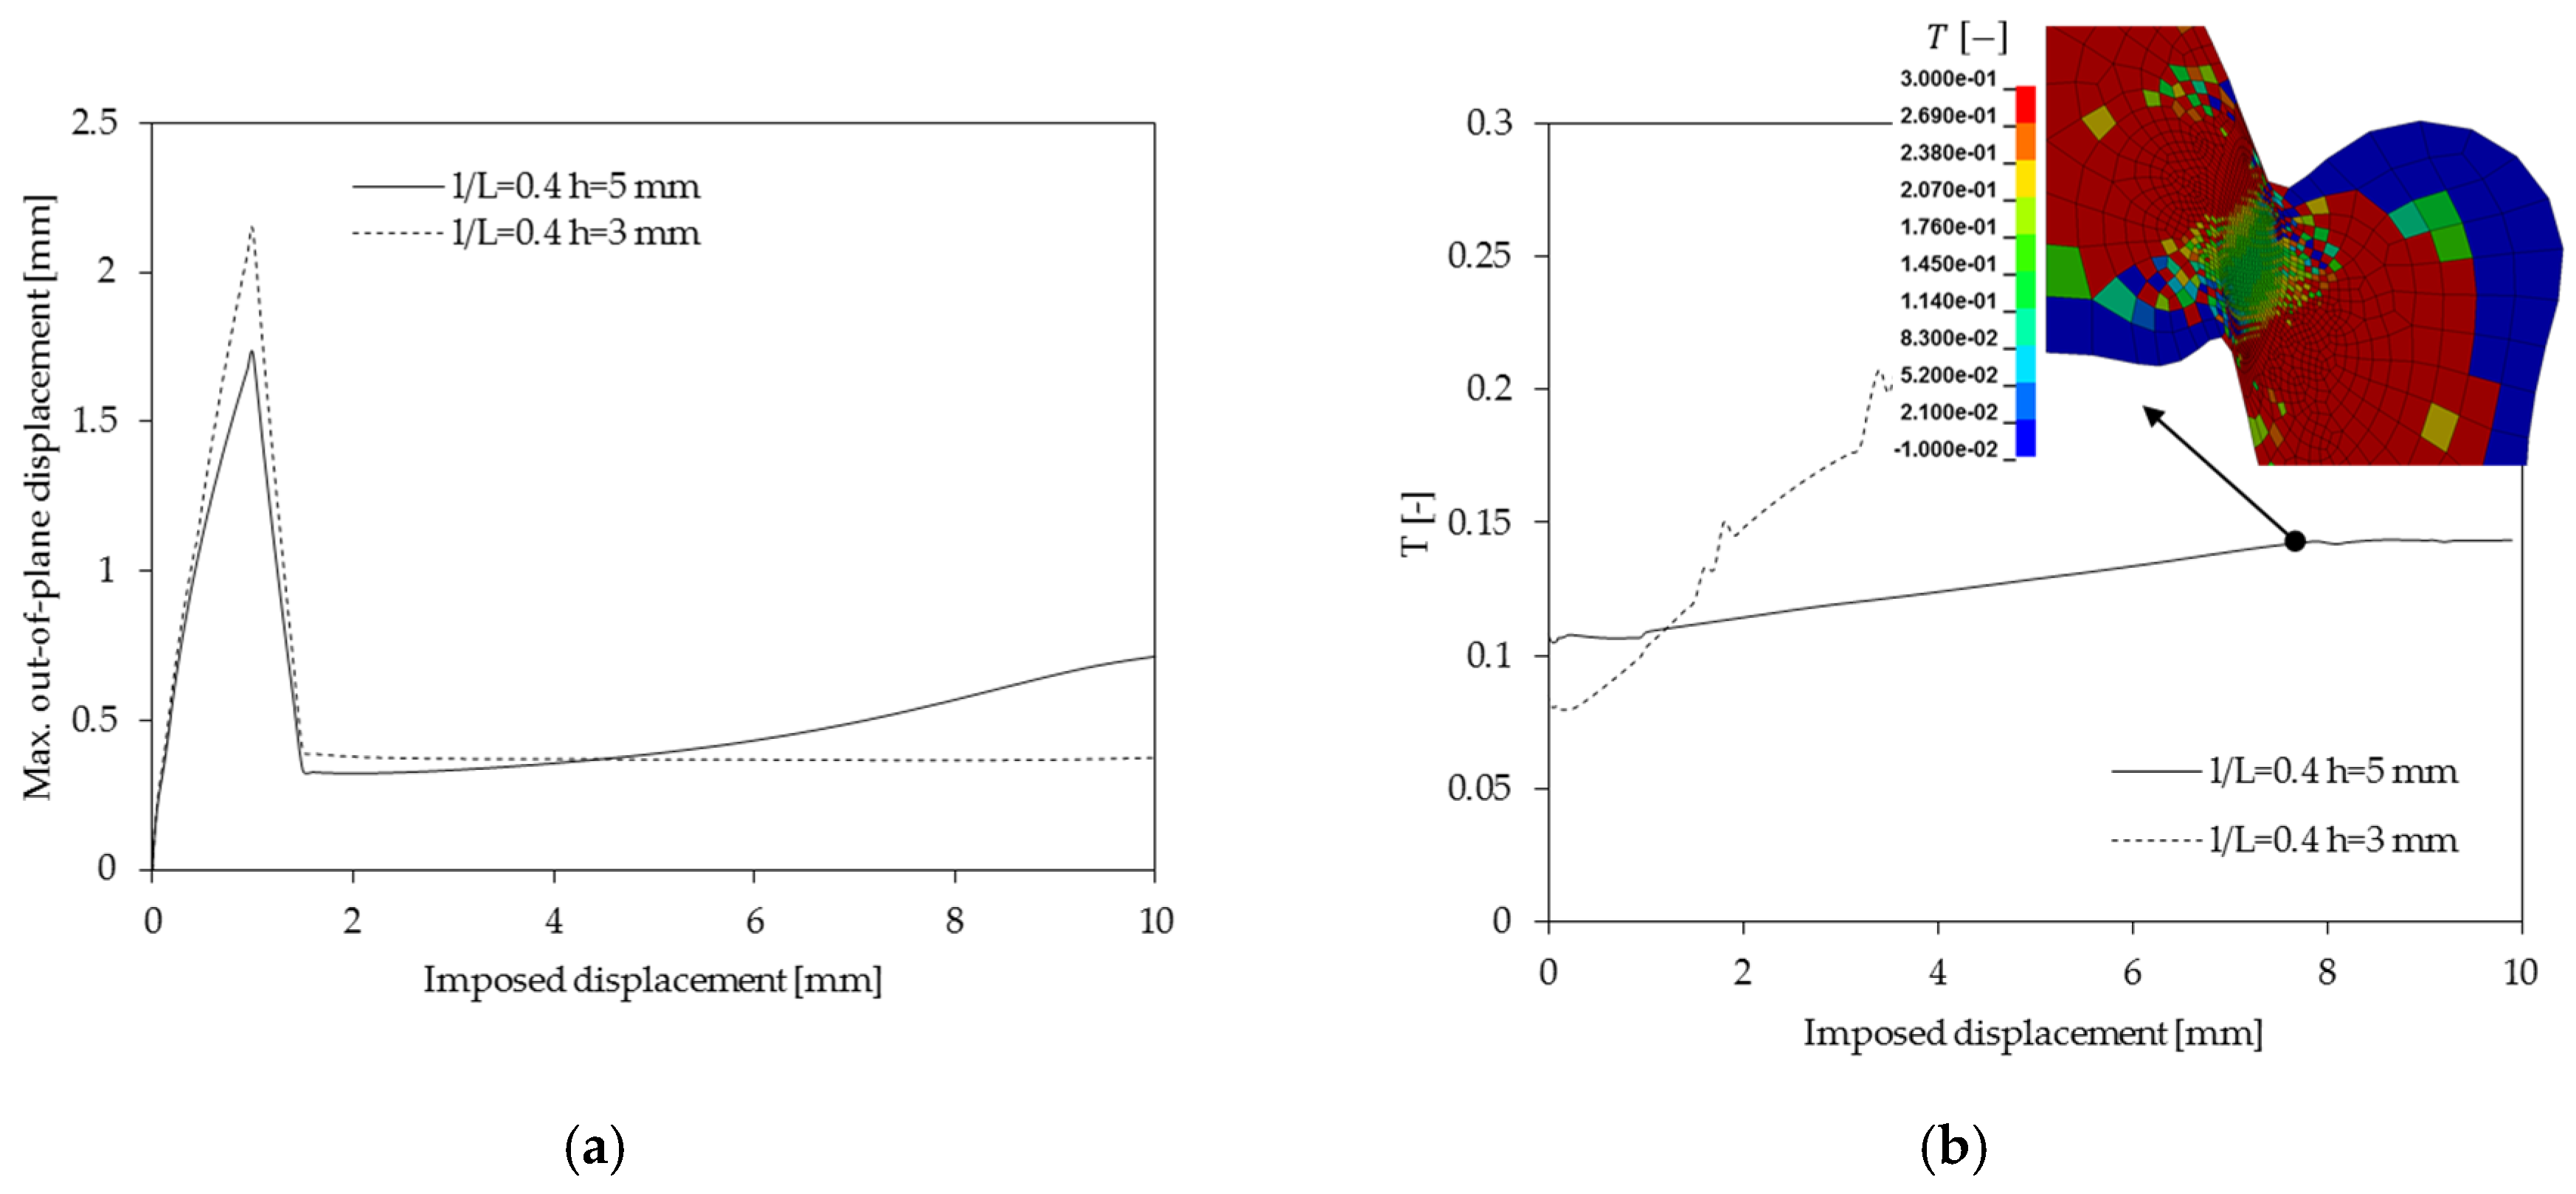
According to the results of Figure 3, an appropriate height of the shear zone seems to be more critical to obtain the targeted triaxiality ratio rather than to the out-of-plane deformation. Reducing the height of the shear zone could decrease a little the out-of-plane displacement but risks of resulting in an unstable triaxiality since the shear zone is quickly deformed and tends to rupture. The insert fringe level image in Figure 3b shows an example of the triaxiality field for a given imposed displacement, UY = 9 mm. A homogenous distribution of the latter could be obtained with a height of the shear zone of 5 mm.
3.2. Influence of Shift of Shear Zone
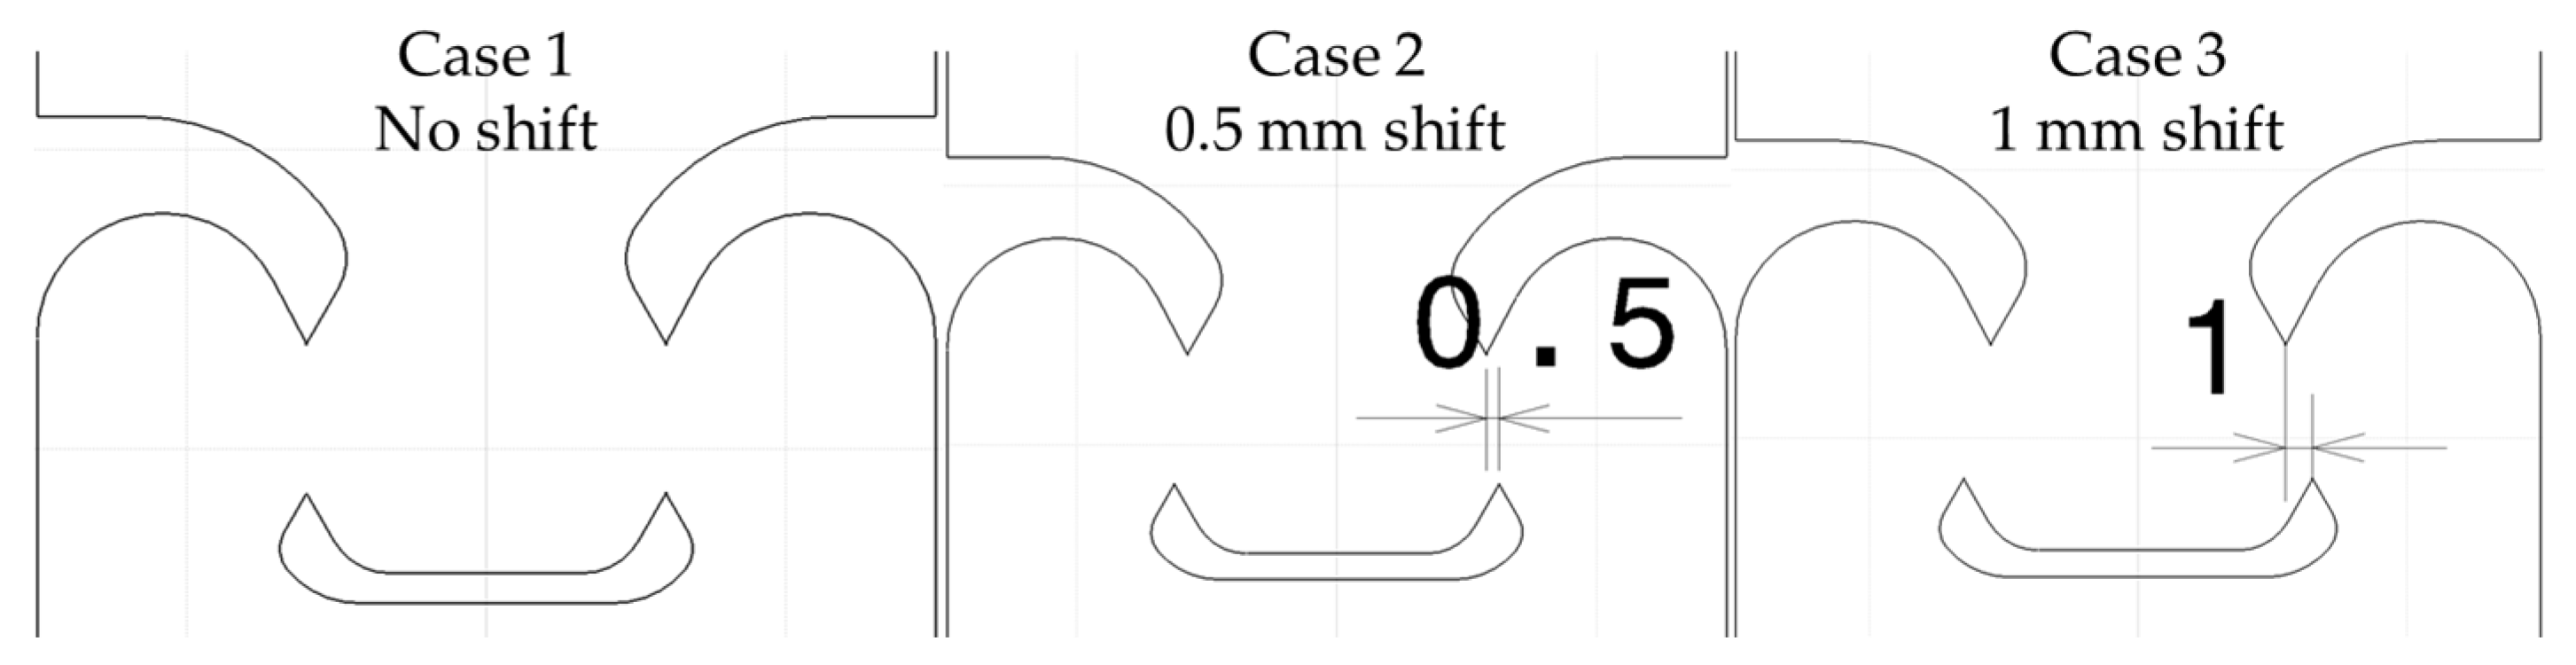
From Section 3.1, only the geometry with a l/L ratio of 0.4 and a height of the shear zone h of 5 mm seems workable. Two variants of this geometry are proposed by shifting the shear zone of 0.5 mm and 1 mm respectively, as presented in Figure 4.
Regarding the triaxiality ratio, it could be slightly reduced by shifting the shear zone as revealed in Figure 5b. However, the shift induces a larger shear section which, in turn, is likely to produce the out-of-plane deformation (Figure 5a). Consequently, the in-plane shear could be jeopardized by a shifted shear zone, as confirmed experimentally hereunder.
4. Experimental Results
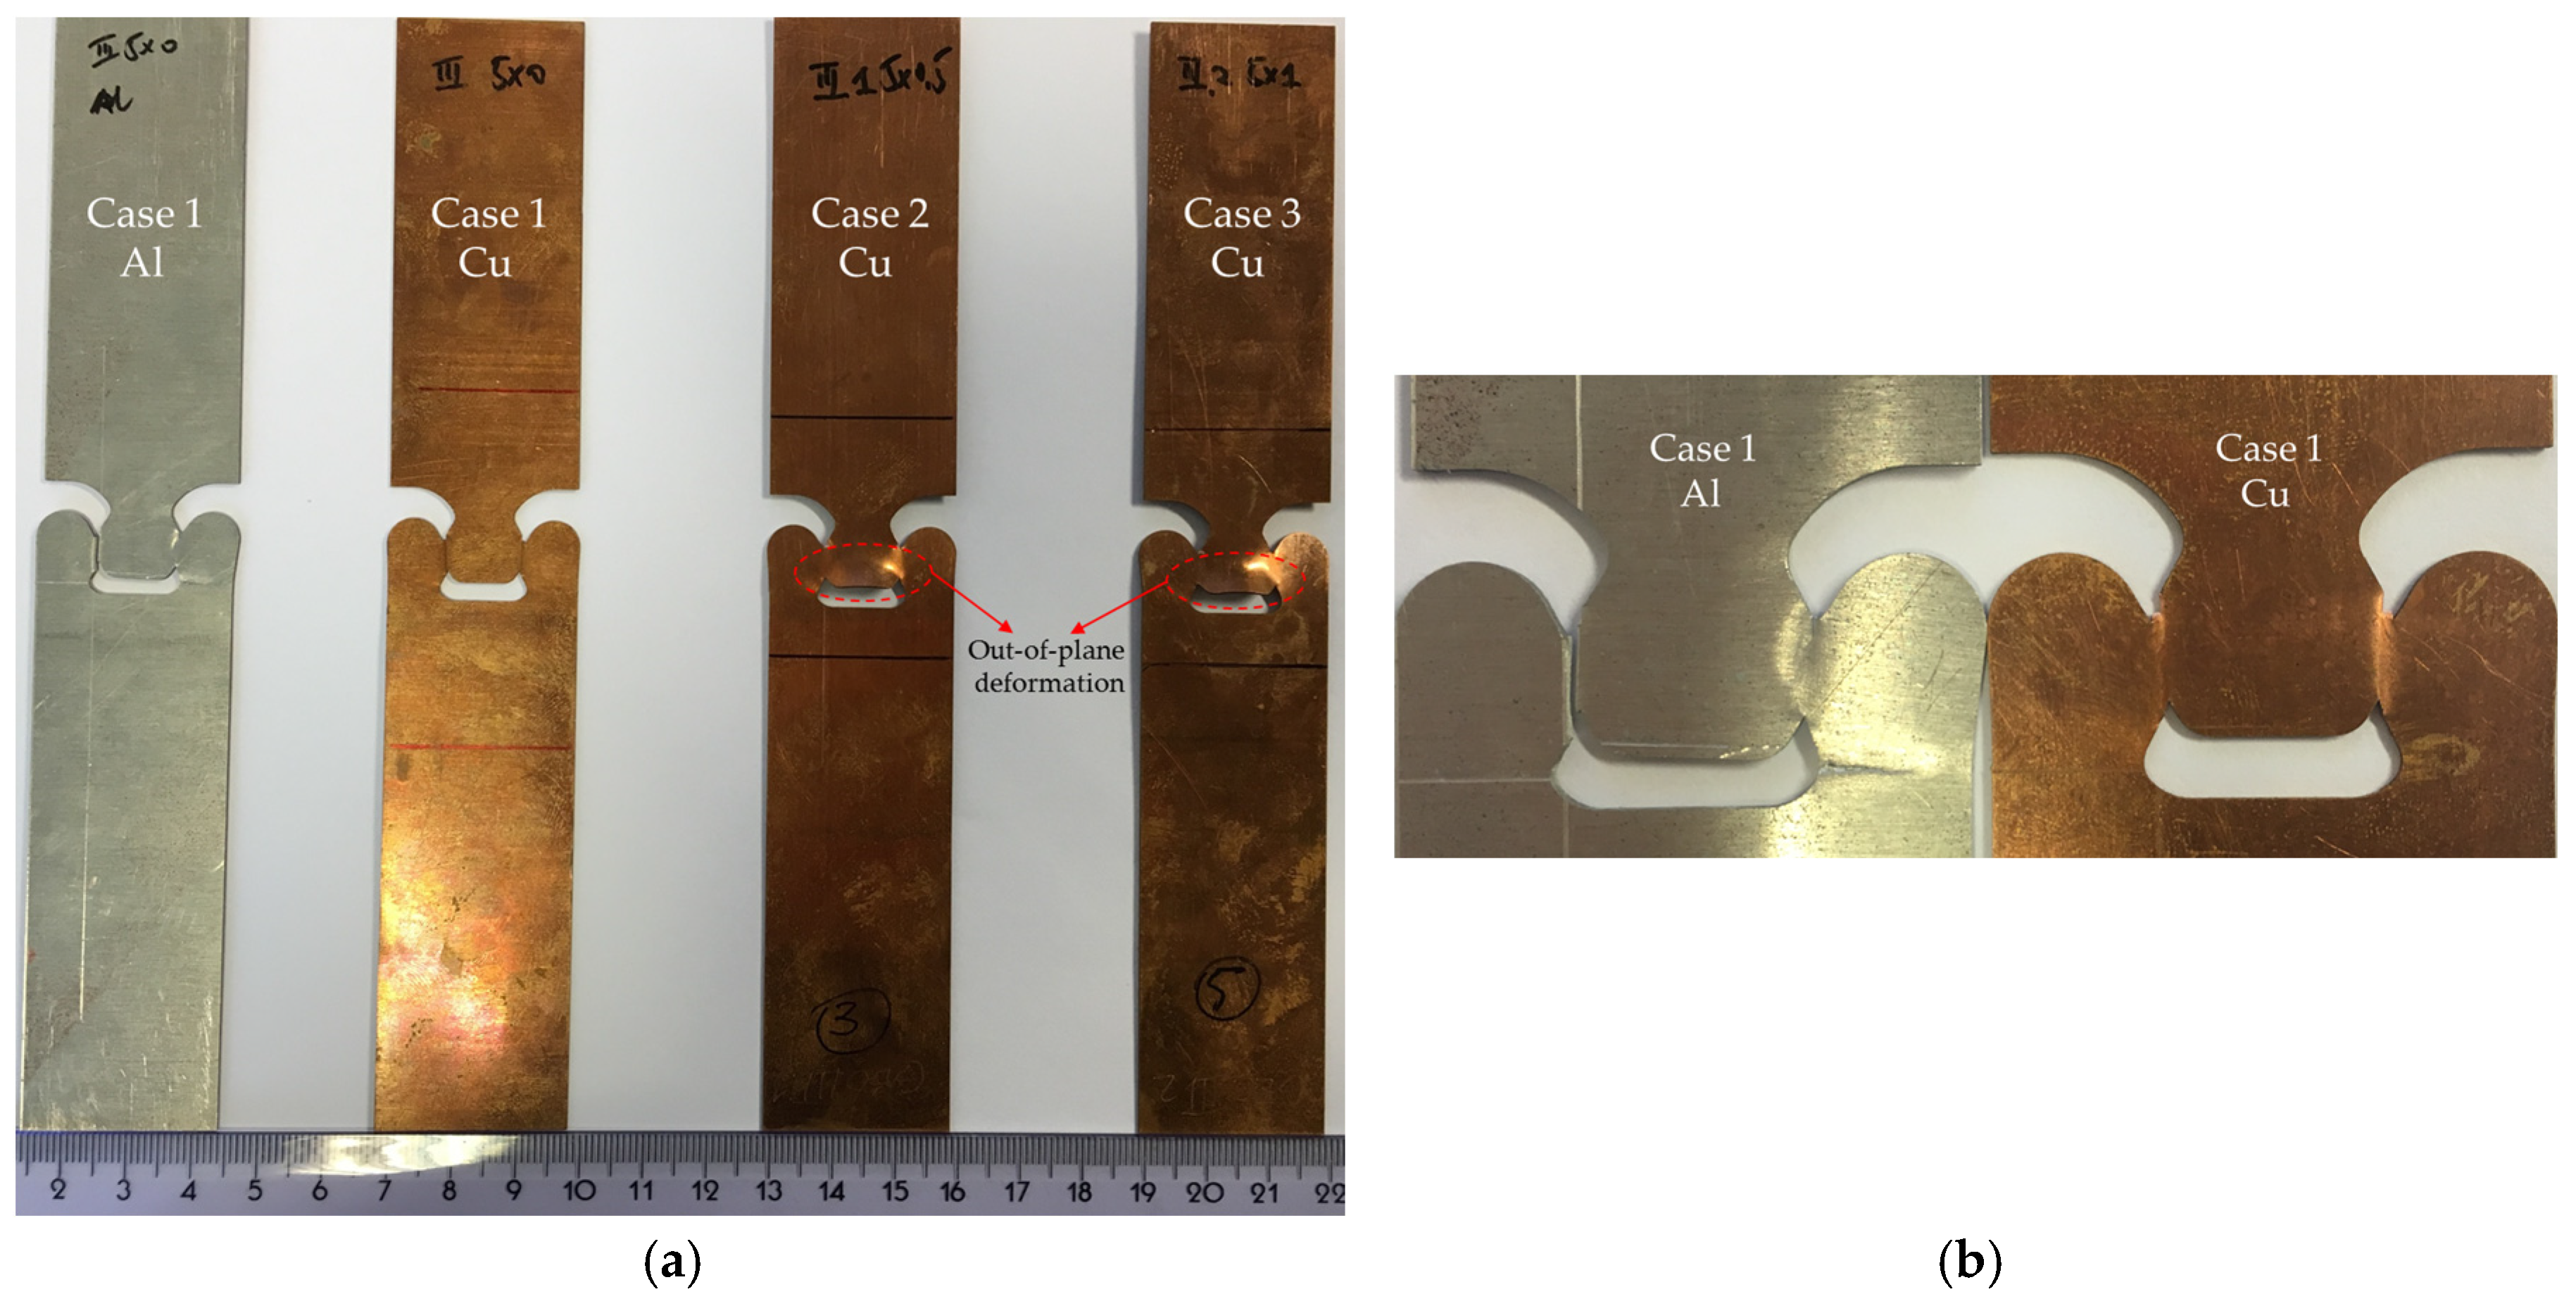
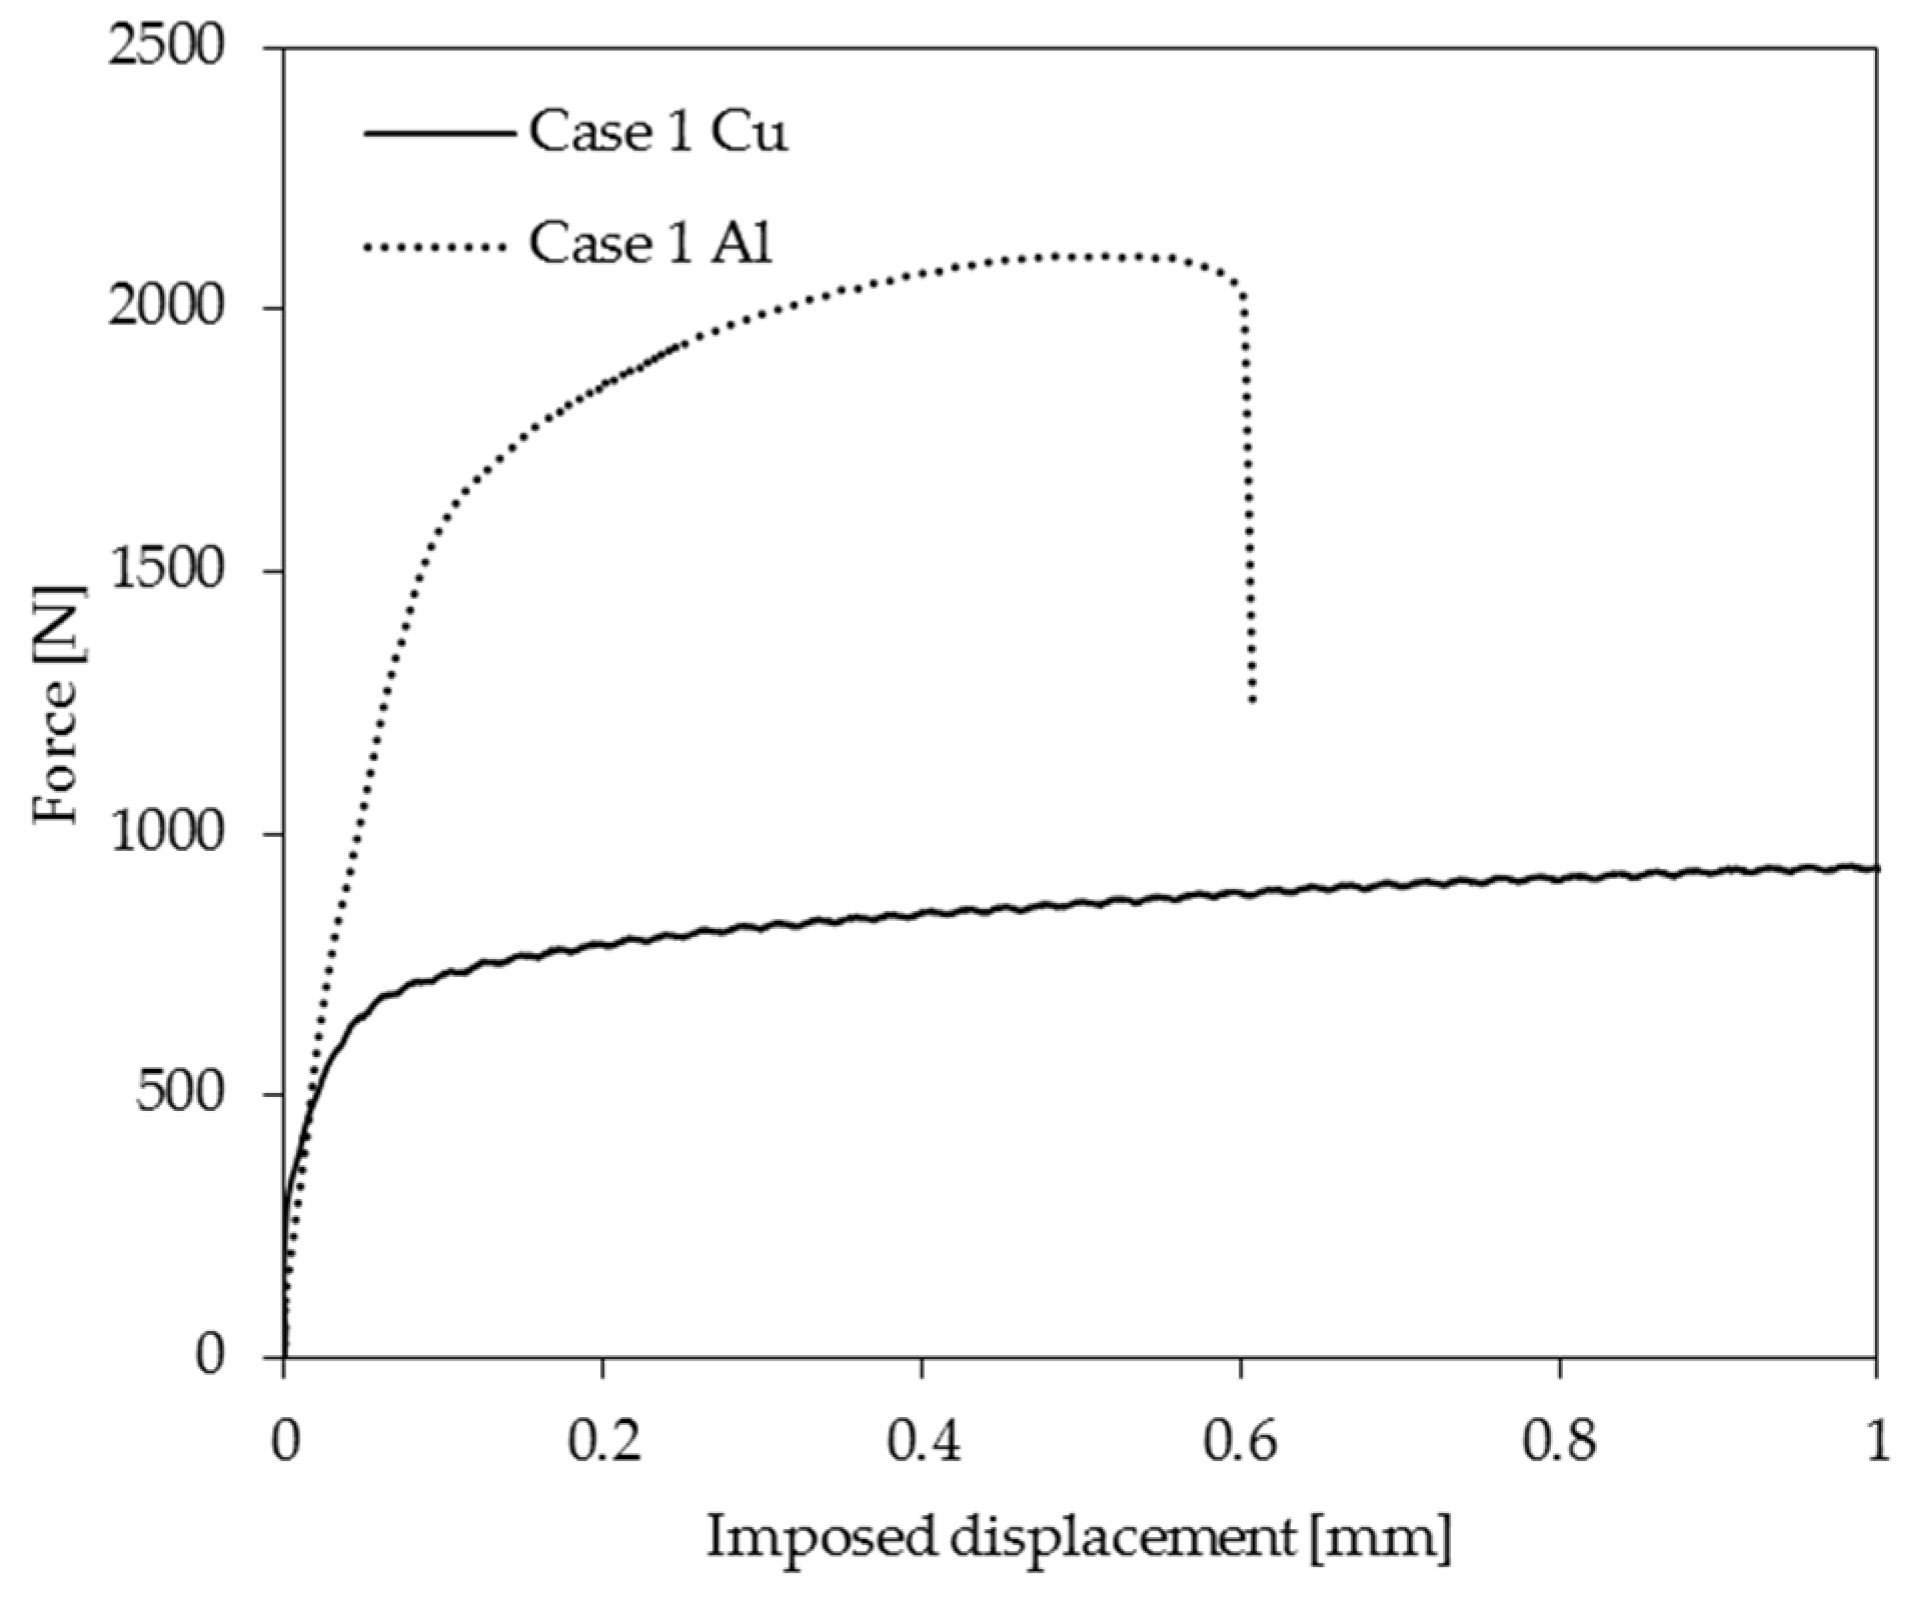
The aforementioned geometries with non-shifted and shifted shear zones are tested by the experiments at room temperature with different materials and thicknesses of the specimen. As shown in Figure 6, aluminum and copper samples were tested. The different values of the shift of the shear zone are solely employed for the copper samples. The thicknesses of the aluminum and copper samples are 1 mm and 0.5 mm respectively. As revealed by the numerical studies, the shifted shear zones yield a visible out-of-plane deformation as demonstrated in Figure 6a. In contrast, the non-shifted case could ensure a quasi-purely sheared zone regardless of the material and the thickness of the samples. The evolution of the tensile force is drawn in Figure 7 as a function of the imposed displacement for the non-shifted shear zone (case 1).
5. Conclusions
Through an iterative procedure, the final geometry proposed in this study provides a relatively low triaxiality and remains stable during the hardening stages, allowing the material in the designed region to be sheared in a monotonic path. In addition, the triaxiality field in the shear zone is fairly homogenous. Both the numerical and experimental results reveal that the studied geometry could prevent any out-of-plane displacement of the specimen which seems to be thickness and material independent but highly sensitive to the geometry. The in-plane rotation could also be drastically limited using a symmetric sample.
Acknowledgments
As the Research Director, A.M. Habraken acknowledges the support of the Fonds de la Recherche Scientifique de Belgique (F.R.S-FNRS). Computational resources have been provided by the Consortium des Équipements de Calcul Intensif (CÉCI), funded by F.R.S-FNRS under Grant No. 2.5020.11.
Conflicts of Interest
The authors declare no conflict of interest.
References
- Hug, E.; Dubos, P.A.; Keller, C. Temperature dependence and size effects on strain hardening mechanisms in copper polycrystals. Mater. Sci. Eng. A 2013, 574, 253–261. [Google Scholar] [CrossRef]
- Keller, C.; Hug, E.; Chateigner, D. On the origin of the stress decrease for nickel polycrystals with few grains across the thickness. Mater. Sci. Eng. A 2009, 500, 207–215. [Google Scholar] [CrossRef]
- Keller, C.; Hug, E.; Retoux, R.; Feaugas, X. TEM study of dislocation patterns in near-surface and core regions of deformed nickel polycrystals with few grains across the cross section. Mech. Mater. 2010, 42, 44–54. [Google Scholar] [CrossRef]
- Dubos, P.A. Influence de la Température et du Trajet de Chargement sur les Transitions Volume-Surface des Métaux Cubiques à Faces Centrées. Ph.D. Thesis, Université de Caen/Basse-Normandie, Caen, France, 2013. [Google Scholar]
- Li, H.; Fu, M.W.; Lu, J.; Yang, H. Ductile fracture: Experiments and computations. Int. J. Plast. 2011, 27, 147–180. [Google Scholar] [CrossRef]
- Peirs, J.; Verleysen, P.; Degrieck, J. Experimental study of the influence of strain rate on fracture of Ti6Al4V. Procedia Eng. 2011, 10, 2336–2341. [Google Scholar] [CrossRef]
- Peirs, J.; Verleysen, P.; Paepegem, W.V.; Degrieck, J. Novel pure-shear sheet specimen geometry for dynamic material characterization. In Proceedings of the DYMAT 2009 Conference, Brussels, Belgium, 7–11 September 2009; pp. 35–41. [Google Scholar] [CrossRef]
- Peirs, J.; Verleysen, P.; Degrieck, J.; Coghe, F. The use of hat-shaped specimens to study the high strain rate shear behaviour of Ti-6Al-4V. Int. J. Impact Eng. 2010, 37, 703–714. [Google Scholar] [CrossRef]
- Reyes, A.; Eriksson, M.; Lademo, O.; Hopperstad, O.S.; Langseth, M. Assessment of yield and fracture criteria using shear and bending tests. Mater. Des. 2009, 30, 596–608. [Google Scholar] [CrossRef]
- Keller, C. Etude expérimentale des transitions volume/surface des propriétés mécaniques du nickel polycristallin de haute pureté. Ph.D. Thesis, Université de Caen/Basse-Normandie, Caen, France, 2009. [Google Scholar]
Figure 1.
(a) Sketch of the in-plane shear test specimen with dimensions in mm; (b) delineation of the boundary conditions and mesh employed in the numerical simulations; the zoom illustrates the refined mesh in the shear zone; (c) evolution of imposed displacement and out-of-plane force.
Figure 1.
(a) Sketch of the in-plane shear test specimen with dimensions in mm; (b) delineation of the boundary conditions and mesh employed in the numerical simulations; the zoom illustrates the refined mesh in the shear zone; (c) evolution of imposed displacement and out-of-plane force.

Figure 2.
Contours of the vertical displacement for different dimensions of the shear zone, for UY = 5 mm.
Figure 2.
Contours of the vertical displacement for different dimensions of the shear zone, for UY = 5 mm.

Figure 3.
(a) Evolution of maximum out-of-plane displacement; (b) Evolution of triaxiality ratio, it is computed from the element situated in the center of the shear zone, the insert figure shows an example of the triaxiality field for the geometry with h = 5 mm (at UY = 9 mm).
Figure 3.
(a) Evolution of maximum out-of-plane displacement; (b) Evolution of triaxiality ratio, it is computed from the element situated in the center of the shear zone, the insert figure shows an example of the triaxiality field for the geometry with h = 5 mm (at UY = 9 mm).

Figure 4.
Sketch of non-shifted and shifted geometries. In each of the three cases, the l/L ratio and the height of the shear zone h are fixed as 0.4 and 5 mm, respectively.
Figure 4.
Sketch of non-shifted and shifted geometries. In each of the three cases, the l/L ratio and the height of the shear zone h are fixed as 0.4 and 5 mm, respectively.

Figure 5.
Evolution of (a) maximum out-of-plane displacement; (b) triaxiality.
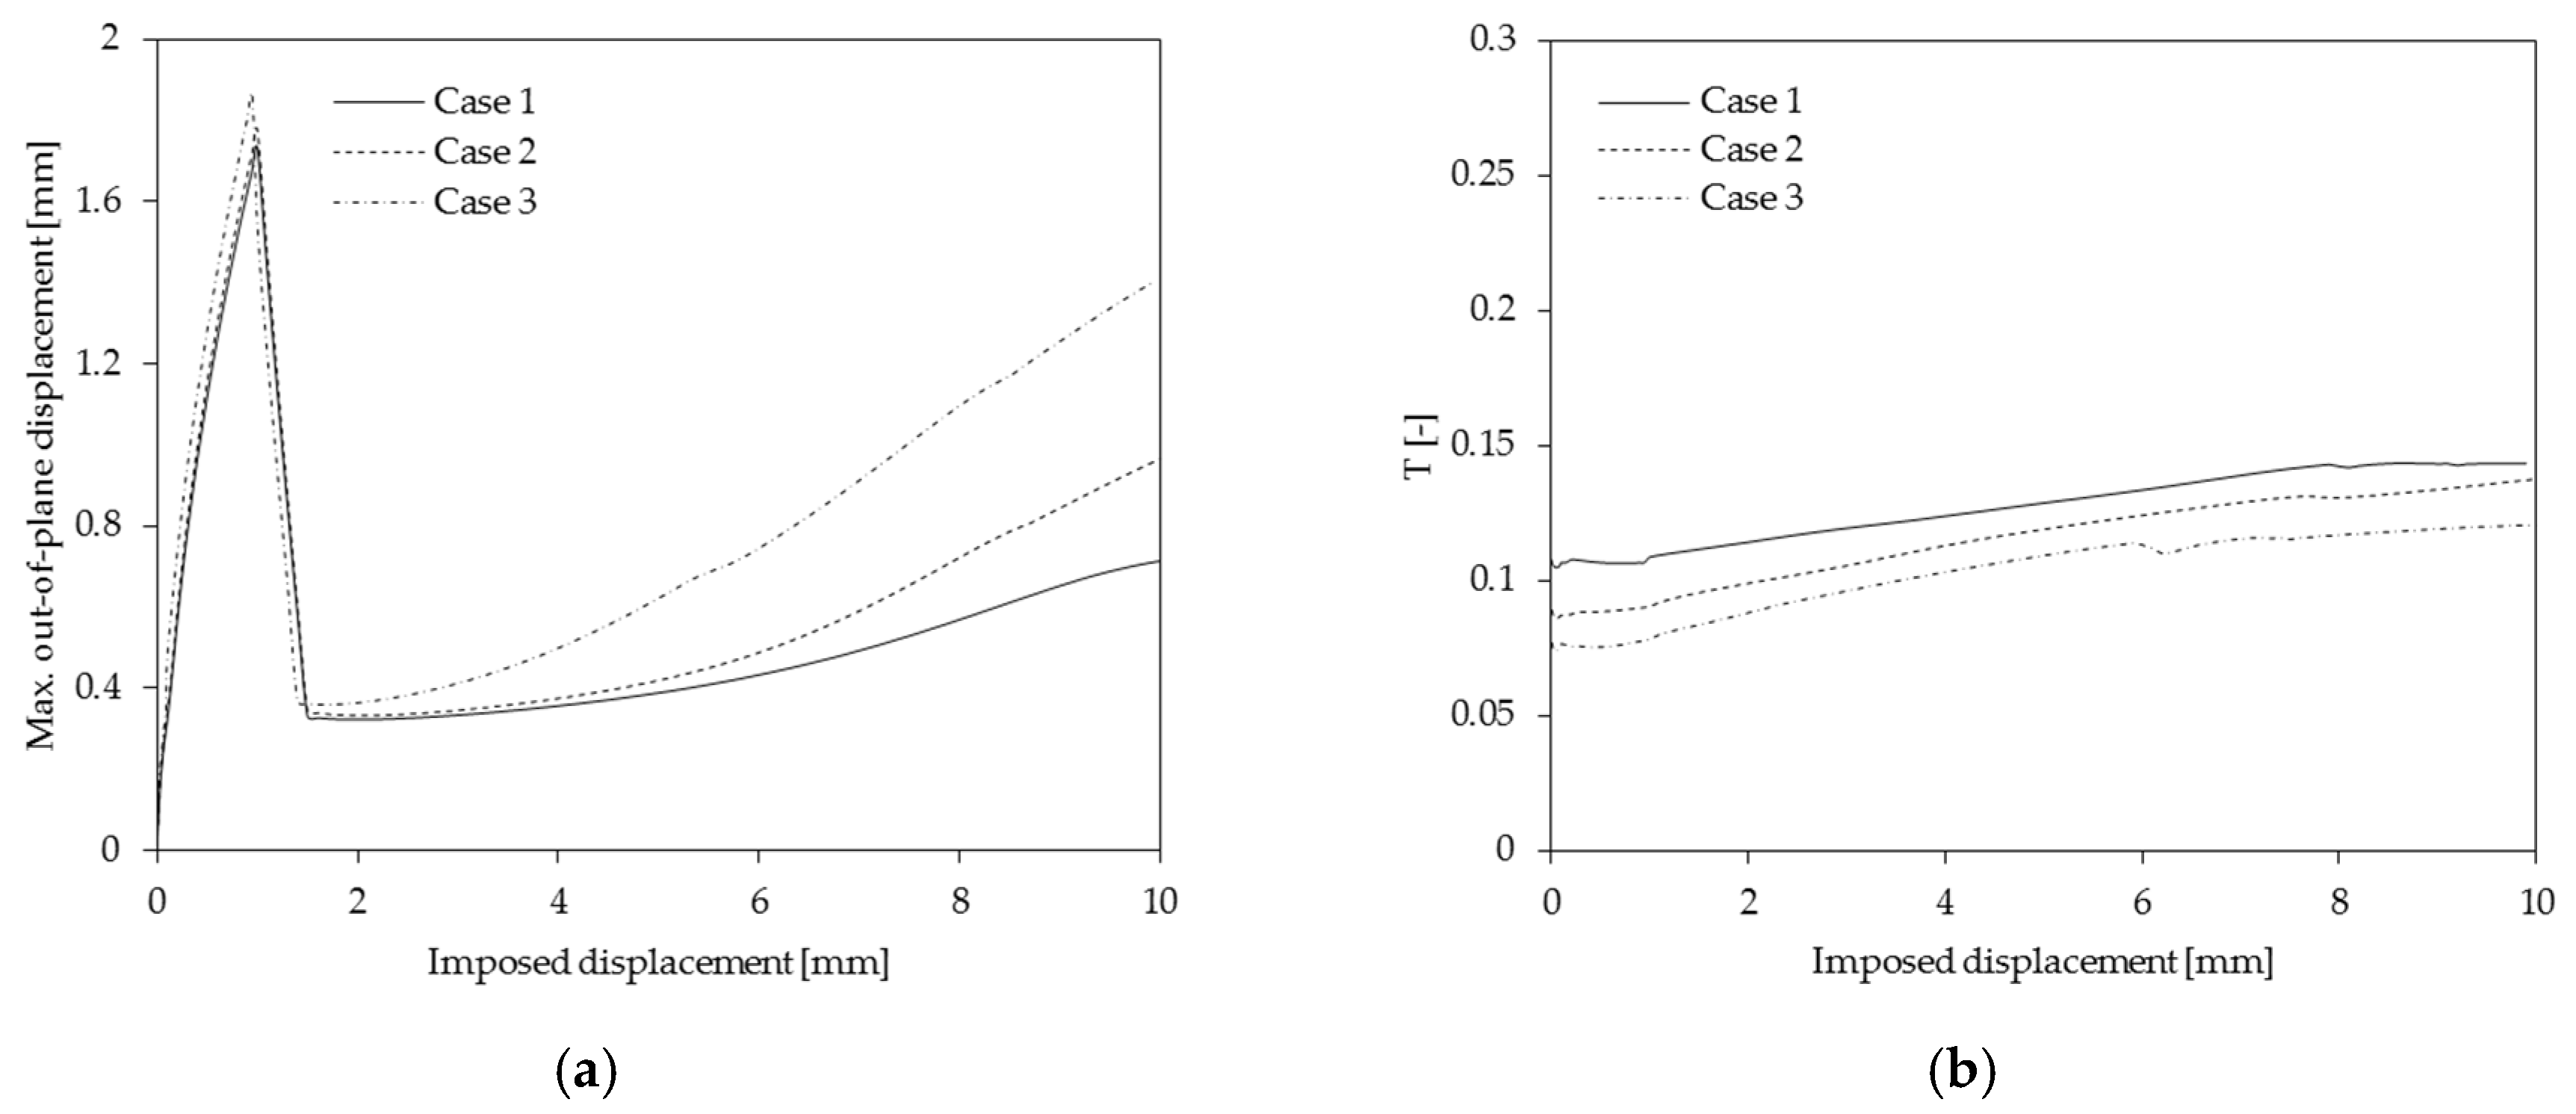
Figure 6.
(a) Examples of deformed specimen for the non-shifted and shifted shear zone; (b) zoom of the shear zone for the case 1 (no shift).
Figure 6.
(a) Examples of deformed specimen for the non-shifted and shifted shear zone; (b) zoom of the shear zone for the case 1 (no shift).

Figure 7.
Force curve in function of displacement.


Table 1.
Material parameters utilized in the simulation.
| Material Parameters | Symbols | Unit | Magnitude |
|---|---|---|---|
| Young’s modulus | E | MPa | 210,000 |
| Poisson’s ratio | ν | — | 0.31 |
| Hardening constant | c | MPa | 934.25 |
| Exponent hardening | n | — | 0.57157 |
© 2018 by the authors. Licensee MDPI, Basel, Switzerland. This article is an open access article distributed under the terms and conditions of the Creative Commons Attribution (CC BY) license (https://creativecommons.org/licenses/by/4.0/).
Share and Cite
MDPI and ACS Style
Yuan, S.; Duchêne, L.; Milis, O.; Keller, C.; Hug, E.; Habraken, A.-M. A Novel Geometry for Shear Test Using Axial Tensile Setup. Proceedings 2018, 2, 422. https://doi.org/10.3390/ICEM18-05277
AMA Style
Yuan S, Duchêne L, Milis O, Keller C, Hug E, Habraken A-M. A Novel Geometry for Shear Test Using Axial Tensile Setup. Proceedings. 2018; 2(8):422. https://doi.org/10.3390/ICEM18-05277
Chicago/Turabian StyleYuan, Sibo, Laurent Duchêne, Olivier Milis, Clément Keller, Eric Hug, and Anne-Marie Habraken. 2018. "A Novel Geometry for Shear Test Using Axial Tensile Setup" Proceedings 2, no. 8: 422. https://doi.org/10.3390/ICEM18-05277