Proceeding Paper

Evaluation of Crack Repair Effect for RC Slab Using AE Tomography †

1
Department Civil & Earth Resources Engineering, Kyoto University, C3-b4S15, Nishikyo, Kyoto 615-8540, Japan
2
Tokai Technology Center, 2-710, Inokoshi, Meito, Nagoya 465-0021, Japan
3
New Nippon Consultants Co., Ltd., 910-41, Yoshizukuri, Toyama 930-0142, Japan
*
Author to whom correspondence should be addressed.
Presented at the 18th International Conference on Experimental Mechanics (ICEM18), Brussels, Belgium, 1–5 July 2018.
Proceedings 2018, 2(8), 433; https://doi.org/10.3390/ICEM18-05331
Published: 11 June 2018
(This article belongs to the Proceedings of The 18th International Conference on Experimental Mechanics)

Abstract

:
Three reinforced concrete (RC) slab-panels are repaired by using the crack injection method. This is because web-shaped crack networks are observed after 46 years in service. In the present research, an attempt is made to confirm the effectiveness of the repair by comparing the velocity distribution of elastic waves obtained from Acoustic Emission (AE) tomography analysis, before and after the repair. Thus, the velocity recoveries due to injection are found in all of the slab panels, and it is confirmed that the elastic wave velocities obtained using this technique can serve as an indicator for examining the state of crack and void filling with injected material. Further, a good correlation is found between the low-velocity region before repair and the amount of injection. These results show the potential of the AE tomography technique to be used as a method for estimating the effect of injection repair.

Published: 11 June 2018

1. Introduction

Recently, it is seriously recognized worldwide that there has been a need to maintain concrete structures in the sound conditions. In the case of sustainable structures, it is necessary to perform appropriate repair and reinforcement for retaining or restoring the required performance. So far, in Japan, techniques for checking whether or not repair work has been properly done are not fully developed, and thus the systematic management standards have not been yet established. Therefore, the method available for all types of work to guarantee the quality of work is limited to naked eye observation from a short distance. With respect to the repair method by means of the crack injection, for example, non-destructive inspection (NDI) techniques have not been established to assess crack sealing. As a result, an indirect technique is conventionally applied where the amount of injection is estimated only from the filled area and depth.
In this respect, an attempt is made to apply non-destructive testing (NDT) technique of the elastic wave method to the evaluation of repair effect of steel reinforced (RC) slabs. In order to guarantee whether the injected material is properly filled into cracks by using the crack injection method, the velocity distributions of elastic waves in the applicable regions of RC slabs are estimated, before and after the repair, by employing AE tomography method [1].
As a practical application, repair evaluation of the crack injection in RC slabs is performed by the AE tomography method. In addition, a relationship between the amount of injection and the elastic-wave velocity is investigated in multiple slab panels, and the possibility to estimate the amount of injection is also examined.

2. Experiment

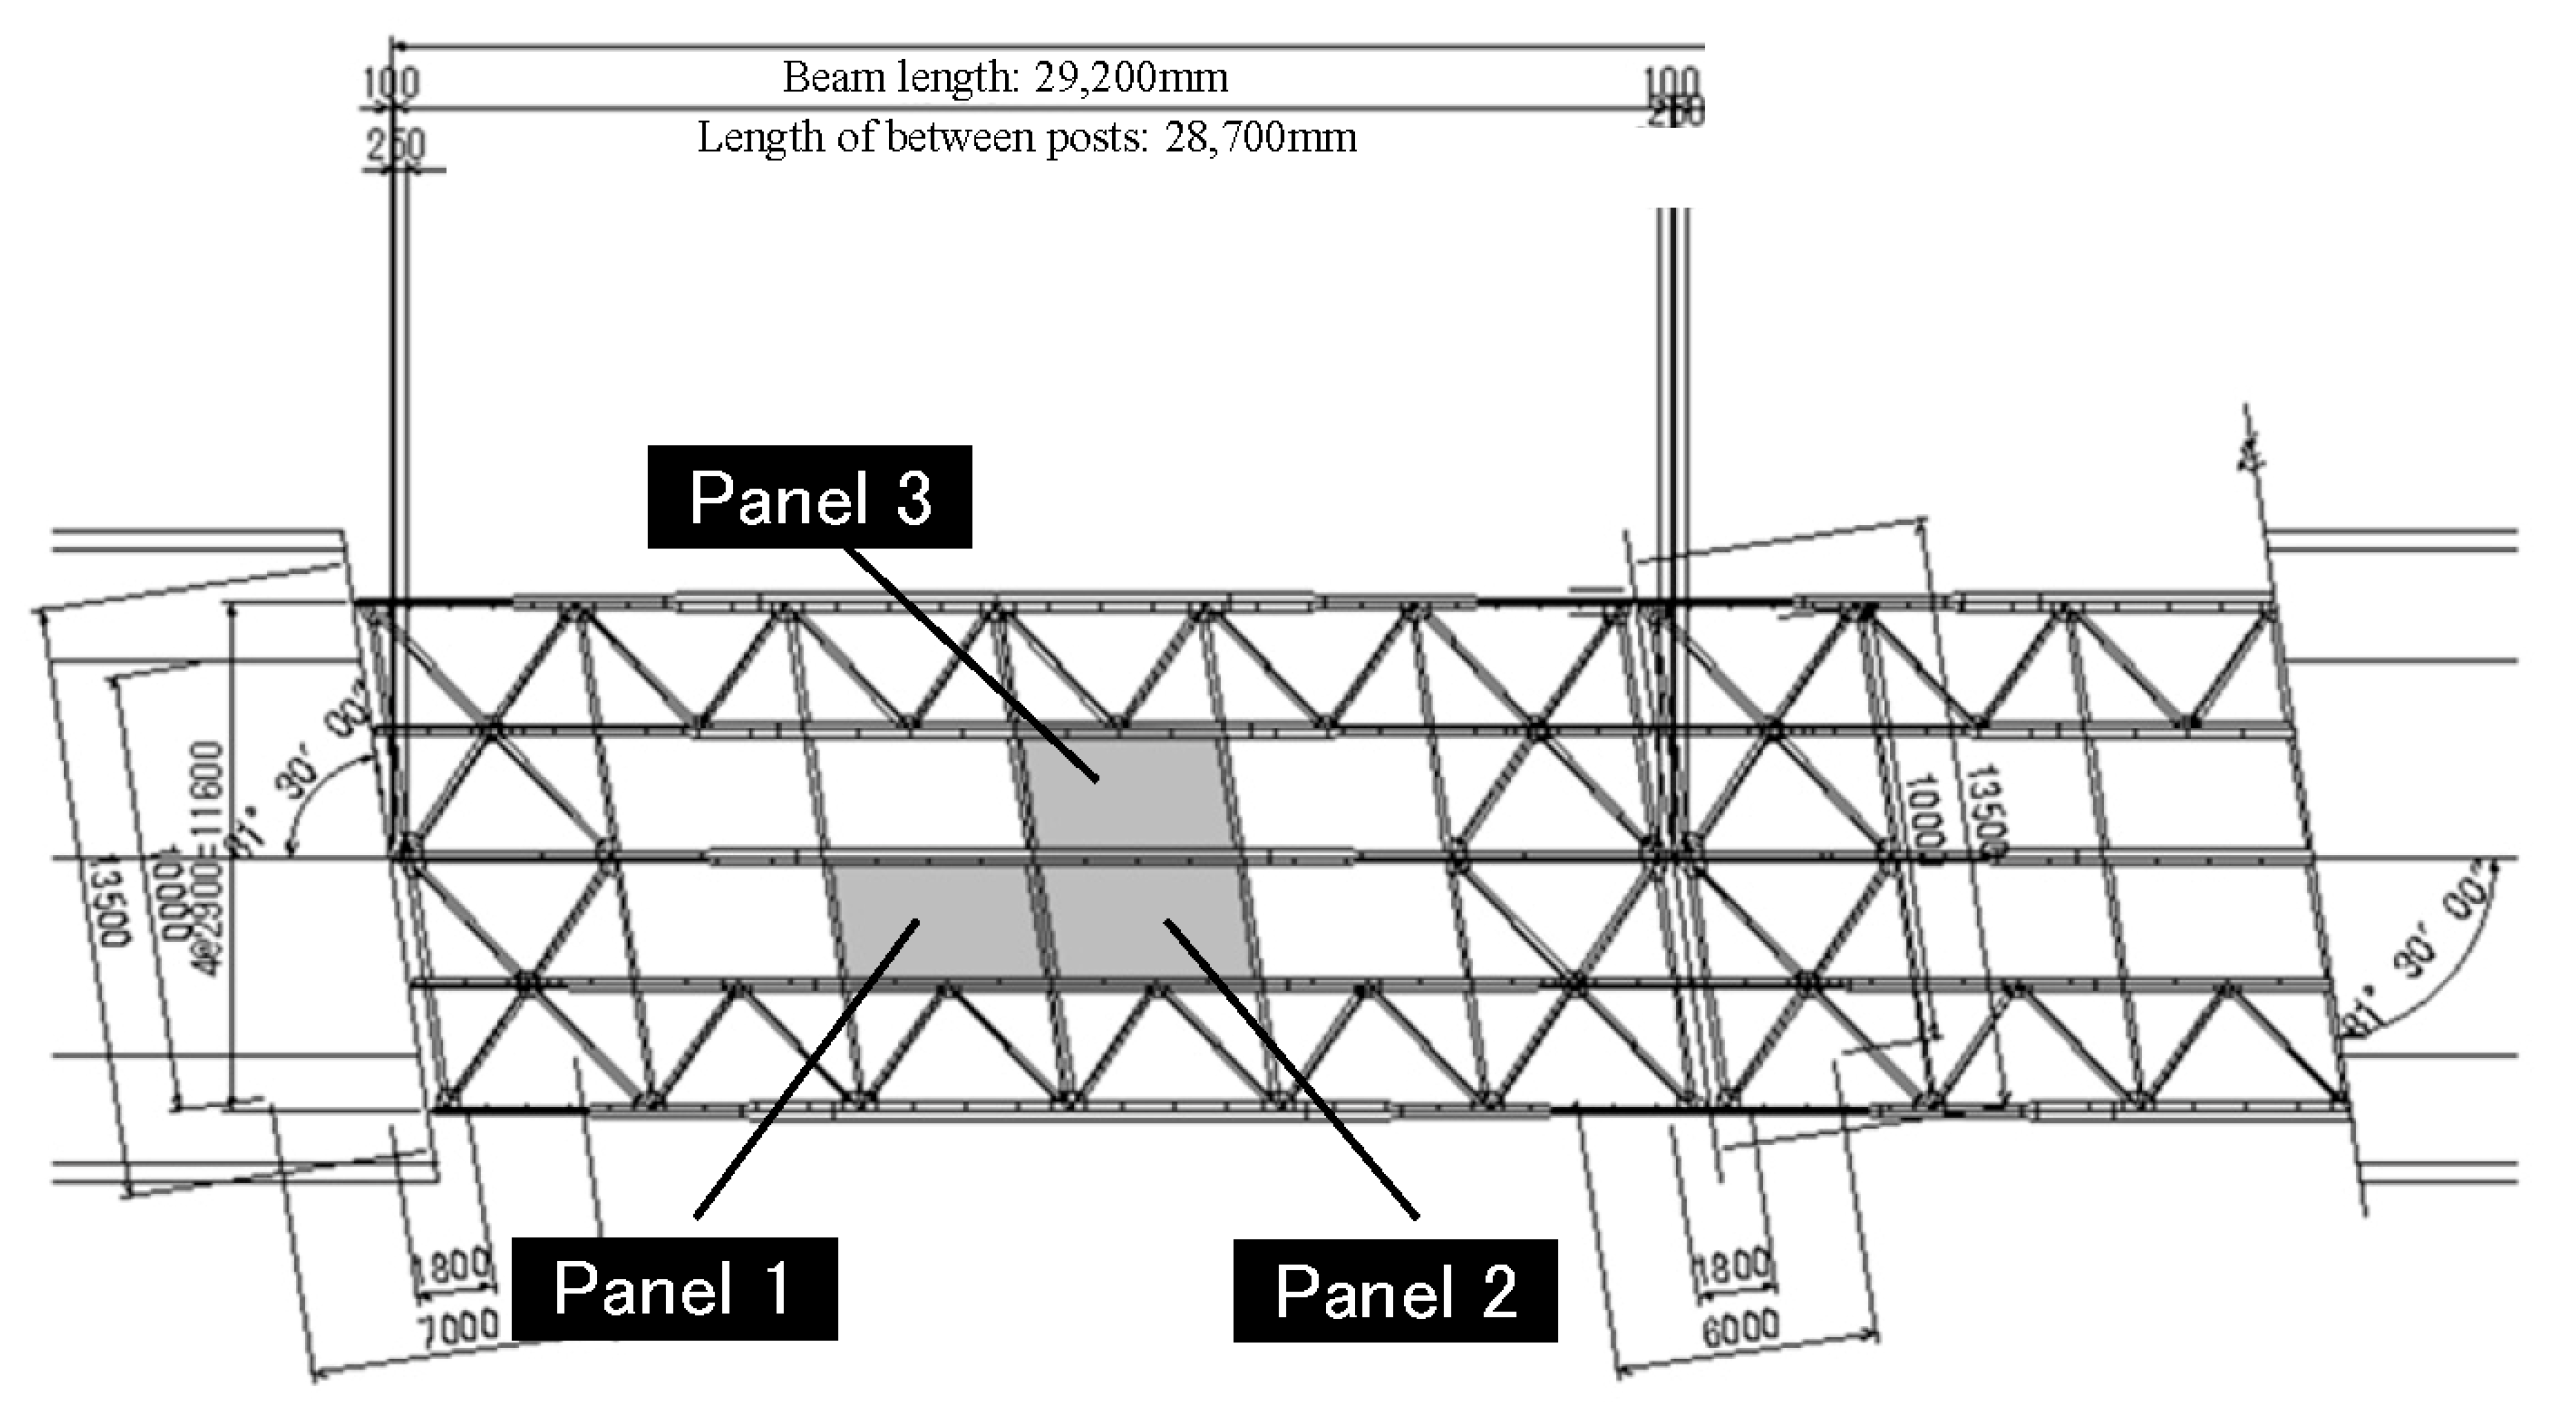
2.1. Target Structure

Figure 1 and Table 1 show a top view of an RC bridge, and specifications for the measured deck panels. This bridge is a municipal road bridge located in the Hokuriku region, Japan and it has been in service the last 46 years. Three panels highlighted in the figure are selected for the measurement. On all of the slab panels, web-shaped cracks were sporadically evident on the concrete surface. These cracks are thought to be caused primarily by the alkali-silica reaction in concrete. Figure 2 shows a sketch of cracks obtained through visual inspection from the bottom side of the slab. The figure also shows the area of the tomography analysis for obtaining the velocity distribution. Crack widths are not indicated in the figure, but in all of the slab panels, the crack widths were smaller than 0.2 mm.

2.2. Overview of Repair
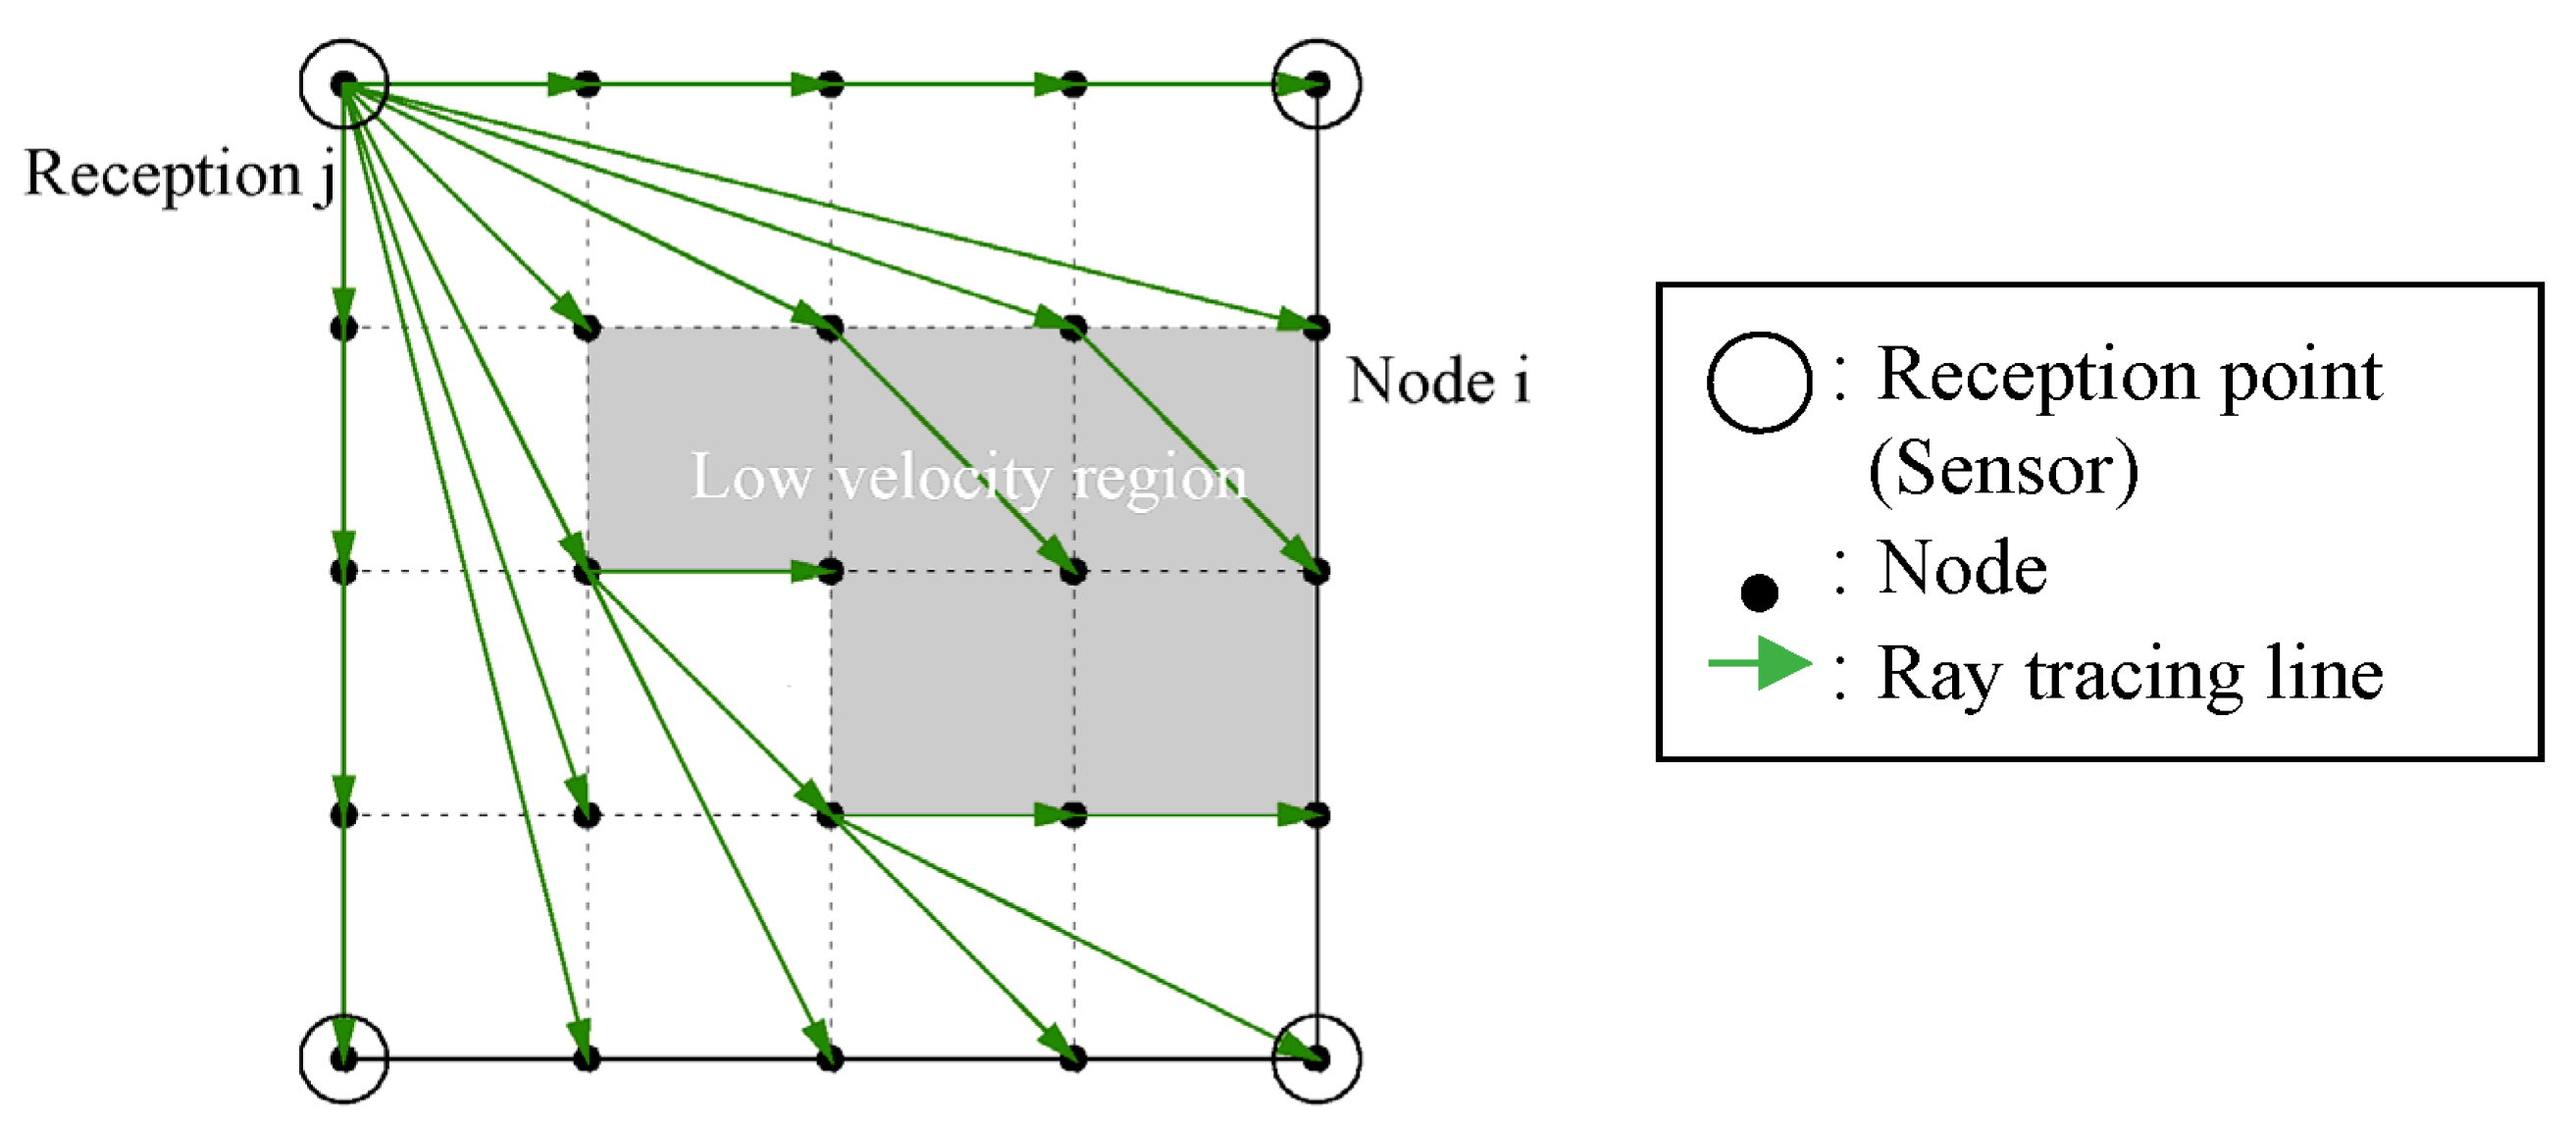
Table 2 gives an overview of repair methods applied to each slab panel. For all the slab panels, epoxy-based resin was used as the injected material. The resin of low viscosity was used in panel 1 and panel 2 with low-pressure injection, of which injection was made by employing the repulsive force of a spring along with air releasing. In the case of panel 3, pressurized injection of resin was applied, by using a rubber band equipped in the injector. The former injection is named as type A and the latter is type B, respectively. These two methods were originally selected to discuss the feasibility and the advantage of in situ applications, although the results are inconclusive for the selection. Table 3 shows the injection amounts designed for the injected material, and the injected amounts actually used. The former is the amount estimated from the crack width, and the crack depth as assumed to be about 60% of the slab thickness, and the crack length. As for panel 2 and 3, the design amount is estimated to be almost the same, while in terms of the actually used amount, panel 2 needs roughly 2.5 times as much in panel 3. It is realized that a relationship between the design amount and actually used amount is inconsequent.

2.3. AE Tomography

AE tomography is a method for obtaining a velocity distribution by finding the travel time from an AE source to each sensor. Thus, it is necessary to obtain the position of the transmission source as accurately as possible. With the conventional ranging technique, which assumes that the propagation velocity is fixed, considerable errors are expected in the case that the tomography technique is applied to such a heterogeneous material as concrete. Consequently, a new ranging technique incorporating with the ray tracing concept has been developed as a pre-processing technique for AE tomography [1]. The ranging technique using ray tracing is illustrated in Figure 3. As shown in the diagram, the ray tracing is performed from the received point j to all other nodes i, and the theoretical travel time Tji to each node is calculated. The shortest transmission time is determined from the differences between Tji and the initial travel time Tj at the received point j. The procedure is repeated for the number of received points N, and finally the node, where the variance of estimated arrival times estimated from Equations (1) and (2) becomes the minimal, is taken to be the transmission point. In Equation (1), Tmi is the mean value of the estimated transmission times at each node i, and in Equation (2), σ iis the variance of the estimated transmission times at each node i.
T m i = j ( T j i T j ) N
σ i = j ( T j i T j T m i ) 2 N

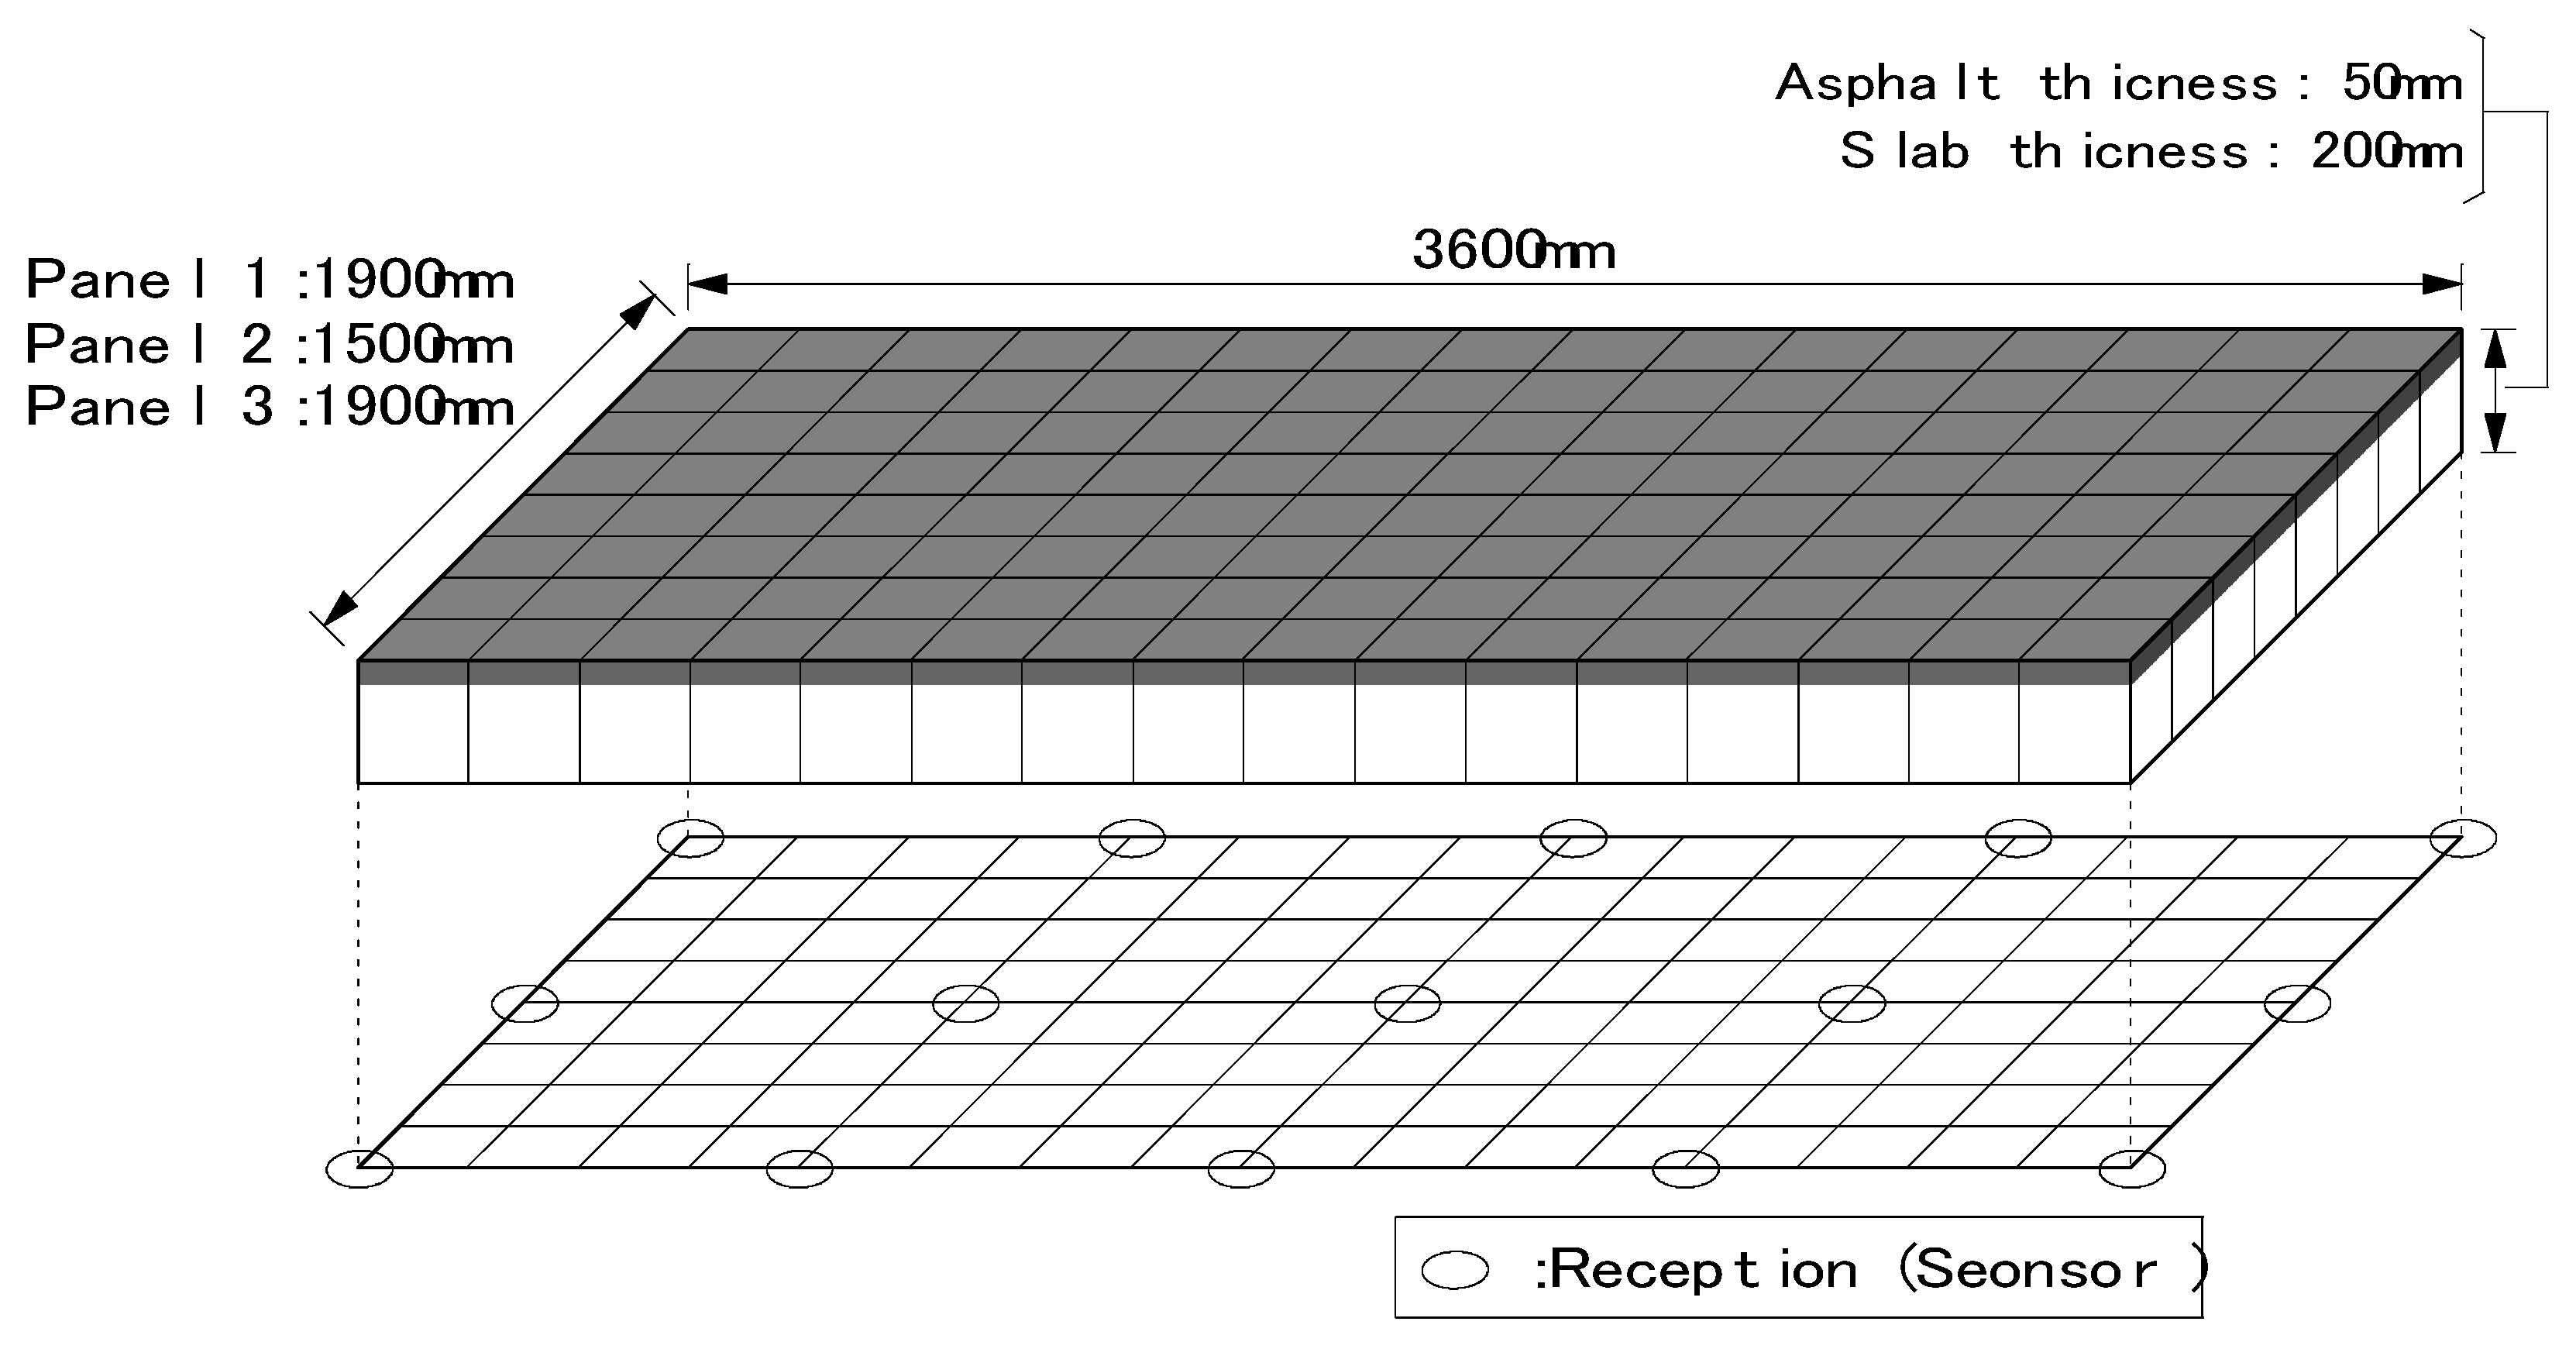
2.4. Measurement Condition

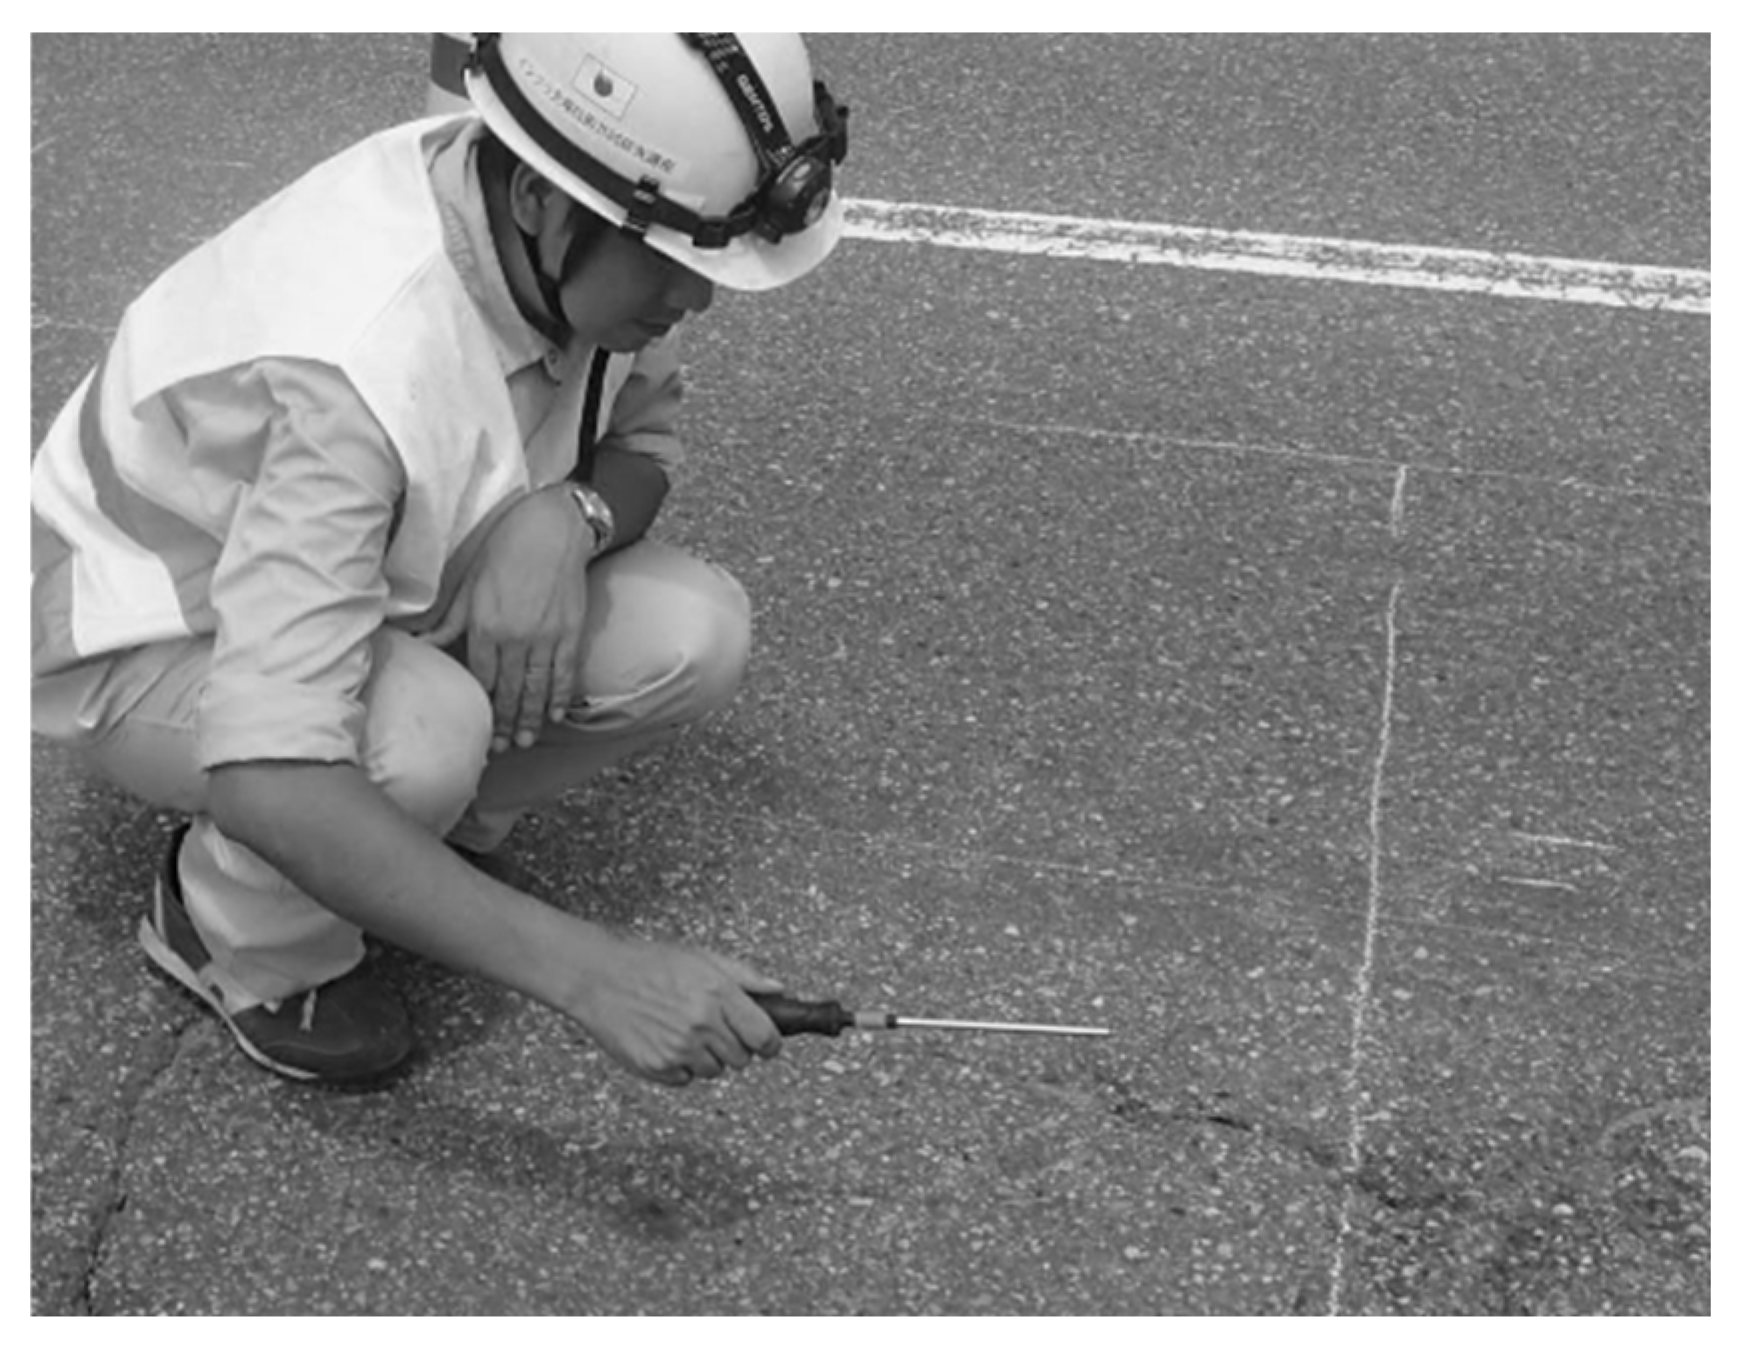
2.4.1. Excitation Method of Elastic Waves and Analysis Model

Figure 4 shows the model of AE tomography analysis and the positions of receiving sensors. The shaded part at the top of the model indicates the asphalt layer (thickness: 50 mm). Analyzed regions for slab panels 1 and 3 were set to be 3600 mm × 1900 mm. Concerning slab panel 2, there were limitations on the sensor positions, and thus the region was set to be 3600 mm × 1500 mm. As elements for AE tomography analysis, the applicable region was divided by 16 × 8 in total of 128 elements. In AE tomography, elastic waves were excited by the steel-ball drop. A steel-ball of 5 mm diameter was dropped at several locations for 12 min from the asphalt surface, consciously ensuring that the distribution of impact points was as uniform as possible at the target area. The steel-ball dropping is illustrated in Figure 5.

2.4.2. Measurement System

In AE tomography, the measurements were performed using an acceleration measurement system (TEAC). Fifteen piezoelectric accelerometers with the frequency response from 3 Hz to 15 kHz were employed as receiving sensors.

2.4.3. Waveform Processing

Reading the initial travel time is a main concern in the tomography analysis. As stated, the initial travel time is determined using AIC (Akaike Information Criterion) given by Equation (3) [2]. In the method, the dispersion before and after the arbitrary point k is compared with the waveform of the amplitude value Xi (i = 1, 2, …, N), consisting of N samples. Here, var(X[1, k]) is the variance of the amplitude values X1 to Xk, and var (X [k, N]) is the variance of Xk to XN.
AIC k = k log { var ( X [ 1 , k ] ) } + ( N - k ) log { var ( X [ k , N ] }
The point at which AICk is the minimum is determined as the arrival time of the wave. However, when the S/N ratio is low, it is difficult to identify the minimum value of AICk. Thus, a reliability parameter is developed for reading the initial travel time. The DD index defined by Equation (4) is proposed as a measure for the identification of the rising edge of the wave [3]. It is found that readings of the initial travel times reasonably converge if the DD index is 0.05 or higher. In the present research, elastic waves with the DD index of 0.1 or higher are analyzed. Here in Equation (4), AIC(kmin) indicates the minimum value of AIC, i.e., corresponding to the initial travel time.
D D = { A I C ( k m i n δ k ) + A I C ( k m i n + δ k ) 2 A I C ( k m i n ) } / ( δ k ) 2

3. Results and Discussion

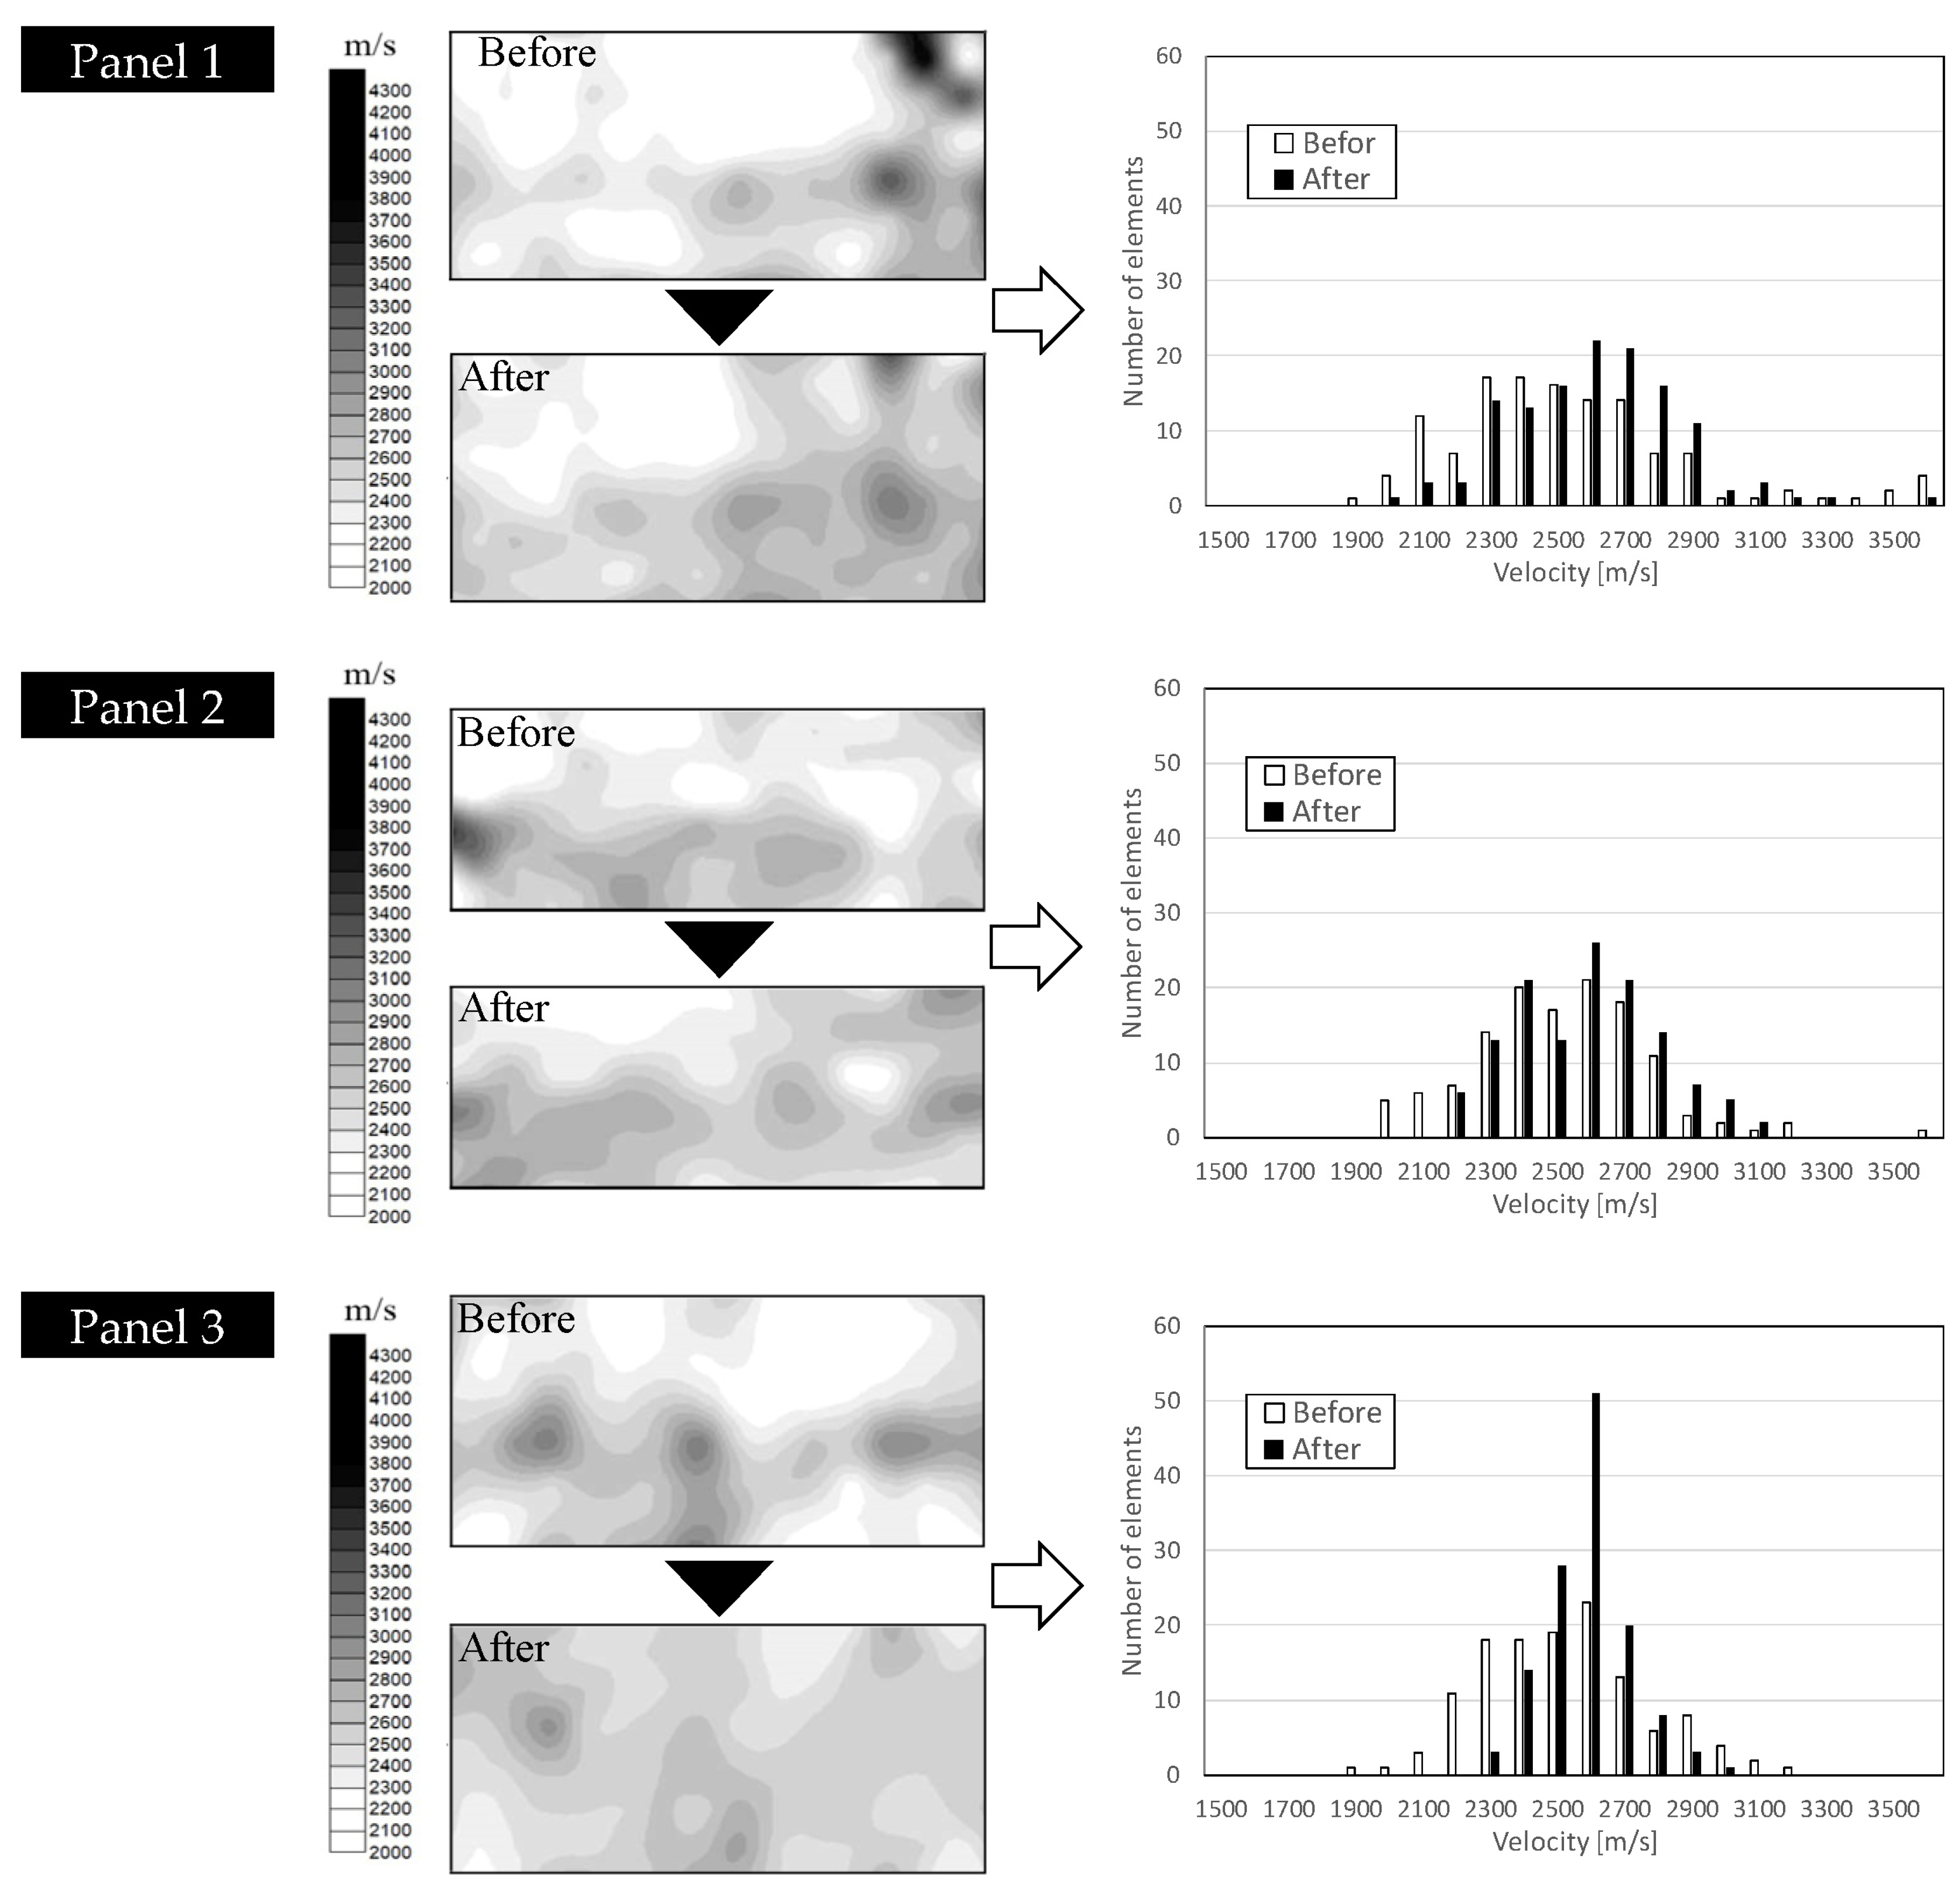
3.1. Velocity Distribution

Figure 6 shows the results of AE tomography, before and after repair by means of the crack injection. Results show that in all the slab panels, the velocity after repair exhibits increase compared to that before repair. Further quantitatively, the histograms of velocities obtained in all the elements are shown on the right side of the figure. For all slab panels, it is evident that the velocities at the elements clearly shift to the higher regions after repair. Due to the effectiveness of injected material in filling cracks and defects, detours and dispersions in the propagation paths of elastic waves are so eliminated that apparent velocities are increased.
All results imply that the velocity distribution obtained by the AE tomography method has a good potential to be an indicator for ascertaining the filled situation of injected material in a concrete slab. It is confirmed that for concrete not damaged, the velocity shows about 3500 m/s to 4000 m/s. In some areas, however, velocities of about 2600 m/s are observed even after repair. This is because injected material might not be injected well into continuous cracks, independent air bubbles could be present due to the use of the air-entraining agent, and fine cracks at the interface between coarse aggregate are nucleated due to the alkali-silica reaction. As a result, there exists a possibility that the velocity recovery does not reach to the satisfactory level even after injection. On this issue, we plan to carry out a material test in the laboratory for confirmation.

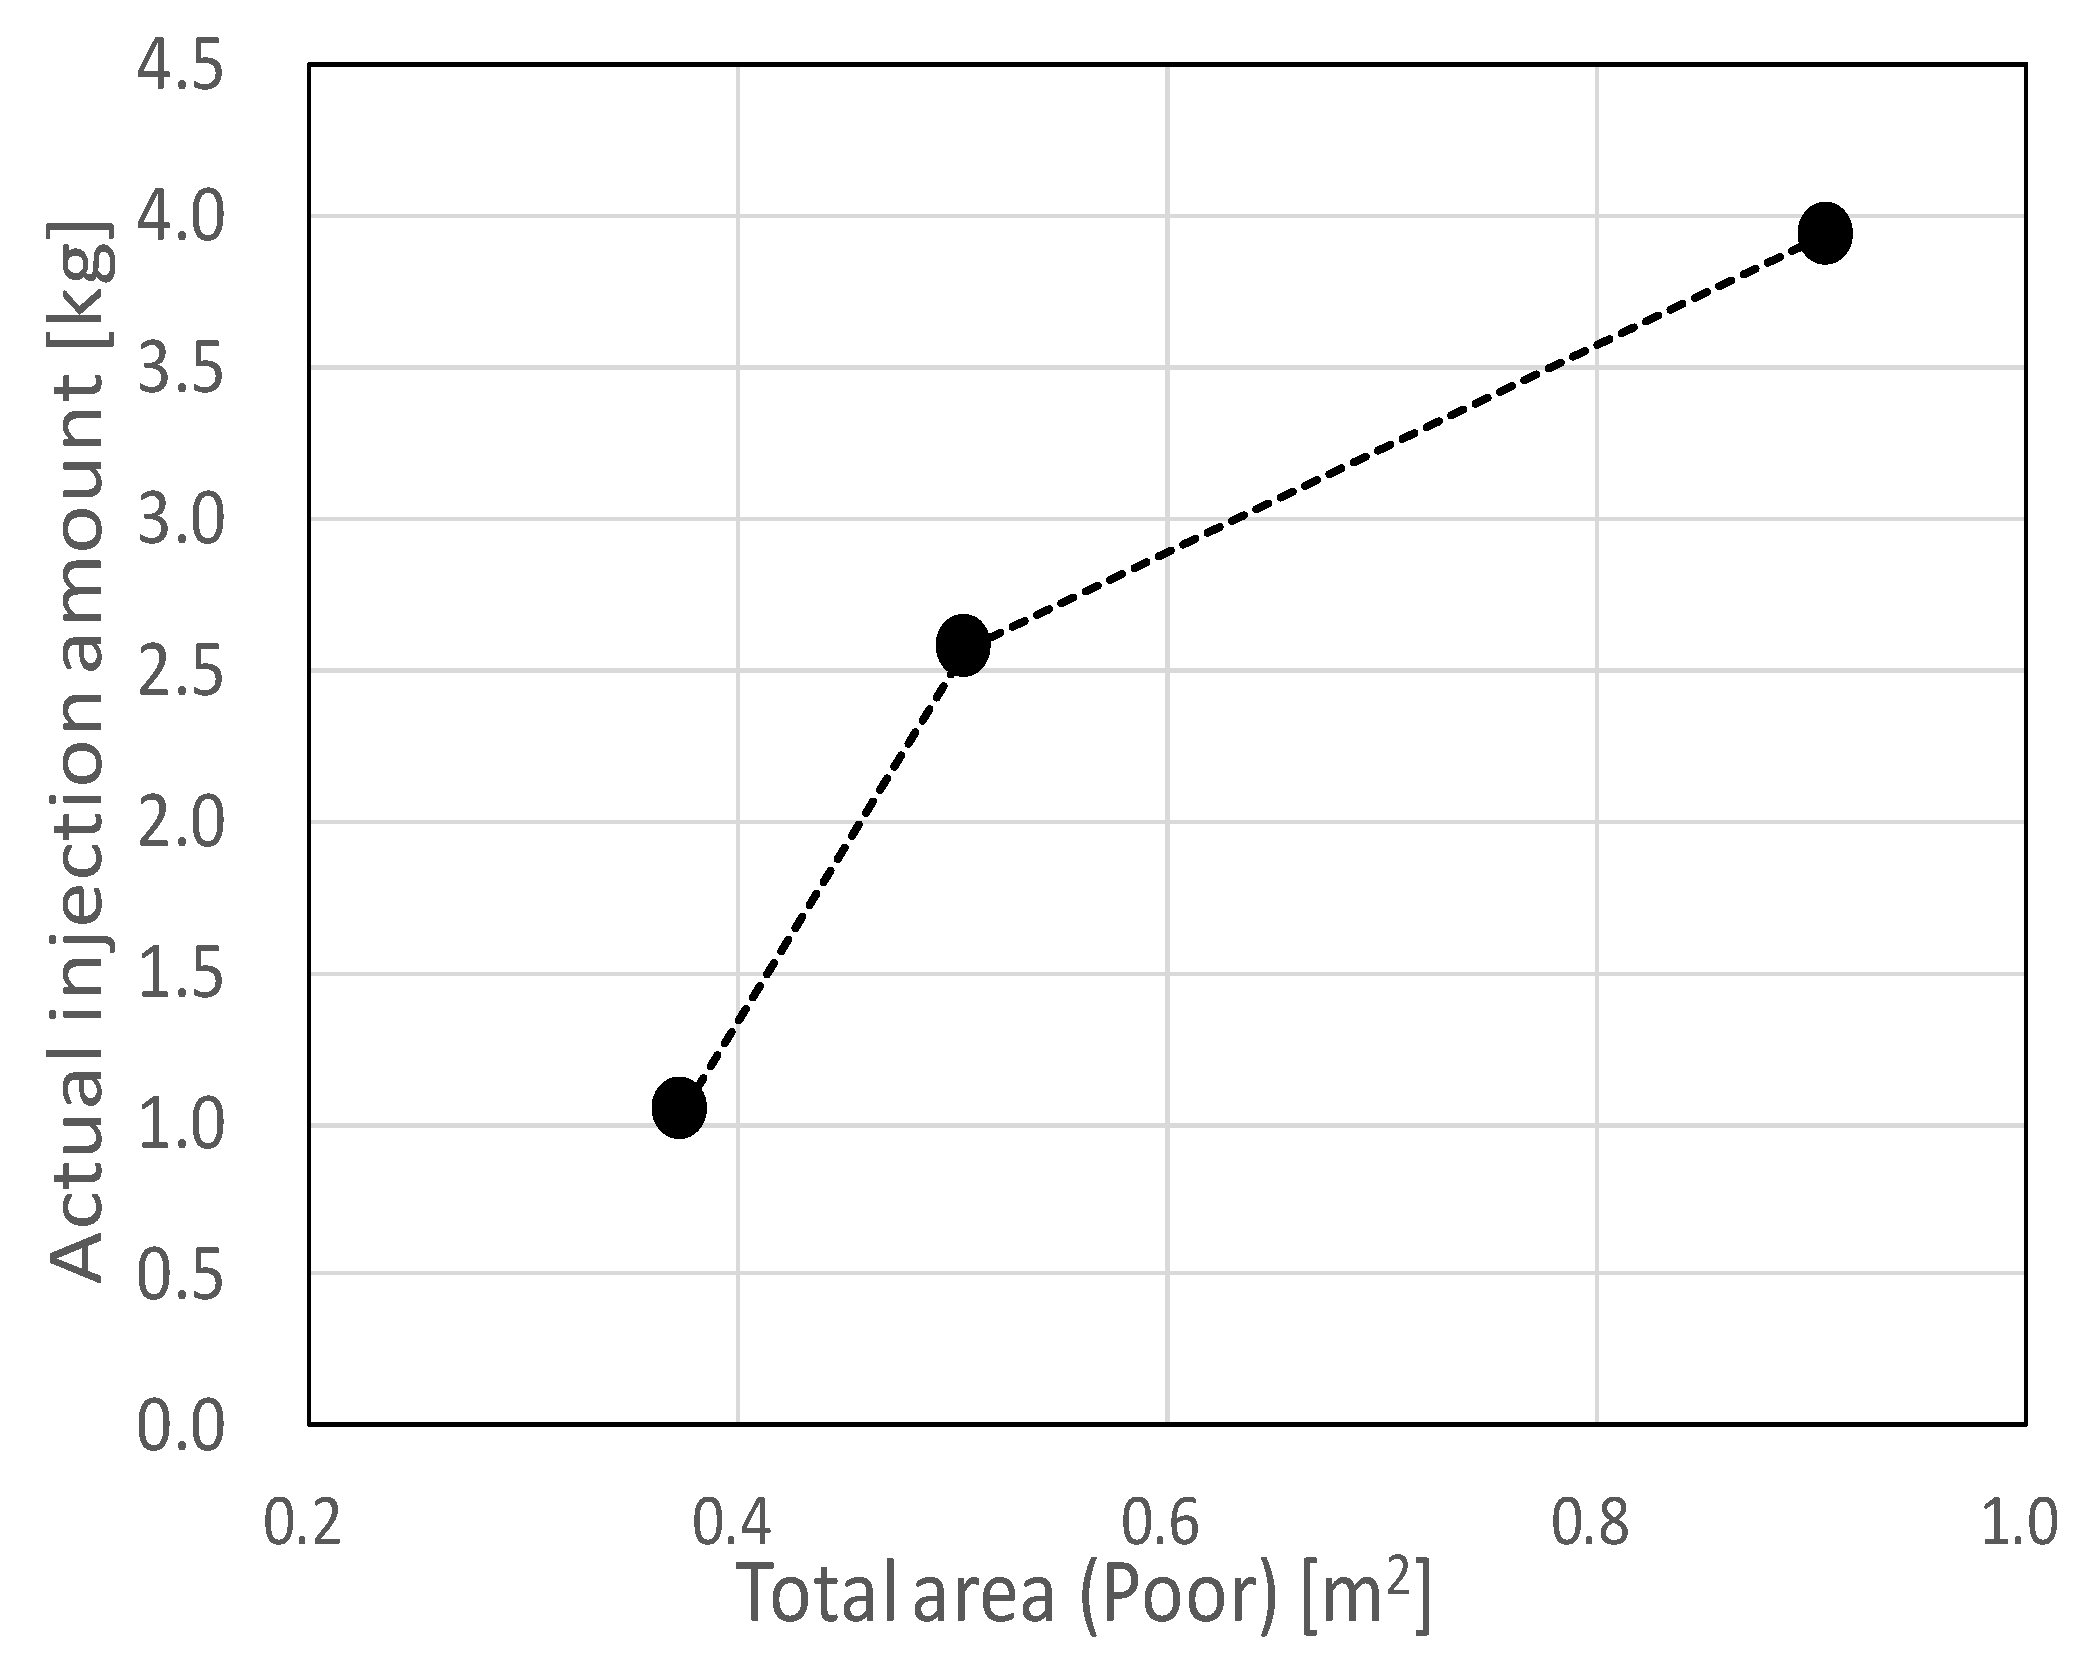
3.2. Relationship between Velocity and Injection Amounts

Design of the injection amount for the crack injection method could be based on the estimation of the crack widths, the depths, and the length measured. The designed amounts of injection are indicated in Table 3, and it is recognized that there exists no reasonable relationship between the amounts of designed injection and actual injection. Thus, an attempt to examine the amount of injected material is made from the results of AE tomography before repair.
It is considered that the amount of injection should increase, depending on the extent of damage. Namely, if the degree of damage is small, the amount should decrease. In addition, if the damage is less than a certain degree, the injected material may not work well on the damage. On the other hand, if the elastic-wave velocity could reflect the degree of damage, a correlation should be evident between the amount of injection and the values of velocities. Thus, the velocities are classified into grades, as given in Table 4. These quality indicators are proposed by Whitehurst [4]. They were determined from the relationship between mechanical properties and P-wave velocity in concrete. Following these indicators, the qualities before and after repair of the panels are classified as shown in Figure 7. It is found that the number of elements with Poor decreases, while that of Un-acceptable keeps almost the same from before to after repair. As discussed before, due to the presence of air-bubbles and the damaged interface with aggregates by alkali-aggregate reaction, the recovery of the velocities may not be apparent. These results imply that the region where the injected material could improve the quality of concrete is mostly that of Poor. It suggests that the repair by means of injection is effective for comparatively major damage. Figure 8 shows the relationship between total area of Poor estimated by AE tomography before repair and the actual amount of injection. As the Poor area increases, the increase in the actual amount of injection is clearly observed. Thus, it is possible to estimate the amount of injection before repair by carrying out the analysis using AE tomography.

4. Conclusions

The following conclusions are derived from the research:
  • The velocity distribution obtained by AE tomography can serve as an indicator for ascertaining the state of crack and void filling with injected material.
  • A good correlation is found between the low-velocity region before repair and the amount of injected material.
The results clearly show the potential for the AE tomography technique to be used as a method for estimating the performance of the crack injection method.

References

  1. Kobayashi, Y.; Shiotani, T. Computerized AE Tomography, Innovative AE and NDT Techniques for On-Site Measurement of Concrete and Masonry Structures; State-of-the-Art Report of the RILEM Technical Committee 239-MCM; Springer: Berlin, Germany, 2016; pp. 47–68. [Google Scholar]
  2. Akaike, H. Markovian representation of stochastic processes and its application to the analysis of autoregressive moving average processes. Ann. Inst. Stat. Math. 1974, 26, 363–387. [Google Scholar] [CrossRef]
  3. Asaue, H.; Shiotani, T.; Hashimoto, K.; Kayano, S. Development of AE Acquirement using Accelerometry System in-situ RC slab. In Proceedings of the 2017 National Conference on Acoustic Emission, Tokushima, Japan, 9–10 November 2017; pp. 25–28. (In Japanese). [Google Scholar]
  4. Whitehurst, E.A. Evaluation of Concrete Properties from Sonic Tests; ACI Monograph, No. 2; American Concrete Institute: Detroit, MI, USA, 1966. [Google Scholar]
Figure 1. A top side view of subject bridge.
Proceedings 02 00433 g001
Figure 2. Sketch of cracking.
Proceedings 02 00433 g002
Figure 3. Overview of transmission source estimation using ray tracing.
Proceedings 02 00433 g003
Figure 4. Analysis model for AE tomography.
Proceedings 02 00433 g004
Figure 5. Steel-ball dropping.
Proceedings 02 00433 g005
Figure 6. Results of velocity distribution before and after repair.
Proceedings 02 00433 g006
Figure 7. Area ratio by quality before and after repair.
Proceedings 02 00433 g007
Figure 8. Total area (Poor) vs. injection amount.
Proceedings 02 00433 g008
Table 1. Bridge specifications.
TypeRC bridge (3 span composite girder bridge)
Length88.0 m
Age46 years
ThicknessSlab: 250 mm Asphalt: 50 mm
ConditionWeb-shaped cracks were sporadically evident on the concrete surface.
Table 2. Overview of repair.
Panels 1 and 2Panel 3
Method typeAB
Injection materialepoxy-based resin 500 ± 200 mPa·sepoxy-based resin 600 ± 100 mPa·s
PressurizingUsing springUsing rubber
PressureInt.; 0.06 N/mm2
Stable; 0.02 N/mm2
Int.; 0.06 N/mm2
Stable; 0.02 N/mm2
Table 3. Injection amounts.
Panel 1Panel 2Panel 3
Injection amounts(designed)14.15 kg7.10 kg7.35 kg
Injection amounts (actually used)3.94 kg2.57 kg1.04 kg
Table 4. Quality indicator (Whitehurst).
VP [m/s]Quality
>4570Excellent
3660–4570Fine
3050–3660Acceptable
2130–3050Un-acceptable
<2130Poor
Publisher’s Note: MDPI stays neutral with regard to jurisdictional claims in published maps and institutional affiliations.

