How to Assess Repeatability and Reproducibility of a Mechanical Test? An Example for Sports Engineers †


Department of Sports Equipment and Technology, Chemnitz University of Technology, 09107 Chemnitz, Germany
*
Author to whom correspondence should be addressed.
†
Presented at the 13th Conference of the International Sports Engineering Association, Online, 22–26 June 2020.
Proceedings 2020, 49(1), 122; https://doi.org/10.3390/proceedings2020049122
Published: 15 June 2020
(This article belongs to the Proceedings of The 13th Conference of the International Sports Engineering Association)
Abstract
:Several sources of variation can affect the performance of a mechanical test. Hence, the measurement system performance should be assessed. The gage repeatability and reproducibility study is a method used to assess and quantify the variation of a mechanical test. Since it seems that this method has not yet found its way into the field of sports engineering, this paper promotes its application by demonstrating a practical example based on a current problem in sports shoe development. In detail, a novel mechanical simulation to determine the forefoot bending stiffness of athletic footwear during plantar flexion movement was developed and its quality assessed. The ANOVA Gage R&R study was performed based on 64 randomized trials of eight footwear samples assessed by two appraisers. The mechanical test was evaluated as acceptable for the desired application and the resolution was quantified to be 0.04 Nm/°.
1. Introduction
Sports equipment development is an important aspect to enhance athletic performance [1]. Common tools for sports engineers in the development and validation process of sports equipment include commercial and/or customized mechanical tests. The results from mechanical tests are regarded as being superior by means of less variation compared to subjective and biomechanical test results [2]. Nevertheless, mechanical tests are also subjected to several sources of variation (e.g., calibration) that can affect the performance of a measurement system [3]. Hence, there is a need to assess and quantify the variation of a mechanical test—especially of novel customized tests. A way to address this task is to apply the gage repeatability and reproducibility (GRR) study [3]. The GRR study is a method that provides a statistical approximation of the variation and percentage of process variation for a test measurement system. Although this method is commonly used in the automotive industry, it seems that it has not yet found its way into the field of sports engineering. In an effort to promote and demonstrate the application of the GRR study by sports engineers, we elaborated and conducted a practical example based on a current problem in sports shoe development—the lack of an existing standardized methodology of measuring forefoot bending stiffness, especially during plantar flexion. Plantar flexion of the foot is considered a crucial movement for several sports [4]. However, even though it is known that individual athletes have differing needs in terms of forefoot bending stiffness [4], information on forefoot bending stiffness of many existing shoe models is currently not available [5]. Hence, a novel mechanical simulation to determine the forefoot bending stiffness of athletic footwear during plantar flexion was developed and its quality assessed by means of a GRR study.
2. Materials and Methods
2.1. Mechanical Simulation
A mechanical simulation is a mechanical or technical test device which captures the reality of human–technology interactions and translates it into a mechanical model [6]. The mechanical simulation used to determine the forefoot bending stiffness of athletic footwear during plantar flexion movement was composed of a hydraulic testing machine (HC10, ZwickRoell GmbH and Co. KG, Ulm, Germany), a bending unit, a two-part fixing unit (Figure 1) and a machine control that implements a biomechanically evaluated deflection-time spectrum. The actuator of the testing machine was connected to the bending unit to enable plantar flexion of the footwear samples. The bending apparatus consisted of an aluminum frame, two linear guides and a sliding unit with a rotating shaft with one degree of freedom. The lower part of the fixing unit consisted of two parts. The first part was composed of several stacked wooden boards that provide a height-adjustable support for the footwear samples. The second part was a small shaft fixed to a revolution joint to enable the measurement of the plantar flexion angles of the bended footwear samples. The upper part of the fixing unit consisted of an aluminum frame, a spindle and a last of size UK 8, which was trimmed at the metatarsal line while keeping the proximal part [7]. A load cell with a relative measurement uncertainty of ±0.5%, a linear variable differential transformer (LVDT) with a linearity of ±0.25% and a conductive plastic potentiometer (MP10, MEGATRON Elektronik GmbH and Co. KG, Putzbrunn, Germany) with a linearity of ±2% were used to measure the variables needed to determine the forefoot bending stiffness. Forefoot bending stiffness was defined as the ratio between applied torque and bending angle [7].
2.2. Testing Procedure
Eight footwear samples were tested twice and randomly by two testers. In the field of measurement systems analysis, the testers are called appraisers and hence this expression will be used from here on. The samples were assumed to represent a broad range from low to high bending stiffness. The selection comprised of one trail running, two conventional running, two minimalistic, two soccer and one bike and hike shoe (Figure 2). Biomechanical gait patterns of walking at a speed of 1.8 ms−1 were simulated by bending (plantar flexion) the footwear samples from 0° to 9.7°. After reaching the maximum bending angle, the load was released and the sample bent back into the rest position were the sample remained for a predefined time to complete the test cycle. In total, 21 cycles were performed per test. Raw data of force, time and stroke were collected for each sample at a sampling frequency of 1 kHz. Raw data of the 21st cycle were processed using MATLAB (R2018a, The MathWorks, Inc., Natick, MA, USA). In detail, strokes were converted into bending angles using trigonometric functions and forces were converted into torques to obtain torque-angle profiles. Finally, forefoot bending stiffness was calculated as the slope of the torque-angle profile [7].
2.3. ANOVA Gage R&R
To assess the quality of the recently developed mechanical simulation, an ANOVA Gage R&R study [3] was performed. This included the data collection, and the graphical and the numerical evaluation of 64 randomized tests performed on eight samples/parts (n) by two appraisers (k) in two repetitions/trials (r). The gage repeatability and reproducibility (GRR) was determined using the analysis of variance (ANOVA) method. The GRR is an estimate of the combined variation of repeatability (i.e., within-system variation) and reproducibility (i.e., between-system variation) [3]. By means of MATLAB, the forefoot bending stiffness values were converted into an ANOVA table. The ANOVA table is composed of five columns representing the source (i.e., cause of variation), the degree of freedom (DF) associated with the source, the sum of squares (SS) (i.e., the deviation around the mean of the source), the mean square (MS) (i.e., the SS divided by DF) and the F-ratio (F) (i.e., statistical significance of the source value). This information was then used to calculate the measurement systems characteristics containing the repeatability/equipment variation (EV), the reproducibility/appraiser variation (AV), the interaction between parts and appraisers (INT), the GRR, the part variation (PV), the total variation (TV) and the number of distinct data categories (ndc). The equations are as follows:
3. Results
The ANOVA Gage R&R analysis of the mechanical simulation resulted in a mean of the averages () of 0.187 Nm/° for the bending stiffness (Table 1). The mean of the average ranges () was 0.018 Nm/°. Appraiser B had lower variations between the two trials compared to appraiser A (Figure 3). The ANOVA table resulted in only one significant variation (Table 2). Namely, the source parts was significantly different (p = 0.000). The GRR was 13.9% (Table 3). Based on the GRR criteria [3], the mechanical simulation could be classified as acceptable for the application.
4. Discussion
A novel mechanical simulation to determine the forefoot bending stiffness of athletic footwear during plantar flexion was introduced. The ANOVA Gage R&R study, performed above the recommended threshold of n·k·r ≥ 30, resulted in a GRR of 13.9%. This value is below 30% and hence can be categorized into the second category (i.e., 10% to 30%) of the GRR criteria [3]. According to that category, the mechanical simulation can be considered as acceptable for the desired application. Given a range of part averages (Rp) of 0.395 Nm/° and ten distinct categories, the minimal discernable difference between two samples by means of non-overlapping 97% confidence intervals is 0.04 Nm/°. Differences in stiffness of footwear samples below that level will not be capable of being differentiated through this mechanical simulation. If there was demand for a higher resolution of the mechanical test, the whole process needs to be revised. Therefore, a deeper look into the percentage contribution of appraisers (AV) and equipment (EV) on the total variability is recommended.
The percentage contribution of the repeatability (EV; 1.6%) on the total variation was four times higher than the percentage contribution of reproducibility (AV; 0.4%). In order to reduce equipment variation in mechanical test results, the measurement system analysis (MSA) guidelines [3] propose a number of action items that will need further considerations. By means of a self-assessment, we could identify clamping and wear as two causes whose improvements might result in a better GRR (Table 4). We also identified the resolution of the load cell as a possible cause since the 1 N increments of the 10 kN load cell might be too big with respect to the current peak forces (29 N to 294 N).
5. Conclusions
In this paper, a well-established Six Sigma quality management method has been transferred to the field of sports engineering. Even if mechanical test results are regarded as being superior by means of less variation compared to subjective or biomechanical test results [2], a MSA shall be performed before any publication of research data obtained by a mechanical simulation.
An important part of a MSA is the estimation of the reproducibility and repeatability of the measurement process. However, an ANOVA Gage R&R addresses solely the precision of the testing procedure. It does not reveal information on the accuracy.
Conflicts of Interest
The authors declare no conflict of interest.
References
- Stefanyshyn, D.J.; Wannop, J.W. Biomechanics research and sport equipment development. Sports Eng. 2015, 18, 191–202. [Google Scholar] [CrossRef]
- Odenwald, S. Test Methods in the Development of Sports Equipment. In The Engineering of Sport 6; Moritz, E.F., Haake, S., Eds.; Springer: New York, NY, USA, 2006; pp. 301–306. ISBN 978-0-387-34678-6. [Google Scholar]
- Down, M.; Czubak, F.; Gruska, G.; Stahley, S.; Benham, D. Measurement Systems Analysis. Reference Manual, 4th ed.; Automotive Industry Action Group (AIAG): Detroit, MI, USA, 2010; ISBN 978-1-60-534211-5. [Google Scholar]
- Stefanyshyn, D.J.; Wannop, J.W. The influence of forefoot bending stiffness of footwear on athletic injury and performance. Footwear Sci. 2016, 8, 51–63. [Google Scholar] [CrossRef]
- Wannop, J.W.; Stefanyshyn, D.J. Special issue: Bending stiffness: Performance and injury effects. Footwear Sci. 2016, 8, 49–50. [Google Scholar] [CrossRef]
- Schwanitz, S. Systematische Entwicklung mechanischer Simulationen der Interaktion von Sportler, Sportgerät und Umwelt. In Sporttechnologie zwischen Theorie und Praxis VI: Beiträge aus dem Workshop SpoTec 2015 “Aktuelle Trends in Sport und Technik" incl. “Gangworkshop"; Witte, K., Edelmann-Nusser, J., Eds.; Shaker Verlag: Aachen, Germany, 2015; pp. 29–38. ISBN 978-3-8440-3974-0. [Google Scholar]
- Krumm, D.; Schwanitz, S.; Odenwald, S. Development and reliability quantification of a novel test set-up for measuring footwear bending stiffness. Sports Eng. 2013, 16, 13–19. [Google Scholar] [CrossRef]
Figure 1.
Mechanical simulation used to determine forefoot bending stiffness of athletic footwear. (a) Hydraulic testing machine; (b) bending unit; (c) two-part fixing unit.
Figure 1.
Mechanical simulation used to determine forefoot bending stiffness of athletic footwear. (a) Hydraulic testing machine; (b) bending unit; (c) two-part fixing unit.
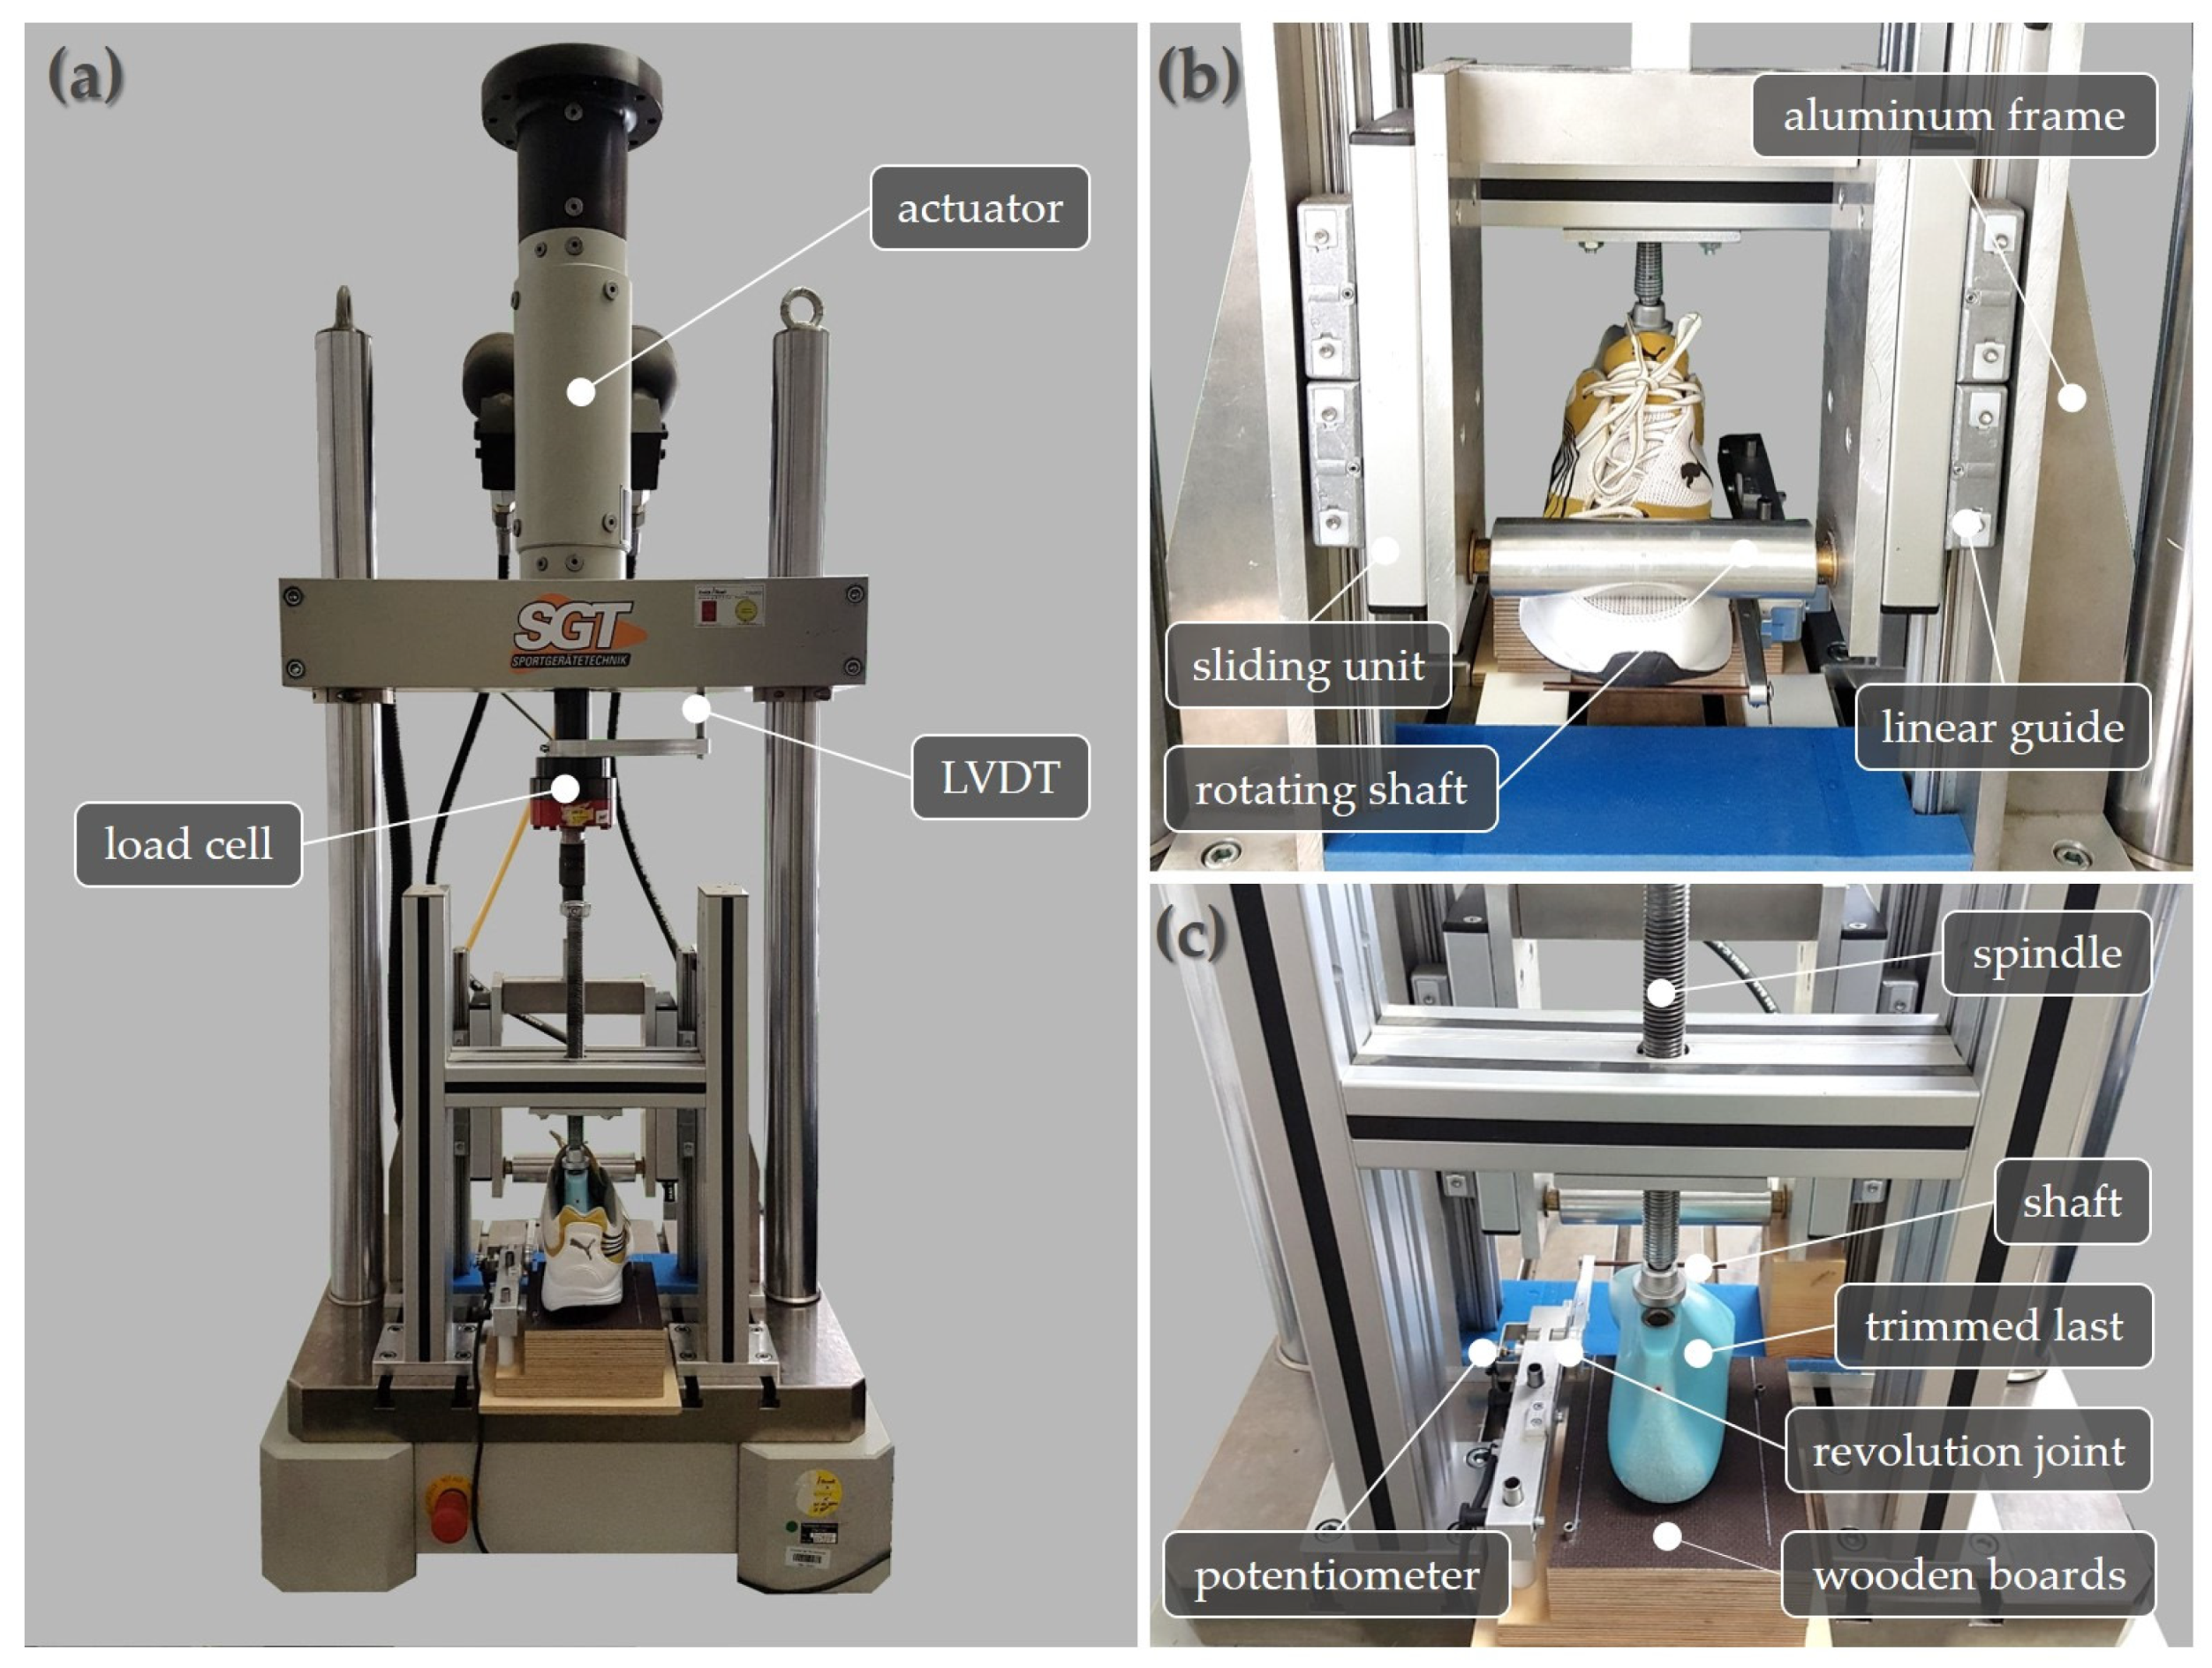
Figure 2.
Athletic footwear samples used to assess the quality of the mechanical simulation. The samples were assumed to represent most of the entire operating range from low to high bending stiffness. The samples comprised of two conventional running (b,c), two soccer (f,g), one trail running (a), two minimalistic (d,e) and one bike and hike (h) shoe.
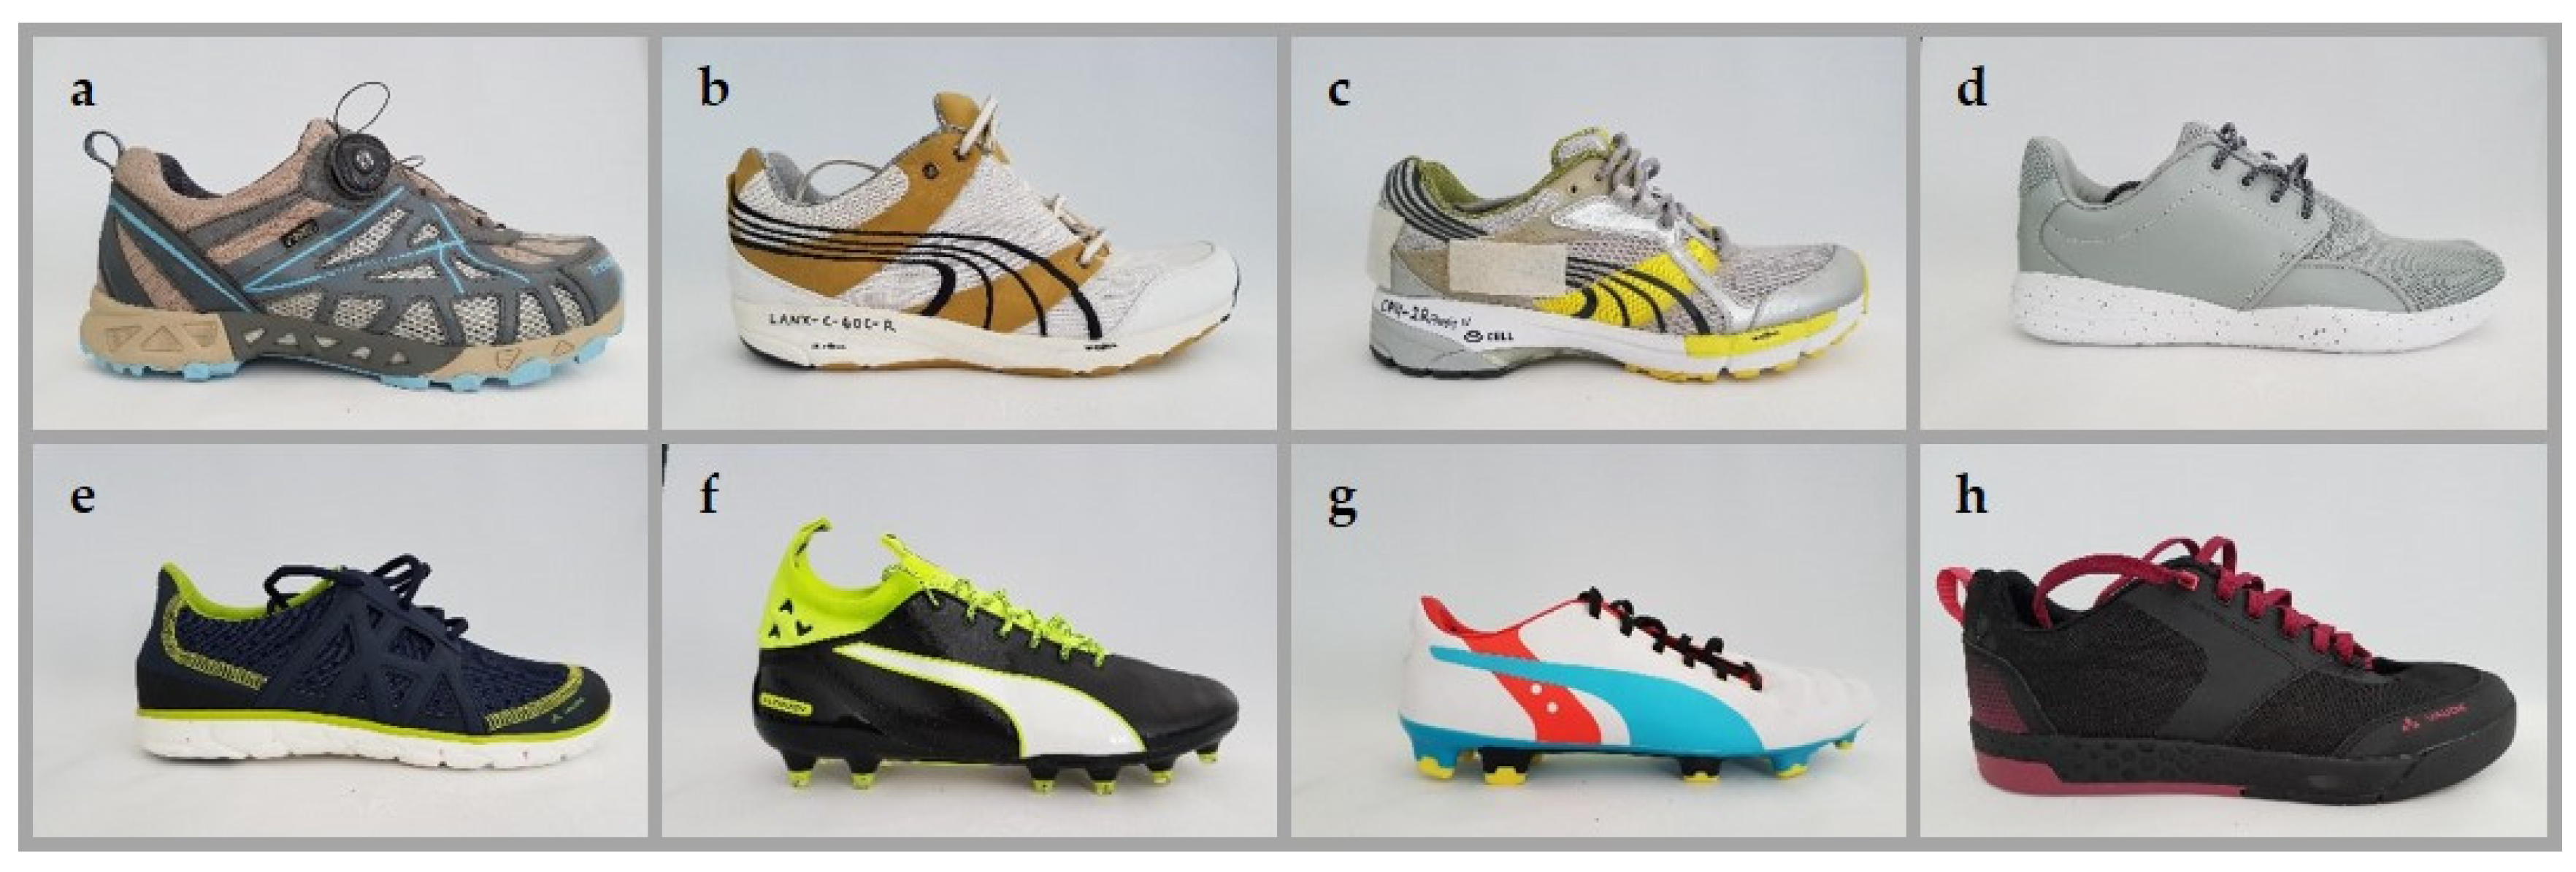
Figure 3.
Control chart showing the individual and mean () values for each sample/part measured by two appraisers (A, B) in two separate trials (●, ◊).
Figure 3.
Control chart showing the individual and mean () values for each sample/part measured by two appraisers (A, B) in two separate trials (●, ◊).


Table 1.
Gage repeatability and reproducibility (GRR) data collection sheet. The sheet contains the forefoot bending stiffness values (Nm/°) of the eight samples/parts measured by appraiser A and B in two separate trials. The sheet contains also the calculations of the individual ( , ) and mean averages ( ), the individual ranges (, ) and the range of part averages ( ).
| Appraiser /Trial # | Part | Average | |||||||||
|---|---|---|---|---|---|---|---|---|---|---|---|
| 1 | 2 | 3 | 4 | 5 | 6 | 7 | 8 | ||||
| A | 1 | 0.49 | 0.13 | 0.19 | 0.08 | 0.08 | 0.13 | 0.11 | 0.31 | 0.190 | |
| 2 | 0.42 | 0.11 | 0.17 | 0.08 | 0.07 | 0.14 | 0.09 | 0.29 | 0.172 | ||
| Average | 0.458 | 0.122 | 0.179 | 0.080 | 0.071 | 0.137 | 0.100 | 0.301 | 0.181 | ||
| Range | 0.067 | 0.017 | 0.017 | 0.002 | 0.008 | 0.007 | 0.018 | 0.022 | 0.020 | ||
| B | 1 | 0.46 | 0.13 | 0.18 | 0.08 | 0.08 | 0.14 | 0.09 | 0.35 | 0.189 | |
| 2 | 0.50 | 0.14 | 0.20 | 0.08 | 0.08 | 0.17 | 0.09 | 0.32 | 0.189 | ||
| Average | 0.482 | 0.137 | 0.193 | 0.083 | 0.080 | 0.153 | 0.090 | 0.322 | 0.194 | ||
| Range | 0.045 | 0.008 | 0.019 | 0.001 | 0.004 | 0.026 | 0.004 | 0.028 | 0.017 | ||
| Part Average | 0.470 | 0.129 | 0.186 | 0.081 | 0.075 | 0.145 | 0.095 | 0.317 | 0.187 | ||
| 0.395 | |||||||||||
Table 2.
ANOVA table showing the source for variation and the associated degree of freedom (DF), sum of squares (SS), mean square (MS) and F-ratio (F).
Table 2.
ANOVA table showing the source for variation and the associated degree of freedom (DF), sum of squares (SS), mean square (MS) and F-ratio (F).
| Source | DF | SS | MS | F |
|---|---|---|---|---|
| Appraiser | 1 | 0.00127 | 0.00127 | 4.1 |
| Parts | 7 | 0.53699 | 0.07671 | 247.55 * |
| Appraiser by part | 7 | 0.00107 | 0.00015 | 0.49 |
| Equipment | 16 | 0.00496 | 0.00031 | |
| Total | 31 | 0.54428 |
* Significant at α = 0.05 level.
Table 3.
Gage repeatability and reproducibility (GRR) ANOVA method report. The % total variation was calculated as the ratio between the standard deviation (σ) of the source (e.g., EV) and the standard deviation of total variation (TV) multiplied by 100. The % contribution to total variance was calculated as the ratio between the variance (σ2) of the source and the variance of TV multiplied by 100.
| Standard Deviation | % Total Variation | % Contribution | |
|---|---|---|---|
| Repeatability (EV) | 0.018 | 12.6 | 1.6 |
| Reproducibility (AV) | 0.008 | 6.0 | 0.4 |
| Appraiser by part (INT) | 0 | 0 | 0 |
| GRR | 0.019 | 13.9 | 1.9 |
| Part (PV) | 0.138 | 99.0 | 98.1 |
| Note: | Measurement System may be acceptable for the application –should be approved by the customer. | ||
| Number of distinct data categories (ndc) = 10 | Total variation (TV) = 0.140 | ||
Table 4.
Proposed action items of the measurement system analysis (MSA) guidelines to reduce equipment variation in mechanical tests and corresponding self-assessment.
Table 4.
Proposed action items of the measurement system analysis (MSA) guidelines to reduce equipment variation in mechanical tests and corresponding self-assessment.
| MSA—If Repeatability is Large Compared to Reproducibility, the Reasons May Be: | Self-Assessment |
|---|---|
| The instrument needs maintenance. | Not applicable. Bending unit was maintained beforehand. Servo-hydraulic machine is calibrated. Stroke-time curves of all trails were identical. |
| The gage may need to be redesigned to be more rigid. | Not applicable. Rigidity of the test rig (20 kN machine frame) including load cell (10 kN) was sufficient compared to peak loads. |
| The clamping or location for gaging needs to be improved. | Applicable. Clamping of samples needs to be revised. |
| There is excessive within-part variation. | Applicable. Possibly wear of the samples in repeated trials. |
Publisher’s Note: MDPI stays neutral with regard to jurisdictional claims in published maps and institutional affiliations. |
© 2020 by the authors. Licensee MDPI, Basel, Switzerland. This article is an open access article distributed under the terms and conditions of the Creative Commons Attribution (CC BY) license (https://creativecommons.org/licenses/by/4.0/).
Share and Cite
MDPI and ACS Style
Krumm, D.; Schwanitz, S.; Odenwald, S. How to Assess Repeatability and Reproducibility of a Mechanical Test? An Example for Sports Engineers. Proceedings 2020, 49, 122. https://doi.org/10.3390/proceedings2020049122
AMA Style
Krumm D, Schwanitz S, Odenwald S. How to Assess Repeatability and Reproducibility of a Mechanical Test? An Example for Sports Engineers. Proceedings. 2020; 49(1):122. https://doi.org/10.3390/proceedings2020049122
Chicago/Turabian StyleKrumm, Dominik, Stefan Schwanitz, and Stephan Odenwald. 2020. "How to Assess Repeatability and Reproducibility of a Mechanical Test? An Example for Sports Engineers" Proceedings 49, no. 1: 122. https://doi.org/10.3390/proceedings2020049122