Serve Ball Trajectory Characteristics of Different Volleyballs and Their Causes †


1
Department of Mechanical Engineering, Graduate School of Kogakuin University, 1-24-2 Nishi-Shinjuku, Tokyo 163-8677, Japan
2
Department of Mechanical Engineering, Kogakuin University, 1-24-2 Nishi-Shinjuku, Shinjuku-ku, Tokyo 163-8677, Japan
*
Author to whom correspondence should be addressed.
†
Presented at the 13th conference of the International Sports Engineering Association, Online, 22–26 June 2020.
Proceedings 2020, 49(1), 146; https://doi.org/10.3390/proceedings2020049146
Published: 15 June 2020
(This article belongs to the Proceedings of The 13th Conference of the International Sports Engineering Association)
Abstract
:Volleyball is a sport that starts with a serve, so effective service is essential to win the game. The trajectory of the ball is complicatedly affected by the fluid force, which depends on the speed, spin speed, and panel shape. To understand the aerodynamic characteristics of the ball and to propose an ideal serve method, we measured the fluid force and flight trajectory. The fluid force applied to the ball was measured at a wind speed of 4–30 m/s in the wind tunnel. The fluid force on the ball was strongly dependent on the ball type and orientation of the panel. In the flight trajectory measurement, the trajectory of the ball was measured using a high-speed camera under controlled speed and spin speed using a shotting machine. The effect of the panel orientation shown by the fluid force measurement was consistent with the results of the trajectory analysis, clarifying the importance of the panel orientation in serving.
Published: 15 June 2020
1. Introduction
Volleyball is a team sport in which a net separates two teams of six players. Each team tries to score points by grounding a ball on the other team’s court under organized rules. Since each play starts with a service, hitting a nice serve that makes it difficult to return the ball has an advantage in the subsequent game development [1,2]. The court is 18 m long and 9 m wide. In most cases, players serve fastballs or balls with complicated trajectories, aiming at the edge of the court. Accurate ball control is required to release a ball that is difficult to return without hitting the net.
The ball flight path is decided not only by the initial velocity and gravity but also by the fluid forces during flight. The fluid drag and lift forces are dependent on the ball panels and grooves. Therefore, the flight trajectory of the ball also depends on the ball panel shape and groove in various ball games [3,4,5]. Dimples on the ball surface are also significant factors in the flight of volleyball [6].
Also, there are two types of service method: non-spinning or floater serve and spinning serve. The flight trajectory changes under different characteristics of fluid forces. In the non-spinning serve, irregular trajectory changes appear, and the controlling of the ball becomes more difficult [7,8,9,10]. Therefore, understanding of the effect of the ball characteristics on the flight trajectory is essential for accurate controlling of serve ball.
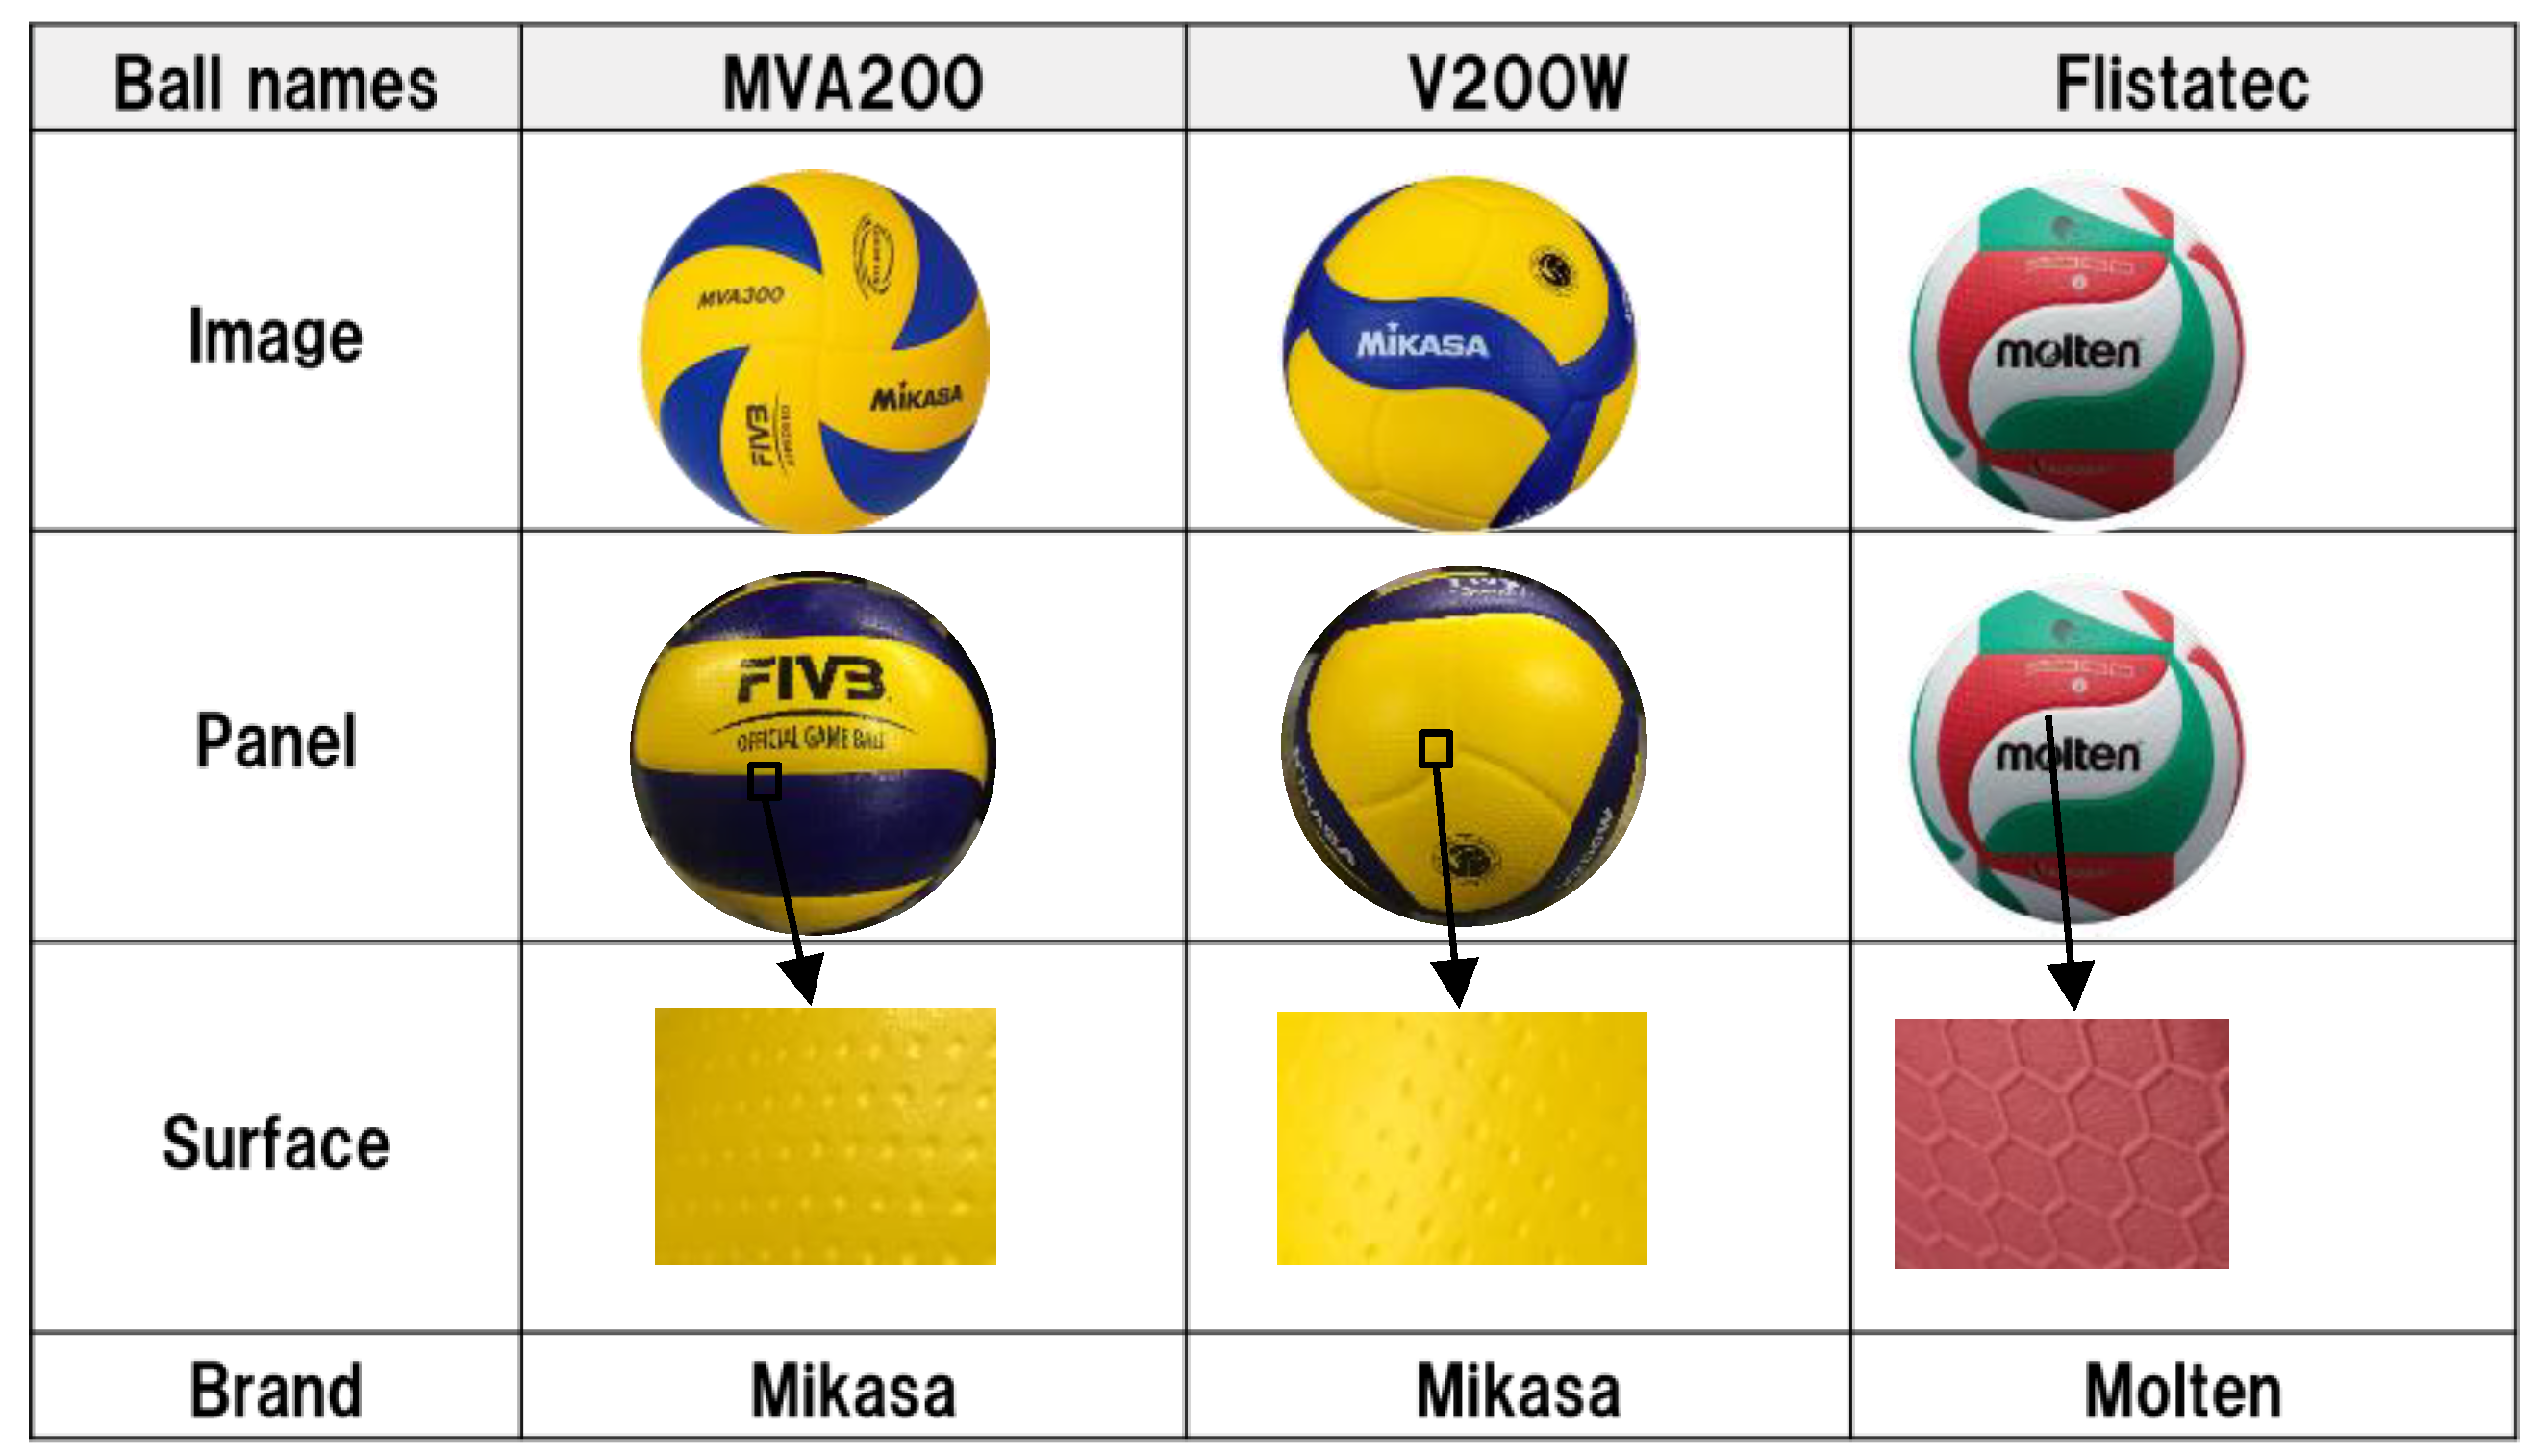
In this study, we perform the following two measurements for non-spinning floater serves to analyze how the flight behavior of volleyball is affected by the ball types and panel orientation. The first is to measure the fluid force on the ball. The fluid force is measured in the wind tunnel for the three types of balls used in the game shown in Figure 1. These balls differ greatly in the shape of the panel surface and also in the shape of the fine dimples processed on the surface. In this measurement, we examine not only the type of ball but also how the direction of the ball affects the same ball by changing the direction of the panel. The second is the measurement of the trajectory and landing point of the ball using a ball shotting machine. In the same speed range as the serve released by humans, the changes in the path and landing point of the non-spinning ball are measured using a high-speed camera while changing the panel orientation and the type of balls.
2. Experimental Method
2.1. Wind Tunnel Experiment
By using a wind tunnel and a three-component load cell, the drag applied to three types of balls was measured at a wind speed of 4 m/s to 30 m/s. The ball was installed in the wind tunnel using the cobra-type downwind support, as shown in Figure 2. The sampling frequency of the three-component load cell was 1000 Hz, and the average force applied for 10 s was measured. The panel orientation was changed into three or four patterns for each ball to investigate the effect of the panel orientation on the same ball as well as the type of ball.
2.2. Shotting Machine Experiment
As shown in Figure 3 and Figure 4, a ball shotting machine mounted on a hand lift was installed on the service line, and a non-spinning ball shotting experiment was performed. The height of the shotting point was 3.5 m, the shotting speed was 60 km/h, and the shotting angle was 5.5 degrees. The high-speed camera measured the trajectory of the ball from the front and side. The trajectory was analyzed by software Dartfish. The shotting speed was immediately measured with a speed gun. The landing point of the ball was checked visually, and the flight distance was measured.
3. Result and Discussion
3.1. Fluid Force Measurement
Figure 5, Figure 6 and Figure 7 show the measurement results of the drag coefficient of each ball. Figure 5 shows the results of the MVA200. The drag at each flow velocity was measured while changing the orientation of the ball panel with respect to the wind tunnel from panel orientation A to C. When the wind speed rises, the drag coefficient drops sharply due to the drag crisis. This trend is similar to previous studies on various balls. However, as shown by the dashed line in the figure, it became clear that the flow velocity at which the drag crisis occurs or ends depends on the ball panel orientation. In addition, it was found that the value of the drag coefficient also varied depending on the type of panel orientation facing the wind. This difference in drag due to the panel orientation means that the flight trajectory of the ball changes depending on the flight panel orientation when hitting the ball. This tendency was the same for the V200W and Flistatec shown in Figure 6 and Figure 7, and it became clear that the direction of the panel when flying had a large effect on drag. Figure 8 shows the average value of the force applied to each panel orientation for each ball. This is the average fluid force characteristic of the drag applied to each ball. It can be seen that the magnitude of the drag and the range of the drag crisis differed depending on the ball. Flistatec had a lower drag coefficient than the other two types of balls and was harder to decelerate.
3.2. Shotting Experiment
Figure 9 shows the distribution of landing points when the non-spinning MVA200, V200W, and Flistatec were shot at 60 km/h using a shotting device. The panel characteristics of the flight direction of the ball can be distinguished by the orientation of the panel, the position of the logo, and the position of the air hole. While changing these factors, five measurements were performed for each of 12 patterns for the MVA200, 24 patterns for the V200W, and 52 patterns for Flistatec. The differences between the markers in the figure indicate the differences between these patterns. The red line indicates the end line of the court, and the ball flying farther than this line is the out ball. As shown in Figure 10, the flight distance varied depending on the ball and surface, but the landing position was biased depending on the type of panel. This is consistent with the tendency of fluid force measurement that the drag differs depending on the orientation of the panel surface. The average flight distance was the longest for Flistatec and was consistent with the fluid force measurement results for the lowest average drag. From these results, it became clear that not only the control of the speed and spin speed but also the panel orientation when the ball flies greatly influence the variation of the flight trajectory and the landing point in the volleyball serve. Figure 10 shows the tendency of the landing point when the position of the air hole is changed with the panel orientation fixed in Flistatec. The flight distance varied by 2–3 m depending on where the air holes were located. The trajectory changed as the position of the air hole changed, as shown in the schematic diagram, which affected the difficulty of returning the ball.
4. Conclusions
In order to clarify the effect of ball type and panel surface on volleyball serve, we measured the fluid force of three types of balls using the wind tunnel and the trajectory using the shotting machine. The magnitude relationship of drag was clarified for each of the MVA200, V200W, and Flistatec balls, and correlated with the flight distance measured by the shotting machine. It was also found that changing the direction of the panel and the position of the air hole changed the magnitude of the drag, the position of the drag crisis, and the flight trajectory even for the same type of ball. This suggests that it is possible to control the landing position of the service more precisely by controlling not only the speed and spin speed of the ball but also the direction of the surface during flight.
References
- Tanaka, A.; Nishino, A. The importance of Service in Volleyball Game. Bull. Faculty Educ. Chiba Univ. 2007, 55, 121–124. [Google Scholar]
- Deprá, P.; Brenzikofer, R.; Goes, M.; Barros, R. Fluid mechanics analysis in volleyball services. In Proceedings of the 16 International Symposium on Biomechanics in Sports, Konstanz, Germany, 21–25 July 1998; pp. 85–88. [Google Scholar]
- Asai, T.; Ito, S.; Seo, K.; Hitotsubashi, A. Fundamental aerodynamics of a new volleyball. Sports Technol. 2010, 3, 235–239. [Google Scholar] [CrossRef]
- Mehta, R.D.; Pallis, J.M. Sports Ball Aerodynamics: Effects of Velocity, Spin and Surface Roughness; [TMS]: Warrendale, PA, USA, 2001; pp. 185–197. [Google Scholar]
- Frohlich, C. Aerodynamic drag crisis and its possible effect on the flight of baseballs. Am. J. Phys. 1984, 52, 325–334. [Google Scholar] [CrossRef]
- Cross, R. Effects of turbulence on the drag force on a golf ball. Eur. J. Phys. 2016, 37, 054001. [Google Scholar] [CrossRef]
- Cho, A. In volleyball, crafty players serve up an aerodynamic crisis. Science 2004, 306, 42. [Google Scholar] [CrossRef] [PubMed]
- Hong, S.; Weon, B.M.; Seo, K. Aerodynamic Effects of a Panel Orientation in Volleyball Float Serve. In Proceedings of the 36th Conference of the International Society of Biomechanics in Sports, Auckland, New Zealand, 10–14 September 2018; pp. 10–14. [Google Scholar]
- Stamm, R.; Stamm, M.; Vantsi, M.; Jairus, A. Comparative analysis of serve and reception performance in pool B of European men’s volleyball championship. Pap. Anthropol. 2015, 25, 55–69. [Google Scholar]
- Achenbach, E. Experiments on the flow past spheres at very high Reynolds numbers. J. Fluid Mech. 1972, 54, 565–575. [Google Scholar] [CrossRef]
Figure 1.
Three types of target volleyballs.

Figure 2.
Appearance of fluid force measurement.

Figure 3.
Outline of shotting experiment.

Figure 4.
Position of the shotting machine on the volleyball court.

Figure 5.
Relationship between Reynolds number and Drag coefficient on MVA200.

Figure 6.
Relationship between Reynolds number and drag coefficient on V200W.

Figure 7.
Relationship between Reynolds number and drag coefficient on Flistatec.

Figure 8.
Relationship between Reynolds number and averaged drag coefficient on each ball.

Figure 9.
Landing point at 60 km/h for MVA200, V200W, and Flistatec.

Figure 10.
Dependence of air hole position on Flistatec landing point.

Publisher’s Note: MDPI stays neutral with regard to jurisdictional claims in published maps and institutional affiliations. |
© 2020 by the authors. Licensee MDPI, Basel, Switzerland. This article is an open access article distributed under the terms and conditions of the Creative Commons Attribution (CC BY) license (https://creativecommons.org/licenses/by/4.0/).
Share and Cite
MDPI and ACS Style
Tamaru, T.; Ito, S.; Hiratsuka, M. Serve Ball Trajectory Characteristics of Different Volleyballs and Their Causes. Proceedings 2020, 49, 146. https://doi.org/10.3390/proceedings2020049146
AMA Style
Tamaru T, Ito S, Hiratsuka M. Serve Ball Trajectory Characteristics of Different Volleyballs and Their Causes. Proceedings. 2020; 49(1):146. https://doi.org/10.3390/proceedings2020049146
Chicago/Turabian StyleTamaru, Takehiro, Shinichiro Ito, and Masaki Hiratsuka. 2020. "Serve Ball Trajectory Characteristics of Different Volleyballs and Their Causes" Proceedings 49, no. 1: 146. https://doi.org/10.3390/proceedings2020049146