Spatial Measurements for Artificial Turf Systems Using Hall Effect Sensors †


Sports Technology Institute, Loughborough University, Loughborough LE11 3QF, UK
*
Author to whom correspondence should be addressed.
†
Presented at the 13th conference of the International Sports Engineering Association, Online,
22–26 June 2020.
Proceedings 2020, 49(1), 160; https://doi.org/10.3390/proceedings2020049160
Published: 15 June 2020
(This article belongs to the Proceedings of The 13th Conference of the International Sports Engineering Association)
Abstract
:The purpose of this study was to evaluate a bespoke spatial measurement methodology using Hall Effect Sensors (HES), i.e., utilizing inductance between a permanent magnet and sensor to indirectly measure the magnet position. The aim is to embed the magnet in a boot’s stud and use an array of sensors in the artificial turf. To evaluate the accuracy and applicability of a HES system in sports turf, two studies were carried out. To measure the spatial position vertically, a standard mechanical dynamic impact testing with the magnet embedded, and the sensors below the turf carpet, was compared to the gold standard optical reference measurement system (GOM UK Ltd.: Coventry, UK) . A second study evaluated the horizontal spatial accuracy for sensors in a variable array with a controlled incremental step movement of the magnet on a precise engineering workshop table.
1. Introduction
Third generation (3G) artificial turf (AT) surfaces consist of a number of synthetic materials constructed in layers, and the system designed to meet the performance requirements of specific sports [1,2] (Figure 1). Precise measurement of the penetration and translation and rotation of studded footwear within the surface would greatly aid our understanding and enhance future boot and surface designs. Previous research [3,4] investigated the position of a player’s boot during contact using an optical system (Vicon), with markers placed on the outsole of the boot and ‘virtual’ markers created to track the studs, but with limited accuracy. Errors occur from static calibration trials, marker occlusion by the carpet fibers, and assumptions about the flexibility of the outsole.
Hall effect sensors (HES) are small (~1–2 mm) transducers that produce a voltage proportional to a magnetic field [5]. Using a permanent magnet of known strength, the voltage readout can be used to approximate the distance between the sensor(s) and magnet. Our concept is to embed small magnets into boot studs and place the sensors in the AT layers to track the 3D location of the stud.
This paper reports on two studies investigating the feasibility of this approach. The first study aimed to test the accuracy of the HES system in the vertical plane during dynamic compression of three different shockpad samples. The advanced artificial athlete (AAA) was used to simulate the dynamic impact conditions of a human foot strike [6] and spatial measurements were validated against an independent gold standard optical measurement system (GOM). The second study evaluated the accuracy of the HES in 3D space by using controlled incremental positioning on a triaxial slide table for comparison to the predicted position from the sensor readings.
2. Materials and Methods
2.1. Dynamic Vertical Impact
The Advanced Artificial Athlete (AAA) is the industry gold standard impact test [6] comprising a 20 kg mass dropped from 55 mm height (Figure 2a), impacting the surface through a 70 mm diameter test foot. A stiff spring controls the impact duration. A bespoke nylon test foot was added to house the magnet, and from trials, was set at 50 mm long to avoid any interference in the magnetic field from the AAA device.
A cylindrical magnet 12 mm in diameter, 12 mm thick, and a strength of 3600 Gauss was selected based on size and strength. The magnet was firmly embedded into the nylon test foot, flush with its base. Five linear HES (Honeywell, Charlotte, NC, USA) were soldered to a flexible printed circuit board in a quincunx configuration at 15 mm spacing (Figure 2b). The embedded magnet was carefully horizontally aligned directly above the central sensor (No. 3) using the live voltage output from all five sensors. Alignment was assessed after every five trials and realigned if needed.
Calibration was achieved using a tensometer (Instron Electropuls E3000) with the sensor board securely fastened to the base and the magnet attached to the crosshead. Controlled lowering of the magnet in 1 mm increments produced a static calibration curve (Figure 2c). A cubic spline interpolation produced a transfer equation to convert the recorded voltage to a magnet–sensor distance (Figure 2c) to incorporate the variations in the spatial sensitivity (V/mm) observed.
To verify the HES inferred magnet position, the GOM optical system tracked 5 mm diameter passive markers on the nylon test foot (Figure 2b). The GOM setup comprised two Photron Fastcam SA1.1 high speed video cameras with Titanar 50 mm lenses. The GOM calibration gave an accuracy of less than 25 µm [7]. The camera capture period was controlled manually.
2.1.1. Test Protocol
A total of 15 impacts were completed on three separate samples (Table 1), comprising five impacts at drop heights of 25, 55, and 85 mm. The three elastic shockpad test samples (manufactured from rubber and PU foam) differed in thickness (~12, 15, and 24 mm) and characteristics to provide a range of impact response. All samples were at least 300 × 300 mm in size. The thickness of each sample was obtained through careful measurements with a calliper at 10 positions on each sample.
Prior to testing the precise vertical position of the top of the sample was defined. For GOM, this was achieved by observing the initial point of contact between the test foot and sample and these images used as a vertical reference frame. For the HES, the sample thickness measurements (Table 1) were used to define the top of the surface voltage and used as a vertical datum.
2.1.2. Data Processing
Recordings made with GOM were exported as csv files and post processed in Matlab. The position of the test foot was calculated on a frame by frame basis and sample deformation defined using the reference frame. HES output voltages were filtered using a low-pass 4th order Butterworth filter at 50 Hz, determined based on the frequency content of the signals. The HES output voltage was converted to a magnet–sensor distance using the calibration data (Figure 2c). Sample deformation was then calculated using the sample thickness reference.
To evaluate the accuracy of the HES, Bland–Altman limits of agreement analyses were performed between HES–GOM on the peak deformations [8]. The mean difference in the Bland–Altman analysis provided an indication of the systemic bias between the two measurement systems (closer to zero indicates lower systematic bias), whilst the 95% confidence intervals (±1.96 standard deviations) gave an indication of the random differences between the two measurement systems (larger confidence intervals indicates larger random differences). Repeated measures t-tests were also conducted on the peak sample deformations. For assessment of the transient deformation during contact, the root mean square difference (RMSD) was used to compare GOM and HES.
2.2. Horizontal and Vertical Position
To select a suitable magnet and sensor spacing, a series of computer simulations were carried out. An 8 × 8 mm cylindrical magnet with strength 5600 Gauss was selected for evaluation of the HES horizontal tracking capability. The size is small enough to fit into a conventional boot stud, and cylindrical in shape to produce a consistent field in all directions from the pole. Further, the strength required was to ensure a change in voltage response could be detected at a vertical distance of 40 mm, selected based on the typical thickness of a 3G AT infill.
A sensor board with 16 sensors in a grid was created (Figure 3), at 5 mm spacing to ensure a minimum of six sensors could detect the magnet. The sensor board was securely fixed to a flat workbench and the magnet attached to a triaxial micrometer slide table allowing for precise spatial control of the magnet in three planes.
Test Protocol and Analysis
The initial position of the magnet was set above one of the middle sensors (Figure 3, sensors 6, 7, 10, or 11). Precise alignment was achieved using eight sensors. Three trials were carried out. The first trial involved moving the magnet in the vertical plane only in increments of 0.1 mm up to 25 mm, the limit of the micrometer table. The second trial fixed the magnet at a vertical distance of 5 mm and the magnet then moved in one axis direction across the board (e.g., from sensor 11 to toward sensor 3, Figure 3) in increments of 0.1 mm. At each increment, the voltage from all sensors was recorded. The third trial recorded the sensor voltages at a range of varying x-y-z coordinates.
Outputs from the HES trials were saved as csv files and imported into Matlab for processing. A 3D bar chart of HES voltages was constructed to indicate the approximate magnet position (Figure 4a) on a 2.5 × 2.5 mm area. To refine the magnet position, a polynomial surface was fitted to the data. Six sensors or more were required, and a threshold of 0.15 V was used to eliminate any weaker readings influencing the fit. The inflection point of the fitted surface was taken at the x-y coordinate of the magnet center, and the inferred position compared to the actual position (Figure 4b).
To determine the vertical positioning in addition to the x-y, a calibration grid was created. HES measurements were taken at 600 positions across the sensor board at 0.1 mm increments. The calibration grid was used in combination with the x-y position from the fitting of the 3D surface to also match with the vertical position.
3. Results
3.1. Dynamic Vertical Impact
In general, for the stiffer samples, HES slightly over predicted the peak sample deformation, whilst the more compliant samples under predicted the peak deformation (Figure 5). The Bland–Altman analysis [8] revealed no systematic bias (mean difference 0.2 mm) but small random differences of ±0.3 mm (Figure 5). Statistical significance, using t-tests, was observed in the peak sample deformations, except for sample SP1 at 55 mm drop height. Results for the 85 mm drop were omitted after some damage to the sensors.
3.2. Horizontal and Vertical Position
Differences in recorded horizontal position in the x-y plane compared to the actual horizontal position increased as the vertical distance from the sensor board increased. Up to 12 mm, the difference in x-y position was <1 mm, however beyond this, the error grew substantially, increasing up to 4 mm (Figure 7a). The smallest error in positioning of the magnet in x-y was found to occur when 8 sensors or more could be used to create the 3D surface, with the error increasing as fewer sensors met the threshold (Figure 7b). Individual positioning of the magnet was able to be predicted to <0.6 mm for various positions across the sensor board when the magnet was fixed vertically at 5 mm (Table 2), for example.
4. Discussion
Under dynamic impact conditions, the peak vertical deformation with the HES was measured to <0.7 mm accuracy relative to the GOM. A poorer agreement, however, was found in the RMSD for the transient deformation and recovery period.
The sensitivity range differed for each sample due to differences in sample thickness (Figure 2c). SP1 and RS samples were thinner and stiffer than SP2, therefore, the magnet was closer to the sensor board during the impact, resulting in a higher average sensitivity (0.15 and 0.17 V/mm respectively). In contrast, this for SP2, the average sensitivity was 0.04 V/mm. It was thus expected that the HES error would increase with a lower sensitivity, however this was not observed in the results, indicating sensitivity was not the main factor limiting the accuracy of the HES. Given the limited range of magnet–sensor distance that exhibited a high sensitivity, the results reinforce the importance of selecting appropriate magnet properties. Conversion of the sensor voltage reading to a distance was dependent upon the transfer function created from the initial calibration (Figure 2c). Any vertical misalignment between the sensor and magnet would magnify errors and was checked and adjusted if necessary, after each trial. It was observed, however, that the AAA vibrations during impact could cause the device to translate slightly, up to 0.4 mm, verified by GOM analysis. This error may contribute, but is too small, to explain the HES errors observed.
The sensor board consisted of 16 sensors, however, due to the size and strength of the magnet, only a maximum of nine sensors could pick up the magnetic field to a detectible level used in the fitting of the 3D surface (Figure 7b). Furthermore, above 10 mm vertical distance of the magnet from the sensor board, the magnetic field weakened to the extent that peripheral sensor readings were too low to be used effectively in precise x-y positioning (Figure 7a). Regardless, if the magnet center was directly aligned with a sensor, a vertical distance of up to 30 mm was detectable to high accuracy. A further source of potential spatial measurement error was the precise location of the Hall effect sensors on the board, carefully set out at 5 mm intervals, but once soldered, the exact location was not physically measurable. The 3D calibration grid created was very time consuming, and is magnet and sensor spacing specific, thus any other combination of magnet or sensor spacing would require a unique calibration grid. Further work is progressing in trialing stronger magnets and modifying the sensor voltage resolution.
5. Conclusions
This study aimed to assess the feasibility of applying relatively simple Hall effect sensors principles to measure the spatial position of a magnet in 3D space.
The vertical deformation of sport surface shockpad samples was measurable to an accuracy of 0.7 mm. In x-y space, the spatial accuracy was evaluated at 0.6 mm up to a vertical spacing of 5 mm, and estimated to be >1 mm at spacings in excess of 12 mm.
The magnet sensor systems trialed may provide a viable method to measure sub-surface deformations in a layered artificial turf (AT) system, albeit with some limitations. At present, the findings suggest evaluation remotely of the boot stud in 3D space once embedded in an AT system is likely to produce errors of greater than 1 mm using the HES measurement system.
References
- Fleming, P.; Ferrandino, M.; Forrester, S. Artificial Turf Field-A New Build Case Study. Procedia Eng. 2016, 147, 836–841. [Google Scholar] [CrossRef]
- Fleming, P. Artificial turf systems for sport surfaces: Current knowledge and research needs. Proc. Inst. Mech. Eng. Part P J. Sports Eng. Tech. 2011, 225, 43–63. [Google Scholar] [CrossRef]
- Ferrandino, M.; Forrester, S.; Fleming, P. The player surface interaction of rugby players with 3G artificial turf during rugby specific movements. Procedia Eng. 2015, 112, 308–313. [Google Scholar] [CrossRef]
- El Kati, R. Effect of Mechanical Behaviour of Artificial Turf on Player-Surface Interaction in Soccer. Ph.D Thesis, Loughborough University, Loughborough, UK, 2012. [Google Scholar]
- Ramsden, E. Proximity-Sensing Techniques. In Hall-Effect Sensors: Theory and Application, 2nd ed.; Ramsden EBT-H-ES; Newnes: Oxford, UK, 2006. [Google Scholar] [CrossRef]
- Fédération Internationale de Football Association. FIFA Quality Concept for Football Turf: Handbook of Test Methods. 2015. Available online: www.FIFA.com (accessed on 23 February 2019).
- Leach, R.J.; Forrester, S.E.; Mears, A.C.; Roberts, J.R. How valid and accurate are golf impact parameters using commercially available radar and stereoscopic optical launch monitors. Measurement 2017, 112, 125–136. [Google Scholar] [CrossRef]
- Bland, J.; Altman, D. Measuring agreement in method comparison studies. Stat. Methods Med. Res. 1999, 8, 135–160. [Google Scholar] [CrossRef] [PubMed]
Figure 1.
A 3G AT system. 1 Shockpad; 2 Carpet backing; 3 Sand infill; 4 Rubber infill; 5 Carpet fibers.
Figure 1.
A 3G AT system. 1 Shockpad; 2 Carpet backing; 3 Sand infill; 4 Rubber infill; 5 Carpet fibers.
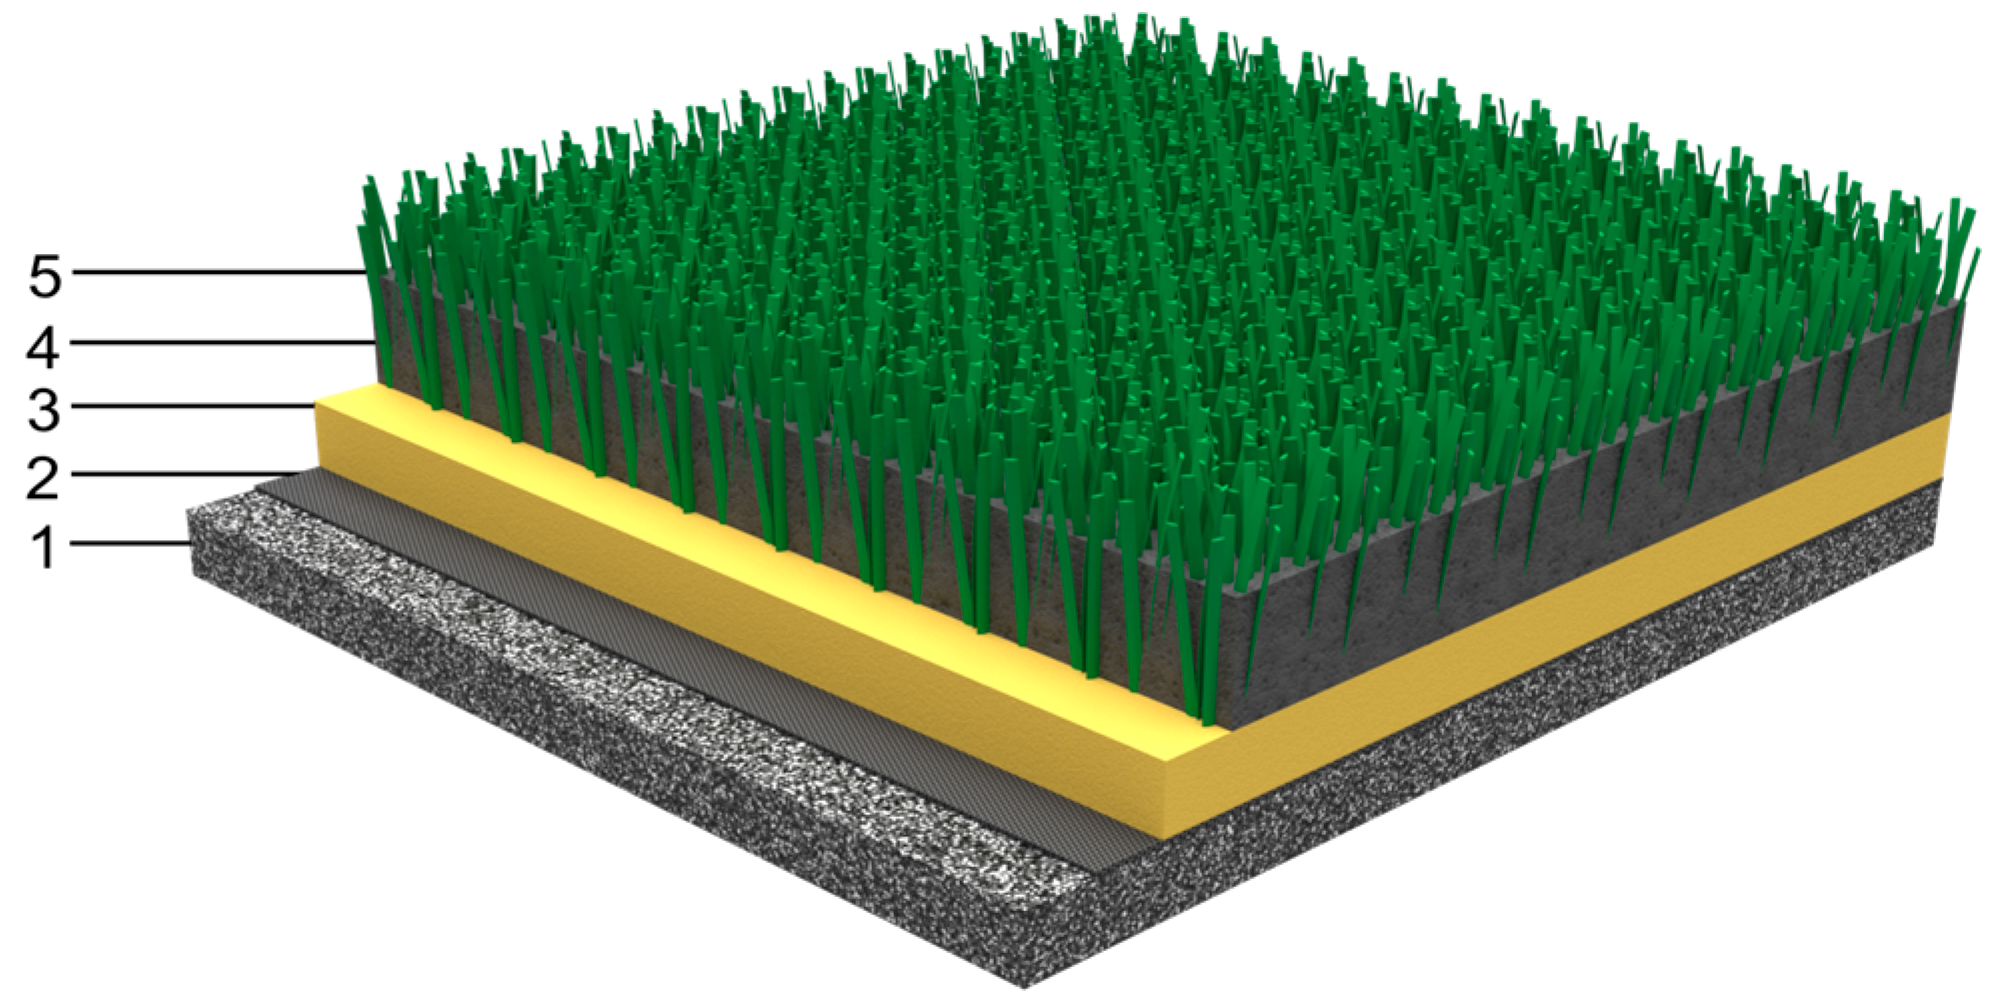
Figure 2.
(a) AAA test set up; 1. Nylon test foot; 2. GOM markers; 3. Embedded magnet; 4. Test sample; 5. Hall effect sensor board. (b) Sensor board layout. (c) Calibration graph showing the relationship between sensor output voltage and the distance between the magnet and sensor.
Figure 2.
(a) AAA test set up; 1. Nylon test foot; 2. GOM markers; 3. Embedded magnet; 4. Test sample; 5. Hall effect sensor board. (b) Sensor board layout. (c) Calibration graph showing the relationship between sensor output voltage and the distance between the magnet and sensor.

Figure 3.
Hall effect sensor board used for horizontal special accuracy testing and vertical calibration of magnet when positioned directly above sensor.
Figure 3.
Hall effect sensor board used for horizontal special accuracy testing and vertical calibration of magnet when positioned directly above sensor.

Figure 4.
(a) Voltage readouts from each sensor during one static trial. (b) The calculated magnet position (red) compared to the actual magnet position (blue).
Figure 4.
(a) Voltage readouts from each sensor during one static trial. (b) The calculated magnet position (red) compared to the actual magnet position (blue).

Figure 5.
Bland–Altman plot comparing the peak vertical deformation values from the Hall effect sensor (HES) and GOM gold standard measurement. The horizontal blue line represents the mean difference and the red lines the upper and lower quartiles (95% confidence intervals).
Figure 5.
Bland–Altman plot comparing the peak vertical deformation values from the Hall effect sensor (HES) and GOM gold standard measurement. The horizontal blue line represents the mean difference and the red lines the upper and lower quartiles (95% confidence intervals).

Figure 6.
Typical sample deformation profiles (55 mm drop height) for the (HES) and GOM systems for (a) RS, (b) SP1, and (c) SP2. The y-axis range is the sample thickness, from the top to the sensor board beneath.
Figure 6.
Typical sample deformation profiles (55 mm drop height) for the (HES) and GOM systems for (a) RS, (b) SP1, and (c) SP2. The y-axis range is the sample thickness, from the top to the sensor board beneath.

Figure 7.
(a) Difference in recorded magnet position and predicated magnet position at increasing z distance when positioned directly above a single sensor. (b) Mean difference and standard deviation in x-y magnet position using a varying number of sensors to predict magnet position when held at 5 mm vertical distance from the sensor board.


Table 1.
Peak sample deformations and strain root mean square difference for GOM and Hall effect sensors during dynamic impact testing.
Table 1.
Peak sample deformations and strain root mean square difference for GOM and Hall effect sensors during dynamic impact testing.
| Sample | Thickness | Drop Height | Peak Deformation (mm) | RMSD | RMSD (% of peak def.) | |
|---|---|---|---|---|---|---|
| (mm) | (mm) | GOM | HES | (mm) | ||
| RS | 25 | 2.8 ± 0.0 | 3.2 ± 0.0 * | 0.68 ± 0.06 | 24 | |
| 11.9 ± 0.1 | 55 | 3.4 ± 0.1 | 3.5 ± 0.0 * | 0.71 ± 0.02 | 21 | |
| 85 | 3.6 ± 0.2 | - | - | |||
| SP1 | 25 | 6.0 ± 0.1 | 6.1 ± 0.0 * | 0.77 ± 0.06 | 21 | |
| 15.0 ± 0.2 | 55 | 7.5 ± 0.0 | 7.4 ± 0.0 | 0.98 ± 0.06 | 13 | |
| 85 | 8.0 ± 0.1 | 7.3 ± 0.1 * | 0.83 ± 0.02 | 10 | ||
| SP2 | 22 | 8.0 ± 0.1 | 7.7 ± 0.0 * | 0.36 ± 0.1 | 5 | |
| 24.1 ± 0.1 | 55 | 10.4 ± 0.1 | 9.9 ± 0.1 * | 0.27 ± 0.07 | 3 | |
| 85 | 12.0 ± 0.1 | 11.3 ± 0.2 * | 0.38 ± 0.05 | 3 | ||
* Statistical significance at p = 0.05.
Table 2.
Recorded magnet position against the predicted magnet position at five controlled spatial positions.
Table 2.
Recorded magnet position against the predicted magnet position at five controlled spatial positions.
| Position | Recorded Position | Number of Sensors Used to Approximate Position | Predicted Position | Difference (mm) | ||||
|---|---|---|---|---|---|---|---|---|
| x | y | z | x | y | z | |||
| 1 | 6.5 | 5.5 | 5.0 | 8 | 6.8 | 5.6 | 4.9 | 0.36 |
| 2 | 11.1 | 8.2 | 5.0 | 9 | 11.4 | 8.1 | 4.8 | 0.41 |
| 3 | 6.8 | 2.5 | 5.0 | 8 | 7.2 | 2.4 | 4.7 | 0.53 |
| 4 | 5.0 | 10.0 | 5.0 | 8 | 5.1 | 10.2 | 4.8 | 0.28 |
| 5 | 12.2 | 1.5 | 5.0 | 8 | 12.4 | 1.8 | 4.6 | 0.55 |
Publisher’s Note: MDPI stays neutral with regard to jurisdictional claims in published maps and institutional affiliations. |
© 2020 by the authors. Licensee MDPI, Basel, Switzerland. This article is an open access article distributed under the terms and conditions of the Creative Commons Attribution (CC BY) license (https://creativecommons.org/licenses/by/4.0/).
Share and Cite
MDPI and ACS Style
Cole, D.; Fleming, P.; Forrester, S.; Morrison, K. Spatial Measurements for Artificial Turf Systems Using Hall Effect Sensors. Proceedings 2020, 49, 160. https://doi.org/10.3390/proceedings2020049160
AMA Style
Cole D, Fleming P, Forrester S, Morrison K. Spatial Measurements for Artificial Turf Systems Using Hall Effect Sensors. Proceedings. 2020; 49(1):160. https://doi.org/10.3390/proceedings2020049160
Chicago/Turabian StyleCole, David, Paul Fleming, Steph Forrester, and Kelly Morrison. 2020. "Spatial Measurements for Artificial Turf Systems Using Hall Effect Sensors" Proceedings 49, no. 1: 160. https://doi.org/10.3390/proceedings2020049160