Measuring Running Workload and Key Points during Treadmill Running Using a Custom Build ‘Nodes’ System †


1
School of Sport Studies, Fontys University of Applied Sciences, 5644 HZ Eindhoven, The Netherlands
2
Department of Industrial Design, Eindhoven University of Technology, 5612 AJ Eindhoven, The Netherlands
3
2M Engineering, John F Kennedylaan 3, 5555 XC Valkenswaard, The Netherlands
*
Author to whom correspondence should be addressed.
†
Presented at the 13th conference of the International Sports Engineering Association, Online, 22–26 June 2020.
Proceedings 2020, 49(1), 30; https://doi.org/10.3390/proceedings2020049030
Published: 15 June 2020
(This article belongs to the Proceedings of The 13th Conference of the International Sports Engineering Association)
Abstract
:Within this study the aim is to measure running workload and relevant running technique key points on varying cadence in recreational runners using a custom build sensor system ‘Nodes’. Seven participants ran on a treadmill at a self-chosen comfortable speed. Cadence was randomly guided by a metronome using 92%, 96%, 100%, 104%, and 108% of the preferred cadence in 2-min trials. Workload was measured by collecting the heart rate and the rating of perceived exertion (RPE 1 to 10) scores. Heart rate data shows that the 100% cadence trial was most economical with a relative heart rate of 99.2%. The 108% cadence trial had the lowest relative RPE score with 96.2%. The sample rate of the Nodes system during this experiment was too low to analyze the key points. Three requirements are proposed for the further engineering of a wearable running system, (i) sampling frequency of minimal 50 Hz, (ii) step-by-step analysis, and (iii) collecting workload in the heart rate and RPE.
1. Introduction
Many runners start running for the health benefits and ease of practice, making running a popular form of exercise [1,2]. More than eight out of ten runners use devices such as running related smartphone apps, sports watches, and/or smartwatches [3]. These devices are mainly used to monitor running performance. Running performance is determined by a large number of variables typically categorized by physiological (workload) and biomechanical (running technique) variables [4]. Workload and specific components of biomechanical variables relate to drop-out and injury in novice runners. Running-related wearable devices are widely used by novice runners and have the possibility to monitor workload and biomechanical variables of running [5,6,7]. In these wearable devices, heart rate is commonly used as a variable to collect the workload [3].
In a large number of studies, running technique measurements are done to identify one or a small number of running technique variables [8]. This type of research is mainly carried out with experienced runners focused on performance improvements. The runner or his coach can analyze and interpret the measurements to make adjustments and to provide instruction. Sensors and systems used in these research contexts often target only one specific aspect within the running technique [8,9]. Although this is a logical choice in terms of reliability, it raises questions about the ecological validity of the current technical measurements. Both novice and experienced runners benefit from measuring more running technique variables within the real-life running context [9,10]. Developing a sensor system solution coping with these challenges needs a different approach than traditional [5]. Currently, running analysis is costly and often done using expensive (research focused) systems (e.g., Vicon and Xsens). However, there is a need for monitoring running technique in the real-life context, for both novice and experienced runners. In this study, therefore, we investigate the feasibility of measuring workload and running technique key points using a custom build wearable sensor system named ‘Nodes’ [11]. Along with this, we aim to identify the running key points that (i) can be measured with affordable, easy-to-wear sensors and (ii) are related to the actual and perceived workload. Step frequency, or cadence, is related to both physiological and biomechanical variables [12,13]. Due to this relationship between cadence and running technique changes, this variable was used to influence the running technique.
Running Technique Key Points
Previous research has identified a set of critical running technique key points that should be used to provide real-time feedback to the runner [5,10]. The running technique key points were identified by a literature review, observations of running coaches, and a focus group of running experts [10]. The present study is a crucial step within the future aim to design and validate a real-time feedback system. This future system should be able to measure relevant running technique key points (Table 1) and provide relevant, meaningful, and understandable personalized feedback, instruction, and motivation for the runner based on the individuals’ measurements.
2. Materials and Methods
2.1. Subjects
Seven healthy subjects were recruited, all working at Fontys School of Sport Studies. The single inclusion criterium was that the participant was able to run 30 min consecutively on a self-selected running speed. The study was conducted in accordance with the Declaration of Helsinki, and the study protocol was approved by the Research Board of Fontys School of Sport studies.
2.2. Technical Description of the Nodes System
The Nodes system (Figure 1) was originally engineered for motion tracking in a revalidation context. The complete system can contain up to 5 chains of 4 nodes (or sensors), connected to the central unit via micro-USB via wires between each other in a daisy-chain fashion. The central unit can be connected both wired or wireless to a smartphone or a laptop. Every sensor unit is equipped with a microcontroller and inertial magnetic units (IMUs) to provide the orientation of the sensors with minimum computational latency. The IMUs include a 3-axis accelerometer, a 3-axis gyroscope, and a 3-axis magnetometer. The accelerometer and gyroscope are calibrated during production, whereas the magnetometer needs to be calibrated in situ, prior to recording. The single sensors are kept as light and small as possible. The central unit has been equipped with a user-interface in which battery and Bluetooth status is displayed besides the sensor connection indication for the corresponding body segments. Different sampling frequencies are achievable, depending on the number of sensors connected: the daisy chain configuration and the communication protocol (Bluetooth or USB) are the bottleneck of the communication speed.
IMUs represent the actual sensing component, whereas the translation of data from IMU to orientation can take place on the microcontroller or the laptop via a sensor fusion algorithm. When raw data is saved on a computer, it is possible to reconstruct the orientation of the limbs if a prior calibration procedure was recorded. The Nodes system interfaces with an 18-segment biomechanical model developed in Matlab (MathWorks, Inc. Natick, MA, USA) and Unity (Unity Technologies, San Francisco, CA, USA). When using the Matlab interface, it is necessary to perform a T-pose calibration in order to obtain initials sensor-to-segment orientation. The IMUs are attached to the body via elastic straps and custom rubber rings that hold the sensor case in position. Thighs and pelvis straps are kept in position via a connection to a waist strap that also hosts the main unit.
2.3. Experimental Protocol
All subjects were equipped with the Nodes system. Two strings of four nodes each were used to collect both legs running motion. Data was streamed via USB connector to the laptop. Via prior calibration, a Matlab algorithm reconstructed the sensor position. This system was used to analyze the key points with sensors placed on both feet, shins, and thighs, one sensor was placed on the pelvis and one on the trunk. Subjects also had a chest-worn heart sensor (Wahoo TICKR) to measure the workload using heart rate. Running was performed on a treadmill (Lode Katana Sport, Groningen, Netherlands) and video recorded by iPad (Apple, Cupertino, CA, USA) from two perspectives (sagittal and backplane), from the feet up to the shoulder. A metronome app (Metronome, Gismart, London, UK) was used to set the cadence in the different trials.
After informing the subject about the study and signing the informed consent, the body metrics, age, gender, body height (cm), and weight (kg) were recorded. The subject was equipped with the heart rate monitor and the Nodes system, calibrated with the subject standing on the treadmill. During the subject’s warm-up on the treadmill, a comfortable running speed was set for the running trials. The first running trial (T100%self) of 5 min was at a self-chosen cadence. We used this measured cadence in steps per minute (SPM) as a 100% mark. Within the following 2-min trials the cadence was set randomly at 92%, 96%, 100%, 104%, and 108% (Trials named T92%-T108%). Heart rate and running technique were measured continuously. During the final 30 s of each trial, the rate of perceived exertion (RPE) was collected using a 1 to 10 RPE scale. After the final trial, a cool down was done using a self-chosen running speed, cadence, and time.
2.4. Data Analyses
Heart rate, RPE and running technique key points, were analyzed for every trial for the individual runner. Group data was analyzed and displayed in group average and normalized data. Normalization was based on the individuals’ average result taken as 100% on each variable, using only the randomly assigned trials (T92%-T108%).
3. Results
Of the seven subjects, five were female. Average age was 40.7 years old, the standard deviation was 8.7 years, one of the runners was 59 years of age. The average height was 170.6 (SD 9.6) cm, and the average weight was 68.4 (SD 7.6) kg. Running experience varied from one to nine years, while running was performed by the subjects 1–3 times per week. The estimated 10 k running performance time varied within the group between 45 and 80 min.
The self-chosen running speed during the T100% set was on average 8.9 km/h (SD 1.5). The runners were able to match the set cadence with the metronome, average 165.2 SPM (SD 9.4), versus the measured cadence, average 164.7 SPM (SD 8.7, paired t-test p = 0.569)
Visual observations using the video material of the key points suggest that impact direction, upper body angle, and knee extension changed between the trials. The set 25 Hz sample rate of the Nodes system resulted in sampling only at 13 Hz per string of sensors as attached to each leg. Running at a cadence of 160 steps per minute resulted in nine data samples per stride (running cycle of 1 leg). The time in between data samples was too long to reliably analyze the running key points.
Heart rate results showed only little variation between the trials, with 99.2% (148 BPM) within
T100% as the lowest average heart rate. The T100% self-trial was the first trial for every runner. The highest heart rate was measured in T108% with a normalized heart rate of 101% (151 BPM). The RPE scores showed a different result related to the trials. The 108% cadence trial had the lowest normalized RPE score with 96.2% (6.3). The highest RPE score was seen with the 92% cadence trial, 107.8% (7.0). Table 2 displays the results in both absolute and normalized data. Table 2 shows all the normalized heart rate and RPE data with their variations.
4. Discussion
The results of the collected cadence and heart rate seems to indicate that runners run most economically at their preferred cadence. This finding was in contrast to other findings that demonstrated that the optimal step frequency was higher than the self-chosen frequency [19]. The small differences found in this study could suggest that there is a bandwidth in which running economy is the lowest as suggested in other studies [8]. The subjectively perceived workload was, however, lowest while running with a higher cadence than the runners preferred cadence, 108% of this preferred cadence.
The perceived workload shows a different relationship to the cadence changes than the heart rate workload findings. The low perceived workload of the T108% trial could be explained by the lower force needed per step for the same running speed. These findings only relate to acute effects of changing the running technique, how running economy and perceived workload develops over a more extended period of running technique changes will be part of our future work.
Running technique key points were not successfully measured in our experiment using the Nodes system with the chosen sampling rate and architecture. We needed eight sensors and two strings to be able to measure the suggested key points. The capacity of the system was 25 Hz in this architecture, which was good enough to analyze gait and slow running [11]. For running at higher running speed, the data sampling frequency should have a minimum of 50 Hz [20]. Then 20 data samples per stride can be achieved, which should be sufficient to study the running technique. This sampling rate is currently achieved using 1 string of sensors in the next iteration of the Nodes system. Further testing and validation in laboratory situation before transferring to the real-life running context is needed.
5. Conclusions
The results can be used to specify several system requirements for engineering a real-time feedback system for running. First, the sampling frequency should at least be 50 Hz, preferably 100 Hz to measure running key points and reconstruct the running cycle reliably. Second, key points should be collected step-by-step to give insight into the running technique. Third, the workload should be taken into account using heart rate or a subjective scale (e.g., RPE or Borg-scale. Heart rate and running speed can be used to estimate the running economy in recreational runners [19]. Theoretically calculating running economy, in heartbeats per kilometer, can be used to identify the optimal individual bandwidth of the key points. Future research is, however, needed to back this claim. Measuring running technique key points with the proposed system requirements using easy-to-wear sensors is challenging but needed for the real-life running context. These system requirements will be taken into account in the next iteration of the Nodes system. The architecture will be improved being able to measure step-by-step at a minimum sampling frequency of 50 Hz. Taking a step closer to our aim to design and validate an intelligent, easy to use feedback system able to provide relevant, meaningful, and understandable personalized feedback, instruction, and motivation for the runner based on the individuals’ measurements.
Acknowledgments
This work is part of the project Nano4Sports, which is financed by Interreg Vlaanderen-Nederland.
Conflicts of Interest
The funding sponsors had no role in the design of the study; in the collection, analyses, or interpretation of data; in the writing of the manuscript, and in the decision to publish the results.
References
- Vos, S.; Janssen, M.; Goudsmit, J.; Lauwerijssen, C.; Brombacher, A. From Problem to Solution: Developing a Personalized Smartphone Application for Recreational Runners following a Three-step Design Approach. Procedia Eng. 2016, 147, 799–805. [Google Scholar] [CrossRef]
- Scheerder, J.; Breedveld, K.; Borgers, J. Running across Europe: The Rise and Size of One of the Largest Sport Markets; Palgrave Macmillan: Basingstoke, UK, 2015; ISBN 9781137446374. [Google Scholar]
- Janssen, M.; Scheerder, J.; Thibaut, E.; Brombacher, A.; Vos, S. Who uses running apps and sports watches? Determinants and consumer profiles of event runners’ usage of running-related smartphone applications and sports watches. PLoS ONE 2017, 12, 1–17. [Google Scholar] [CrossRef]
- Saunders, P.U.; Pyne, D.B.; Telford, R.D.; Hawley, J.A. Factors Affecting Running Economy in Trained Distance Runners. Sports Med. 2004, 34, 465–485. [Google Scholar] [CrossRef] [PubMed]
- Van Hooren, B.; Goudsmit, J.; Restrepo, J.; Vos, S. Real-time feedback by wearables in running: Current approaches, challenges and suggestions for improvements. J. Sports Sci. 2020, 38, 214–230. [Google Scholar] [CrossRef]
- Strohrmann, C.; Seiter, J.; Llorca, Y.; Tröster, G. Can smartphones help with running technique? Procedia Comput. Sci. 2013, 19, 902–907. [Google Scholar] [CrossRef]
- Adesida, Y.; Papi, E.; McGregor, A.H. Exploring the role of wearable technology in sport kinematics and kinetics: A systematic review. Sens. Switz. 2019, 19, 1597. [Google Scholar] [CrossRef] [PubMed]
- Moore, I.S. Is There an Economical Running Technique? A Review of Modifiable Biomechanical Factors Affecting Running Economy. Sports Med. 2016, 46, 793–807. [Google Scholar] [CrossRef] [PubMed]
- Barnes, K.R.; Kilding, A.E. Running economy: Measurement, norms, and determining factors. Sports Med. Open 2015, 1, 8. [Google Scholar] [CrossRef] [PubMed]
- Goudsmit, J.; Janssen, M.; Luijten, S.; Vos, S. Tailored Feedback Requirements for Optimal Motor Learning: A Screening and Validation of Four Consumer Available Running Wearables. Proceedings 2018, 2, 1–7. [Google Scholar] [CrossRef]
- 2M Engineering Nodes System. Available online: https://www.2mel.nl/project/nodes-9dof-motion-suit-for-vr-rehabilitation-gaming/ (accessed on 8 October 2019).
- Hafer, J.F.; Brown, A.M.; DeMille, P.; Hillstrom, H.J.; Garber, C.E. The effect of a cadence retraining protocol on running biomechanics and efficiency: A pilot study. J. Sports Sci. 2015, 33, 724–731. [Google Scholar] [CrossRef] [PubMed]
- Yong, J.R.; Silder, A.; Montgomery, K.L.; Fredericson, M.; Delp, S.L. Acute changes in foot strike pattern and cadence affect running parameters associated with tibial stress fractures. J. Biomech. 2018, 76, 1–7. [Google Scholar] [CrossRef] [PubMed]
- Boyer, K.A.; Nigg, B.M. Muscle activity in the leg is tuned in response to impact force characteristics. J. Biomech. 2004, 37, 1583–1588. [Google Scholar] [CrossRef] [PubMed]
- Anderson, T. Biomechanics and running economy. Sports Med. 1996, 22, 76–89. [Google Scholar] [CrossRef] [PubMed]
- Moore, I.S.; Jones, A.M.; Dixon, S.J. Mechanisms for improved running economy in beginner runners. Med. Sci. Sports Exerc. 2012, 44, 1756–1763. [Google Scholar] [CrossRef] [PubMed]
- Williams, K.R.; Cavanagh, P.R. Relationship between distance running mechanics, running economy, and performance. J. Appl. Physiol. 1987, 63, 1236–1245. [Google Scholar] [CrossRef] [PubMed]
- Kyröläinen, H.; Belli, A.; Komi, P.V. Biomechanical factors affecting running economy. Med. Sci. Sports Exerc. 2001, 1330–1337. [Google Scholar] [CrossRef] [PubMed]
- De Ruiter, C.J.; Verdijk, P.W.L.; Werker, W.; Zuidema, M.J.; de Haan, A. Stride frequency in relation to oxygen consumption in experienced and novice runners. Eur. J. Sport Sci. 2014, 14, 251–258. [Google Scholar] [CrossRef] [PubMed]
- Hong, Y.; Wang, L.; Li, J.X.; Zhou, J.H. Comparison of plantar loads during treadmill and overground running. J. Sci. Med. Sport 2012, 15, 554–560. [Google Scholar] [CrossRef] [PubMed]
Figure 1.
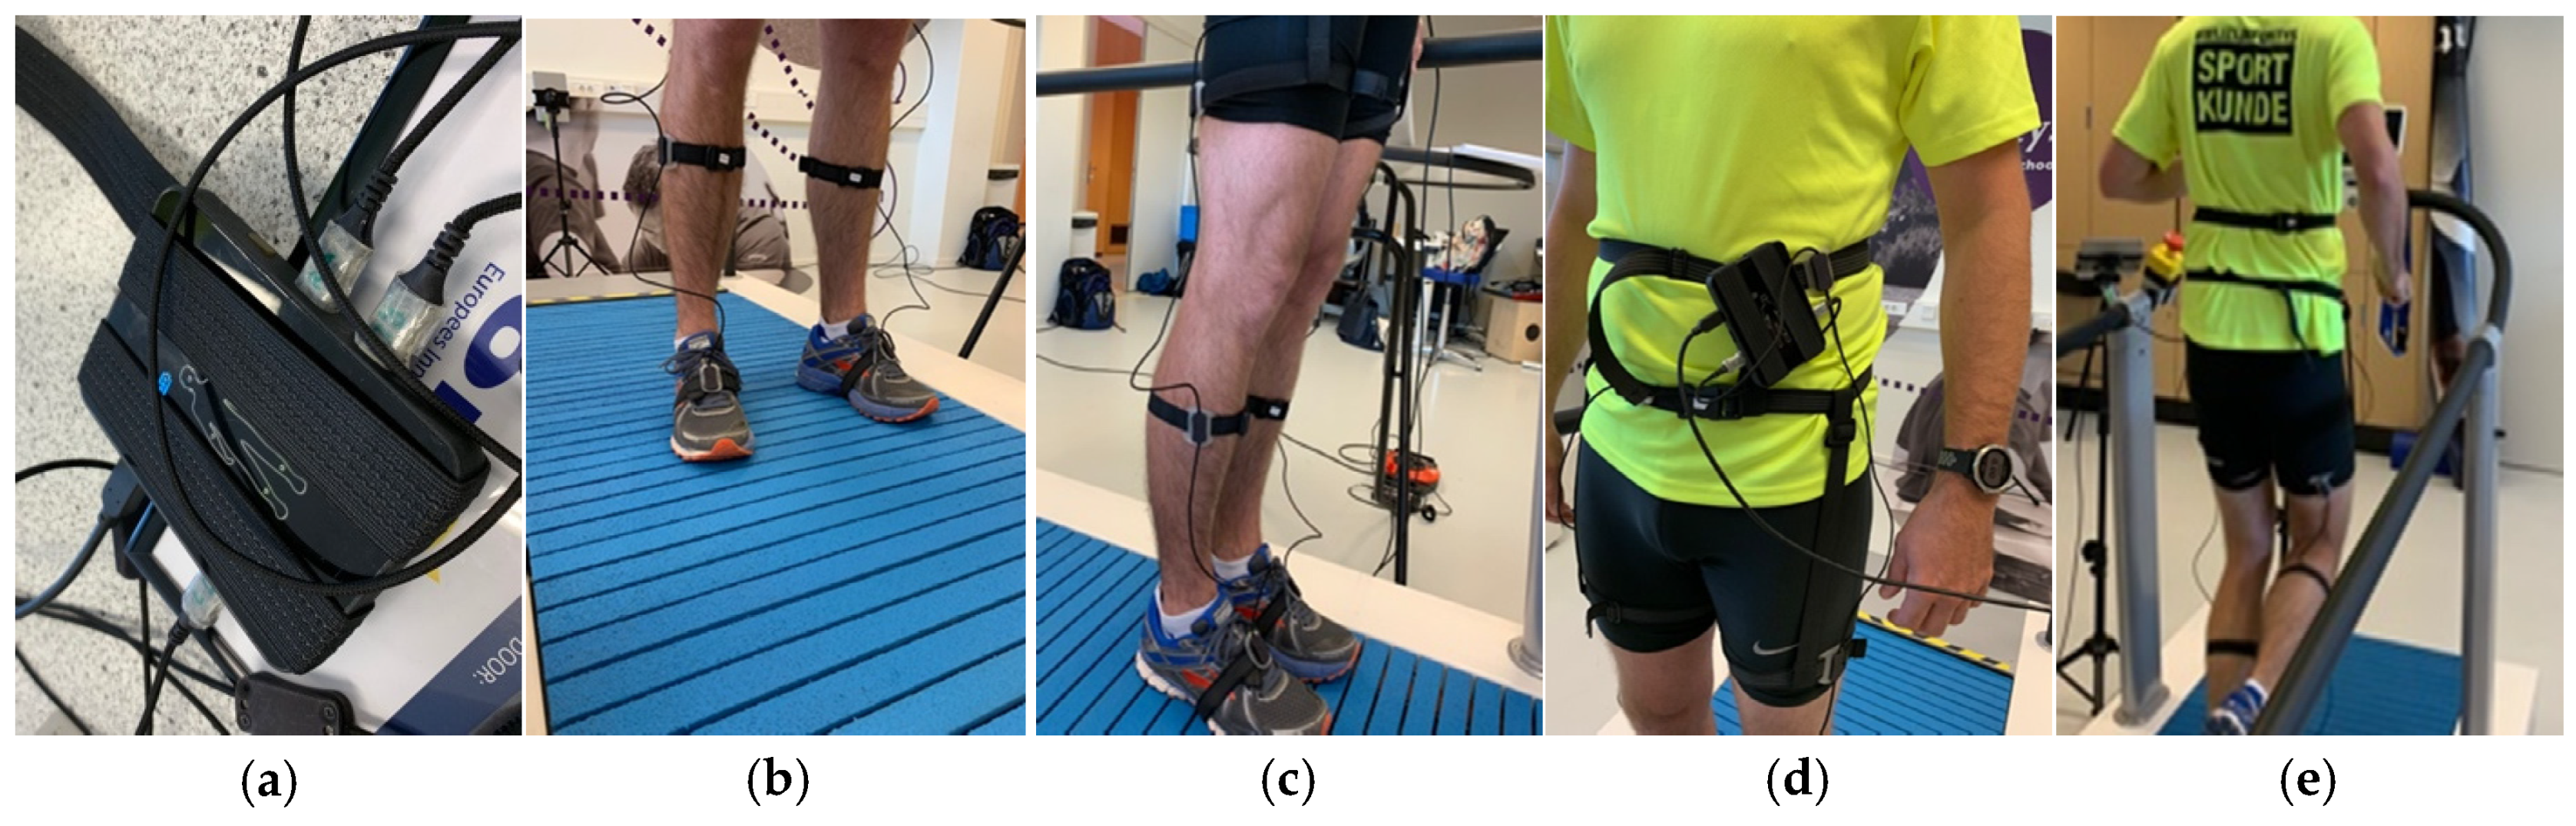
The Nodes sensor system with (a) the main unit, (b) the feet and shanks placed sensors and the iPad in the background, (c) the feet and shanks sensors from a lateral view, (d) the central unit attached to the runner, and (e) the runner during a trial.
Figure 1.
The Nodes sensor system with (a) the main unit, (b) the feet and shanks placed sensors and the iPad in the background, (c) the feet and shanks sensors from a lateral view, (d) the central unit attached to the runner, and (e) the runner during a trial.

Table 1.
The running technique key points explained, Evidence related to running economy and/or injury risk and measurement solutions as used in the research or running context.
Table 1.
The running technique key points explained, Evidence related to running economy and/or injury risk and measurement solutions as used in the research or running context.
| Key Point | Description | Evidence for Running | Measured with |
|---|---|---|---|
| Cadence | The number of steps per minute | Higher cadence relates to a lower injury rate [12,13]. | Wearable sensors |
| Impact force direction | Ground reaction force direction at impact | For the leg to handle the impact the best, the shin angle should be aligned with the ground reaction force vector [14]. | Force plate, or sensors on lower leg |
| Body angle | Lean of the torso related to the vertical vector | Forward body lean seems to have beneficial effects on running economy and may induce other factors as well [10,15]. | Wearable chest sensor |
| Knee extension | Angle between upper and lower leg measured at toe-off | Smaller angle improves running performance and economy, the foot gets a better swing phase [16]. | Two sensors, one on the lower and one on the upper leg |
| Minimal impact G | Impact force | Lower peak medial–lateral force [17], lower anterior–posterior braking force [18], and higher anterior–posterior propulsive force [16] are more economical | Wearable research prototypes. |
Table 2.
Results of the trials including the self-chosen cadence trial. Measured cadence, heart rate, and RPE scores are displayed in absolute values and normalized (norm) values with the standard deviation in between brackets.
Table 2.
Results of the trials including the self-chosen cadence trial. Measured cadence, heart rate, and RPE scores are displayed in absolute values and normalized (norm) values with the standard deviation in between brackets.
| Trial | Cadence (SPM) | Cadence (norm) | Heart Rate (BPM) | Heart Rate (norm) | RPE | RPE (norm) |
|---|---|---|---|---|---|---|
| T100%self | 165.1 (9.6) | 100.3% (1.7) | 142 (24) | 95.5% (2.5) | 5.6 (0.5) | 85.6% (8.0) |
| T92% | 152.3 (8.6) | 92.5% (0.9) | 150 (27) | 100.18% (2.2) | 7.0 (0.8) | 107.8% (13.4) |
| T96% | 158.3 (8.6) | 96.2% (0.4) | 149 (27) | 99.9% (1.0) | 6.6 (0.5) | 101.0% (8.0) |
| T100% | 164.6 (8.7) | 100.0 (0.4) | 148 (26) | 99.23% (0.9) | 6.3 (0.5) | 96.5% (4.0) |
| T104% | 170.4 (9.2) | 103.6% (0.6) | 149 (27) | 99.7% (1.1) | 6.4 (0.8) | 98.5% (7.9) |
| T108% | 177.3 (8.3) | 107.8% (1.0) | 151 (26) | 101.0% (1.6) | 6.3 (1.0) | 96.2% (10.4) |
Publisher’s Note: MDPI stays neutral with regard to jurisdictional claims in published maps and institutional affiliations. |
© 2020 by the authors. Licensee MDPI, Basel, Switzerland. This article is an open access article distributed under the terms and conditions of the Creative Commons Attribution (CC BY) license (https://creativecommons.org/licenses/by/4.0/).
Share and Cite
MDPI and ACS Style
Goudsmit, J.; Giudici, S.L.; Herweijer, J.; Vos, S. Measuring Running Workload and Key Points during Treadmill Running Using a Custom Build ‘Nodes’ System. Proceedings 2020, 49, 30. https://doi.org/10.3390/proceedings2020049030
AMA Style
Goudsmit J, Giudici SL, Herweijer J, Vos S. Measuring Running Workload and Key Points during Treadmill Running Using a Custom Build ‘Nodes’ System. Proceedings. 2020; 49(1):30. https://doi.org/10.3390/proceedings2020049030
Chicago/Turabian StyleGoudsmit, Jos, Stella Lo Giudici, Janine Herweijer, and Steven Vos. 2020. "Measuring Running Workload and Key Points during Treadmill Running Using a Custom Build ‘Nodes’ System" Proceedings 49, no. 1: 30. https://doi.org/10.3390/proceedings2020049030