The Coefficient of Friction of Soccer Balls †


1
Smart Products Engineering program, Centre for Design Innovation, Swinburne University of Technology, Melbourne, VIC 3122, Australia
2
Department of Mechanical and Automotive Engineering, School of Engineering, RMIT University, Melbourne, VIC 3083, Australia
*
Author to whom correspondence should be addressed.
†
Presented at the 13th Conference of the International Sports Engineering Association, Online, 22–26 June 2020.
Proceedings 2020, 49(1), 92; https://doi.org/10.3390/proceedings2020049092
Published: 15 June 2020
(This article belongs to the Proceedings of The 13th Conference of the International Sports Engineering Association)
Abstract
:Nine soccer balls were tested for their friction against a leather sheet, using a force plate. An average normal force of 63.6 N was applied and the movement of the ball had an average velocity of 15 mm/s. Each test was repeated 15 times and the average Coefficient of Friction (COF) was reported. The following results were obtained: Jabulani (COF: 0.62 ± 0.05); Fracas (COF: 0.41 ± 0.01); Ordem 3 (COF: 0.63 ± 0.02); Teamgeist (COF: 0.38 ± 0.01); Brazuca (COF: 0.45 ± 0.01); Kopanya (COF: 0.39 ± 0.01); React (COF: 0.37 ± 0.01); Finale 15 (COF: 0.39 ± 0.06); Vintage T-panel leather ball (COF: 0.41 ± 0.02). Overall, the COF of all balls tested ranged between 0.37 and 0.62. The Finale 15 ball showed a decreasing COF trend with repeated trials and the React ball produced pronounced slip-stick phenomenon.
1. Introduction
Friction between boot and ball plays an important role during the kicking action in soccer. Asai et al. [1] has shown the influence of this friction on the spin rate of the ball whereas Sterzing and Hennig [2] showed that the velocity of the ball is impacted by the same and they reported that the shoe material may reduce the velocity of the ball by up to 1.2%. Another study by Sterzing and Hennig [3] showed that the friction between boot and ball should neither be too high nor too low. However, the magnitudes of what is considered too high or too low were not defined. Others have attempted to model the foot to ball interaction, including mathematical models [4] and finite element models [5,6]. Nevertheless, these two approaches require the foot to ball Coefficient of Friction (COF) for any realistic modelling. However, the measure of the boot to ball friction is deceptively challenging and this is clearly reflected by the limited studies with regards to the COF that could be found. There are several factors affecting the COF during the boot to ball interaction, such as ball and boot materials, velocity and force of the kick, and external environmental influence such as the amount of moisture on the ball [7]. To measure the COF variations during an entire match is indeed a challenging task and there are no published studies on this. In a relevant study, Alaways and Krumenacker [8] used a load of approximately 12 N and speed of 0.16 mm/s under dry conditions, when the ball rubbed against leather and wood. The results showed that the COF obtained was in the range of 0.94 to 1.47 for leather, and 0.50 to 0.83 for wood. Although it gave us an indication of the COF, the values of the COF between leather and ball seems high as another study involving polyurethane, the material that modern soccer balls’ outer shell are usually made of [9], and skin, had a COF of 0.36 [10]. Thus, it would be invaluable to find if any of these results would be similar to our proposed study.
The aim of this study is to have a preliminary view of the COF of ball to leather contact under pre-defined parameters as a first step to developing a more comprehensive method of measuring COF variations in the future. To limit the factors affecting the COF, it was decided that, as a pilot study, we should only explore the COF of ball to leather contact with pre-defined parameters. This is the first part of a bigger study on boot-ball COF. The speeds and forces used in the experiments are too low compared to actual kicks as these experiments were conducted on a force plate with the aim of reproducing repeatable test conditions. However, they are used as references and some results of the second study (COF derived during kicking) are shown in the discussion section for comparison.
2. Materials and Methods
Seven FIFA official match balls and two generic balls were used in this study, namely, Jabulani (Adidas); Fracas (Adidas); Ordem 3 (Nike); Teamgeist (Adidas); Brazuca (Adidas); Kopanya (Adidas); React (Nike); Finale 15 (Adidas); Vintage T-panel leather ball (Mark Cross Co.) as seen in Figure 1a. The Jabulani, Teamgeist and Brazuca were used in the World Cup in 2010, 2006 and 2014 respectively. The Fracas ball was used in the Euro Cup 2016 and the Kopanya ball was used in the Confederations Cup 2009. The Ordem 3 is official match ball of Premier League 2015/2016 and Finale 15 is official match ball of Champions League 2015/2016. React is a generic soccer ball and the Mark Cross ball is a generic leather vintage ball. Out of the nine balls, only the Teamgeist and the React balls have smooth surface finishes and the rest are textured to varying extents.
For the test, a piece of leather, 300 × 300 mm, was clamped onto a force plate (Kistler Instruments, Winterthur, Switzerland). An open-top box was used to cover the top half of the ball such that a flat surface can be used to place a 10 kg mass on top of the ball. The ball, box and mass were then placed on the leather piece and pulled by hand to establish the rubbing action of the ball over the leather with a normal force applied onto the force plate by the mass as seen in Figure 1b. As the ball was pulled by the hands, inevitably, there was an upward force (z-direction) applied and thus the effective normal force applied onto the leather would be less than 98 N. It was ensured that there was no rolling of the ball on the leather but rather, a sliding action. The force plate measured the normal force in the z-direction, the friction force in –y-direction, and calculated the Centre of Pressure (COP) in –y-direction and the Coefficient of Friction (COF; ratio of friction force and normal force) at a sampling rate of 100 Hz. The recorded forces were less than the applied weight of the 10 kg mass as the pulling action by the hands reduces the force in the z-direction. This process was repeated 15 times for each ball, followed by calculating the average and standard deviation of the COF of each ball. To ensure that no polymer residue was left on the surface, the leather was cleaned each time with a small amount of alcohol before a different ball was used. The COF, COP, normal and friction forces were plotted against time. The significance of the difference in COF was tested with Kruskal–Wallis rank-sum test followed by two post hoc tests: Conover and Dunn, both of them adjusted by the Holm FWER (family-wise error rates) and Benjamini-Hochberg FDR (false discovery rate) methods.
3. Results
From the output of the force plate, the velocity of COP, the displacement of the COP, the COF, and normal and friction forces were plotted against time with a sample of the output from the Teamgeist ball shown in Figure 2. The velocity of COP and the normal force were plotted and compared to ensure that the conditions of the experiments were similar across all nine balls. The friction force was used to verify that a reasonable COF was obtained. The COF of interest was taken from the plateau phase (as shown in Figure 2 with dotted lines) of the COF variations during experiment. The average normal force applied, across all the balls, was 63.6 N and with an average velocity of the COP of 15 mm/s.
Figure 3 shows that the balls can be classified into two major COF ranges; one in the 0.6 range, represented by Jabulani and Ordem 3, with the rest of the balls falling into the 0.4 range. Overall, the mean COF is 0.4502 with SD of 0.0206. Jabulani and Finale 15 showed the greatest variation with SD of 0.0457 and 0.0590 respectively. Ordem 3 and Vintage ball had moderate variation with SD of 0.0188 and 0.0227. The rest had lower variations with an SD of less than 0.0104. Kruskal–Wallis rank-sum test, with α set at 0.05, was applied to compare the differences in the measured COF and it returned p < 0.0001. Subsequently, post hoc Conover and Dunn methods were applied, both of them adjusted by the FWER and FDR methods. As the Dunn method adjusted to FWER method is the most conservative, meaning that it returned the least number of significant differences amongst all the pairs of COF compared, we focused our analysis using this method. Dunn’s post hoc (FWER method) test showed that the Jabulani and Ordem 3 balls were most different in terms of the COF from the other balls, and the Vintage ball was most similar to the other balls, showing significant differences only to the Jabulani and Ordem 3 balls.
One interesting observation was made with regards to the Finale 15 ball. Figure 4a shows the COF of the Finale 15 ball when rubbed against the leather sheet plotted with respect to the test number and it seemed that the COF was decreasing with the number of tests. In order to check the repeatability of this result, the experiment was repeated a further 15 times after cleaning the surface and the data replotted as seen in Figure 4b. A Mann-Whitney U test was applied, and the resulting p-value was 0.2501, signifying that there was no significant difference. The result shows that the reduction of the COF of the Finale 15 was repeatable when the loading conditions remained similar.
Another observation that was made during the analyses of the data was that not all balls produced a smooth COF curve as seen in Figure 5a (Brazuca ball) where the average peak COF can be easily determined. On the contrary, one such ball, the Nike React ball, produced a more fluctuating peak COF, as seen in Figure 5b, due to the slip-stick phenomenon exhibited in the ball.
4. Discussion
The goal of this study was to compare the COF of a variety of soccer balls under fixed laboratory conditions. The range of COF of all nine balls tested was between 0.3271 and 0.6275. This contrasts with the range of COF reported by Alaways [8], which was 0.94 to 1.47. The relatively high COF may be due to the low applied force which was only approximately 12 N, which is at the beginning of the force weakening regime as described by Fuss [11]. Our result showed lower COF values, as our test at 63.6 N was further down the force weakening regime. In terms of the repeatability of the COFs produced, the SDs of the COF of the balls ranged between 0.0058 and 0.0590. This was in contrast to the study done by Cotton [7], where he did not report magnitudes of the SD but showed a plot with a much higher SD for the balls he tested. The statistical comparison showed that the Jabulani and Ordem 3 were significantly different from the rest of the balls and this could be seen from the relatively high COFs obtained for these two balls. The Vintage ball, on the other hand, was similar to all the other balls, except for Jabulani and Ordem 3.
One other observation made was that the COF of a soccer ball may not necessarily remain constant. Even in controlled laboratory conditions, the Finale 15 produced decreasing COFs after repeated trials. When the tests were repeated, the same results were obtained. For the React ball, the slip-stick phenomenon was observed. In our experimental setup, the velocity of the ball in the experiment was relatively low (0.015 m/s). The evidence that the behaviour of the COF of the React ball was in the velocity-strengthening regime as defined by Fuss [11] and seen in Figure 5d, comes from the fact that the low COF is associated with preceding decrease of COF and vice versa (Figure 5c). From Figure 5b, it can be seen that the increase in COF was more gradual (green arrow) until a COF was too great and the ball slowed down abruptly leading to a drop in COF (blue arrow). This accounts for the slip-stick phenomenon identified when the React ball rubbed against the leather. The corresponding blue and green arrows are shown in Figure 5d, showing the cycles of velocity increase and decrease during slip-stick. The magnitudes of the COFs are different between Figure 5b,d as different materials were used. This was in agreement with the findings by Fuss [11], that there are velocity strengthening and weakening of the COFs between different surfaces.
The limitations of the study are the absence of other environmental influence such as the amount of moisture present, and the low forces and velocities used in the experiment as compared to measured foot to ball contact impact of 2700 N [12] and ball velocity of 26.3 m/s [13], during shooting. There were no publications related to the velocity of the sliding COP, to the best of the authors’ knowledge. As friction is dependent on these factors, this study does not truly reflect actual playing conditions. Future works should include higher normal forces and velocities, with external influence such as wetted surfaces. By far, there had not been any literature on COF of boot to ball contact. A second ongoing study revealed preliminary results that the highest average COF calculated between boot and ball was 0.38 (47 kph, 11 rps), which was in range of most of the balls shown in Figure 3.
Acknowledgments
No funds were received for conducting this study, nor for covering the costs to publish in open access.
Conflicts of Interest
The authors declares no conflict of interest.
References
- Asai, T.; Carre, M.J.; Akatsuka, T.; Haake, S.J. The Curve Kick of a Football I: Impact with the Foot. Sport. Eng. 2002, 5, 183–192. [Google Scholar] [CrossRef]
- Sterzing, T.; Hennig, E.M. The Influence of Soccer Shoes on Kicking Velocity in Full-Instep Kicks. Exerc. Sport Sci. Rev. 2008, 36, 91–97. [Google Scholar] [CrossRef] [PubMed]
- Sterzing, T.; Hennig, E.M. The Influence of Friction Properties of Shoe Upper Materials on Kicking Velocity in Soccer. J. Biomech. 2007, 40, S195. [Google Scholar] [CrossRef]
- Stronge, W.J.; Ashcroft, A.D.C. Oblique Impact of Inflated Balls at Large Deflections. Int. J. Impact Eng. 2007, 34, 1003–1019. [Google Scholar] [CrossRef]
- Carre, M.J.; Asai, T.; Akatsuka, T.; Haake, S.J. The Curve Kick of a Football II: Flight through the Air. Sport. Eng. 2002, 5, 193–200. [Google Scholar] [CrossRef]
- Ishii, H.; Sakurai, Y.; Maruyama, T. Effect of Soccer Shoe Upper on Ball Behaviour in Curve Kicks. Sci. Rep. 2014, 4, 1–8. [Google Scholar] [CrossRef] [PubMed]
- Cotton, R.T. Surface Interactions of Soccer Balls. Ph.D. Thesis, Loughborough University, Loughborough, UK, 2008. [Google Scholar]
- Alaways, L.; Krumenacker, N. Determining Friction Coefficients for Round Balls by Using Center-of-Pressure. Procedia Eng. 2012, 34, 491–495. [Google Scholar] [CrossRef]
- Huybers, P. Soccer Ball Geometry, a Matter of Morphology. Int. J. Space Struct. 2007, 22, 151–160. [Google Scholar] [CrossRef]
- Vilhena, L.; Ramalho, A. Friction of Human Skin against Different Fabrics for Medical Use. Lubricants 2016, 4, 6. [Google Scholar] [CrossRef]
- Fuss, F.K. Friction of a Pimpled Rugby Ball Surface: Force and Velocity Weakening and Strengthening of the Coefficient of Friction. Proc. Inst. Mech. Eng. Part J J. Eng. Tribol. 2012, 226, 598–607. [Google Scholar] [CrossRef]
- Shinkai, H.; Nunome, H.; Isokawa, M.; Ikegami, Y. Ball Impact Dynamics of Instep Soccer Kicking. Med. Sci. Sports Exerc. 2009, 41, 889–897. [Google Scholar] [CrossRef] [PubMed]
- Nunome, H.; Lake, M.; Georgakis, A.; Stergioulas, L.K. Impact Phase Kinematics of Instep Kicking in Soccer. J. Sports Sci. 2006, 24, 11–22. [Google Scholar] [CrossRef]
Figure 1.
(a) The seven FIFA official match balls and two generic balls used for this study from right to left and up to down: Jabulani; Fracas; Ordem 3; Teamgeist; Brazuca; Kopanya; React; Finale 15; Vintage T-panel leather ball; (b) test set up with 10 kg mass on the ball, placed on a leather sheet on top of a force plate.
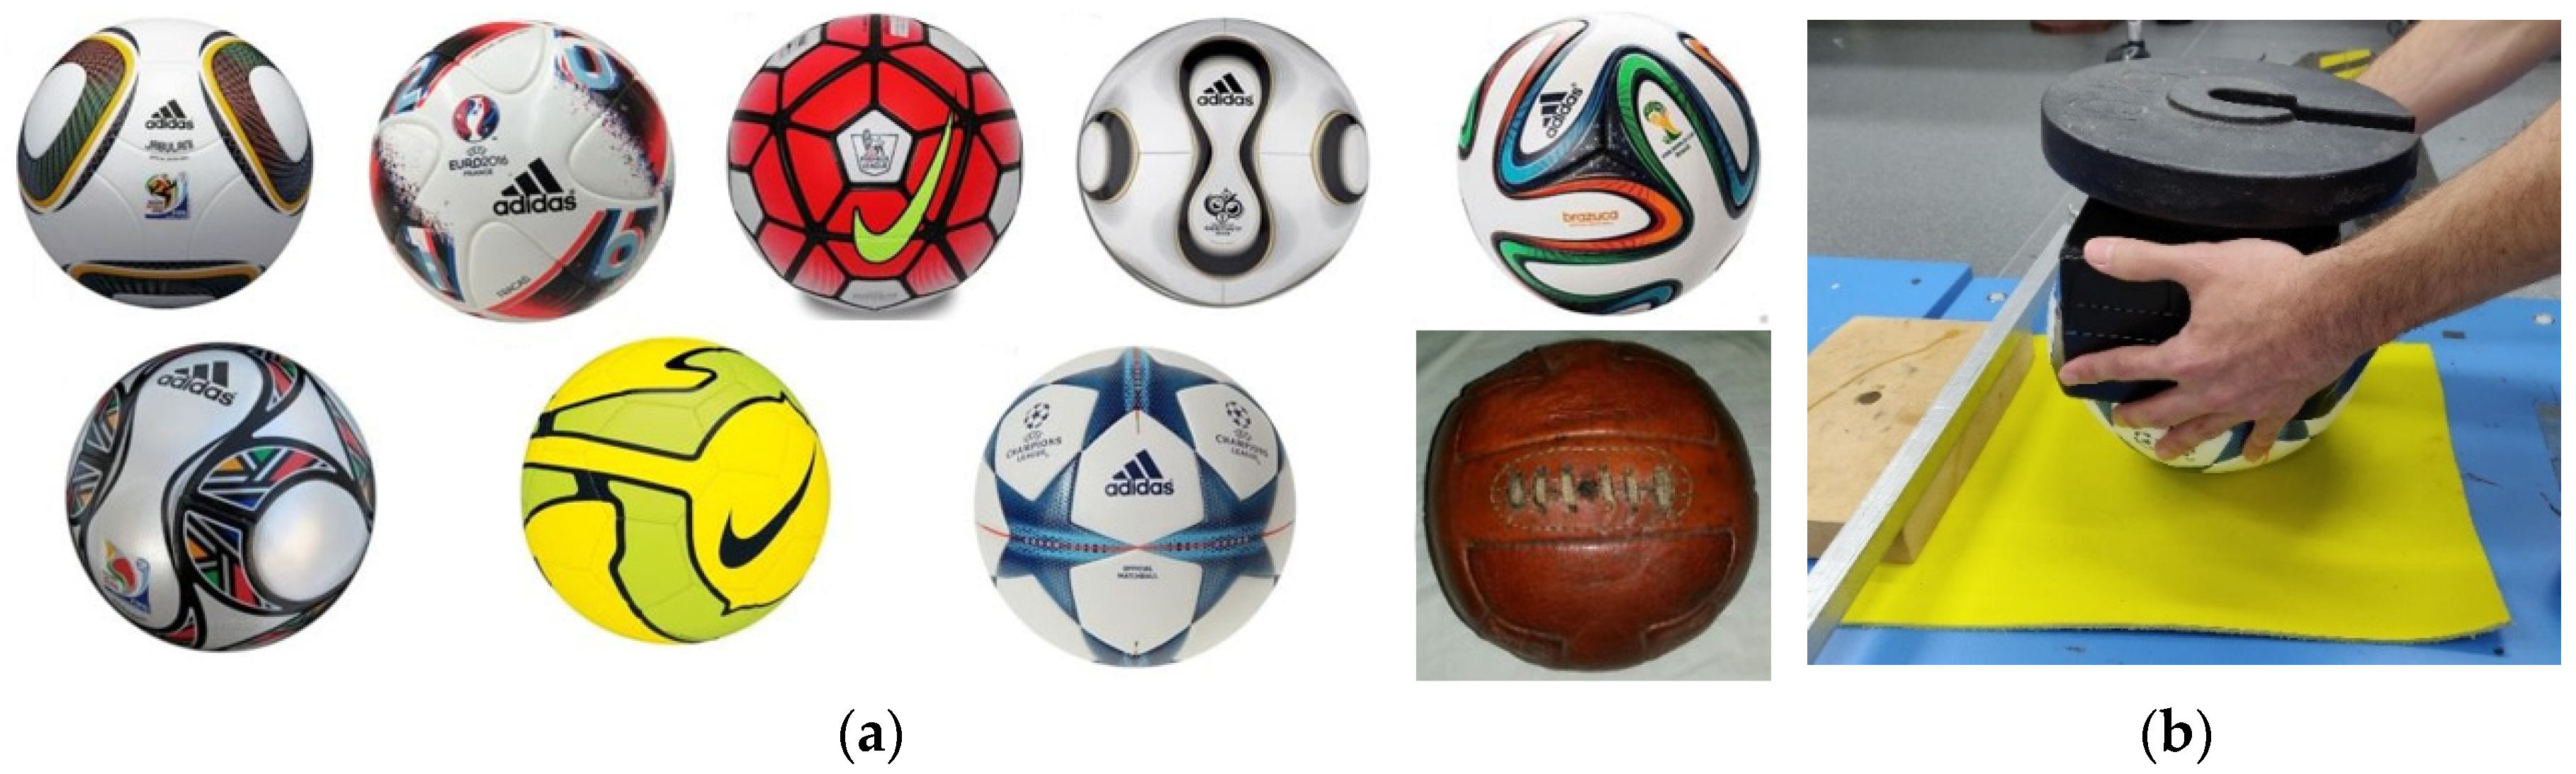
Figure 2.
Sample data output of the velocity of Centre of Pressure (COP), Coefficient of Friction (COF), displacement of COP, friction (Ff) and normal force (Fn) data plotted against time for the Teamgeist ball.
Figure 2.
Sample data output of the velocity of Centre of Pressure (COP), Coefficient of Friction (COF), displacement of COP, friction (Ff) and normal force (Fn) data plotted against time for the Teamgeist ball.
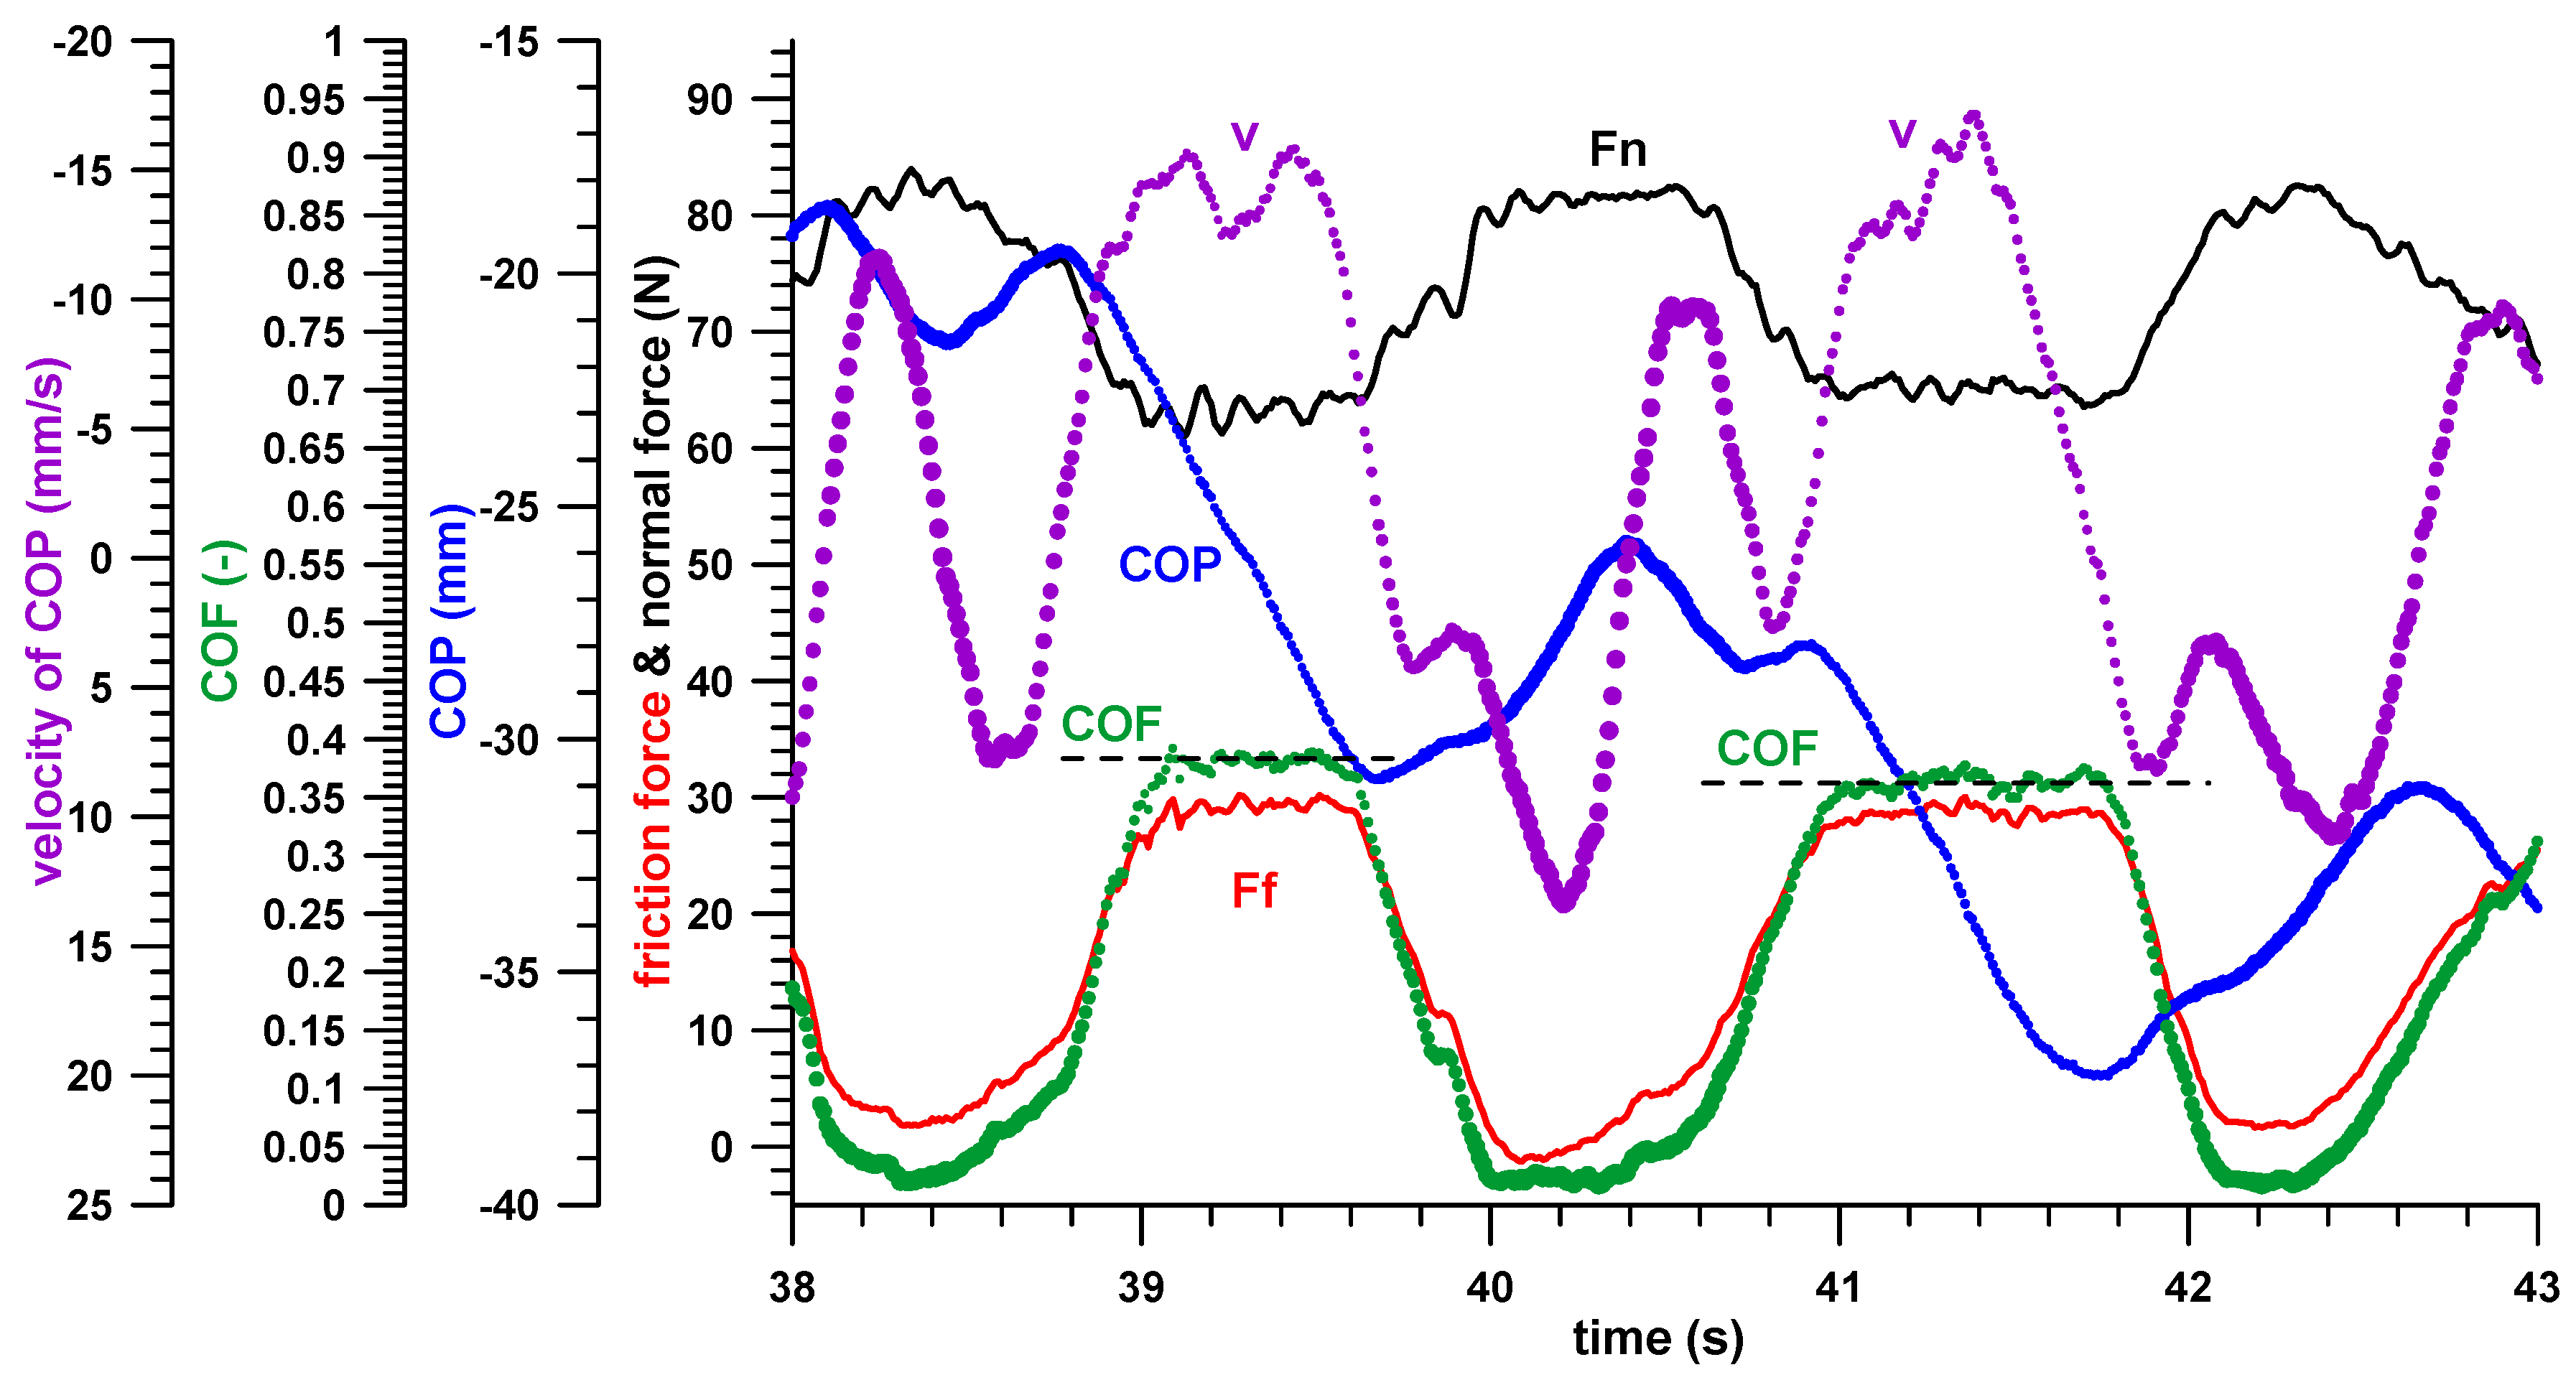
Figure 3.
Box and Whisker plots for the COFs of all the balls tested.

Figure 4.
(a) Variation of the COF of the Finale 15 ball after the first set of experiments and (b) after the second set of experiments.
Figure 4.
(a) Variation of the COF of the Finale 15 ball after the first set of experiments and (b) after the second set of experiments.
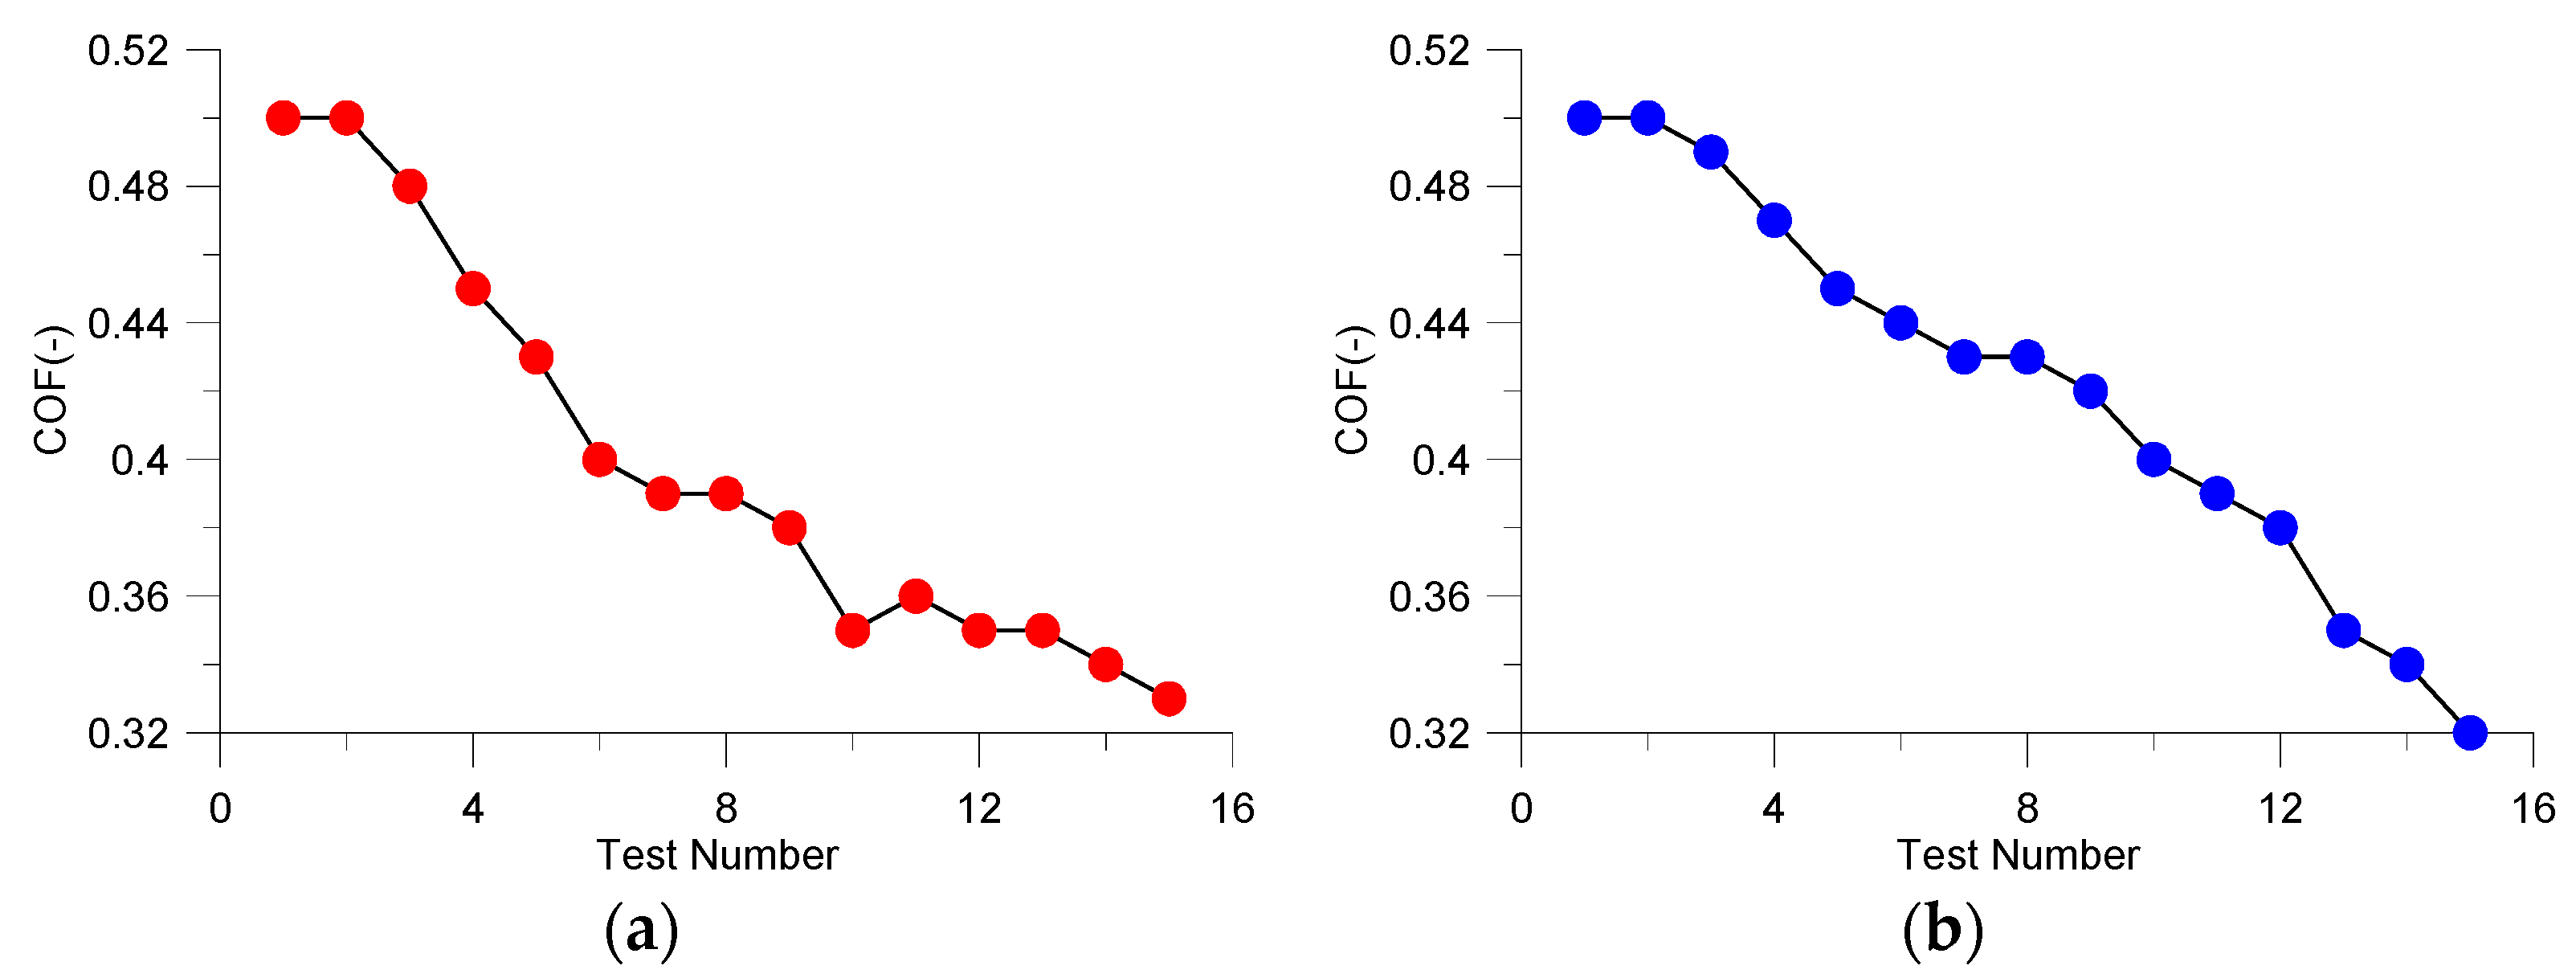
Figure 5.
(a) A smoother COF curve produced by the Brazuca ball; (b) a fluctuating COF curve (stick-slip phenomenon) produced by the React ball; note that the drop in COF is more sudden than its increase; note that (a) and (b) have the same scale for ease of comparison. (c) React ball—COF rate vs. COF; note that low COF occurs after decrease in COF and vice versa; (d) COF vs. sliding speed between natural rubber and finger (data from Fuss [11]; force 6–8 N); note that the transition from velocity strengthening to weakening in the shown dataset occurred at 0.15 m/s whereas the COP speed for measuring soccer ball friction in our experiments was 0.015 m/s (15 mm/s; cf. Figure 2).

Publisher’s Note: MDPI stays neutral with regard to jurisdictional claims in published maps and institutional affiliations. |
© 2020 by the authors. Licensee MDPI, Basel, Switzerland. This article is an open access article distributed under the terms and conditions of the Creative Commons Attribution (CC BY) license (https://creativecommons.org/licenses/by/4.0/).
Share and Cite
MDPI and ACS Style
Tan, A.M.; Weizman, Y.; Alam, F.; Fuss, F.K. The Coefficient of Friction of Soccer Balls. Proceedings 2020, 49, 92. https://doi.org/10.3390/proceedings2020049092
AMA Style
Tan AM, Weizman Y, Alam F, Fuss FK. The Coefficient of Friction of Soccer Balls. Proceedings. 2020; 49(1):92. https://doi.org/10.3390/proceedings2020049092
Chicago/Turabian StyleTan, Adin Ming, Yehuda Weizman, Firoz Alam, and Franz Konstantin Fuss. 2020. "The Coefficient of Friction of Soccer Balls" Proceedings 49, no. 1: 92. https://doi.org/10.3390/proceedings2020049092