
Ecohydrological Analysis in Watersheds of Mountain Areas of São Paulo State Coastal, Brazil †


1
Communication and Society Research Centre, Department of Geography, University of Minho, 4800-058 Guimarães, Portugal
2
Department of Geography, Geosciences Institute, State University of Campinas, Campinas 13083-855, Brazil
*
Author to whom correspondence should be addressed.
†
Presented at the 4th International Electronic Conference on Geosciences, 1–15 December 2022; Available online: https://sciforum.net/event/IECG2022 .
Proceedings 2023, 87(1), 32; https://doi.org/10.3390/IECG2022-13864
Published: 16 December 2022
(This article belongs to the Proceedings of The 4th International Electronic Conference on Geosciences)
Abstract
:In the Brazilian state of São Paulo, the coastal municipalities have watersheds in mountains with active relief evolution (Serra do Mar). The coastal regions are more vulnerable to flooding and landslides. A large number of people live on the slopes of Serra do Mar; these places are more vulnerable to landslides, which cause biodiversity loss and damage to human and natural environments. This study seeks to present an ecohydrological analysis to categorize coastal watersheds into clusters, considering the spatial characteristics of NDVI, DTM, soil depth, climate, and Soil Organic Carbon (SOC), and identify areas’ susceptibility to landslides in the coastal watersheds of the State of São Paulo. The results show that vegetation cannot prevent landslides from happening on its own. The higher altitude regions, where the tropical forest is still present, are those most prone to landslides, designated as cluster 2.
1. Introduction
The intersection of ecological and hydrological processes is the subject of ecohydrology research [1,2]. Ecohydrology takes a systematic approach, since there is a relationship between various components that leads to an integrated conclusion, after taking into account methodological considerations that arise from the two scientific domains (hydrology and ecology) [3]. The analysis of the effects of hydrological processes on the composition and operation of ecosystems is a multidisciplinary field.
The development of quantitative models to evaluate environmental conditions provides the basis for the development of ecohydrological researches. The models investigate how biological and hydrological processes interact at the watershed level [4,5,6]. However, it is possible to assume that geomorphological and hydrological processes are directly connected, and that any suggestion for an ecohydrological model must take this into account [1,2,4].
The study by Band et al. [4] integrates ecohydrological and geomorphological processes, modelling the relationship between water, carbon, and nutrients in their interaction with the stability of rough terrains, helping to weight the levels of stability of different parts of a watershed.
Proposing an ecohydrological model aimed at mountainous areas has two main objectives: (1) to understand the influence of vegetation on the stabilization of slopes and its importance in carbon sequestration; (2) to understand that watersheds in mountainous areas provide a diversity of ecosystem services on a regional and global scale, including quality and quantity of water and regulation of the hydrological cycle and regional climate.
Given these two goals, it is essential to understand the structure and spatial distribution of the vegetation cover when analyzing how it affects landslide processes. The territorial unit watershed is the best measurement for this [4].
2. Materials and Methods
There were four stages in the development of the ecohydrological analysis for the coast of the state of São Paulo (Figure 2):
The steps of the research were developed using the SIG ArcGIS®, version 10.5. In the rescheduling process, performed using the Rescale by function tool, all variables were classified on a scale from 1 to 10. Then, the ecohydrological analysis considered the sum of the variables:
- -
- Normalized Difference Vegetation Index (NDVI): using LANDSAT image from 2016 available in the United States Geological Survey (USGS). The NDVI has been used in ecohydrological assessments in previous research [4,5,6]. Because the NDVI is a satellite with a medium spatial resolution and is appropriate for research on a regional scale, we used it in our study [7,8,9]. The images were processed using the ArcGIS Raster Calculator tool, and were then used to generate NDVI images;
- -
- Digital terrain model (DTM): topographic maps from Brazilian Institute of Geography and Statistics (IBGE, Portuguese acronym) and the Topo to Raster interpolation tool were used in ArcGIS [10];
- -
The soil depth is related to the slope of the terrain, an important variable in the identification of landslide susceptibility areas. We attributed weight 10 to shallow soils that occur on slopes above 30°, predominantly in the mountains (Serra do Mar) and weights 3.5 and 1 to deep and very deep soils with slopes below 15°, predominantly in the coastal flat;
- -
- Climate data: data from average of total annual precipitation from 2006 to 2015 (source: National Water Agency—ANA, Portuguese acronym) and average of temperature from 2006 to 2015 (source: National Institute for Space Research—INPE, Portuguese acronym) interpolated using the IDW tool;
- -
The next step was the weighted sum based on the SOC mapping, from 0 to 5 cm, 5 to 15 cm, and 15 to 30 cm, using the Weighted Sum tool. The following classes of models were produced as a result of dividing this phase into equal weight assignments (value 1) for each variable entered and the sum of variables: very low, low, medium, high, and very high.
The statistical study of watersheds was the next phase, which determined the relationship between the variables SOC 0–5 cm, SOC 5–15 cm, SOC 15–30, DTM, NDVI, precipitation, temperature, soil depth, and the occurrence of landslides in watersheds. After this, we calculated the cluster analysis, using the packages ggcorplot and factoextra in RStudio.
3. Results and Discussion
Figure 3 shows the association between the variables under study:
Between the three SOC levels and between soil depth and SOC 0–5 and 5–15 cm, there is a correlation greater than 0.75. Between the three levels of SOC, DTM, and NDVI—soil depth, SOC 15–30 cm (0.69), and NDVI (0.59)—correlations between 0.5 and 0.75 are seen. Among the variables considered, these had the highest positive correlation.
The watershed’s input factors were evaluated, and it was found that 87.25% of the watershed had NDVI concentration values above 0.7, which indicated a high density of biomass and vegetative cover.
Regarding elevations, the coastal plain and the mountain region are separated by 30 m in elevation [15]. A total of 93.13 percent of the watershed is located in the mountains, with a high slope and landslide risk, and 6.86 percent of the sub-basins are located in the coastal plain.
In terms of soil depth, 63.72 percent of the watershed’s soils are shallow or shallower, and they are spatially concentrated in mountainous places with sloping terrain and a history of landslides. These soils are more common along the north coast and in the Baixada Santista communities of Cubatão and São Vicente.
The range of the average temperature is from 15.18 °C to 45.72 °C. The watershed in the south coast has the highest temperatures, whereas the north coast and the Baixada Santista have milder temperatures. Lower temperatures are associated with watersheds that are more susceptible to landslides. The distribution of precipitation included in this analysis ranged from 1193.71 mm to 3421.11 mm, with a concentration of volumes in the watersheds of Cubatão, São Vicente, Santos, and Guarujá in Baixada Santista, as well as in the north of the municipality, in Ubatuba.
The SOC 0 to 5 cm has an average variation of 22.62 to 24.80 g/kg, with the Serra do Mar de Cubatão and Ilhabela having the highest concentrations of values. The concentration varies from 11.62 to 56.58 g/kg between 5 and 15 cm, with high values being found in the Cubatão and Ilhabela. Between 2.03 and 38.76 g/kg of carbon are in the soil at depths of 15 to 30 cm, with greater concentrations observed in Baixada Santista and the north coast.
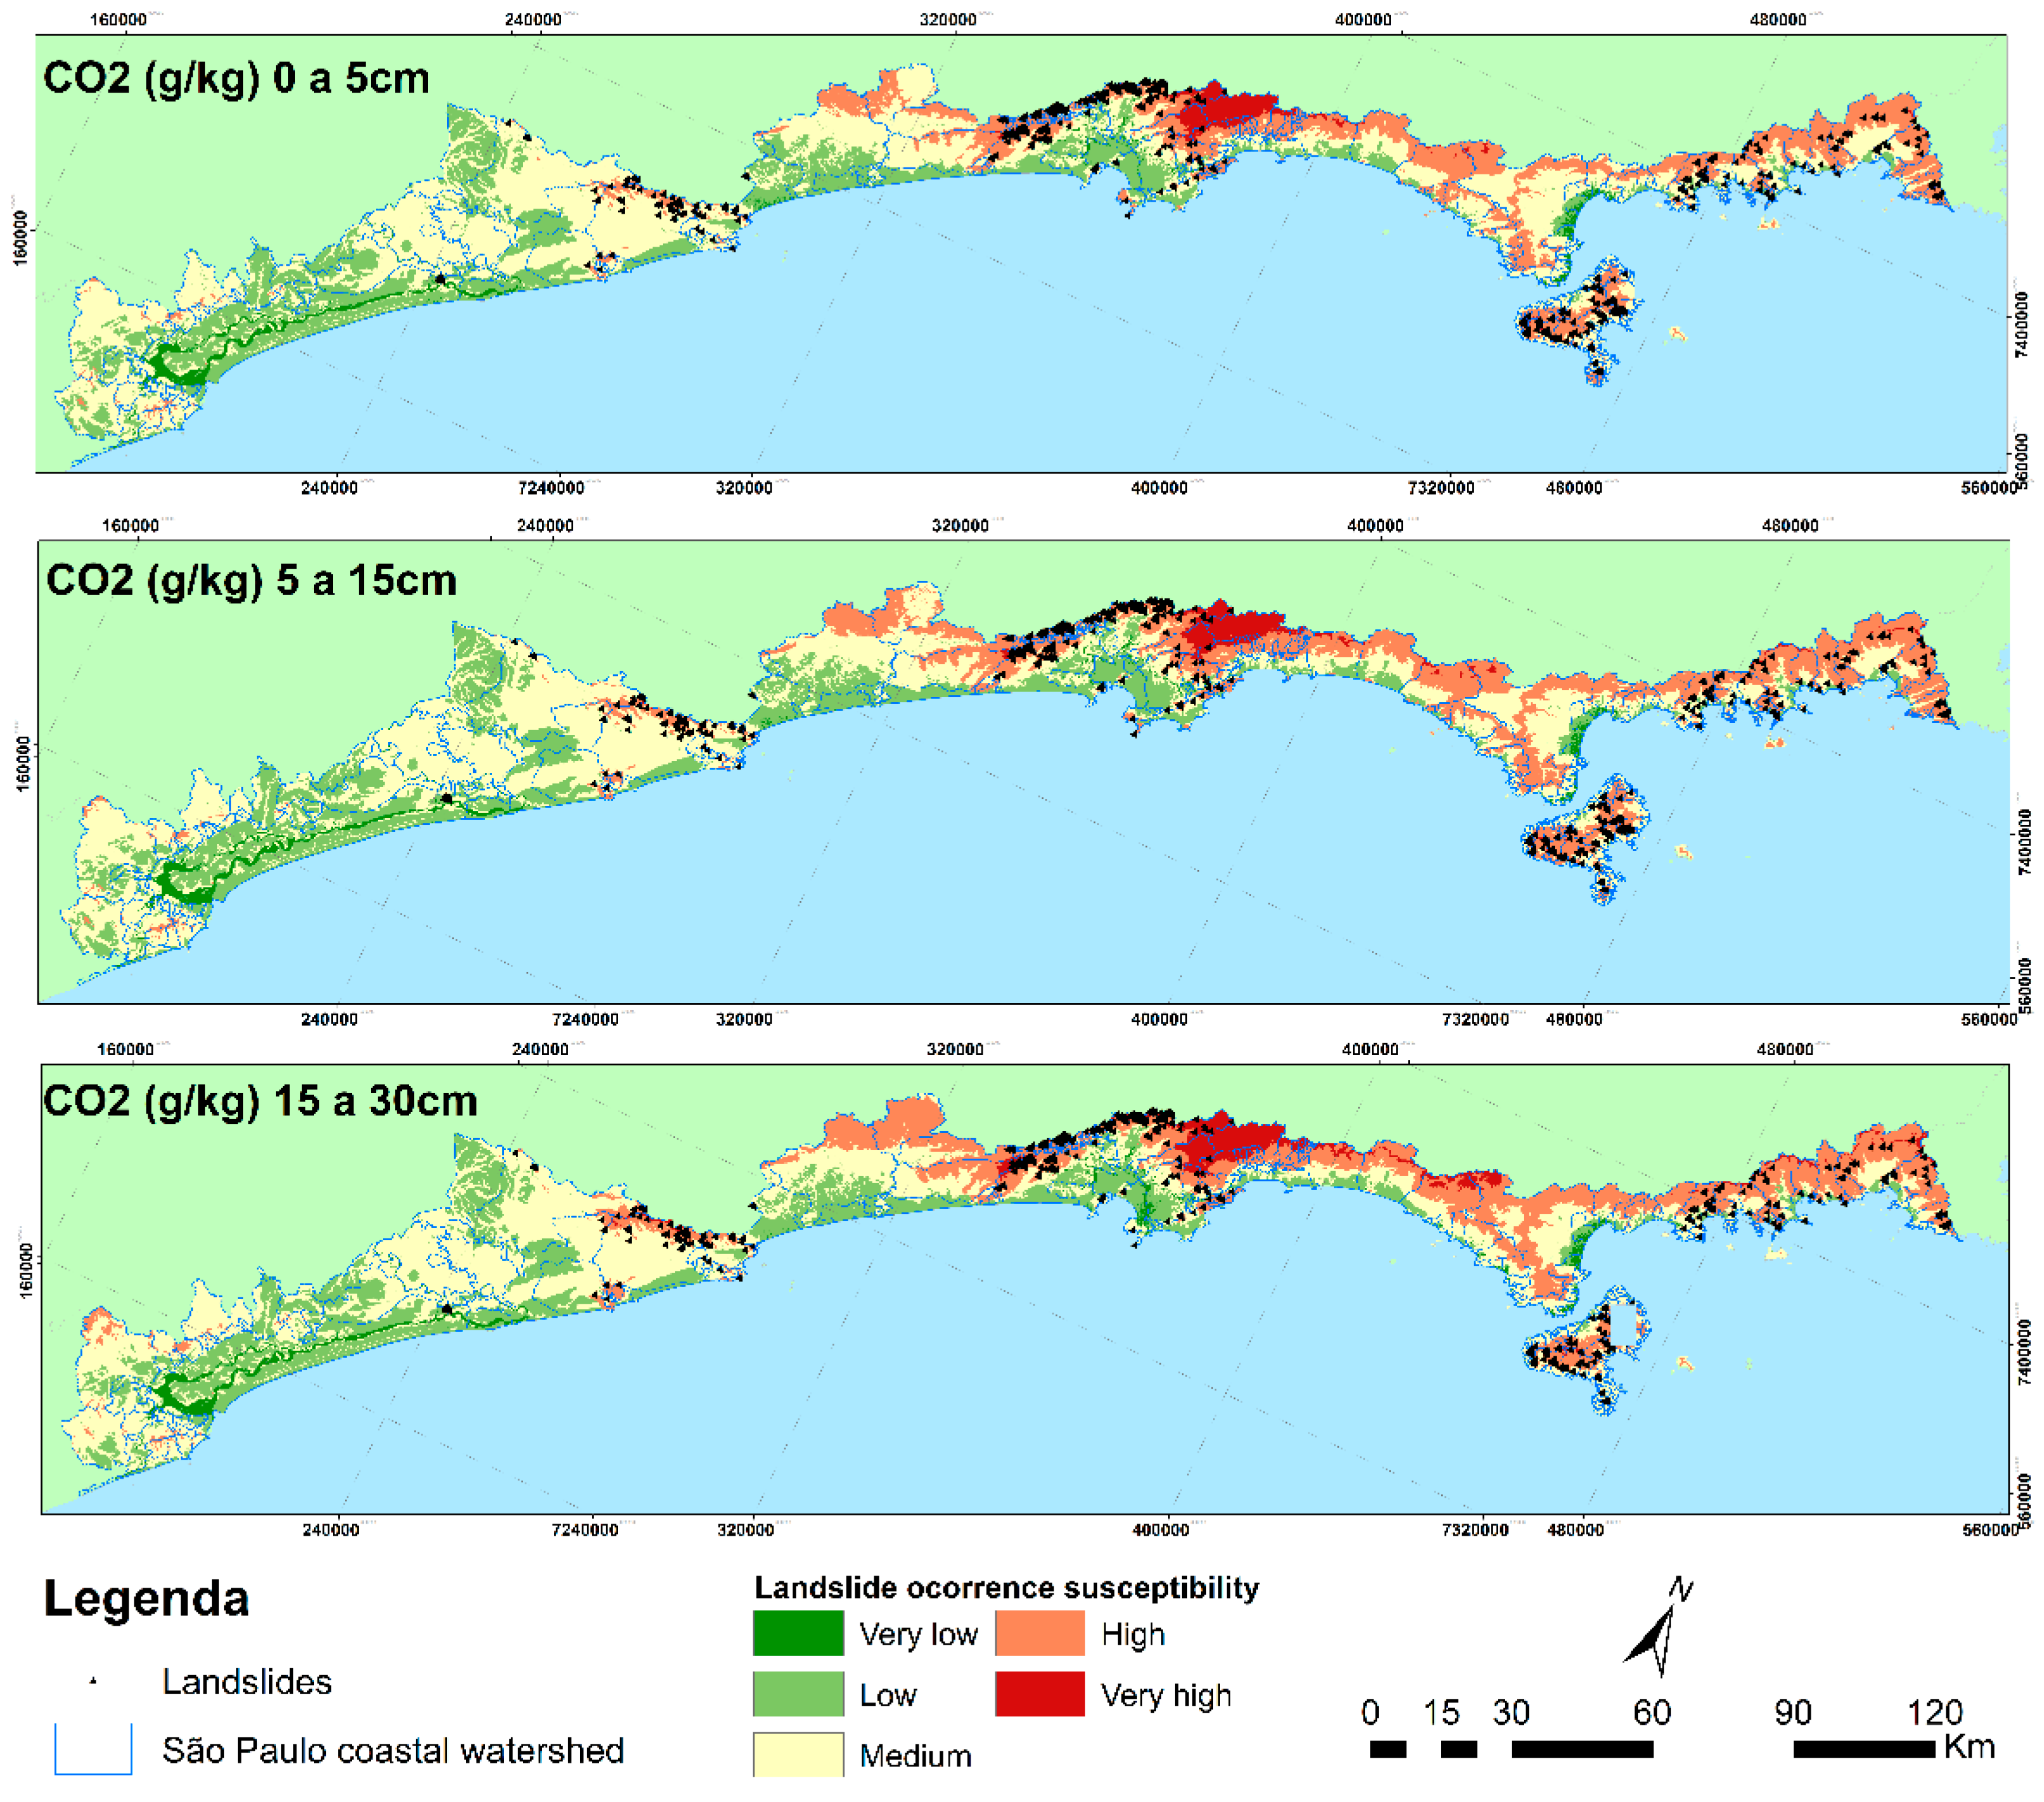
In the scenarios of the ecohydrological analysis, the areas with a high or very high susceptibility of landslides occurring correspond to 24.06% of the total area of the São Paulo Coast for the 0 to 5 cm scenario, 27.04% for the 5 to 15 cm scenario, and 29.47% for the 15 to 30 cm scenario (Figure 4 and Table 3).
The distribution of watersheds with the occurrence of landslide is: in the south coastal zone, in the municipalities of Peruíbe and Iguape, with 30 records of landslides; Baixada Santista, in the municipalities of Santos, São Vicente, Cubatão, and Praia Grande with 82 records, this high number is related to a large number of occupations in risk areas; on the north coast, Caraguatatuba, Ubatuba, and Ilhabela, with 20 records.
Among these ecohydrological scenarios, the north coast has the largest area that is susceptible to landslides, with 50% of the total. The Baixada Santista has 42.43% of its area with a susceptibility to landslides. On the south coast, a susceptible area of 5.14% is bordered by Baixada Santista in the municipalities of Peruíbe and Iguape. The other 2.43% is located in other municipalities on the south coast.
After elaborating on the scenarios for the ecohydrological analysis, we performed a cluster analysis of the average values of the variables by watersheds (Figure 5 and Figure 6 and Table 4).
Clusters 1 and 4 have the lowest altitudes, with an average of 88.53 m (cluster 1) and 49.45 m (cluster 4). This variable indicates that the watersheds are located in the coastal plain, isolated hills, or lower slopes of the Serra do Mar. This can be confirmed with the lowest SOC values, with values between 22.85–23.84 g/kg in cluster 1 and 19.39–20.2 g/kg in cluster 4. In addition, this cluster has a concentration of very deep soils > 200 cm, the default depth in coastal plain areas. Cluster 1 registers the second highest occurrence of landslides; these data are related to the high levels of human occupation on the low slopes of the Serra do Mar, concentrating neighborhoods with high population density, whereas cluster 4 watersheds are typically in areas without human occupation.
Cluster 2, with 143 watersheds, has the highest number of landslides recorded, occurring in 46 watersheds. This cluster also has the highest average SOC, between 29 and 30.7 g/kg, in addition to the highest average altitude, being 358.56 m in all watersheds of the cluster and 418.32 m in the wLr basins. The average NDVI is 0.85 in all watersheds of the cluster and 0.84 in the wLr watersheds. The climatic data show that this cluster is not the one with the highest volume of precipitation, registering 1654.50 mm in all watersheds and 1562.00 mm in the wLr watersheds. At the temperature cluster 2, we recorded an average of 23.17 °C in all watersheds, and in the wLr basins an average of 22.95 °C. In terms of climate variables, cluster 2 is very similar to cluster 4. In terms of its soil depth, cluster 2 registers a value of 8.2 in all basins (including wLr); this value demonstrates that shallow soils of 50 to 100 cm increase the occurrence of landslides.
Cluster 3 has the second highest average SOC, with a minimum value of 25.4 g/kg in all watersheds and a maximum of 26.5 g/kg in wLr, with carbon concentrated in the first 5 cm of the soil (SOC 0–5 cm) in this class. Altitude values are 160.64 m in all watersheds and 218.60 m in watersheds with landslides. The NDVI values are high, 0.83, as well as the depth of the shallow soils of 50 to 100 cm, similar to cluster 2. As for the climatic data, cluster 3 registers the lowest values, with average precipitation of 1414.24 mm and an average temperature of 22.9 °C.
4. Conclusions
As measured by the NDVI, there are high levels of dense vegetation within the research region, since the examined area is primarily made up of Atlantic Forest, which is insufficient to reduce the incidence of landslides.
The examined results show that SOC concentration rises as depth increases. Shallow soils are more prevalent in regions where landslides are very likely to occur. Landslides in the watershed are also more common at higher elevations and on slopes. We found that 103 basins out of a total of 719 register at least one landslide, or 14.32%.
The cluster analysis classified the watersheds most susceptible to landslides as cluster 2. The concentration of the highest SOC values in these watersheds suggests that landslides may have a role in the atmospheric release of carbon dioxide. They also concentrate the highest NDVI values; however, clusters 1 and 3 also have high NDVI values due to the study area’s predominant Atlantic Forest vegetation, while cluster 4 has lower NDVI values due to the predominance of watersheds in the coastal plain, which is where the urban areas, exposed soil, and sparse vegetation are concentrated. The indicator that shows how often landslides occur on the steep slopes of the Serra do Mar, where relatively shallow soils prevail, is altitude above 350 m (values of 8.2).
Author Contributions
Conceptualization, S.F.; methodology, software, validation, and formal analysis, S.F.; investigation; resources, S.F. and R.C.d.O.; data curation and writing—original draft preparation, S.F.; writing—review and editing, A.V.; visualization and supervision, R.C.d.O. All authors have read and agreed to the published version of the manuscript.
Funding
This research was funded by Higher Education Personnel Improvement Coordination, Finance Code 001, grant number 88882.180275/2018-01.
Institutional Review Board Statement
Not applicable.
Informed Consent Statement
Not applicable.
Data Availability Statement
United States Geological Survey (USGS), Brazilian Institute of Geography and Statistics (IBGE, Portuguese acronym), National Water Agency (ANA, Portuguese acronym), National Institute for Space Research (INPE, Portuguese acronym).
Conflicts of Interest
The authors declare no conflict of interest.
References
- Dunbar, M.J.; Acreman, M.C. Applied Hidro-Ecological Science for Twenty-First Century. In Hydro-Ecology: Linking Hydrology and Aquatic Ecology; Acreman, M.C., Ed.; IAHS Publication n 266; IAHS Press: Wallingford, UK, 2001; pp. 1–17. [Google Scholar]
- Zalewski, M.; Robarts, R. Ecohydrology—A New Paradigm for Integrated Water Resources Management. Sil News 2003, 40, 1–5. [Google Scholar]
- Bonell, M. Ecohydrology—A Completely New Ideia? Hydrol. Sci. J. 2002, 809–810. [Google Scholar] [CrossRef]
- Band, L.E.; Hwang, T.; Hales, T.C.; Vose, J.; Ford, C. Ecosystem Processes at the Watershed Scale: Mapping and Modeling Ecohydrological Controls of Landslides. Geomorphology 2012, 137, 159–167. [Google Scholar] [CrossRef]
- Zhang, S.; Ye, Z.; Chen, Y.; Xu, Y. Vegetation Responses to an Ecological Water Conveyance Project in the Lower Reaches of the Heihe River Basin. Ecohydrology 2017, 10, e1866. [Google Scholar] [CrossRef]
- Ruiz-Pérez, G.; Koch, J.; Manfreda, S.; Caylor, K.; Francés, F. Calibration of a parsimonious distributed ecohydrological daily model in a data-scarce basin by exclusively using the spatio-temporal variation of NDVI. Hydrol. Earth Syst. Sci. 2017, 21, 6235–6251. [Google Scholar] [CrossRef]
- Sánchez, J.M.; Scavone, G.; Caselles, V.; Valor, E.; Copertino, V.A.; Telesca, V. Monitoring Daily Evapotranspiration at a Regional Scale from Landsat-TM and ETM+ Data: Application to the Basilicata Region. J. Hydrol. 2008, 351, 58–70. [Google Scholar] [CrossRef]
- Xu, D.; Kang, X.; Qiu, D.; Zhuang, D.; Pan, J. Quantitative Assessment of Desertification Using Landsat Data on a Regional Scale—A Case Study in the Ordos Plateau, China. Sensors 2009, 9, 1738. [Google Scholar] [CrossRef] [PubMed]
- Kloiber, S.M.; Brezonik, P.L.; Bauer, M.E. Application of Landsat Imagery to Regional-Scale Assessments of Lake Clarity. Water Res. 2002, 36, 4330–4340. [Google Scholar] [CrossRef] [PubMed]
- Christofoletti, A.; Perez Filho, A.P. Estudos Sobre a Forma de Bacias Hidrográficas. Bol. Geogr. Teorética 1975, 5, 63–82. [Google Scholar]
- Rossi, M. (Ed.) Mapa Pedológico Do Estado de São Paulo: Revisado e Ampliado; Secretaria do Meio Ambiente, Instituto Florestal: São Paulo, Brazil, 2017. [Google Scholar]
- Vasques, G.M.; Coelho, M.R.; Dart, R.O.; Cintra, L.C.; Baca, J.F.M.; MendonçaSantos, M.L. Soil Organic Carbon Stock Maps for Brazil at 0–5, 5–15, 15–30, 30–60, 60–100 and 100–200 cm Depth Intervals with 90 m Spatial Resolution. Version 2021. Embrapa Solos, Rio de Janeiro, Brazil. 2021. Available online: http://geoinfo.cnps.embrapa.br/documents/3275 (accessed on 30 May 2022).
- Horn, R. Aggregate Characterization as Compared to Soil Bulk Properties. Soil Tillage Res. 1990, 17, 265–289. [Google Scholar] [CrossRef]
- Soane, B.D. The Role of Organic Matter in Soil Compactability: A Review of Some Practical Aspects. Soil Tillage Res. 1990, 16, 179–201. [Google Scholar] [CrossRef]
- Ab’Saber, A.A.; Ab’Saber, A.A. Contribuição à Geomorfologia Do Litoral Paulista. Rev. Bras. Geogr. 1955, 17, 3–48. [Google Scholar]
Figure 1.
Study area.

Figure 2.
Study steps.

Figure 3.
Correlation matrix.
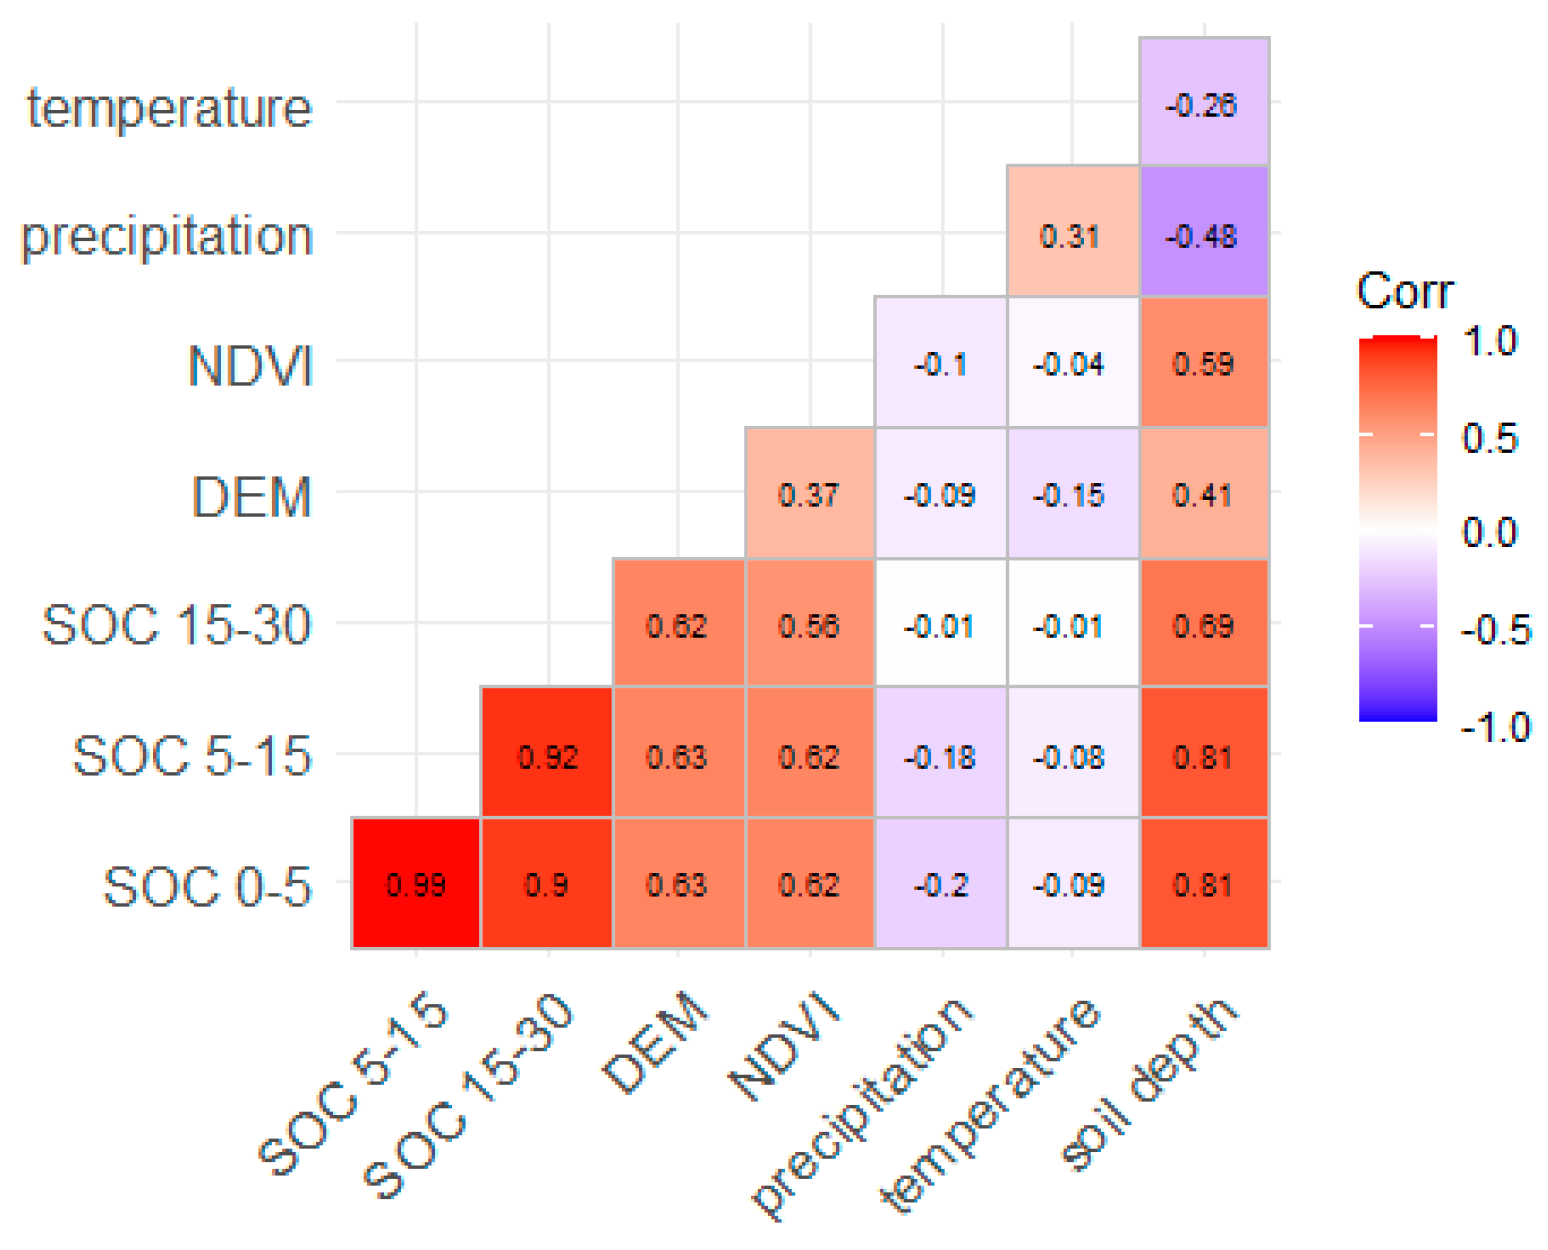
Figure 4.
Scenarios of the ecohydrological analysis. Source: The authors.
Figure 5.
Watershed clusters. Source: The authors.
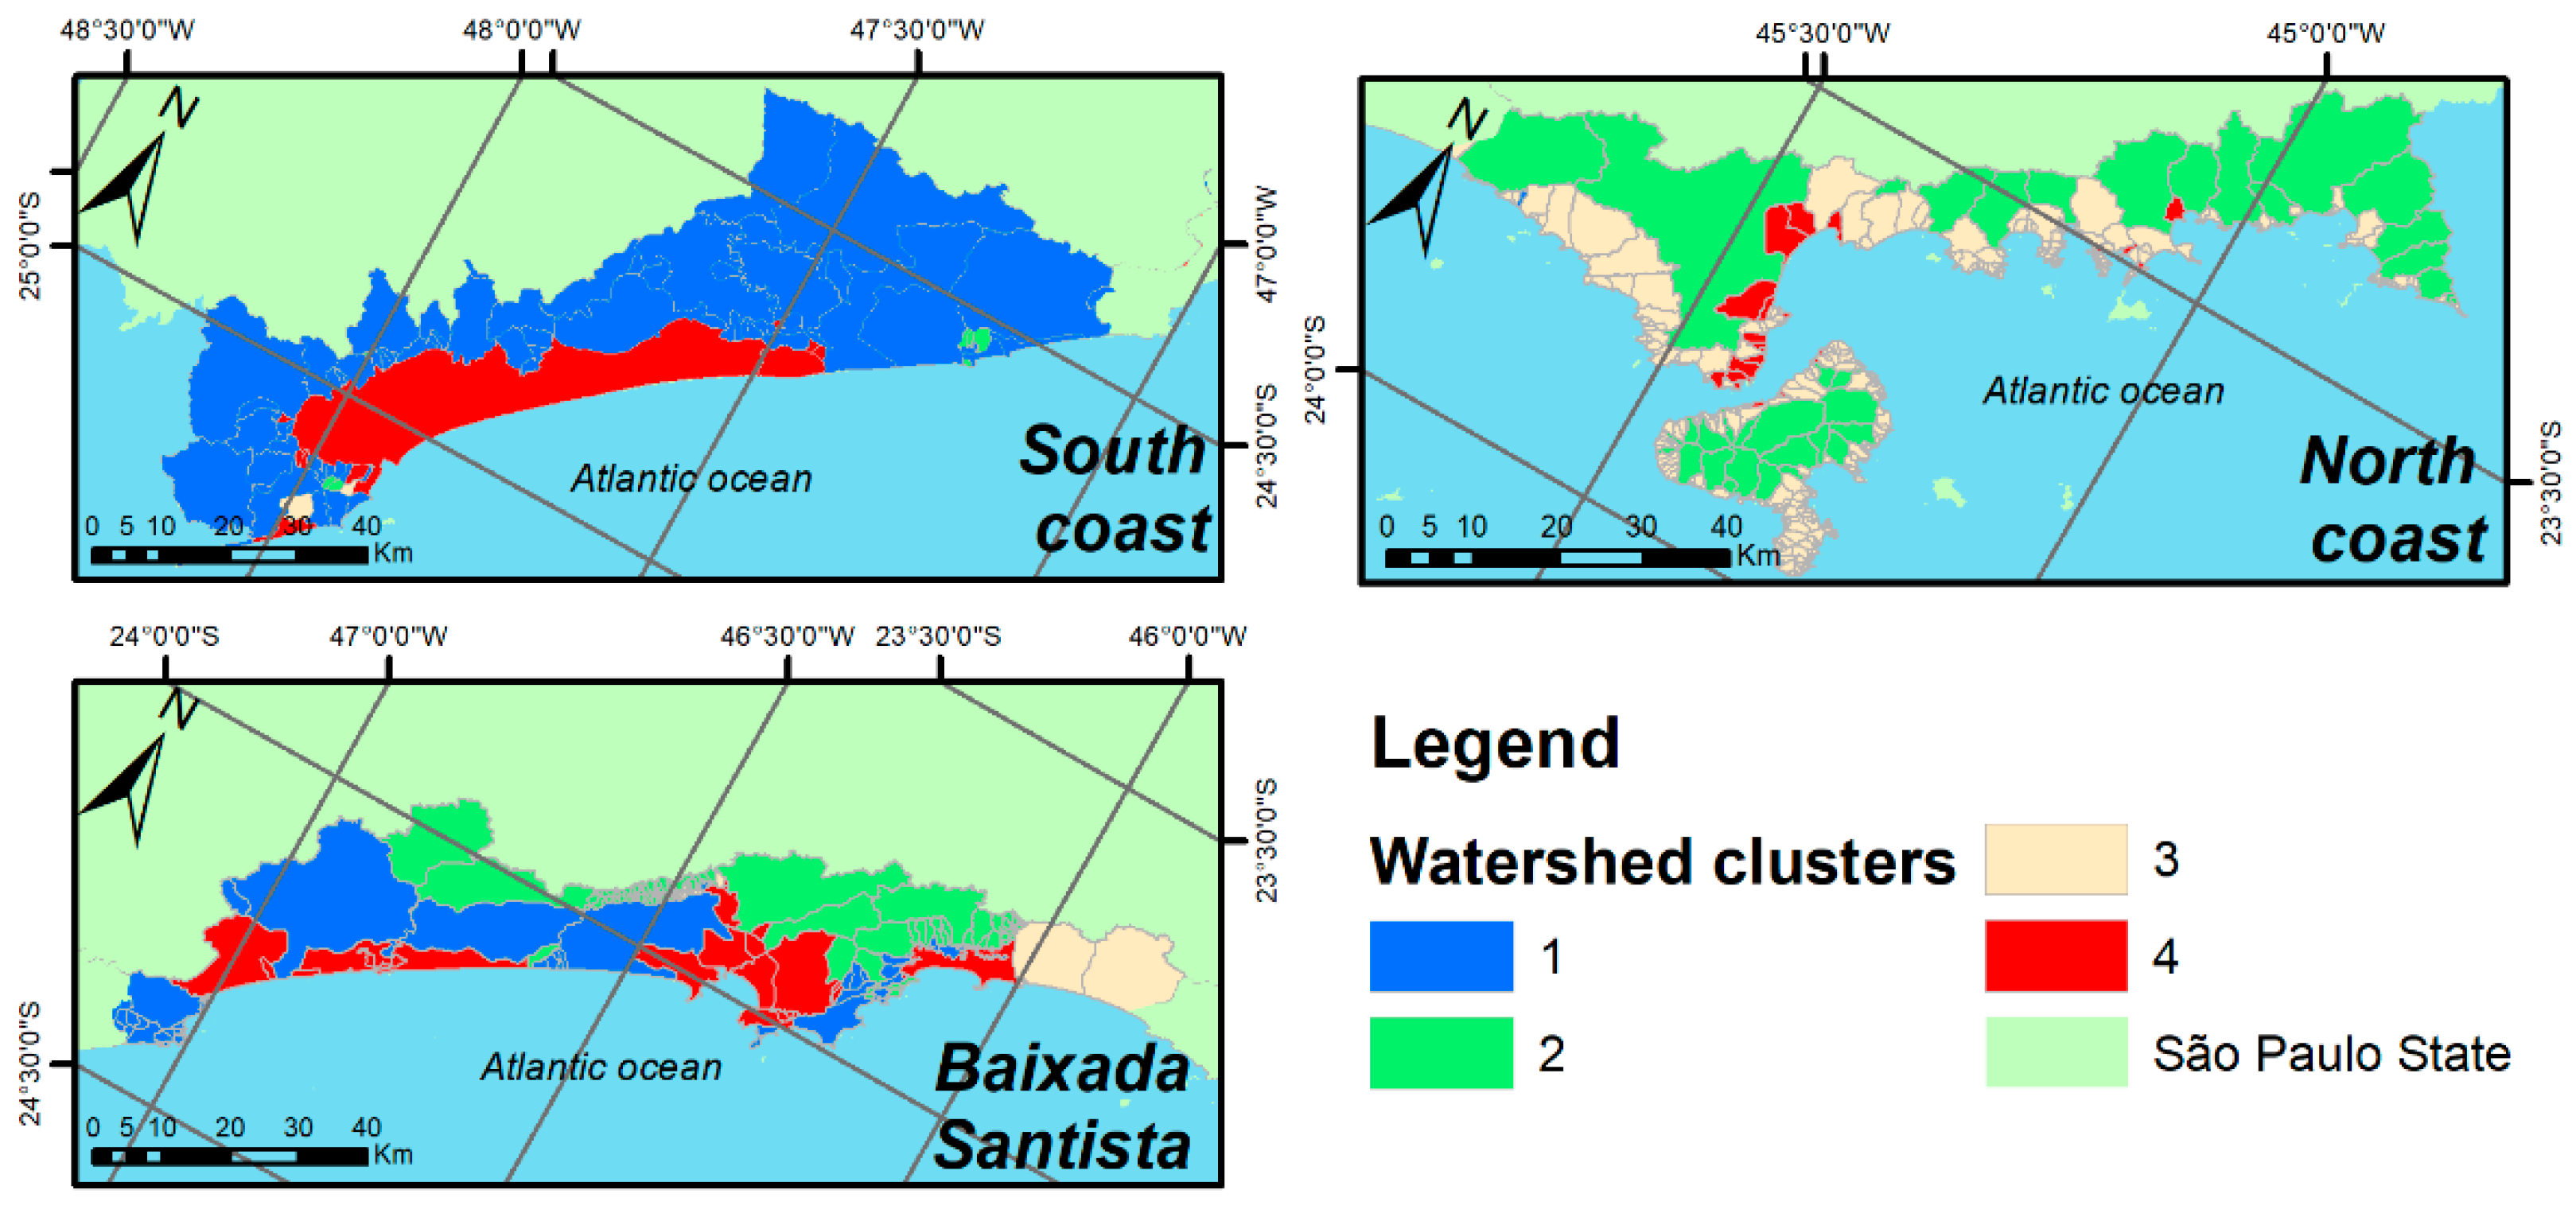
Figure 6.
Cluster dimensions. Source: Theauthors.


Table 1.
Municipalities.
| ID Region | Region | ID Municipality | Municipality | ID Region | Region | ID Municipality | Municipality |
|---|---|---|---|---|---|---|---|
| 1 | South coast | 1 | Cananéia | 2 | Baixada Santista | 9 | Cubatão |
| 2 | Iguape | 10 | Santos | ||||
| 3 | Ilha Comprida | 11 | Guarujá | ||||
| 2 | Baixada Santista | 4 | Peruíbe | 12 | Bertioga | ||
| 5 | Itanhaém | 3 | North coast | 13 | São Sebastião | ||
| 6 | Mongaguá | 14 | Ilhabela | ||||
| 7 | Praia Grande | 15 | Caraguatatuba | ||||
| 8 | São Vicente | 16 | Ubatuba |
Table 2.
Soil depth.
| Soil Depth | Weights | |
|---|---|---|
| very shallow soils | <50 cm | 10 |
| shallow soils | 50–100 cm | 7.25 |
| deep soils | 100–200 cm | 3.5 |
| very deep soils | >200 cm | 1 |
Table 3.
Landslide frequency by class of occurrence susceptibility.
| CO2 (g/kg) 0–5 cm | CO2 (g/kg) 5–15 cm | CO2 (g/kg) 15–30 cm | ||||
|---|---|---|---|---|---|---|
| Landslide Frequency | % | Landslide Frequency | % | Landslide Frequency | % | |
| Very low | 0 | 0 | 0 | 0 | 0 | 0 |
| Low | 6 | 1.15 | 5 | 0.95 | 4 | 0.76 |
| Medium | 108 | 20.61 | 80 | 15.27 | 86 | 16.41 |
| High | 360 | 68.7 | 387 | 73.85 | 315 | 60.11 |
| Very high | 50 | 9.54 | 52 | 9.92 | 119 | 22.71 |
| 524 | 100 | 524 | 100 | 524 | 100 | |
Table 4.
Cluster watershed statistics.
| Cluster | 1 | 2 | 3 | 4 | ||||
|---|---|---|---|---|---|---|---|---|
| Tw | wLr | Tw | wLr | Tw | wLr | Tw | wLr | |
| SOC (0–5 cm) | 23.071 | 23.455 | 29.655 | 29.009 | 26.379 | 26.535 | 19.615 | 20.212 |
| SOC (5–15 cm) | 22.856 | 23.207 | 29.154 | 28.562 | 25.830 | 25.998 | 19.396 | 19.859 |
| SOC (15–30 cm) | 23.529 | 23.842 | 30.727 | 30.050 | 25.485 | 26.093 | 19.546 | 19.541 |
| DTM | 88.531 | 87.126 | 358.566 | 418.320 | 160.645 | 218.605 | 49.451 | 39.163 |
| NDVI | 0.817 | 0.760 | 0.850 | 0.846 | 0.830 | 0.824 | 0.557 | 0.569 |
| Precipitation | 1815.318 | 1745.113 | 1654.509 | 1562.001 | 1414.248 | 1403.654 | 1617.856 | 1687.321 |
| Temperature | 23.573 | 24.071 | 23.170 | 22.952 | 22.905 | 22.826 | 23.105 | 23.064 |
| Soil depth | 5.394 | 5.778 | 8.254 | 8.200 | 8.193 | 7.764 | 3.507 | 3.558 |
| Landslide occurrence | 0.961 | 6.421 | 2.140 | 6.652 | 0.160 | 2.069 | 0.405 | 3.333 |
| Watershed amount | 127 | 19 | 143 | 46 | 375 | 29 | 74 | 9 |
Source: The authors. Tw = Total watersheds; wLr = watershed with landslides.
Disclaimer/Publisher’s Note: The statements, opinions and data contained in all publications are solely those of the individual author(s) and contributor(s) and not of MDPI and/or the editor(s). MDPI and/or the editor(s) disclaim responsibility for any injury to people or property resulting from any ideas, methods, instructions or products referred to in the content. |
© 2022 by the authors. Licensee MDPI, Basel, Switzerland. This article is an open access article distributed under the terms and conditions of the Creative Commons Attribution (CC BY) license (https://creativecommons.org/licenses/by/4.0/).
Share and Cite
MDPI and ACS Style
Folharini, S.; Vieira, A.; de Oliveira, R.C. Ecohydrological Analysis in Watersheds of Mountain Areas of São Paulo State Coastal, Brazil. Proceedings 2023, 87, 32. https://doi.org/10.3390/IECG2022-13864
AMA Style
Folharini S, Vieira A, de Oliveira RC. Ecohydrological Analysis in Watersheds of Mountain Areas of São Paulo State Coastal, Brazil. Proceedings. 2023; 87(1):32. https://doi.org/10.3390/IECG2022-13864
Chicago/Turabian StyleFolharini, Saulo, António Vieira, and Regina Célia de Oliveira. 2023. "Ecohydrological Analysis in Watersheds of Mountain Areas of São Paulo State Coastal, Brazil" Proceedings 87, no. 1: 32. https://doi.org/10.3390/IECG2022-13864