1. Introduction
Groundwater, often known as subterranean water, refers to all waters found beneath the earth’s surface [
1]. Rainwater and/or snowmelt water seeps down through the soil and into the underlying rocks to generate groundwater, which is defined as water in the saturated zone [
2,
3]. It is one of the world’s most important natural resources, providing a key supply of water for towns, industry, agricultural outputs, and tourism activities [
1,
4]. Based on [
5], there are 663 million people without access to safe water and 2.4 billion people without decent sanitation in the world. Every day, women and young girls altogether spend 266 million hours searching for a location to obtain water.
Groundwater occurrence and distribution are influenced by the climate and regional setting of the region, as well as surface and subsurface characteristics such as underlying rock fractures, land use type, geomorphic features, structural features, and their interactions with hydrological characteristics [
6,
7,
8].
Afghanistan is situated in a semi-arid region with frequent precipitation fluctuations. The surface and groundwater are utilized for a variety of reasons, including drinking water, agriculture, and industry [
9,
10].
Due to low annual precipitation across the country and the disappearance of surface water, almost everyone now uses groundwater for multiple purposes, causing groundwater depletion and contamination, particularly in large cities like Kabul, Herat, and Balkh, which have grown in population in the last two decades [
11,
12,
13,
14].
At this time, remote sensing and geographic information systems (GISs) may be utilized to successfully manage groundwater and predict groundwater potential at the national, regional, and local levels [
4].
According to the literature, several approaches have been widely used for the potentiality mapping of groundwater resources, including Multiple-Criteria Decision Analysis (MCDA) of Analytical Hierarchy Process (AHP), Frequency Ratio (FR), influencing factors combining Frequency Ratio, Index of Entropy, Certainty Factor (CF), etc. [
4,
15,
16,
17,
18,
19,
20,
21,
22,
23,
24,
25,
26,
27,
28,
29,
30,
31,
32,
33,
34,
35,
36,
37,
38]. Different influencing factors, such as geology, lithology, geomorphology, slope, land use, land cover, drainage density, lineament density, and rainfall, were evaluated in these works based on their weights and rates.
There has been relatively little research, notably in the hydrogeology sector, employing innovative technology on Afghan territory, particularly in the Balkh Province. Ref. [
30] studied the paleochannel of the Balkh River (northern Afghanistan) and human occupation since the Bronze Age. In 2016, DACAAR carried out Vertical Electrical Sounding for groundwater assessment in Balkh’s new university, Nahr-I-Shahi District of Balkh Province. In recent years, ref. [
32] has been evaluating the effects of climate change on field water demands using limited ground information in the Balkh Province. Recently, Shroder et al. [
14] summarized the geology and water resources of Afghanistan and highlighted the main challenges in groundwater resources. Geospatial technology concerning the groundwater potentiality has thus far only been used in Kabul, the capital of Afghanistan; for example, ref. [
33] assessed the potential zones by considering influencing factors, e.g., slope, geology, soil type, LU/LC, lineaments density, rainfall, and drainage density. Taking into account the present scenario in the Balkh Province, northern Afghanistan, and the absence of appropriate data and study on groundwater availability, which is the area’s primary concern, we chose to conduct this GIS-based study with the following key objectives: (1) to determine groundwater potential zones considering influencing factor using the Multiple-Criterial Decision-making Analysis (MCDA) of the Analytical Hierarchy Process (AHP) method, and (2) to uncover the effectiveness of AHP for the demarcation of groundwater reservoirs within the extent of the Balkh Province in northern Afghanistan.
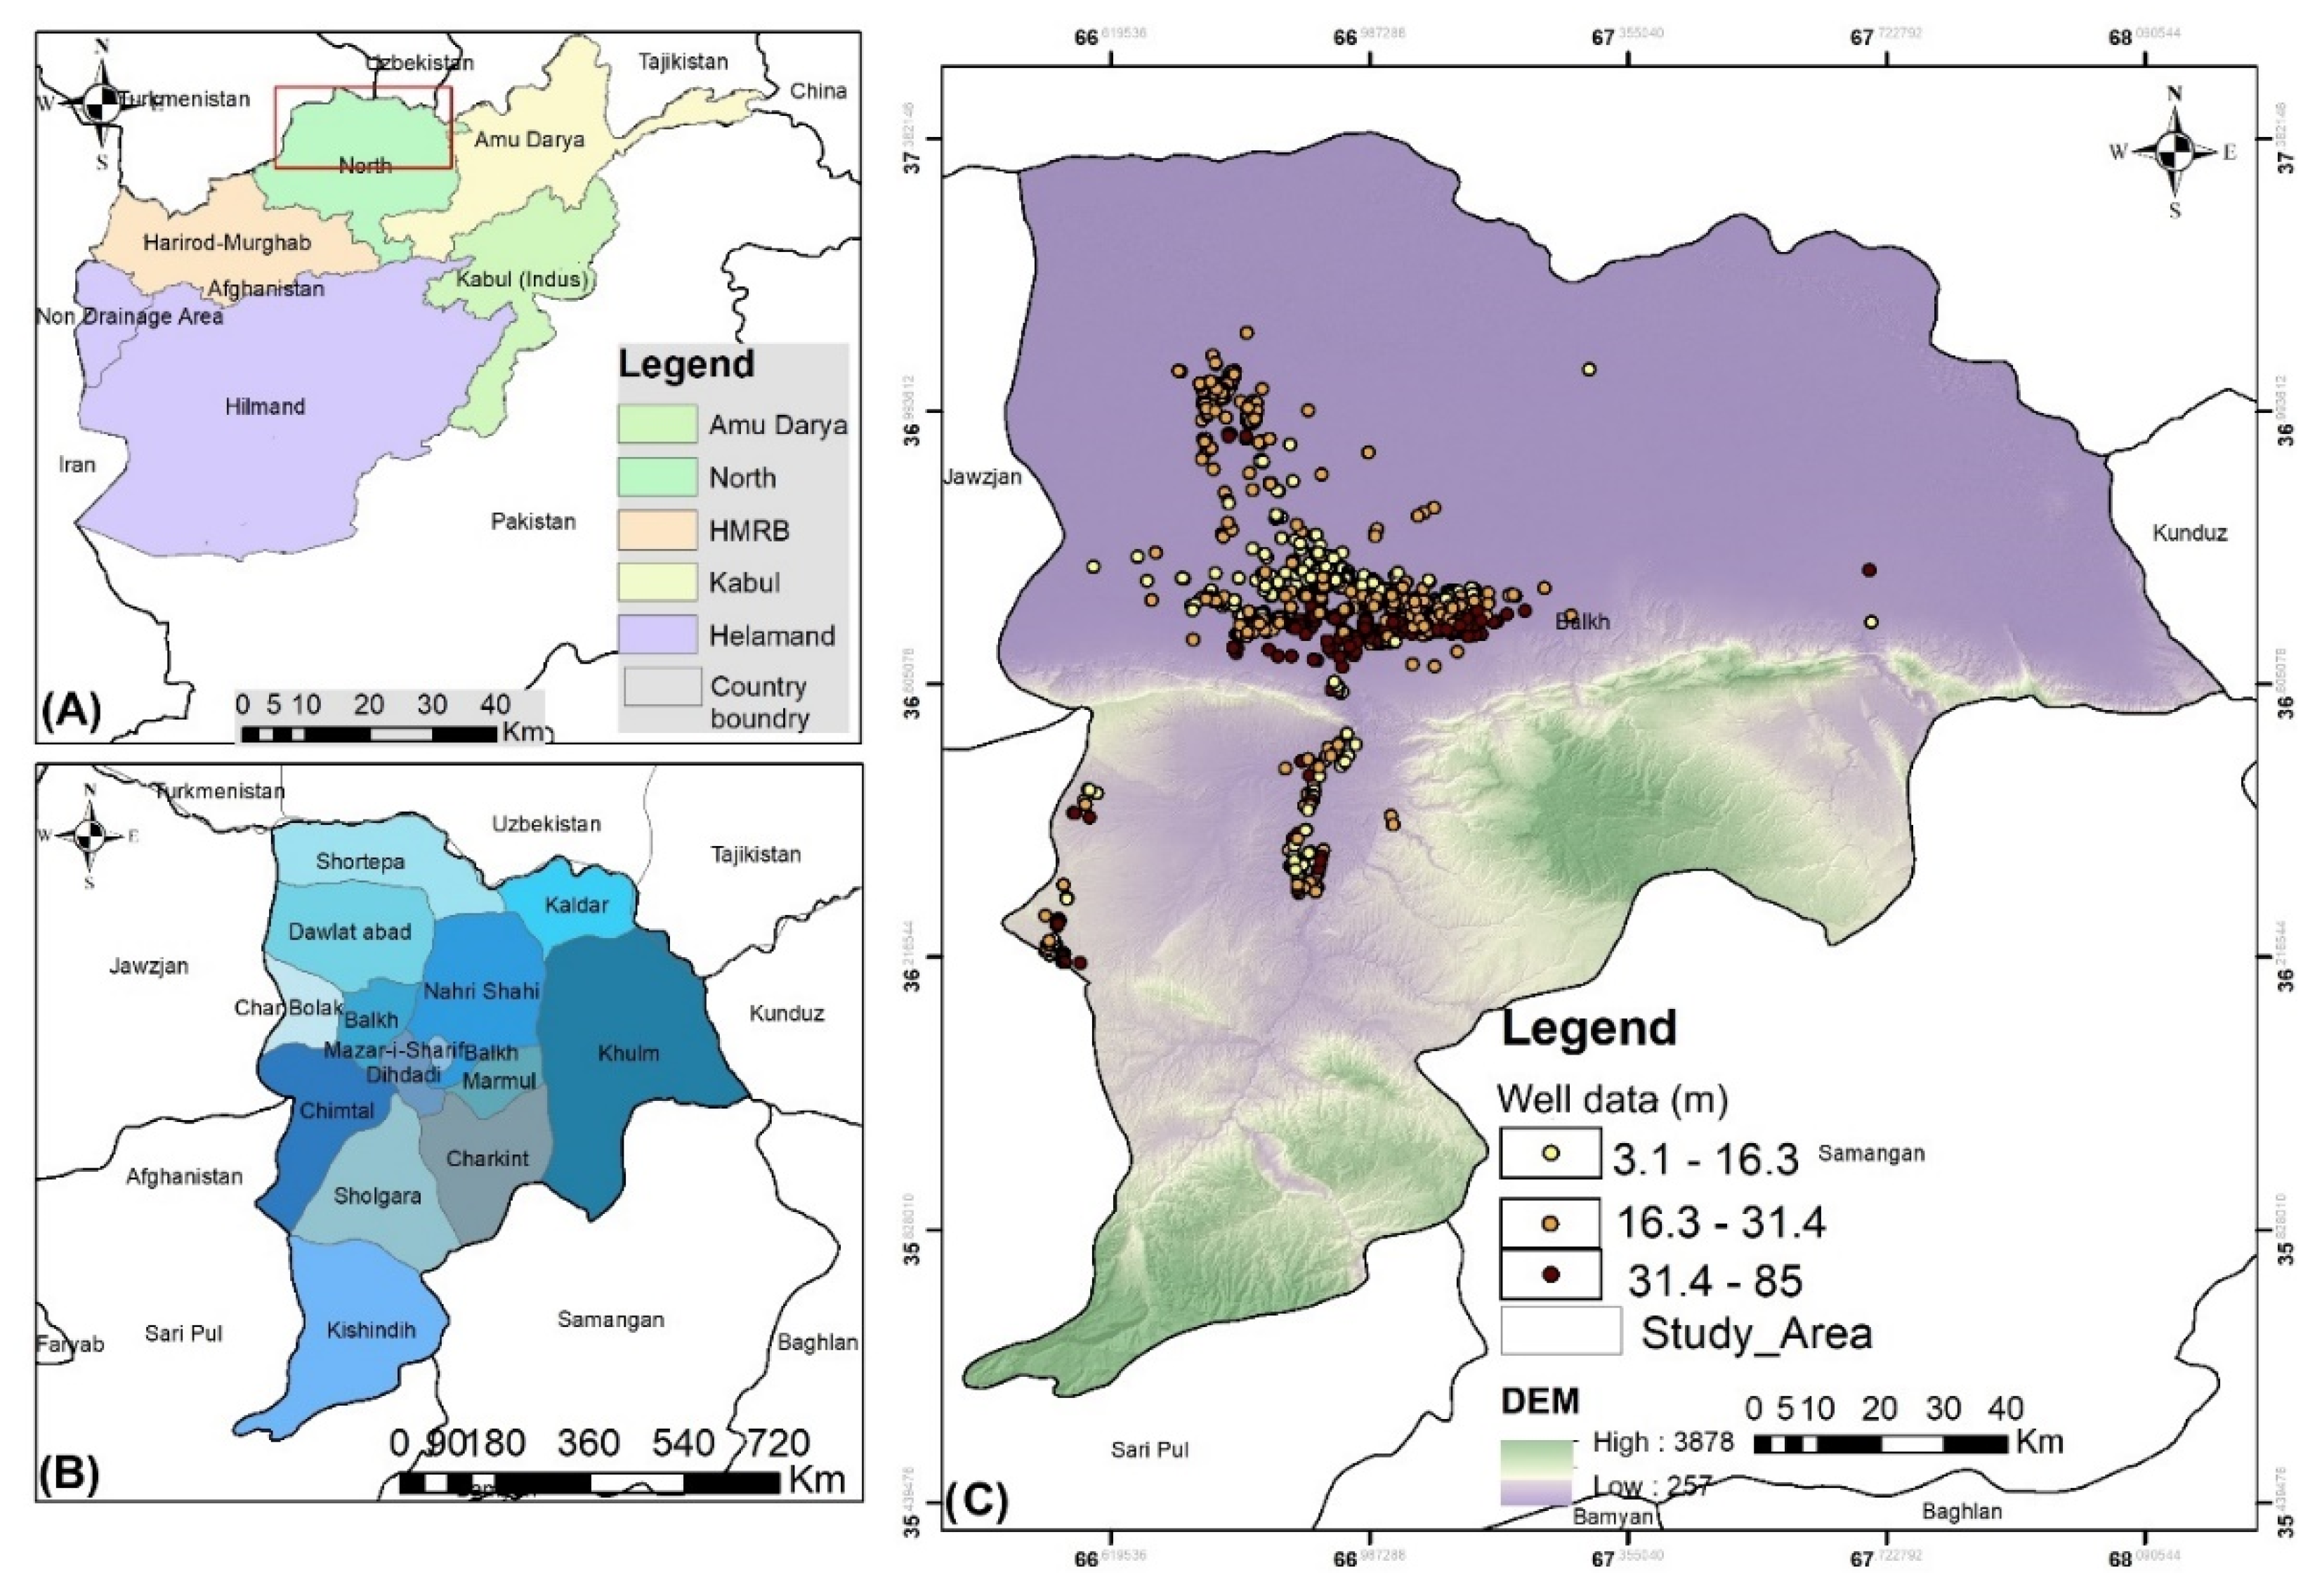
2. Study Area
The study area (Balkh Province) lies in northern Afghanistan, at 36.76° N, 66.9° E, and 334 m above sea level. Balkh Province has a total area of 16,840 km
2. Amudarya (Oxus River) is located in the province’s northwestern corner that separates Afghanistan from Tajikistan and Uzbekistan, with Kunduz Province in the east, Samangan and Sari Pul provinces in the south and southwest, and Jawzjan Province in the west (
Figure 1).
3. Materials and Methods
In this study, geographic information systems and remote sensing along with other conventional approaches were used to map groundwater potential areas by applying the Multiple-Criteria Decision Making Analysis (MCDM) of the AHP model. Seven thematic layers, including lithology, slope, distance from the river, drainage density, land cover/land use, lineament density, and rainfall, were generated and weighted considering the expert knowledge and the previous literature. The entire procedure of the methodology is depicted in
Figure 2.
All of the selected thematic layers have been rasterized and then projected into UTM Projection, WGS 84 Datum Zone 42, with a spatial resolution of 50 m. The slope and drainage density map were created using NASA’s ASTER GDEM with a 30 m resolution. A hydrology tool was used to prepare the drainage density.
The geology and lineament density data were obtained from the United States Geological Survey (USGS) website. The line density tool was also used to produce lineament density from the lineament map.
The LULC map for the study area was derived using the GIS environment from the FAO-Digital LULC Map incorporating Landsat 8 OLI/TIRS data. Following that, rainfall data for the research region was collected from a CRU (Climatic Research Unit) web satellite with a high resolution of 0.5°0.5°. Reclassification was completed when all of the selected thematic layers were converted to a rasterized format with the same cell size. Then, using the MCDA-AHP approach, weights were given and prioritized based on the literature and expert knowledge.
To delineate the final groundwater potential map for the study area, a Weighted Overlay Analysis (WOA) was conducted by combining all of the raster layers in the GIS environment.
3.1. Influential Factors
3.1.1. Lithology
The lithology of aquifer rocks affects their porosity and permeability and is a fundamental indicator of the quality and amount of groundwater in a specific location [
4,
37].
The lithology layer was derived from the Afghanistan geological map prepared by [
39] and digitized using USGS. As illustrated in
Figure 3A, the following four types of units occur within the study area:
Sandstone;
Conglomerate, siltstone, gypsum;
Shingly and detrital sediments, gravel, sand, clay, clay sand, loess, travertine;
Conglomerate, shingly sediments, loam, andesite, dacite, and their tuffs, phonolite.
ArcGIS 10.5 was used to reclassify and analyze the lithologic map for study (
Figure 3A). Because of the importance of geology on groundwater potential, sedimentary and metamorphic rocks cover the majority of the study area. Furthermore, sedimentary rocks cover the central (Nahri Shahi, Balkh, Mazar-i-Sharif, Dihdadi, a part of Khulm, and Char Bolak) and northern (Kaldar, Dawlat Abad, and Shortepa) parts of the study area, which have the highest score and are most important for groundwater storage due to porosity such as pores, joints, fractures, bedding planes alluvium, and sandstone. Because of the lesser penetrability of the igneous rocks and mountainous areas in the south (Sholgara, Kishindih, Charkint, and Marmul), southeast (a section of Khulm), and southwest (a part of Chimtal), it is understood that groundwater availability is lower in these places.
3.1.2. Slope
The slope’s steepness directly influences the rate of rainfall infiltration and is thus used to assess groundwater possibilities. Due to insufficient time to percolate the surface, a steeper slope results in a higher surface runoff and less groundwater recharge. There is always an inverse connection between water infiltration and slope degree [
40,
41]. A mild and flat slope, on the other hand, always presents tremendous potential for groundwater recharging and has good groundwater development prospects.
The slope map in degrees for the study area, constructed using the ArcGIS 10.5 environment from the ASTER DEM 30 m imagery of the area (
Figure 3B), reveals five slope classes: (1) 0–4.49, (2) 4.49–11.65, (3) 11.65–20.91, (4) 20.91–33.46, and (5) 33.46–76.18. According to
Figure 3B, the lowest slope (0–4.49) is found in the northwest (Dawlat Abad and Charbolak) region of the province, indicating an essentially flat topography. In the south (Chimtal, Sholgara, Kishindih, Charkint, and Marmul) and in the east (a part of Khulm), the highest slope (33.46–76.18) appears in the shape of spread strips along the mountains. As a result, groundwater recharge is mostly likely in the northern section of the state (Kaldar, Dawlat Abad, Shortepa, and a part of Khulm).
3.1.3. Distance from River
Groundwater levels are significantly affected by the distance from the river. This appears to be a good impact, particularly in flat places [
42,
43]. The groundwater level is greater near the river than it is further away. When it comes to groundwater risk, the distance from water bodies might be subjective. As a result (
Figure 3C), all locations within 500 m of the drainage line are classified as having a very high potential for groundwater recharge, whereas areas within 2000, 4000, 7000, 11,000, and >11,000 m of the river are classified as having a very high, high, moderate, low, and very low potential for groundwater recharge, respectively.
3.1.4. Lineament Density
Lineaments are linear or curved features on the Earth’s surface that indicate weaker bedrock zones and are used as a secondary aquifer in hard rock locations. They may be seen in remote sensing images [
44,
45].
Lineament density might reflect a region’s groundwater potentiality and permeability [
46]. Geological features such as lineaments can be identified using remote sensing methods [
44,
47].
By taking into account the DEM of the study area, PCI Geomatic provided the lineament dataset. The resulting map was then resampled, reclassified, and plotted in the ArcGIS environment.
There are several intersecting lineaments in the study area. A groundwater potential zone is defined as the intersection of lineaments. The density of lineaments has been created and classified into five categories: extremely poor (0–0.0004), poor (0.0004–0.0008), moderate (0.0008–0.0013), high (0.0013–0.0017), and very high (0.0017–0.002) (
Figure 3D). Because high-density lineaments are better for groundwater potential than low-density lineaments, higher weights are given to high-density lineaments, and lower weights are given to low-density lineaments.
The greatest concentration of lineament density is mostly in the southern (Marmul, Chimtal, Sholgara, and Kishindih) and southeastern regions (a part of Khulm) of the study area and these places are regarded to be a likely groundwater concentration zone. However, in the northeastern section, the density is very low or nearly non-existent, resulting in limited groundwater potentiality.
3.1.5. Drainage Density
Drainage density is inversely proportional to permeability; it is an important characteristic to consider when assessing the groundwater zone [
48]. Also, the form and structure of the bedrock, the kind of vegetation, the rainfall absorption capacity of soils, infiltration, and slope gradient all influence an area’s drainage system [
24].
ASTER DEM was used to derive the drainage density (
Figure 3E). Similar to the lineament density, the drainage density is a quantitative quantity determined from the drainage pattern using comparable processes. The drainage density is defined as the ratio of the total stream lengths to the size of the grid area under consideration [
9,
37].
Using the equation below, the drainage density index was calculated:
where
∑Di is the total length of all streams
i (km) and
A is the area of the grid (km
2).
As shown in
Figure 3E, the resultant map for the area was divided into five classes: 0–0.034, 0.034–0.089, 0.089–0.15, 0.15–0.22, and 0.22–0.38. Low-drainage-density locations had higher ranks, whereas high-drainage-density areas received lower rankings, as seen in
Figure 3E. Almost the whole northern part of the area had a high to extremely high drainage density. On the other hand, the poor drainage density covered the majority of the study area’s southern portion.
3.1.6. Rainfall
As part of the hydrological cycle, rainfall is another important component that affects groundwater potentiality [
48]. This parameter greatly impacts the MCDA efficiency and groundwater potential [
37]. Rainfall distribution and gradient are directly influenced by runoff penetration; this impacts the quantity of water that may percolate into the groundwater system, and it is feasible to improve groundwater potential [
46]. As a result, rainfall is an important hydrologic component in our study. The rainfall dataset was retrieved for the research region from a CRU (Center for Hydrometeorology and Remote Sensing) web satellite with a high resolution of 0.5°0.5°.
The rainfall resulting map was classified into four categories, including 418.45–486.54 mm, 486.54–534 mm, 534–581.45 mm, 581.45–637.91 mm, and 637.91–763 mm. In comparison to the northern (Shortepa, Kaldar, Nahri shahi, and Shortepa), northwestern (Char Bolak and Dawlat Abad), and southern (Charkint, Marmul, Sholgara, Kishindih, and a part of Chimtal) parts of the study area, the eastern (a part of the Khulm) and southern (Charkint, Marmul, Sholgara, Kishindih) parts are shown in
Figure 3F.
3.1.7. Land Use/Land Cover
The surface of the earth is described by land use and land cover. The natural layer comprises elements such as water bodies, forests, and so on, but the modified natural environment includes parameters such as croplands, fallow lands, plantations, and built-up areas, among others. These variables have an impact on groundwater either directly or indirectly.
The study area’s land use/land cover map shows six major groups of land use/land cover that were recognized and demarcated (
Figure 3G). Satellite images may be used to interpret the diverse land use/land cover classifications of the research region, including agricultural, bare land, built-up land (town, village), forest land, water bodies, and sand cover.
Agricultural land almost completely surrounds the study area on all sides. In agricultural regions, runoff is typically lower, and penetrations are higher. However, the quantity of intrusion in settlement areas is usually lower. As a result, agricultural land and water bodies receive a high ranking due to their continuous recharge capacity. In contrast, built-up regions receive a poor ranking due to their negative influence on groundwater capacity.
3.2. Analytical Hierarchy Process (AHP)
AHP is one of the most appropriate decision-making techniques introduced by Saaty based on the multiple-criteria approach [
49]. It assists decision-makers in resolving the spatial complexity of environmental challenges. The assignment of weights to each parameter and their normalization is a critical aspect in generating suitable results as the outcome is solely dependent on the weight assignments. However, there are numerous weight estimating strategies, but AHP is regarded as a promising methodology in groundwater modeling that may offer speedy, reliable, and cost-effective results [
41].
AHP’s major features include hierarchical formulation, cost-effective and time-saving methods, and exact findings [
26]. The key advantage of AHP is that it allows for expert-based factor ranking and ranking re-arrangement in the event of reduced accuracy.
The four steps of the AHP model are weight assignment, pair-wise comparison matrix, weight normalization, and consistency check. A total of seven criteria were chosen for this study to control the flow factor and storage capacity of groundwater in the study area [
4,
46,
50,
51,
52,
53].
Step 1: Pair-wise comparison matrix (PCM) computed using Equation (2):
where
X is the pair-wise comparison matrix;
Xnn is the indicator of the pair-wise matrix element.
Step 2: Normalizing the weights using Equation (3):
where
NW is normalized weights;
GMn is considered the geometric mean of the
nth row of the pair-wise matrix (
X).
Step 3: The consistency ratio (
CR) is used to validate the pair-wise judgment matrix using Equation (4):
where
CR is calculated by dividing
CI (consistency index) by RCI (random consistency index) of Saaty [
49] (
Table 4).
Step 4: To calculate
CI, the following Equation (5) was adopted:
where λ
max is the principal Eigen, and
n represents the number of parameters selected for the study.
According to Saaty (1990) [
49], a
CR value of 0.10 is sufficient to continue the assessment. Furthermore, if the
CR value is greater than 0.10, the analysis must be modified from the start to find the source of the matrix’s discrepancy. If the
CR value is a perfect 0, then the PCM is absolutely accurate. However, the
CR value in our study is less than 0.10, as calculated in
Table 4, and hence the analysis can proceed.
3.3. Groundwater Potential Zone (GWPZ)
The groundwater potential zone (
GWPZ) is a dimensionless variable that aids in predicting a region’s groundwater potential. The groundwater potential zone (
GWPZ) was calculated using the weighted linear combination approach as follows [
48]:
where
Wi is the normalized weight of the
i thematic layer,
Xj is the rank value of each class with respect to the
j layer,
m is the total number of thematic layers, and n is the total number of classes in a thematic layer. Equation (7) was used to determine the
GWPZ for each cell:
where
Lt is the lithology,
Sl is the slope,
RD is the distance from the river,
LC/
LU is land cover/land use, respectively,
DD is the drainage density,
Rf is the rainfall, and
LD is lineament density. While the subscripts
W and
R indicate final weights and normalized rates for each conditioning factor, respectively.
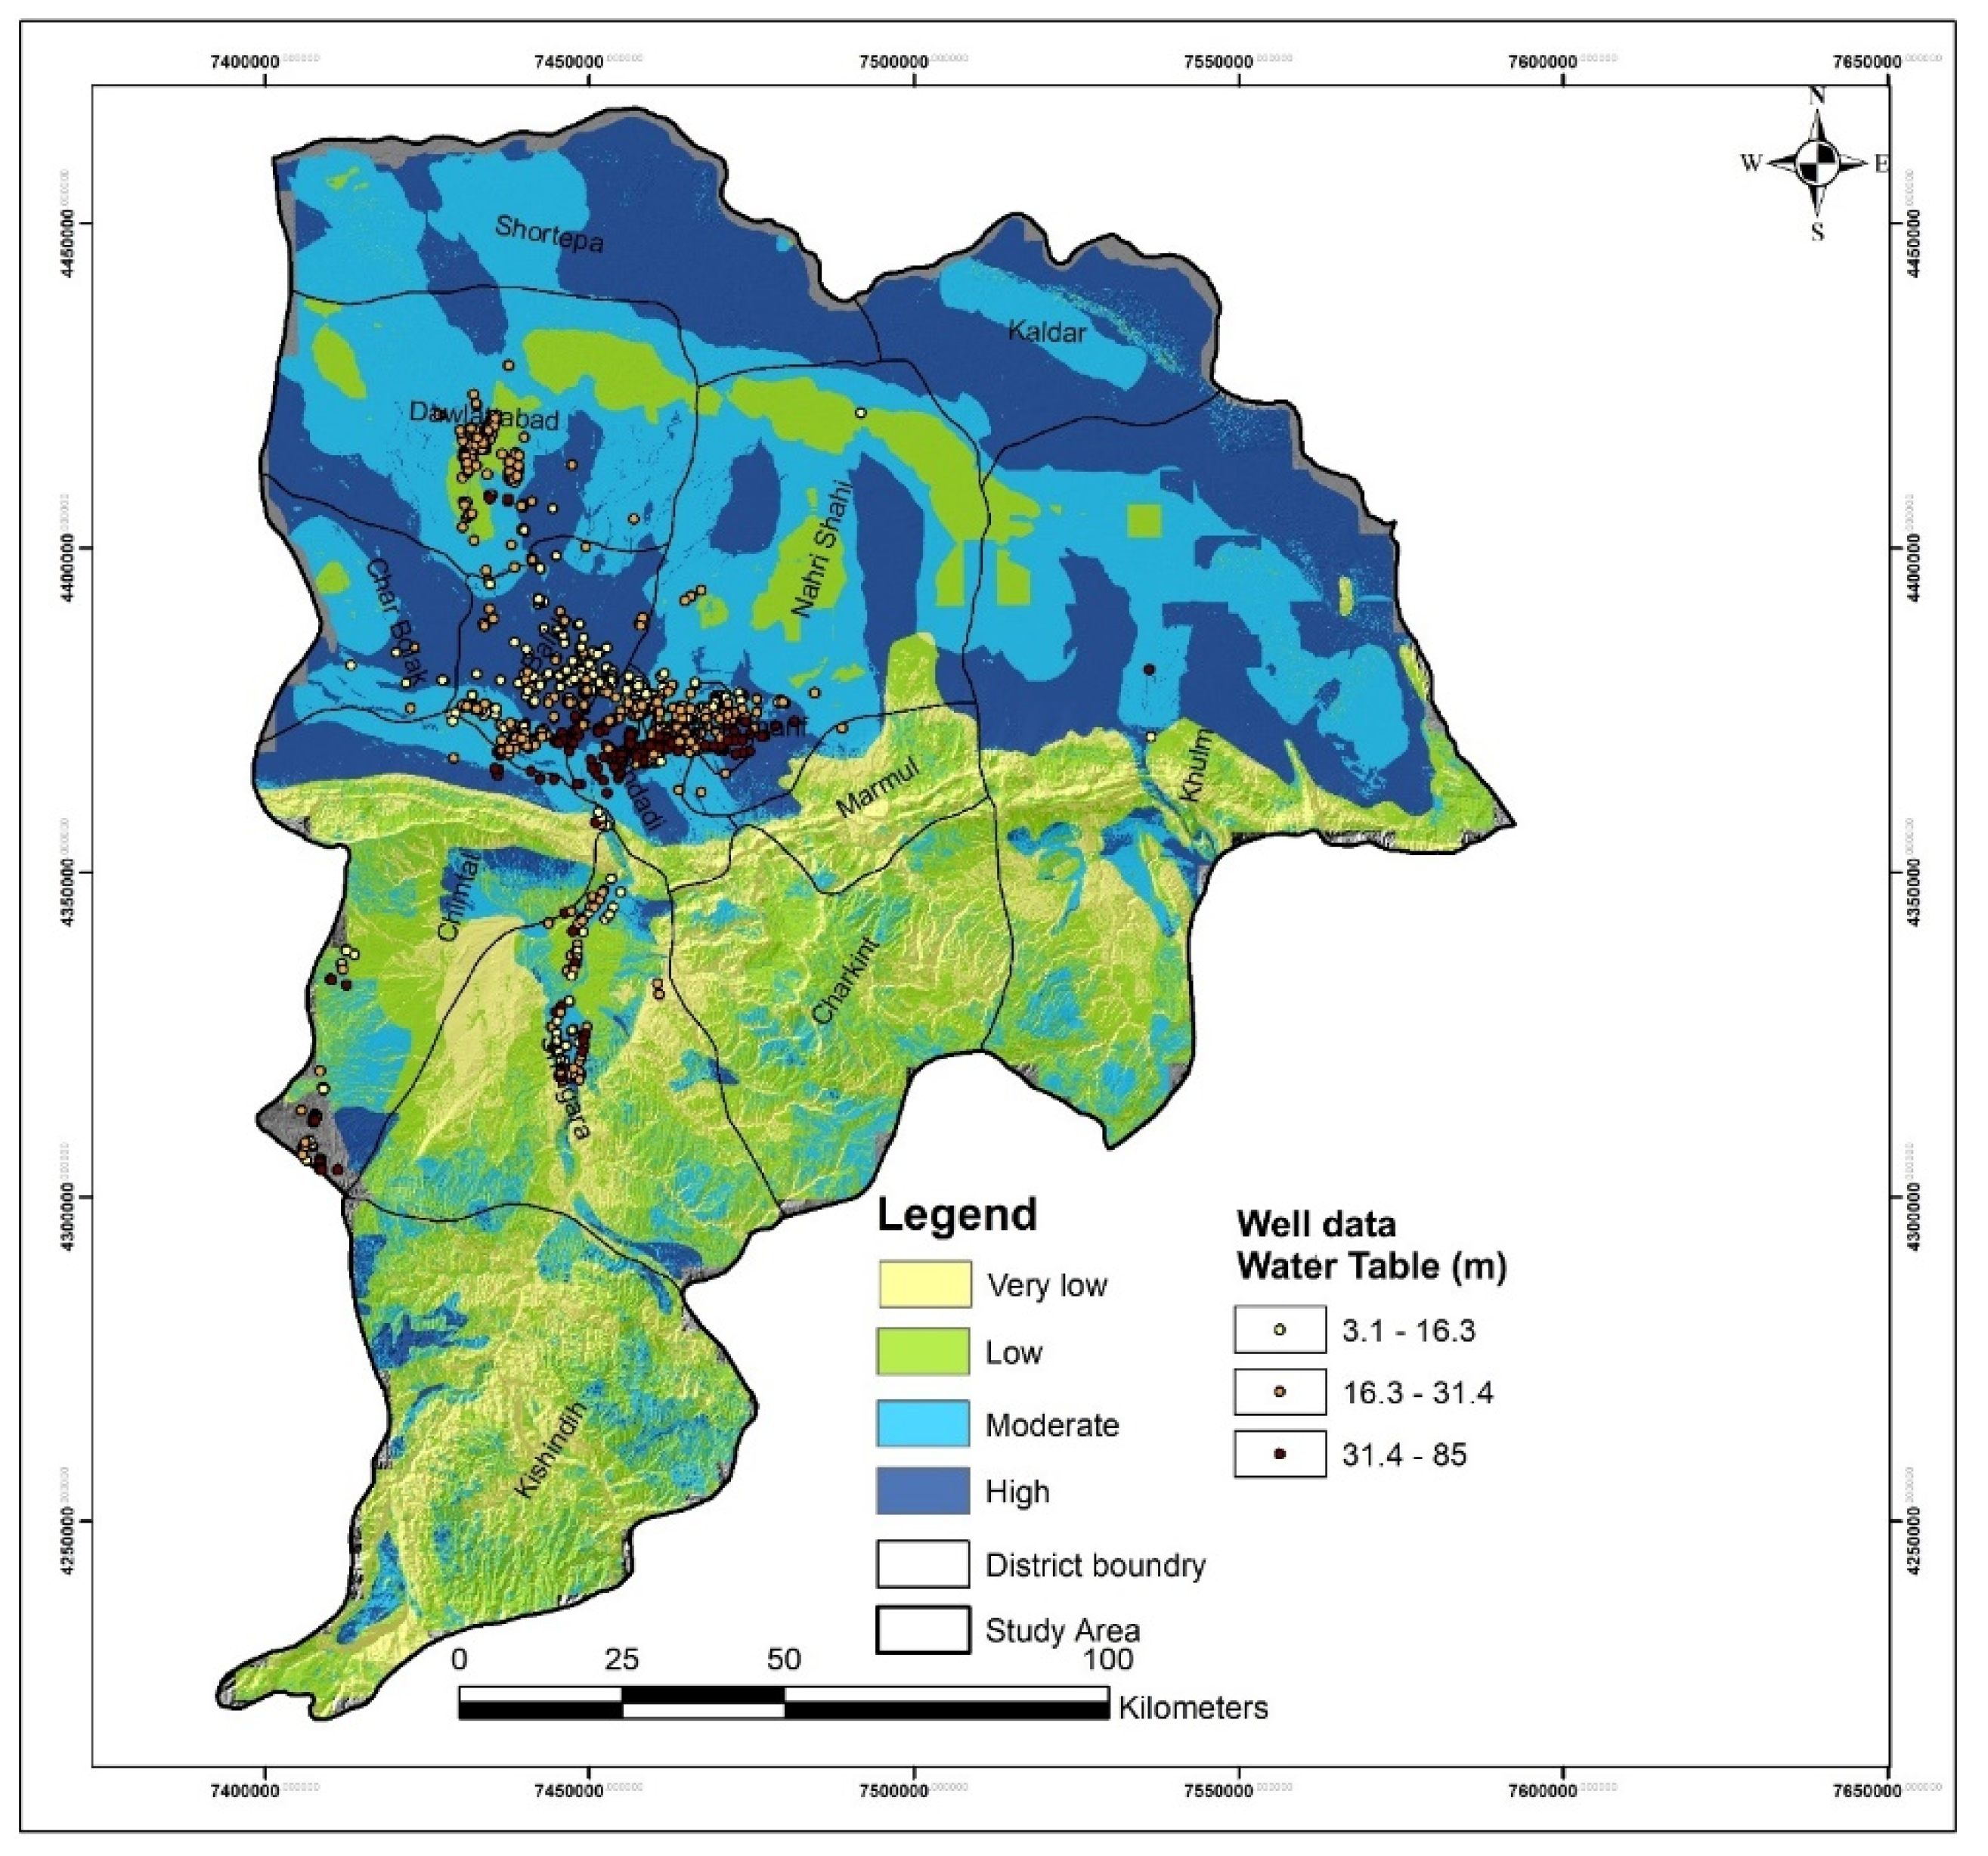
The quantile classification approach was used to divide
GWPZ values into four categories: extremely low, low, moderate, and high (
Figure 4). Each class in this classification technique has the same number of characteristics. Several researchers have also used the quantile approach because of its effectiveness [
4,
21].
Considering the geographical and environmental condition of the study area and the influence of the distance from the river, which has the second rank of weighing, we generated two groundwater potential zones based on the seven and six layers, excluding the distance-from-the-river layer as illustrated in
Figure 5.
4. Results and Discussion
The major goal of this research is to determine groundwater potential mapping for the Balkh area in northern Afghanistan using the AHP model.
As a result, the study area’s low to very low groundwater potential zone is mostly found in the south and southeastern parts. High mountains with varied terrain, strong to severe slopes, and coarse to gravelly loam soil dominate these locations.
Furthermore, because the majority of precipitation falls as surface runoff, the area’s high relief and irregular topography result in limited infiltration capability. As a result, the groundwater level in this region of the study area is always low. As a result, this region of very low and low groundwater potential encompasses roughly 7644.2 km2 (46%). A moderate and high groundwater potential zone, taken together, covers an area of around 8973.3 km2 (54%).
The existence of high to moderate groundwater potential zones in the specified area might be influenced by the presence of high rainfall, gravel, and sandy gravel lithology, all of which indicate a good aquifer, linked lineament, lower slope, and low drainage density.
In fact, the presence of these structures in the study area will increase the likelihood of groundwater penetration and storage. The presence of considerable rains will amplify this effect. Moderate to low rainfall, lithology type (clay, shale, marl, and limestone), low lineament with no connections, steep slope, and high drainage density describes low to very low groundwater potential zones. As a result, there is less probability of groundwater penetration, and more rainfall is likely to flow as surface runoff.
Furthermore, agricultural fields in most locations have a high groundwater potential, indicating that the groundwater level in such areas is shallow. Geophysical studies and well logs might help determine the ideal locations for drilling groundwater discharge wells in this zone.
The area is divided into four groundwater potential zones based on seven thematic layers (lithology, slope, drainage density, lineament density, land use/land cover, distance from the river, and rainfall). They are very low (10.87%), low (35.13%), moderate (30.76%), and high(23.24%). The study area’s extremely good (high) potential zones are often found in the north, whereas low potential zones are found in the south, as summarized in
Table 6.
The low and very low zones near the river are illustrated in
Figure 4, and this result is due to the dryness of the river channel throughout the year. It is worth noting that after analyzing the layers, the distance from the river presents good results in those areas where the river channels have water throughout the year.
As a result, we ignored only the distance between layers when generating the groundwater potential area, instead of basing it on six thematic layers (lithology, slope, drainage density, lineament density, land use/land cover, and rainfall), and the result (
Table 7) shows that the area is divided into four groundwater potential zones. They are extremely low (11.6%), low (19.9%), moderate (32.4%), and high (36%). The research area’s extremely excellent potential zones are often found in the north, whereas poor potential zones are found in the south. Meanwhile, the output of the created map, which is based on six thematic layers, is more accurate and dependable.
Validation is the most significant modeling procedure from the standpoint of scientific importance [
4,
54]. As a result, assessing the resulting
GWPZ is critical. The groundwater well locations in the validation datasets were used to verify the
GWPZ defined in this work.
The result was verified using data from 5776 monitoring wells collected over nine years (2005–2022) by the MRRD (Ministry of Rural Rehabilitation and Development) and AGS (Afghanistan Geological Department), with support from the USGS, DACAAR (Danish Committee for Aid to Afghan Refugees), and the Ministry of Energy and Water. The collected data were normalized based on the final result, and the validation procedure was applied to 5608 well data. Water levels in the monitoring wells ranged from 3.15 to 85.03 m on average. The mentioned wells were classified into three classes based on the static water level in the wells, 3.15–16.38 m, 16.38–31.46 m, and 31.46–85.03 m, which were attributed to high, moderate, and low groundwater levels, respectively, and inserted on the final GWPZ map. We then extracted the values for the selected well data and created a confusion matrix as described in
Table 8 and
Table 9. When it comes to tackling classification difficulties, the confusion matrix is a prominent tool. It can be used for both binary and multiclass classification issues.
According to six thematic layers, the total accuracy values of both layers were 71 percent and 54 percent, respectively. The accuracy evaluation of these approaches based on six thematic levels reveals a strong link between prospective groundwater zones and well record values. Consequently, the current study’s findings show the technique’s validity for groundwater potential zones in Afghanistan’s Balkh Province, and it may be extended to other locations with comparable geological settings.
5. Conclusions
For a long time, groundwater potential mapping has been carried out in this country by utilizing several traditional and remotely based methodologies. However, remote sensing technology and GIS studies have limitations, even though these studies make it simple and accessible for specialists to undertake prospective mapping at minimal prices and in a short amount of time.
In this study, the groundwater potential of different regions within the study area was predicted using the Analytical Hierarchy Process (AHP) model in the ArcGIS environment by considering seven thematic layers: lithology, slope, distance from the river, drainage density, land use/land cover, lineament density, and rainfall.
The weights and rankings assigned to each class and sub-class determine the consistency of the AHP model for groundwater potential delineation. As a result, understanding the elements that influence the targeted item is essential for improved results. According to the final groundwater potential map, 11.6% of the research region is classified as “very low potential”, 19.9% as “low potential”, 32.4 percent as “moderate”, and 35.9% as “high groundwater potential”.
High groundwater potential zones have few restrictions for intensive groundwater management. However, due to climate change and population growth, we must address the limits of urbanization and agricultural development in this area. For sustainable surface and groundwater management, regions categorized as moderate groundwater potential zones require good management planning addressing agriculture, plantation, and appropriate economic activities.
The areas with very low and low groundwater potential are largely covered by built-up areas, steep to extremely steep slopes, barren terrain, and thin soils with mountains, necessitating careful attention and planning for the management of surface and groundwater water resources. Artificial recharge packages, rainwater collection, the extension of agricultural areas, and the creation of forest areas are all suitable solutions for low and intermediate areas.
As a result, the groundwater potential map developed by this study’s robust AHP approach might be a useful resource for groundwater planning and management not only in this region, but also in agricultural areas. Furthermore, because the approach used in this study was efficient and precise, it could be used to perform groundwater exploration in diverse places with similar geologic, meteorological, and environmental characteristics.
The resulting maps show that the groundwater potential model created using AHP in GIS is good. The findings of this study may be used as a guide for responsible departments to perform correct groundwater management, distribution, and consumption planning in the future. Furthermore, to achieve reliable groundwater potential mapping at a wide scale over local districts and villages, the findings should be followed up with more extensive fieldwork and other related investigations.


